overseas shipholding group
TRANSCRIPT

19APR201111291610

21APR201111475795
To Our Shareholders:
2010 proved to be another challenging year for the global tanker industry and for OSG. The lingering effects of therecession, combined with diminished long-haul imports of crude into the United States, produced historically lowfreight rates in all of our vessel classes. As a consequence, we reported a substantial financial loss for the year.
While our financial results were unsatisfactory, I was very pleased with Company-wide efforts to improve theperformance and operating platforms of OSG. Long-term success in a commodity transportation business like oursrequires us to continually take steps to strengthen our business and differentiate ourselves from our competition, andwe must do this in both weak and strong markets. In 2010, rather than sit on our hands waiting for markets torecover, we laid the groundwork for improved financial performance in 2011, with the following accomplishmentsbeing noteworthy:
• We raised $450 million in two capital market transactions that diversified our funding sources, lengthened our debtmaturity profile and increased our financial flexibility;
• We reduced general and administrative expenses by $21 million;
• We contained vessel operating costs while further improving year-over-year safety performance;
• We continued the modernization of our fleet, taking delivery of nine newbuildings and two charters-in while sellingor redelivering four older vessels;
• We progressed our U.S. Flag turn-around plan by taking delivery of two lightering articulated tug barge (ATB)newbuilds (the second in 2011), disposing of four older vessels (including two in 2011) and establishing first moveradvantage in the U.S. Flag shuttle tanker market with the delivery of the Overseas Cascade, which will operate onthe Cascade Field in the ultra deepwater Gulf of Mexico; and
• We completed the extensive conversions of the FSO Africa and FSO Asia, both of which are on contract to MaerskOil Qatar in the Al Shaheen field off Qatar.
Since the onset of the Great Recession, we have refrained from making splashy acquisitions and focused instead onimproving our own house. This has proven to be both prudent and smart, as freight markets remain challenging andship values soft. We are operating in highly uncertain and volatile economic times, so financial discipline and financialflexibility are critical. We run the Company with an abundance of both.
Today we operate a U.S. Flag fleet of 22 vessels and one newbuilding, and a 38-ship international product carrierfleet with four newbuildings delivering this year. We have established leadership positions in both of these marketsegments. At the same time that we grew these two segments, we continued to invest in our world-spanning crudebusiness, still the largest cash generator at OSG. At March 31, 2011, we had 44 crude oil tankers on the water andexpect to take delivery of two VLCCs in 2011 and two Aframaxes in 2013. With our scale, we are one of the biggestoperators of crude oil tankers in the world, with leadership positions through our participation in commercial pools:Tankers International, Aframax International and Panamax International. We also have a nascent but market-outperforming Suezmax business through the Suezmax International commercial pool.
The performance of our sea staff and shore-based technical management staff was outstanding in 2010. We showedimprovements in most of our key performance indicators (KPIs) and we continued to grow our reputation within theindustry as a high quality operator. Not only did we improve our environmental and safety performance, we did so atthe same time that we were significantly reducing shoreside general and administrative expenses (G&A) and keepingshipboard operating costs in check. We are committed to running the safest, cleanest and most reliable fleet in theindustry. This is the key to the long-term value proposition at OSG.

20APR201117154306
No discussion of shipping operations today would be complete without mention of the Deepwater Horizon oil spill inthe Gulf of Mexico. This tragedy reinforced for me the importance to shipping companies of having high quality,in-house technical management. As a result of the spill, we expect additional regulations to be placed on ourindustry. We are ready for this. Over the past five years, we have built and maintained a strong ‘‘Do It Right’’ safetyculture in our fleet in which we never take shortcuts that sacrifice safety and never make economic decisions thatmay increase the risk of accidents or injuries. In fact, when a shuttle tanker was needed in the Gulf to assist with theoil spill cleanup effort, OSG was brought in because we have the modern equipment and, more importantly, theexpertise to perform. They knew they could rely on OSG to do the job.
We entered 2011 with several difficult, high-cost projects behind us—the FSO conversions, which were hampered bydelays, and the U.S. Flag newbuild lightering ATBs, severely impacted by a shipyard bankruptcy. With theestablishment last year of our Technical Services Group and the naming of a Chief Risk Officer, we upgraded ourcapabilities in managing corporate risk and complex projects like the ones referred to above. These were importantsteps in our drive toward flawless execution and sound risk management at OSG.
Our disciplined expense management and G&A expense reduction program has borne fruit and will continue, withfurther reductions in G&A costs budgeted for 2011. I am confident we will succeed in reducing G&A expenses byapproximately $50 million for the three-year period ending December 31, 2011.
Patience has guided our every move the past 30 months. We would like to add more low cost, high-quality vesselsto our fleet, but the combination of stubbornly high asset prices and poor freight markets has thankfully kept us onthe sidelines. The combination of tight financing markets and the difficult tanker markets of the past six months hasstrained the resources of many shipping companies. In this environment, we hope to have our patience rewarded bypicking up quality vessels at attractive prices. By the end of 2011, we will reach a fleet size in our three mainbusinesses where we don’t need to add vessels to maintain our competitive edge, but if we so desire, we can addvessels to these businesses with relatively minor additional overhead cost. However, we will only make incrementalinvestments when good opportunities knock. We will not be chasing assets in this environment.
In conclusion, I would like to thank the employees of OSG, both at sea and on shore, for their efforts to strengthenthe Company and deliver first-class shipping services to our customers. I am proud of the progress achieved in avery challenging tanker market. With expected improving market fundamentals, we anticipate turning OSG’s financialperformance around substantially while continuing to provide safe, reliable, high-quality transportation services to ourclients across the globe.
Morten ArntzenPresident and Chief Executive Officer
April 14, 2011

SECURITIES AND EXCHANGE COMMISSIONWashington, D.C. 20549
FORM 10-K
FOR ANNUAL AND TRANSITION REPORTSPURSUANT TO SECTION 13 OR 15(d) OF THE
SECURITIES EXCHANGE ACT OF 1934(Mark One)
� ANNUAL REPORT PURSUANT TO SECTION 13 OR 15(d) OF THE SECURITIES EXCHANGE ACT OF 1934
For the fiscal year ended December 31, 2010
OR
� TRANSITION REPORT PURSUANT TO SECTION 13 OR 15(d) OF THE SECURITIES EXCHANGE ACT OF 1934
For the Transition Period from to .
Commission File Number 1-6479-1
O V E R S E A S S H I P H O L D I N G G R O U P, I N C.(Exact name of registrant as specified in its charter)
Delaware 13-2637623
(State or other jurisdiction of (I.R.S. Employerincorporation or organization) Identification Number)
666 Third Avenue, New York, New York 10017
(Address of principal executive offices) (Zip Code)
Registrant’s telephone number, including area code: 212-953-4100Securities registered pursuant to Section 12(b) of the Act:
Title of each class Name of each exchange on which registered
Common Stock (par value $1.00 per share) New York Stock Exchange
Securities registered pursuant to Section 12(g) of the Act: NONE
Indicate by check mark if the registrant is a well-known seasoned issuer, as defined in Rule 405 of the Securities Act.Yes � No �
Indicate by check mark if the registrant is not required to file reports pursuant to Section 13 or Section 15(d) of the ExchangeAct. Yes � No �
Indicate by check mark whether the registrant: (1) has filed all reports required to be filed by Section 13 or 15(d) of theSecurities Exchange Act of 1934 during the preceding 12 months (or for such shorter period that the registrant was required tofile such reports), and (2) has been subject to such filing requirements for the past 90 days. Yes � No �
Indicate by check mark whether the registrant has submitted electronically and posted on its corporate Website, if any, everyInteractive Data File required to be submitted and posted pursuant to Rule 405 of Regulation S-T (Section 232.405 of thischapter) during the preceding 12 months (or for such shorter period that the registrant was required to submit and post suchfiles). Yes � No �
Indicate by check mark if disclosure of delinquent filers pursuant to Item 405 of Regulation S-K is not contained herein, and willnot be contained, to the best of registrant’s knowledge, in definitive proxy or information statements incorporated by referencein Part III of this Form 10-K or any amendment to this Form 10-K. �
Indicate by check mark whether the registrant is a large accelerated filer, an accelerated filer, a non-accelerated filer, or asmaller reporting company. See definitions of ‘‘large accelerated filer,’’ ‘‘accelerated filer,’’ and ‘‘smaller reporting company’’ inRule 12b-2 of the Exchange Act. (Check one):
Large accelerated filer � Accelerated filer � Non-accelerated filer � Smaller reportingcompany �(Do not check if a smaller
reporting company)
Indicate by check mark whether the registrant is a shell company (as defined in Rule 12b-2 of the Exchange Act). Yes � No �
The aggregate market value of the Common Stock held by non-affiliates of the registrant on June 30, 2010, the last businessday of the registrant’s most recently completed second quarter, was $997,320,920, based on the closing price of $37.04 pershare on the New York Stock Exchange on that date. (For this purpose, all outstanding shares of Common Stock have beenconsidered held by non-affiliates, other than the shares beneficially owned by directors, officers and certain 5% shareholders ofthe registrant; certain of such persons disclaim that they are affiliates of the registrant.)
As of February 25, 2011, 30,469,469 shares of Common Stock were outstanding.
DOCUMENTS INCORPORATED BY REFERENCE
Portions of the registrant’s definitive proxy statement to be filed by the registrant in connection with its 2011 Annual Meeting ofShareholders are incorporated by reference in Part III.

TABLE OF CONTENTS
Page
PART IItem 1. Business . . . . . . . . . . . . . . . . . . . . . . . . . . . . . . . . . . . . . . . . . . . . . . . . . . . . . . . . . 1
Overview . . . . . . . . . . . . . . . . . . . . . . . . . . . . . . . . . . . . . . . . . . . . . . . . . . . . . . . . . 1Business Strategy . . . . . . . . . . . . . . . . . . . . . . . . . . . . . . . . . . . . . . . . . . . . . . . . . . . 1
Summary of 2010 Events . . . . . . . . . . . . . . . . . . . . . . . . . . . . . . . . . . . . . . . . . . . . . 2Fleet Highlights . . . . . . . . . . . . . . . . . . . . . . . . . . . . . . . . . . . . . . . . . . . . . . . . . . . 3Commercial Pools . . . . . . . . . . . . . . . . . . . . . . . . . . . . . . . . . . . . . . . . . . . . . . . . . . 3Technical Operations . . . . . . . . . . . . . . . . . . . . . . . . . . . . . . . . . . . . . . . . . . . . . . . . 4Commercial Teams . . . . . . . . . . . . . . . . . . . . . . . . . . . . . . . . . . . . . . . . . . . . . . . . . 4Customers . . . . . . . . . . . . . . . . . . . . . . . . . . . . . . . . . . . . . . . . . . . . . . . . . . . . . . . 4Liquidity . . . . . . . . . . . . . . . . . . . . . . . . . . . . . . . . . . . . . . . . . . . . . . . . . . . . . . . . 4Employees . . . . . . . . . . . . . . . . . . . . . . . . . . . . . . . . . . . . . . . . . . . . . . . . . . . . . . 5
Forward-Looking Statements . . . . . . . . . . . . . . . . . . . . . . . . . . . . . . . . . . . . . . . . . . . . 5Operations . . . . . . . . . . . . . . . . . . . . . . . . . . . . . . . . . . . . . . . . . . . . . . . . . . . . . . 5Charter Types . . . . . . . . . . . . . . . . . . . . . . . . . . . . . . . . . . . . . . . . . . . . . . . . . . . . . 7Fleet Summary . . . . . . . . . . . . . . . . . . . . . . . . . . . . . . . . . . . . . . . . . . . . . . . . . . . . 8International Fleet Operations . . . . . . . . . . . . . . . . . . . . . . . . . . . . . . . . . . . . . . . . . . 9U.S. Flag Fleet Operations . . . . . . . . . . . . . . . . . . . . . . . . . . . . . . . . . . . . . . . . . . . . 11Investments in Affiliated Companies . . . . . . . . . . . . . . . . . . . . . . . . . . . . . . . . . . . . . . 12
Competition . . . . . . . . . . . . . . . . . . . . . . . . . . . . . . . . . . . . . . . . . . . . . . . . . . . . . . . 12Environmental and Security Matters Relating to Bulk Shipping . . . . . . . . . . . . . . . . . . . . . . 13
International and U.S. Greenhouse Gas Regulations . . . . . . . . . . . . . . . . . . . . . . . . . . . . 13International Environmental and Safety Restrictions and Regulations . . . . . . . . . . . . . . . . . 14U.S. Environmental and Safety Restrictions and Regulations . . . . . . . . . . . . . . . . . . . . . . 17Security Regulations and Practices . . . . . . . . . . . . . . . . . . . . . . . . . . . . . . . . . . . . . . . 20
Insurance . . . . . . . . . . . . . . . . . . . . . . . . . . . . . . . . . . . . . . . . . . . . . . . . . . . . . . . . . 20Taxation of the Company . . . . . . . . . . . . . . . . . . . . . . . . . . . . . . . . . . . . . . . . . . . . . . . 21Glossary . . . . . . . . . . . . . . . . . . . . . . . . . . . . . . . . . . . . . . . . . . . . . . . . . . . . . . . . . 22Available Information . . . . . . . . . . . . . . . . . . . . . . . . . . . . . . . . . . . . . . . . . . . . . . . . . 25
Item 1A. Risk Factors . . . . . . . . . . . . . . . . . . . . . . . . . . . . . . . . . . . . . . . . . . . . . . . . . . . . . . . 26Item 1B. Unresolved Staff Comments . . . . . . . . . . . . . . . . . . . . . . . . . . . . . . . . . . . . . . . . . . . . . 35Item 2. Properties . . . . . . . . . . . . . . . . . . . . . . . . . . . . . . . . . . . . . . . . . . . . . . . . . . . . . . . . 35Item 3. Legal Proceedings . . . . . . . . . . . . . . . . . . . . . . . . . . . . . . . . . . . . . . . . . . . . . . . . . . . 35
Executive Officers of the Registrant . . . . . . . . . . . . . . . . . . . . . . . . . . . . . . . . . . . . . . . . 35
PART IIItem 5. Market for Registrant’s Common Equity, Related Stockholder Matters and Issuer Purchases of
Equity Securities . . . . . . . . . . . . . . . . . . . . . . . . . . . . . . . . . . . . . . . . . . . . . . . . . . . 36Item 6. Selected Financial Data . . . . . . . . . . . . . . . . . . . . . . . . . . . . . . . . . . . . . . . . . . . . . . . . 38Item 7. Management’s Discussion and Analysis of Financial Condition and Results of Operations . . . . . 39
General . . . . . . . . . . . . . . . . . . . . . . . . . . . . . . . . . . . . . . . . . . . . . . . . . . . . . . . . . . 39Completion of Tender Offer for OSG America L.P . . . . . . . . . . . . . . . . . . . . . . . . . . . . . . . 39Operations . . . . . . . . . . . . . . . . . . . . . . . . . . . . . . . . . . . . . . . . . . . . . . . . . . . . . . . . 39Critical Accounting Policies . . . . . . . . . . . . . . . . . . . . . . . . . . . . . . . . . . . . . . . . . . . . . 48Income from Vessel Operations . . . . . . . . . . . . . . . . . . . . . . . . . . . . . . . . . . . . . . . . . . . 54Equity in Income of Affiliated Companies . . . . . . . . . . . . . . . . . . . . . . . . . . . . . . . . . . . . 60Interest Expense . . . . . . . . . . . . . . . . . . . . . . . . . . . . . . . . . . . . . . . . . . . . . . . . . . . . 61Income Tax Provision/(Benefit) . . . . . . . . . . . . . . . . . . . . . . . . . . . . . . . . . . . . . . . . . . . 62EBITDA . . . . . . . . . . . . . . . . . . . . . . . . . . . . . . . . . . . . . . . . . . . . . . . . . . . . . . . . . . 62Effects of Inflation . . . . . . . . . . . . . . . . . . . . . . . . . . . . . . . . . . . . . . . . . . . . . . . . . . . 63Liquidity and Sources of Capital . . . . . . . . . . . . . . . . . . . . . . . . . . . . . . . . . . . . . . . . . . 63Risk Management . . . . . . . . . . . . . . . . . . . . . . . . . . . . . . . . . . . . . . . . . . . . . . . . . . . 67Interest Rate Sensitivity . . . . . . . . . . . . . . . . . . . . . . . . . . . . . . . . . . . . . . . . . . . . . . . . 68
i

Page
Item 7A. Quantitative and Qualitative Disclosures about Market Risk . . . . . . . . . . . . . . . . . . . . . . . . 69Item 8. Financial Statements and Supplementary Data . . . . . . . . . . . . . . . . . . . . . . . . . . . . . . . . . 69
Management’s Report on Internal Controls over Financial Reporting . . . . . . . . . . . . . . . . . . . 111Item 9. Changes in and Disagreements with Accountants on Accounting and Financial Disclosure . . . . 112Item 9A. Controls and Procedures . . . . . . . . . . . . . . . . . . . . . . . . . . . . . . . . . . . . . . . . . . . . . . . 112Item 9B. Other Information . . . . . . . . . . . . . . . . . . . . . . . . . . . . . . . . . . . . . . . . . . . . . . . . . . . . 112
PART IIIItem 10. Directors, Executive Officers and Corporate Governance . . . . . . . . . . . . . . . . . . . . . . . . . . 113Item 11. Executive Compensation . . . . . . . . . . . . . . . . . . . . . . . . . . . . . . . . . . . . . . . . . . . . . . . 113Item 12. Security Ownership of Certain Beneficial Owners and Management and Related Stockholder
Matters . . . . . . . . . . . . . . . . . . . . . . . . . . . . . . . . . . . . . . . . . . . . . . . . . . . . . . . . . 113Item 13. Certain Relationships and Related Transactions . . . . . . . . . . . . . . . . . . . . . . . . . . . . . . . . 113Item 14. Principal Accounting Fees and Services . . . . . . . . . . . . . . . . . . . . . . . . . . . . . . . . . . . . . 113
PART IVItem 15. Exhibits, Financial Statement Schedules . . . . . . . . . . . . . . . . . . . . . . . . . . . . . . . . . . . . . 114Signatures . . . . . . . . . . . . . . . . . . . . . . . . . . . . . . . . . . . . . . . . . . . . . . . . . . . . . . . . . . . . . . . . . 119
ii
PART I
ITEM 1. BUSINESS
OVERVIEWOverseas Shipholding Group, Inc. (‘‘OSG’’ or the ‘‘Company’’) is one of the world’s leading tanker companiesengaged primarily in the ocean transportation of crude oil and petroleum products. At December 31, 2010, theCompany owned or operated a modern fleet of 111 vessels (aggregating 11.3 million deadweight tons and 864,800cubic meters) of which 88 vessels operated in the international market and 23 operated in the U.S. Flag market.OSG’s newbuilding program of owned and chartered-in vessels totaled 11 International and U.S. Flag vessels,bringing the Company’s total owned, operated and newbuild fleet to 122 vessels.
The Company’s vessel operations are organized into strategic business units and focused on broad marketsegments: crude oil, refined petroleum products, and U.S. Flag. The International Flag Crude Tanker unit managesInternational Flag ULCC, VLCC, Suezmax, Aframax, Panamax and Lightering tankers; the International Flag ProductCarrier unit principally manages LR1 and MR product carriers and the U.S. unit manages most of the Company’sU.S. Flag vessels. Through joint venture partnerships, the Company operates four LNG carriers and two FloatingStorage and Offloading (‘‘FSO’’) service vessels. Dedicated chartering and commercial personnel manage specificfleets while the Company’s technical ship management operations and corporate departments support theCompany’s global operations.
OSG generally charters its vessels to customers either for specific voyages at spot rates or for specific periods oftime at fixed daily amounts. Spot market rates are highly volatile, while time and bareboat charter rates, because theyare fixed for specific periods of time, provide a more predictable stream of Time Charter Equivalent revenues (‘‘TCE’’revenues). For a more detailed discussion on factors influencing spot and time charter markets, see Operations—Charter Types later in this section.
A glossary of shipping terms (the ‘‘Glossary’’) that should be used as a reference when reading this Annual Report onForm 10-K can be found later in Item 1. Capitalized terms that are used in this Annual Report are either defined whenthey are first used or in the Glossary.
BUSINESS STRATEGYOSG is committed to providing safe, reliable transportation services to its customers while ensuring the safety of itscrews, vessels and the environment. The Company is also committed to creating long-term shareholder value byexecuting on a growth strategy designed to diversify its revenue sources across its chosen sectors and therebymaximize returns and reduce risk over shipping cycles. OSG’s growth strategy is focused on four elements:
• Sector LeadershipOSG seeks to maintain or achieve market leading positions in each of the primary markets it operates: crude oil,products and U.S. Flag. The Company has expanded its fleet through organic growth and acquisitions ofcompanies that have expanded its market presence, the scale of its fleet and service offerings.
• Fleet OptimizationThe Company believes that it can improve returns in any shipping cycle by taking a portfolio approach tomanaging its business. This approach includes operating a diverse set of vessels that trade in different markets;participating in commercial pools that maximize vessel utilization; managing a fleet of owned and chartered-intonnage that provides for flexibility and optionality; and trading its fleet in both the spot and time charter marketsto enhance returns.
• Superior Technical Ship ManagementOSG is committed to operational excellence across its fleet. The Company’s high-quality, modern fleet is operatedby experienced crews supported by skilled shore side personnel. OSG’s Safety Management System (‘‘SMS’’) isdesigned to ensure that operational practices and procedures are standardized fleet wide and those seafarers andvessel operations meet or exceed all applicable safety, regulatory and environmental standards established byInternational and U.S. maritime laws. For more information, see Technical Operations later in this section.
• Financial FlexibilityThe Company believes its strong balance sheet, ample liquidity, proven access to the capital markets and asignificant unencumbered asset base provide significant financial flexibility. OSG has been able to access
2010 Annual Report 1

substantial amounts of debt capital on an unsecured basis in both the bank and public debt markets, therebyreducing its issuance of secured debt, which typically has collateral maintenance requirements. This financialflexibility permits the Company to pursue attractive business opportunities.
Summary of 2010 EventsOSG’s growth strategy seeks to balance the expansion and renewal of its fleet across multiple market segments andmanage the mix of owned and chartered-in assets. Chartering-in vessels gives the Company greater flexibility in bothcontracting and expanding markets through an ability to exercise redelivery, purchase or charter extension options.Sale and leaseback transactions not only raise cash that can be redeployed or reinvested, but shift risk, providing forgreater flexibility in uncertain market conditions.
Fleet ExpansionIn 2010, OSG took delivery of eleven vessels.
• In the Crude Oil segment, one 297,000 dwt owned VLCC, the Overseas Everest, delivered.
• In the Products segment, six MR vessels delivered. The MRs included the Overseas Mykonos and OverseasSantorini, both 52,000 dwt owned newbuilds, the Aegean Wave (50,000 dwt), the Adriatic Wave (51,000 dwt) andthe Carina (47,000 dwt newbuild), which were all time chartered-in for eight years, and the 50,000 dwt newbuildOverseas Kythnos, which was initially chartered-in on a bareboat basis for five years, but subsequently purchasedin October 2010.
• In the U.S. segment, three product carriers and one articulated tug barge (ATB) delivered. The three U.S. Flagproduct carriers were the Overseas Anacortes, Overseas Martinez and Overseas Chinook, all 46,800 dwt vessels.The Overseas Anacortes and Overseas Martinez are bareboat chartered-in for five years with OSG havingextension options for the life of the vessels. The Overseas Chinook is owned and is currently being converted to ashuttle tanker. The OSG Vision/OSG 350, a 45,600 dwt owned lightering ATB delivered in March 2010. In addition,the Overseas Cascade, which was originally delivered in December 2009, completed conversion to a shuttle tankerin March 2010 and commenced a five-year time charter in the ultra-deepwater U.S. Gulf, a Jones Act trade.
Active Asset ManagementOSG’s active asset management strategy seeks to enhance returns by timing the acquisition and disposition ofvessels and by managing the mix of its owned and chartered-in fleet. In strong markets where asset values rise, theCompany may emphasize chartering-in over ownership due to a lower implicit cost of capital. Similarly, sale andleaseback transactions provide an opportunity to capitalize on rising asset values while maintaining control of anasset. Leaseback terms can offer extension and purchase options, providing flexibility in volatile markets as well astransferring residual risk to third parties. In declining market conditions where asset values are falling, the Companymay seek to increase its ownership of vessels.
Sale TransactionsDuring 2010, the Company sold three owned U.S. Flag vessels, the Overseas Philadephia, Overseas Diligence andOverseas Galena Bay, and one chartered-in International Flag Aframax, the Sabine, a chartered-in lightering vessel inwhich the Company had a residual value interest. These transactions generated total proceeds of $14.9 million.
RedeliveriesThe Crude Oil segment redelivered two time chartered-in Aframaxes during the year, the Mare Salernum and Action.The Company had less than 100% interests in the Mare Salernum and Action.
Changes to Charter-in Obligations and Orderbook ModificationsOSG actively managed its products orderbook over the past two years by negotiating price reductions, vessel swapsand modified delivery dates. In connection with these efforts:
• During the first quarter of 2010, OSG reached an agreement with Cido Tanker Holding Co., a privately heldshipping company, to cancel two newbuild MR product carriers that were time chartered-in for seven years andscheduled to deliver in the first quarter of 2011. In exchange, OSG agreed to time charter-in the Aegean Wave andthe Adriatic Wave, both 2009-built MR product carriers at lower rates, for periods of eight years (see FleetExpansion section above).
2 Overseas Shipholding Group, Inc.
• In October 2010, the Company finalized amendments to certain construction contracts, the result of which was toreplace contracts for two LR1s with scheduled delivery dates in 2011 with two crude Aframaxes slated to deliver in2013. These amendments increased the Company’s remaining construction commitments by approximately$4.5 million, but deferred $70 million of construction commitments from 2011 into 2012 and 2013.
Commercial Pool ActivityA new pool partner, the Dr. Peters Group, joined the Company’s Aframax International pool during the third quarter of2010 and has entered two vessels into the pool as of December 31, 2010.
In December 2010, the Suezmax International pool entered into one-year time charter-in agreements for twoadditional Suezmax tankers. The vessels were delivered to the pool in January 2011.
Two new pool partners joined the Company’s Clean Products International pool during 2010. Koenig & Cie joined thepool by adding one vessel in the third quarter. Mitsui O.S.K. entered one vessel in the third quarter and an additionalvessel in the fourth quarter of 2010.
Financial Strength and StabilityThe Company strengthened its capital structure by raising approximately $450 million during the first quarter of 2010.In doing so, the Company diversified its lending sources, lengthened its average debt maturity and gained greaterflexibility for future investment and expansion opportunities.
• In March 2010, the Company completed the sale of 3.5 million shares of common stock at $45.33 per share andreceived proceeds of $158.3 million, net of issuance costs.
• Also in March 2010, the Company issued $300 million of senior unsecured notes due 2018 with a coupon of8.125%. The Company received proceeds of approximately $289.7 million after deducting underwriting discounts,commissions and other expenses.
Proceeds from these transactions were used to reduce the outstanding indebtedness under the Company’sunsecured revolving credit facility and for working capital purposes.
Fleet HighlightsAs of December 31, 2010, OSG’s owned, operated and newbuild fleet aggregated 122 vessels. Of this total, 95vessels are International Flag and 27 vessels are U.S. Flag. The Marshall Islands is the principal flag of registry of theCompany’s International Flag vessels. At a time when customers are demonstrating a clear preference for moderntonnage based on concerns about the environmental risks associated with older vessels, all but one of OSG’sInternational Flag fleet is double hull. The one single hull vessel is on a charter-in that expires in August 2011. Inaddition, the U.S. Flag fleet is fully double-hulled with the exception of two tankers, both of which are currently undercontract of sale and expected to be delivered to buyers in the first half of 2011.
Additional information about the Company’s fleet, including its ownership profile, is set forth below underOperations—Fleet Summary, as well as on the Company’s website, www.osg.com.
Commercial PoolsTo increase vessel utilization and thereby revenues, the Company participates in Commercial Pools with otherlike-minded shipowners of similar modern, well-maintained vessels. By operating a large number of vessels as anintegrated transportation system, Commercial Pools offer customers greater flexibility and a higher level of servicewhile achieving scheduling efficiencies. Pools consist of experienced commercial owners and operators, whiletechnical management is performed by each shipowner. Pools negotiate charters with customers primarily in the spotmarket. The size and scope of these pools enable them to enhance utilization for pool vessels by securing backhaulvoyages and Contracts of Affreightment (‘‘COAs’’) and reduce waiting time, thus generating higher effective TCErevenues than otherwise might be obtainable in the spot market while providing a higher level of service tocustomers. As of December 31, 2010, OSG participates in five pools: Tankers International (‘‘TI’’), AframaxInternational (‘‘AI’’), Panamax International (‘‘PI’’), Clean Products International (‘‘CPI’’) and Suezmax International(‘‘SI’’). For more information on the pools, see Operations—International Fleet Operations.
2010 Annual Report 3
Technical OperationsOSG’s global fleet operations are managed on an integrated basis by segment: crude, products and U.S. Flag. Inaddition to regular maintenance and repair, crews onboard each vessel and shore side personnel are responsible forensuring that the Company’s fleet meets or exceeds regulatory standards established by the International MaritimeOrganization (‘‘IMO’’) and U.S. Coast Guard, including SOLAS (the International Convention for the Safety of Life atSea) and MARPOL (the International Convention for the Prevention of Pollution from Ships).
The Company is committed to providing safe, reliable and environmentally sound transportation to its customers.Integral to meeting standards mandated by worldwide regulators, customers and OSG is the Company’s SMS. TheSMS is a framework of processes and procedures that addresses a spectrum of operational risks associated withquality, environment, health and safety. The SMS is certified by ISM (International Safety Management Code),ISO 9001 (Quality Management) and ISO 14001 (Environmental Management).
The Company recruits, hires and trains the crews on its vessels and believes that the quality of its senior officers,crew and shore side support personnel provide it with a competitive advantage. OSG’s mandatory training andeducation requirements exceed the IMO Standards of Training, Certification and Watchkeeping (STCW). In early 2009,OSG completed the installation of an integrated engine room and bridge simulator, located in its Manila office. In2010, a cargo handling simulator was added. These simulators are to familiarize OSG engine and deck officers withcorrect procedures and to respond effectively when faced with unusual or unexpected situations. OSG believes itsability to provide professional development and long-term employment opportunities for qualified crew arecompetitive advantages in a market where skilled labor shortages are expected to remain a challenge. In 2010, bothInternational and U.S. Flag crew retention was greater than 95%.
The fleet is supported by shore side operations that include fleet managers, marine and technical superintendents,purchasing staff, security officers, crewing and training personnel and a safety, quality and environmental (‘‘SQE’’)department. Further augmenting technical operations are assurance functions that conduct vessel audits and assurecompliance with marine and environmental regulations and manage preparedness for emergency response. OSG hasan Open Reporting system whereby seafarers can anonymously report possible violations of Company policies andprocedures. All open reports are investigated and appropriate actions are taken as needed. Furthermore, theCompany’s Vice President, Marine Operations Assurance and Response has independent oversight of fleet-widevessel operating practices and procedures and global training programs.
Commercial TeamsOSG’s commercial teams based in offices in Houston, London, Montreal, New York, Singapore, Newark (Delaware)and Tampa enable customers to have access, at all times, to information about their cargo’s position and status. TheCompany believes that the scale of its fleet, its commercial management skills and its extensive market knowledgeallow it to achieve better rates than smaller, independent shipowners on a consistent basis. OSG’s strong reputationin the marketplace is the result of longstanding relationships with its customers and business partners.
CustomersOSG’s customers include major independent and state-owned oil companies, oil traders, refinery operators and U.S.and international government entities. The Company believes that it distinguishes itself in the shipping marketthrough an emphasis on service, safety and reliability and its ability to maintain and grow long-term customerrelationships.
LiquidityThe Company believes that the strength of its balance sheet, and the financial flexibility that it affords, distinguishes itfrom many of its competitors. In 2010, total equity decreased by $57.7 million to $1.8 billion. The change reflects the2010 loss and an increase in the unrealized hedging expense of $17.2 million related to derivatives that areaccounted for as cash flow hedges, offset by the net proceeds of $158.3 million raised in March 2010 through theissuance of 3.5 million shares of common stock. Liquidity, including undrawn bank facilities, was approximately$1.3 billion at December 31, 2010.
Liquidity adjusted debt to capital was 48.0% at December 31, 2010, compared with 40.1% as of December 31,2009. For this purpose, liquidity adjusted debt is defined as long-term debt reduced by cash, short-term investmentsand the balance in the Capital Construction Fund.
4 Overseas Shipholding Group, Inc.

EmployeesAs of December 31, 2010, the Company had approximately 3,500 employees comprised of 3,050 seagoing personneland 450 shore side staff. The Company has collective bargaining agreements with three different U.S. maritimeunions covering 667 seagoing personnel employed on the Company’s U.S. Flag vessels. These agreements are ineffect for periods ending between March 2011 and June 2015. Under the collective bargaining agreements, theCompany is obligated to make contributions to pension and other welfare programs. The Company also hascollective bargaining agreements with seven other maritime unions covering 2,270 seagoing personnel employed onthe Company’s International Flag vessels. These agreements are in effect through December 2011. OSG believes thatit has a satisfactory relationship with its employees.
FORWARD-LOOKING STATEMENTSThis Form 10-K contains forward looking statements regarding the outlook for tanker and articulated tug/bargemarkets, and the Company’s prospects, including prospects for certain strategic alliances and investments. Allstatements other than statements of historical facts should be considered forward-looking statements. There are anumber of factors, risks and uncertainties, many of which are beyond the control of the Company, that could causeactual results to differ materially from the expectations expressed or implied in these forward looking statements,including changes in production of or demand for oil and petroleum products, either globally or in particular regions;greater than anticipated levels of newbuilding orders or less than anticipated rates of scrapping of older vessels;changes in trading patterns for particular commodities significantly impacting overall tonnage requirements; changesin the global economy and various regional economies; risks incident to vessel operation, including accidents anddischarge of pollutants; unanticipated changes in laws and regulations; increases in costs of operation; drydockingschedules differing from those previously anticipated; the ability of the Company to attract and retain experienced,qualified and skilled crewmembers; changes in credit risk of counterparties, including shipyards, suppliers andfinancial lenders, and of joint venturers, partners and charterers; delays (including failure to deliver) or cost overrunsin the building of new vessels or the conversion of existing vessels for other uses; the cost and availability ofinsurance coverage; the availability to the Company of suitable vessels for acquisition or chartering-in on terms itdeems favorable; changes in the pooling arrangements in which the Company participates, including withdrawal ofparticipants or termination of such arrangements; estimates of future costs and other liabilities for certainenvironmental matters and compliance plans; and projections of the costs needed to develop and implement theCompany’s strategy of being a market leader in the segments in which the Company competes. The Companyassumes no obligation to update or revise any forward looking statements. Forward looking statements in thisForm 10-K and written and oral forward looking statements attributable to the Company or its representatives afterthe date of this Form 10-K are qualified in their entirety by the cautionary statement contained in this paragraph andin other reports hereafter filed by the Company with the Securities and Exchange Commission.
OPERATIONSThe bulk shipping of crude oil and refined petroleum products has many distinct market segments based, in largepart, on the size and design configuration of vessels required and, in some cases, on the flag of registry. Freight ratesin each market segment are determined by a variety of factors affecting the supply and demand for suitable vessels.Tankers, ATBs and Product Carriers are not bound to specific ports or schedules and therefore can respond tomarket opportunities by moving between trades and geographical areas. The Company has established threereportable business segments: International Crude Tankers, International Product Carriers, and U.S. vessels.
2010 Annual Report 5
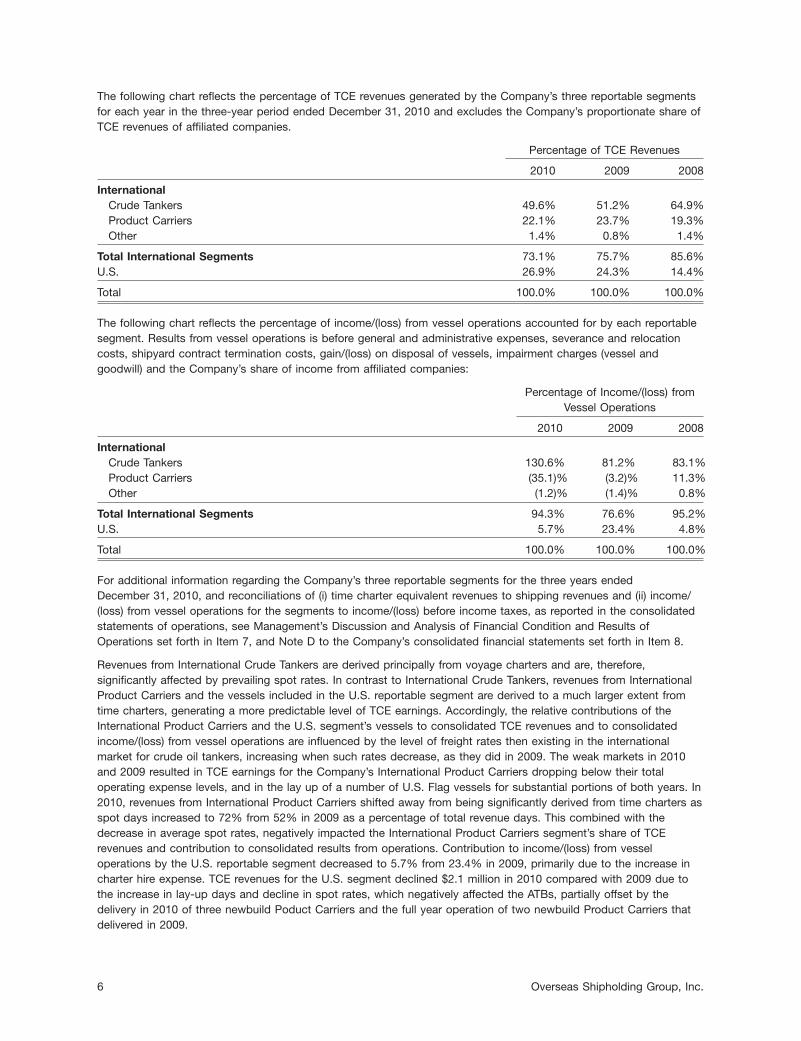
The following chart reflects the percentage of TCE revenues generated by the Company’s three reportable segmentsfor each year in the three-year period ended December 31, 2010 and excludes the Company’s proportionate share ofTCE revenues of affiliated companies.
Percentage of TCE Revenues
2010 2009 2008
InternationalCrude Tankers 49.6% 51.2% 64.9%Product Carriers 22.1% 23.7% 19.3%Other 1.4% 0.8% 1.4%
Total International Segments 73.1% 75.7% 85.6%U.S. 26.9% 24.3% 14.4%
Total 100.0% 100.0% 100.0%
The following chart reflects the percentage of income/(loss) from vessel operations accounted for by each reportablesegment. Results from vessel operations is before general and administrative expenses, severance and relocationcosts, shipyard contract termination costs, gain/(loss) on disposal of vessels, impairment charges (vessel andgoodwill) and the Company’s share of income from affiliated companies:
Percentage of Income/(loss) fromVessel Operations
2010 2009 2008
InternationalCrude Tankers 130.6% 81.2% 83.1%Product Carriers (35.1)% (3.2)% 11.3%Other (1.2)% (1.4)% 0.8%
Total International Segments 94.3% 76.6% 95.2%U.S. 5.7% 23.4% 4.8%
Total 100.0% 100.0% 100.0%
For additional information regarding the Company’s three reportable segments for the three years endedDecember 31, 2010, and reconciliations of (i) time charter equivalent revenues to shipping revenues and (ii) income/(loss) from vessel operations for the segments to income/(loss) before income taxes, as reported in the consolidatedstatements of operations, see Management’s Discussion and Analysis of Financial Condition and Results ofOperations set forth in Item 7, and Note D to the Company’s consolidated financial statements set forth in Item 8.
Revenues from International Crude Tankers are derived principally from voyage charters and are, therefore,significantly affected by prevailing spot rates. In contrast to International Crude Tankers, revenues from InternationalProduct Carriers and the vessels included in the U.S. reportable segment are derived to a much larger extent fromtime charters, generating a more predictable level of TCE earnings. Accordingly, the relative contributions of theInternational Product Carriers and the U.S. segment’s vessels to consolidated TCE revenues and to consolidatedincome/(loss) from vessel operations are influenced by the level of freight rates then existing in the internationalmarket for crude oil tankers, increasing when such rates decrease, as they did in 2009. The weak markets in 2010and 2009 resulted in TCE earnings for the Company’s International Product Carriers dropping below their totaloperating expense levels, and in the lay up of a number of U.S. Flag vessels for substantial portions of both years. In2010, revenues from International Product Carriers shifted away from being significantly derived from time charters asspot days increased to 72% from 52% in 2009 as a percentage of total revenue days. This combined with thedecrease in average spot rates, negatively impacted the International Product Carriers segment’s share of TCErevenues and contribution to consolidated results from operations. Contribution to income/(loss) from vesseloperations by the U.S. reportable segment decreased to 5.7% from 23.4% in 2009, primarily due to the increase incharter hire expense. TCE revenues for the U.S. segment declined $2.1 million in 2010 compared with 2009 due tothe increase in lay-up days and decline in spot rates, which negatively affected the ATBs, partially offset by thedelivery in 2010 of three newbuild Poduct Carriers and the full year operation of two newbuild Product Carriers thatdelivered in 2009.
6 Overseas Shipholding Group, Inc.
Charter TypesThe Company believes that by balancing the mix of TCE revenues generated by voyage charters and time charters,the Company is able to maximize its financial performance throughout shipping cycles.
Spot MarketVoyage charters, including vessels operating in Commercial Pools that predominantly operate in the spot market,constituted 64% of the Company’s TCE revenues in 2010, 49% in 2009 and 65% in 2008. The above information isbased, in part, on information provided by the pools or commercial ventures in which OSG participates. Accordingly,the Company’s shipping revenues are significantly affected by prevailing spot rates for voyage charters in the marketsin which the Company’s vessels operate. Spot market rates are highly volatile. Rates are determined by marketforces such as local and worldwide demand for the commodities carried (such as crude oil or petroleum products),volumes of trade, distances that the commodities must be transported, and the amount of available tonnage both atthe time such tonnage is required and over the period of projected use and the levels of seaborne and shore-basedinventories of crude oil and refined products. Seasonal trends often greatly affect world oil consumption andconsequently vessel demand. While trends in consumption vary with seasons, peaks in demand quite often precedeseasonal consumption peaks as refiners and suppliers try to anticipate consumer demand. Seasonal peaks in oildemand have been principally driven by increased demand prior to Northern Hemisphere winters, as heating oilconsumption increases, and increased demand for gasoline prior to the summer driving season in the U.S. Availabletonnage is affected over time, by the volume of newbuilding deliveries, the number of tankers used to store cleanproducts and crude oil, and the removal (principally through scrapping or conversion) of existing vessels from service.Scrapping is affected by the level of freight rates, by the level of scrap prices, by vessel vetting standards establishedby charterers and terminals and by international and U.S. governmental regulations that require the maintenance ofvessels within certain standards and mandate the retirement of vessels lacking double hulls.
Time and Bareboat Charter MarketThe Company’s U.S. Flag fleet, its International Flag Product Carrier fleet, the LNG fleet and the two FSOs include anumber of vessels that operate on time charters, providing a predictable level of revenues, which is not subject tofluctuations inherent in spot-market rates. During the three years ended December 31, 2010, the Company enteredinto Forward Freight Agreements (‘‘FFAs’’) and related bunker swaps as hedges for reducing the volatility of earningsfrom operating the Company’s VLCCs in the spot market. These derivative instruments seek to create synthetic timecharters. The impact of these derivatives, which qualify for hedge accounting treatment, is reported together withtime charters in the physical market. Time and bareboat charters constituted 36% of the Company’s TCE revenues in2010, 51% in 2009 and 35% in 2008. Because of the depressed markets in 2010 and 2009, the Company has beenunable to replace expiring term business at comparable levels. Although medium-term time charters are available inthe Product Carrier markets, management has not deemed the rates offered by charterers to be sufficiently attractiveto warrant concluding such business.
2010 Annual Report 7

Fleet SummaryAs of December 31, 2010, OSG’s International Flag and U.S. Flag operating fleet consisted of 111 vessels, 57% ofwhich were owned, with the remaining vessels bareboat or time chartered-in. Vessels chartered-in may be BareboatCharters (where OSG is responsible for all Vessel Expenses) or Time Charters (where the shipowners pay VesselExpenses).
Vessels Owned Vessels Chartered-in Total at December 31, 2010
VesselsWeighted by Weighted by Total Weighted by
Vessel Type Number Ownership Number Ownership Vessels Ownership Total Dwt
Operating FleetFSO 2 1.0 — — 2 1.0 864,046VLCC and ULCC 9 9.0 6 6.0 15 15.0 4,727,398Suezmax — — 2 2.0 2 2.0 317,000Aframax 6 6.0 6 5.5 12 11.5 1,344,470Panamax 9 9.0 — — 9 9.0 626,834Lightering 2 2.0 4 3.5 6 5.5 563,663
International Flag Crude Tankers 28 27.0 18 17.0 46 44.0 8,443,411LR2 — — 1 1.0 1 1.0 104,024LR1 2 2.0 2 2.0 4 4.0 297,374MR (1) 14 14.0 18 18.0 32 32.0 1,531,960
International Flag Product Carriers 16 16.0 21 21.0 37 37.0 1,933,358Car Carrier 1 1.0 — — 1 1.0 16,101
Total Int’l Flag Operating Fleet 45 44.0 39 38.0 84 82.0 10,392,870
Handysize Product Carriers (2,3) 4 4.0 9 9.0 13 13.0 608,623Clean ATBs (2) 6 6.0 — — 6 6.0 173,702Lightering ATBs 4 4.0 — — 4 4.0 151,980
Total U.S. Flag Operating Fleet 14 14.0 9 9.0 23 23.0 934,305
LNG Fleet 4 2.0 — — 4 2.0 864,800cbm
Total Operating Fleet 63 60.0 48 47.0 111 107.0 11,327,175864,800cbm
Newbuild/Conversion FleetInternational Flag
VLCC 2 2.0 — — 2 2.0 596,000Aframax 2 2.0 — — 2 2.0 226,000LR1 2 2.0 — — 2 2.0 147,000MR 2 2.0 — — 2 2.0 100,000Chemical Tankers — — 1 1.0 1 1.0 19,900
U.S. FlagProduct Carriers — — 1 1.0 1 1.0 46,815Lightering ATBs 1 1.0 — — 1 1.0 45,556
Total Newbuild Fleet 9 9.0 2 2.0 11 11.0 1,181,271
Total Operating & Newbuild Fleet 72 69.0 50 49.0 122 118.0 12,508,446864,800 cbm
(1) Includes two owned U.S. Flag Product Carriers that trade internationally, thus associated revenue is included in the Product Carriersegment.
(2) Includes the Overseas New Orleans, the Overseas Puget Sound and the OSG 214, which were in lay-up at December 31, 2010.
(3) Includes one shuttle tanker, the Overseas Cascade, and the Overseas Chinook, which is undergoing conversion to a shuttle tanker atDecember 31, 2010.
8 Overseas Shipholding Group, Inc.

Newbuild Delivery Schedule as of December 31, 2010
Year/Segment Q1 Q2 Q3 Q4 Total
2011Crude — 1 — 1 2Products — 3 2 — 5U.S. Flag 1 1 — — 2
Total 1 5 2 1 9
2013Crude 1 — 1 — 2Products — — — — —U.S. Flag — — — — —
Total 1 — 1 — 2
TOTAL 11
International Fleet Operations
Crude Oil TankersOSG’s crude oil fleet is comprised of all major crude oil vessel classes and includes a fleet of six International Flaglightering vessels that trade primarily in the U.S. Gulf of Mexico. In order to enhance vessel utilization and TCErevenues, the Company has placed its ULCC, VLCC, Suexmax, Aframax tankers as well as a number of Panamaxtankers into Commercial Pools that are responsible for the Commercial Management of these vessels. The poolscollect revenue from customers, pay voyage-related expenses, and distribute TCE revenues to the participants, afterdeducting administrative fees, according to formulas based upon the relative carrying capacity, speed, and fuelconsumption of each vessel.
• Tankers International—Tankers International was formed in December 1999 by OSG and other leading tankercompanies in order to pool the commercial operation of their modern VLCC fleets. As of December 31, 2010,Tankers International had seven participants and managed a fleet of 45 modern VLCCs and ULCCs that tradethroughout the world, including all 15 of the Company’s ULCC and VLCC owned and chartered-in vessels.
Tankers International performs the Commercial Management of its participants’ vessels. The large number ofvessels managed by Tankers International gives it the ability to enhance vessel utilization through backhaul cargoesand COAs, thereby generating greater TCE revenues. In recent years, crude oil shipments from West Africa to Asiahave expanded, increasing opportunities for vessels otherwise returning in ballast (i.e., without cargo) from Europeand North America to load cargoes in West Africa for delivery in Asia. Although the number of shipments from theMiddle East to Western destinations declined in 2010, such combination voyages are used to maximize vesselutilization by minimizing the distance vessels travel in ballast.
By consolidating the Commercial Management of its substantial fleet, Tankers International is able to offer itscustomers access to a large fleet of high-quality VLCCs and ULCCs. The size of its fleet enables TankersInternational to become the logistics partner of major customers by helping them better manage their shippingprograms, inventories and risk.
• Suezmax International—Suezmax International was formed in June 2008 and is currently managed by theCompany. As of December 31, 2010, the pool had two participants and provides the Commercial Management fora fleet of four vessels, including the Company’s two chartered-in vessels, which primarily trade in the AtlanticBasin.
• Aframax International—Since 1996, the Company and PDV Marina S.A., the marine transportation subsidiary of theVenezuelan state-owned oil company, have pooled the Commercial Management of their Aframax fleets. As ofDecember 31, 2010, there were 13 participants in Aframax International and the pool Commercially Managed46 vessels, including 11 (10.5 weighted by ownership) of the Company’s owned and chartered-in vessels. AframaxInternational’s vessels generally trade in the Atlantic Basin, North Sea and the Mediterranean. The AframaxInternational pool has been able to enhance vessel utilization with backhaul cargoes and COAs, thereby generatinghigher TCE revenues than would otherwise be attainable in the spot market.
2010 Annual Report 9

• Panamax International—Panamax International was formed in April 2004 and provides the CommercialManagement of the Panamax fleets of its three participants. As of December 31, 2010, Panamax Internationalmanaged a fleet of 24 modern Panamaxes, which includes five of the Company’s owned crude Panamaxes andthree of its owned Panamax Product Carriers (LR1s), as well as three crude Panamaxes that are time chartered toone of the pool partners.
Product CarriersInternational Product Carriers constitutes one of the Company’s reportable business segments and is made up of aprimarily International Flag fleet that transport refined petroleum products worldwide. In late 2010, the Companymoved the commercial management of its LNG fleet, which had been managed as a separate business unit, to theCompany’s International Product Carrier and Gas strategic business unit. The products fleet, consisting of 32 MRproduct carriers (including two U.S. Flag vessels trading internationally), four LR1s and one LR2 (which redelivered inJanuary 2011), gives OSG the ability to provide a broad range of services to global customers. Refined petroleumproduct cargoes are transported from refineries to consuming markets characterized by both long- and short-haulroutes. The market is driven by global refinery capacity, changes in consumer demand and product specificationsand cargo arbitrage opportunities. By expanding a core fleet of MR Product Carriers, OSG has grown revenues in amarket sector with more predictable earnings characteristics.
In contrast to the crude oil tanker market, the refined petroleum trades are more complex due to the diverse natureof product cargoes, which include gasoline, diesel, jet fuel, home heating oil, vegetable oils and organic chemicals(e.g., methanol and ethylene glycols). The trades require crews to have specialized certifications. Customer vettingrequirements can be more rigorous and, in general, vessel operations are more complex due to the fact that refineriescan be in closer proximity to importing nations, resulting in more frequent port calls and discharging, cleaning andloading operations than crude oil tankers.
OSG has opportunistically expanded its commercial footprint in the Product Carrier segment through acquisitions,newbuildings, chartering-in vessels and commercial alliances.
• OSG trades eight of its MR Product Carriers, including two that are time chartered to other pool participants, in theClean Products International Pool, a regional Commercial Pool formed in 2006 with the Ultragas Group. As ofDecember 31, 2010, the pool had five participants. The pool is comprised of 15 vessels and concentrates ontriangulation trades in the Atlantic Basin.
• Since 2005, OSG has ordered or chartered-in from third parties 21 MRs and six LR1s. Delivery of these vesselsbegan in 2006 and will continue through 2011. These vessels are an important part of the business unit’s strategyto modernize and expand its fleet, and offset redeliveries of older, chartered-in Handysize vessels in 2008and 2009. Of the Product Carrier newbuild program, all except one of the MRs will be IMO III compliant, allowingfor increased flexibility when switching between cargo grades.
• Two U.S. Flag vessels that participate in the U.S. government’s Maritime Security Program, the Overseas Maremarand the Overseas Luxmar, are included in the International Product Carrier unit. For detailed information on theMaritime Security Program, see U.S. Flag Fleet Operations, Maritime Security Program later in this section. TheOverseas Ambermar also participated in the U.S. government’s Maritime Security Program, but ceased suchparticipation in September 2008 and was reflagged under Marshall Islands Flag.
The expansion into the gas market enhanced the Company’s fixed revenue and earnings base, since the LNGmarkets are characterized by long-term time charters. The joint venture between the Company and Qatar GasTransport Company Limited (Nakilat) in which OSG has a 49.9% interest, owns four 216,000 cbm LNG Carriers.Qatar Liquefied Gas Company Limited (II) has time chartered the LNG Carriers for twenty-five years beginning from2007 or 2008, with options to extend. The Company provides Technical Management for these state-of-the-artvessels. For more information about the financing of the LNG Carriers, which is non recourse to the Company, seeNote F to the consolidated financial statements set forth in Item 8.
Shortly after committing to the LNG newbuildings, the Company entered into a joint venture with TransCanada CNGTechnologies Ltd. to develop the transportation of compressed natural gas (CNG) from stranded fields. Since OSGstarted these efforts, natural gas prices have suffered intense pressure as incremental gas production has come online, particularly from shale gas in the U.S. These events slowed the development of CNG projects. Consequently,OSG has decided to halt its investment in the CNG arena.
10 Overseas Shipholding Group, Inc.
U.S. Flag Fleet OperationsOSG is one of the largest commercial owners and operators of Jones Act vessels. The Company’s U.S. Flag Fleethas expanded significantly since 2004 and today consists of 25 owned, operated and newbuild Handysize ProductCarriers and ATBs. As a U.S.-based company, OSG is uniquely positioned to participate in the U.S. Jones Actshipping market, a trade that is not available to its foreign-based competitors. Under the Jones Act, shippingbetween U.S. ports, including the movement of Alaskan crude oil to U.S. ports, is reserved for U.S. Flag vessels thatare built in the U.S. and owned by U.S. companies more than 75% owned and controlled by U.S. citizens. The JonesAct regulations, coupled with tax law changes in the American Jobs Creation Act of 2004, have provided theopportunity for OSG to significantly invest in and expand its U.S. Fleet business.
• ATBs—In November 2006, OSG acquired Maritrans Inc., a leading U.S. Flag crude oil and petroleum productshipping company that owned and operated one of the largest fleets of double hull Jones Act vessels serving theEast and U.S. Gulf coastwise trades. This strategic acquisition gave OSG a presence in all major U.S. tradingroutes; intra U.S. Gulf, U.S. Gulf to the East Coast, U.S. Gulf to the West Coast, the Alaskan North Slope tradesand the Delaware Bay. In addition, the acquisition provided for a qualifying use of OSG’s Capital ConstructionFund, the acquisition of construction contracts for ATBs for lightering services in Delaware Bay.
• Jones Act Product Carrier Newbuilds—In June 2005, OSG signed agreements to bareboat charter-in 10 Jones ActProduct Carriers to be constructed by Aker Philadelphia Shipyard, Inc. and in October 2007, the order was furtherexpanded by an additional two sister ships. The unique market dynamic of a declining Jones Act single hull fleet inthe U.S. as a result of the U.S. Oil Pollution Act of 1990 (‘‘OPA 90’’), coupled with the expected growth in demandby U.S. consumers for crude oil and petroleum products transported by sea, served as the basis for OSG placingthe series order for the Product Carriers prior to securing employment for the vessels. OSG chartered-in ten of thetwelve vessels for initial terms of five to ten years commencing on delivery of each vessel and purchased the othertwo for conversion to shuttle tankers. The Company has extension options for the lives of the chartered-in vessels.As of December 31, 2010, OSG has time charters-out for 11 of these 12 vessels. Eleven of the vessels deliveredprior to December 31, 2010. The remaining vessel under construction should deliver in the first half of 2011.
• Alaskan North Slope Trade—OSG has a significant presence in the Alaskan North Slope trade through its 37.5%equity interest in Alaska Tanker Company, LLC (‘‘ATC’’), a joint venture that was formed in 1999 among OSG,BP plc. (‘‘BP’’) and Keystone Shipping Company (‘‘Keystone’’) to support BP’s Alaskan crude oil transportationrequirements. The Company’s participation in ATC provides it with the ability to earn additional income (incentivehire) based upon ATC’s meeting certain predetermined performance standards. Such income, which is included inequity in income of affiliated companies, amounted to $4.4 million in 2010, $4.3 million in 2009 and $5.3 millionin 2008.
• Maritime Security Program—Certain of the Company’s vessels participate in the U.S. Maritime Security Program(the ‘‘Program’’), which ensures that militarily useful U.S. Flag vessels are available to the U.S. Department ofDefense in the event of war or national emergency. In 2005, the Company signed agreements with the MaritimeAdministrator of the Department of Transportation pursuant to which the Company entered three reflagged U.S.Flag Product Carriers into the Program. The terms of the agreements relating to the reflagged Product Carrierswere for four years. In September 2008, one of the three U.S. Flag Product Carriers exited the program and wasreflagged under the Marshall Islands Flag. In April 2009, the Maritime Administrator determined that all statutoryrequirements for the conversion of the agreements relating to the two Product Carriers remaining in the MSPprogram from temporary to permanent status had been satisfied and authorized amendments to the agreementsincorporating this change in status. Under the Program, the Company received approximately $2.6 million for eachvessel in 2008 and $2.9 million for each vessel in 2009 and 2010, and will receive $2.9 million for each vessel for2011 and $3.1 million per year for each vessel from 2012 through 2016, subject in each case to annualCongressional appropriations.
• Capital Construction Fund—To encourage private investment in U.S. Flag vessels, the Merchant Marine Act of 1970(the ‘‘Act’’) permits deferral of taxes on earnings from U.S. Flag vessels deposited into a Capital Construction Fundand amounts earned thereon, which can be used for the construction or acquisition of, or retirement of debt on,qualified U.S. Flag vessels (primarily those limited to foreign, Great Lakes, and noncontiguous domestic trades).The Company is a party to an agreement under such Act. Under the agreement, the general objective was for U.S.Flag vessels to be constructed or acquired through the use of assets accumulated in the fund. In July 2010, theCompany withdrew the balance remaining in its Capital Construction Fund (approximately $41 million) in
2010 Annual Report 11

connection with the construction of two U.S. Flag Lightering ATBs. All funds withdrawn from the CapitalConstruction Fund were for qualified purposes. During the three years ended December 31, 2010, the Companywithdrew an aggregate of approximately $155 million from its Capital Construction Fund towards the constructioncosts for the Lightering ATBs.
Investments in Affiliated CompaniesThe Company’s share of results of the FSO, LNG and Alaska Tanker Company joint ventures is included inInternational—Crude, International—Other and U.S., respectively. The level of earnings of the LNG and Alaska TankerCompany joint ventures was relatively stable over the three year period ended December 31, 2010. The losses fromthe FSO joint venture were $2.1 million in 2008, $10.4 million in 2009 and $7.5 million in 2010 and were incurred as aresult of the conversion of the two ULCCs to FSO service vessels and related delays until both ships commencedcharters to MOQ in 2010. For additional information regarding these joint ventures see Management’s Discussion andAnalysis of Financial Condition and Results of Operations set forth in Item 7, and Note F to the Company’s financialstatements set forth in Item 8.
COMPETITIONThe shipping industry is highly competitive and fragmented with OSG competing with other owners of U.S. andInternational Flag tankers. Competitors include other independent shipowners and integrated oil companies and stateowned entities with their own fleets, oil traders with logistical operations, and pipelines.
OSG’s vessels compete with all other vessels of a size and type required by the customer that can be available atthe date specified. In the spot market, competition is based primarily on price, although charterers are becomingmore selective with respect to the quality of the vessels they hire considering other key factors such as the reliabilityand quality of operations and a preference for modern double hull vessels based on concerns about environmentalrisks associated with older vessels. In the time charter market, factors such as the age and quality of the vessel andreputation of its owner and operator tend to be even more significant when competing for business.
OSG’s fleet of VLCCs and ULCCs is commercially managed through Tankers International. Tankers International, witha total of 43 VLCCs and 2 ULCCs as of December 31, 2010, is a leading player in this highly competitive andfragmented market. Its main competitors include Frontline Ltd., BW Shipping Managers, Mitsui OSK Lines, Ltd.,Nippon Yusen Kabushiki Kaisha, Malaysian International Shipping Corporation Berhad and Maran TankersManagement.
OSG formed the Suezmax International pool in 2008. There were four tankers in the pool as of December 31, 2010that trade primarily in the Atlantic Basin. The main competitors of the Suezmax International pool include the GeminiTankers, Stena Sonagol and Blue Fin Tankers pools. Other competitors include non-pool owners such as DynacomTankers Management, Ltd., Thenamaris Ships Management, Inc. and OAO Sovcomflot.
OSG is a founding member of Aframax International, which consists of 46 Aframaxes trading primarily in the AtlanticBasin, North Sea, Baltic and the Mediterranean areas. Aframax International is one of the largest operators in thismarket sector. Aframax International’s main competitors include Teekay Corporation, General Maritime Corporationand Sigma Tankers Inc.
OSG’s main competitors in the highly fragmented Panamax trade include owners, traders relets and pool operators.Substantially all of OSG’s fleet of Panamax tankers is commercial managed by Panamax International, whichcommercially manages 24 double hull vessels. Main competitors include Star Tankers Heidmar Inc., A/SDampskibsselskabet Torm and Jacob-Scorpio Pool Management S.A.M.
In the MR Product Carrier segment, OSG owns or charters-in a fleet of 32 vessels that competes in a highlyfragmented market. Eight of the OSG vessels are operated in the Clean Products International Pool. Maincompetitors include Glencore International AG, Handytankers K/S, Vitol Group, Trafigura, A/S DampskibsselskabetTorm, Navig8, Dorado Tankers Pool Inc. and OAO Sovcomflot.
The U.S. Jones Act restricts U.S. point-to-point seaborne shipments to vessels operating under U.S. Flag that werebuilt in the U.S., manned by U.S. crews and at least 75% owned and operated by U.S. citizens. OSG’s primarycompetitors are operators of U.S. Flag oceangoing barges and tankers, such as Seacor Holdings Inc., CrowleyMaritime Corporation and U.S. Shipping Corp. and operators of refined product pipelines such as Colonial andPlantation pipeline systems that transport refined petroleum products directly from refineries to markets. In addition,
12 Overseas Shipholding Group, Inc.

the demand for U.S. Flag Product Carriers and product barges is influenced by the cost of importing refinedpetroleum products.
ENVIRONMENTAL AND SECURITY MATTERS RELATING TO BULK SHIPPINGGovernment regulation significantly affects the operation of the Company’s vessels. OSG’s vessels operate in aheavily regulated environment and are subject to international conventions and international, national, state and locallaws and regulations in force in the countries in which such vessels operate or are registered.
The Company’s vessels undergo regular and rigorous in-house safety inspections and audits. In addition, a variety ofgovernmental and private entities subject the Company’s vessels to both scheduled and unscheduled inspections.These entities include local port state control authorities (U.S. Coast Guard, harbor master or equivalent),Classification Societies, flag state administration (country of registry) and charterers, particularly major oil companiesand petroleum terminal operators. Certain of these entities require OSG to obtain permits, licenses and certificates forthe operation of the Company’s vessels. Failure to maintain necessary permits or approvals could require OSG toincur substantial costs or temporarily suspend operation of one or more of the Company’s vessels.
The Company believes that the heightened level of environmental, health, safety and quality concerns among variousstakeholders, including insurance underwriters, regulators and charterers, is leading to greater safety and otherregulatory requirements and a more stringent inspection regime on all vessels. Increasing environmental concernshave created a demand for vessels and operations that comply with stricter environmental standards. The Companyis required to maintain operating standards for all of its vessels emphasizing operational safety and quality,environmental stewardship, preventive planned maintenance, continuous training of its officers and crews andcompliance with international and U.S. regulations. OSG believes that the operation of its vessels is in compliancewith applicable environmental laws and regulations; however, because such laws and regulations are changedfrequently and new laws and regulations impose new or increasingly stringent requirements, OSG cannot predict thecost of complying with these requirements, or the impact of these requirements on the resale value or useful lives ofits vessels.
OSG has made a commitment to reduce the environmental impact of its operations, as described in its first Health,Safety and Environmental Report (for 2009). OSG personnel work to stay abreast of new and changing regulations inthis and other areas and in many cases strive towards standards before they are, and beyond what is, required.Examples of specific actions taken that exceed compliance include the installation of trash compactors on most ofthe vessels OSG technically manages, more restrictive policies on disposal of solid waste, and the installation ofspecialized environmental equipment such as enviro-logger and enviro-tags on all OSG technically managed vessels.
International and U.S. Greenhouse Gas Regulations
In February 2005, the Kyoto Protocols to the United Nations Framework Convention on Climate Change (‘‘UNFCCC’’)(commonly called the Kyoto Protocols) became effective. Pursuant to the Kyoto Protocols, adopting countries arerequired to implement national programs to reduce emissions of certain gases, generally referred to as greenhousegases, which contribute to global warming. Although there was some expectation that a new climate change treatywould be adopted at the December 2009 United Nations climate change conference in Copenhagen, the conferencedid not result in any legally binding commitments although the participating countries developed an accord on aframework for negotiations that were held in December 2010 in Cancun, Mexico. The UNFCCC 2010 CancunConference agreed upon emission reduction targets for developed countries and goals for limiting increases inatmospheric temperature but left unresolved the status of the Kyoto Protocols when they expire in 2012. Until then,working groups set up during the Cancun Conference are focusing on securing an extension of the Kyoto Protocolemissions limits.
The IMO’s second study of greenhouse gas emissions from the global shipping fleet concluded in 2009 predicts that,in the absence of appropriate policies, greenhouse emissions from ships may increase by 150% to 200% by 2050due to expected growth in international seaborne trade. The IMO has announced its intention to develop limits ongreenhouse gases from international shipping and is working on proposed mandatory technical and operationalmeasures to achieve these limits.
The European Union (‘‘EU’’) has indicated that it intends to propose an expansion of the existing EU emissionstrading scheme to include emissions of greenhouse gases from vessels. In addition, climate change-related legislationis pending before the U.S. Congress which, if enacted, would limit and reduce greenhouse gas emissions through a‘‘cap-and-trade’’ system of allowances and credits and other provisions.
2010 Annual Report 13

In the U.S., pursuant to an April 2007 U.S. Supreme Court decision, EPA was required to consider whether carbondioxide should be considered a pollutant that endangers public health and welfare, and thus subject to regulationunder the Clean Air Act. On December 1, 2009, the EPA issued an ‘‘endangerment finding’’ regarding greenhousegases under the Clean Air Act. While this finding in itself does not impose any requirements on industry or otherentities, the EPA is in the process of promulgating regulations of greenhouse gas emissions. To date, the regulationsproposed and enacted by the EPA have not involved ocean-going vessels.
Future passage of climate control legislation or other regulatory initiatives by the IMO, EU, U.S. or other countrieswhere OSG operates that restrict emissions of greenhouse gases could result in financial and operational impacts onOSG’s business, which impacts OSG cannot predict with certainty at this time.
International Environmental and Safety Regulations and Standards
Phase Out of Non Double Hull Tankers:In April 2001, the IMO adopted regulations under the International Convention for the Prevention of Pollution fromShips, or MARPOL, requiring new tankers of 5,000 dwt and over, contracted for construction since July 6, 1993, tohave double hull, mid-deck or equivalent design. At that time the regulations also required the phase out of nondouble hull tankers by 2015, with tankers having double sides or double bottoms permitted to operate until theearlier of 2017 or when the vessel reaches 25 years of age. Existing single hull tankers were required to be phasedout unless retrofitted with double hull, mid-deck or equivalent design no later than 30 years after delivery. Theseregulations were adopted by over 150 nations, including many of the jurisdictions in which the Company’s tankersoperate. Subsequent amendments to the MARPOL regulations accelerated the phase out of single hull tankers to2005 (at the latest) for Category I vessels and 2010 (at the latest) for Category II vessels. Category I vessels includecrude oil tankers of 20,000 dwt and above and product carriers of 30,000 dwt and above that are pre-MARPOLSegregated Ballast Tanks (‘‘SBT’’) carriers. Category II vessels include crude oil vessels of 20,000 dwt and above andproduct carriers of 30,000 dwt and above that are post-MARPOL SBT vessels.
In addition, a Condition Assessment Scheme (‘‘CAS’’) will apply to all single hull tankers 15 years or older. Flagstates, however, may permit the continued operation of Category II tankers beyond 2010, subject to satisfactory CASresults, but only to 2015 or 25 years of age, whichever comes earlier. Category II tankers fitted with double bottomsor double sides not used for the carriage of oil will be permitted to trade beyond 2010 to 25 years of age, subject tothe approval of the flag state. Although flag states may grant life extensions to Category II tankers, port states arepermitted to deny entry to their ports and offshore terminals to single hull tankers operating under such lifeextensions after 2010, and to double sided or double bottomed tankers after 2015.
MARPOL Regulation 13H banned the carriage of heavy grade oils (‘‘HGO’’) in single hull tankers of more than 5,000dwt after April 5, 2005, except that flag states may permit Category II tankers to continue to carry HGO beyond 2005(until the vessel reaches 25 years of age), subject to satisfactory CAS results. This regulation predominantly affectedheavy crude oil from Latin America, as well as heavy fuel oil, bitumen, tar and related products.
The IMO may adopt additional regulations in the future that could further restrict the operation of single hull vesselsand some countries have or may adopt such restrictions even before the IMO acts.
EU regulation (EC) No. 417/2002, which was introduced in the wake of the sinking of the Erika off the coast ofFrance in December 1999, provided a timetable for the phase out of single hull tankers from EU waters. In 2003, inresponse to the Prestige oil spill in November 2002, the EU adopted legislation that (a) banned all Category I singlehull tankers over the age of 23 years immediately, (b) phased out all other Category I single hull tankers in 2005 and(c) prohibits all single hull tankers used for the transport of oil from entering its ports or offshore terminals after 2010,with double sided or double bottomed tankers permitted to trade until 2015 or until reaching 25 years of age,whichever comes earlier. The EU, following the lead of certain EU nations such as Italy and Spain, also banned allsingle hull tankers carrying heavy grades of oil from entering or leaving its ports or offshore terminals or anchoring inareas under its jurisdiction.
It is becoming increasingly more difficult to obtain clearance for single hull tankers from many countries and oilterminals.
The direct impact to the Company of the revised and accelerated IMO phase out schedule is limited, as OSG’sInternational Flag tanker fleet is comprised of modern double hull vessels except for one chartered-in double sided
14 Overseas Shipholding Group, Inc.

Aframax vessel, which does not qualify as double hull for MARPOL or EU purposes. The charter for this vesselexpires in August 2011. The Company’s two double bottom U.S. Flag Product Carriers have been participating in theU.S. Jones Act trades and are therefore not affected by the IMO phase-out schedule. Both of these vessels havebeen sold for delivery to buyers in the first half of 2011. The U.S. has not adopted the 2001 amendments to theMARPOL regulations, which were viewed as less restrictive than OPA 90 regulations that were already in place.
Liability Standards and Limits:Many countries have ratified and follow the liability plan adopted by the IMO and set out in the InternationalConvention on Civil Liability for Oil Pollution Damage of 1969 (the ‘‘1969 Convention’’). Some of these countries havealso adopted the 1992 Protocol to the 1969 Convention (the ‘‘1992 Protocol’’). Under both the 1969 Convention andthe 1992 Protocol, a vessel’s registered owner is strictly liable for pollution damage caused in the territorial waters ofa contracting state by discharge of persistent oil, subject to certain complete defenses. These conventions also limitthe liability of the shipowner under certain circumstances. As these conventions calculate liability in terms of a basketof currencies, the figures in this section are converted into U.S. dollars based on currency exchange rates onJanuary 31, 2011 and are approximate.
Under the 1969 Convention, except where the owner is guilty of actual fault, its liability is limited to $208 per grosston (a unit of measurement for the total enclosed spaces within a vessel) with a maximum liability of $21.9 million.Under the 1992 Protocol, the owner’s liability is limited except where the pollution damage results from its personalact or omission, committed with the intent to cause such damage, or recklessly and with knowledge that suchdamage would probably result. Under the 2000 amendments to the 1992 Protocol, which became effective onNovember 1, 2003, liability is limited to $7.1 million plus $987 for each additional gross ton over 5,000 for vessels of5,000 to 140,000 gross tons, and $140.4 million for vessels over 140,000 gross tons, subject to the exceptionsdiscussed above for the 1992 Protocol.
Vessels trading to states that are parties to these conventions must provide evidence of insurance covering theliability of the owner. The Company believes that its P&I insurance will cover any liability under the plan adopted bythe IMO. See the discussion of Insurance below.
The U.S. is not a party to the 1969 Convention or the 1992 Protocol. See the discussion of U.S. Environmental andSafety Restrictions and Regulations below. In other jurisdictions where the 1969 Convention has not been adopted,various legislative schemes or common law govern, and liability is imposed either on the basis of fault or in a mannersimilar to that convention.
The International Convention on Civil Liability for Bunker Oil Pollution Damage, 2001, which was adopted onMarch 23, 2001 and became effective on November 21, 2008, is a separate convention adopted to ensure thatadequate, prompt and effective compensation is available to persons who suffer damage caused by spills of oil whenused as fuel by vessels. The convention applies to damage caused to the territory, including the territorial sea, and inits exclusive economic zones, of states that are party to it. While the U.S. has not yet ratified this convention, vesselsoperating internationally would be subject to it, if sailing within the territories of those countries that haveimplemented its provisions. The Company believes that its vessels comply with these requirements.
Other International Environmental and Safety Regulations and Standards:Under the International Safety Management Code, or ISM Code, promulgated by the IMO, vessel operators arerequired to develop an extensive safety management system that includes, among other things, the adoption of asafety and environmental protection policy setting forth instructions and procedures for operating their vessels safelyand describing procedures for responding to emergencies. OSG has developed such a safety management system.The ISM Code also requires that vessel operators obtain a safety management certificate for each vessel theyoperate. This certificate evidences compliance by a vessel’s management with code requirements for a safetymanagement system. No vessel can obtain a certificate unless its operator has been awarded a document ofcompliance issued by the administration of that vessel’s flag state or as otherwise permitted under the InternationalConvention for the Safety of Life at Sea, 1974, as amended (‘‘SOLAS’’).
All of the Company’s vessels are certified under the standards promulgated by the International StandardsOrganization in ISO 9001 in 2000 and ISO 14001 in 2004 and those promulgated by the IMO in its InternationalSafety Management (‘‘ISM’’) safety and pollution prevention protocols. The ISM Code requires a document ofcompliance to be obtained for the vessel manager and a safety management certificate to be obtained for each
2010 Annual Report 15

vessel that it operates. The Company has obtained documents of compliance for its shore side offices that haveresponsibility for vessel management and safety management certificates for each of the vessels that such officesmanage. These documents of compliance and safety management certificates must be verified or renewedperiodically (annually or less frequently, depending on the type of document) in accordance with the ISM Code.
IMO regulations also require owners and operators of vessels to adopt Shipboard Oil Pollution Emergency Plans, orSOPEPs. Periodic training and drills for response personnel and for vessels and their crews are required. In additionto SOPEPs, OSG has adopted Shipboard Marine Pollution Emergency Plans, or SMPEPs, which cover potentialreleases not only of oil but of any noxious liquid substances (known as NLSs).
Noncompliance with the ISM Code and other IMO regulations may subject the shipowner or charterer to increasedliability, may lead to decreases in available insurance coverage for affected vessels and may result in the denial ofaccess to, or detention in, some ports. For example, the U.S. Coast Guard and EU authorities have indicated thatvessels not in compliance with the ISM Code will be prohibited from trading with U.S. and EU ports.
OSG’s vessels are also subject to international and local ballast water management regulations including thosecontained in the IMO’s International Convention for the Control and Management of Ships Ballast Water andSediments (2004). OSG complies with these regulations through ballast water management plans implemented oneach of the vessels it technically manages. To meet proposed ballast water treatment regulations, OSG is developinga fleetwide action plan to comply with IMO, U.S. Coast Guard and possible more stringent regional mandatesexpected to go into effect as early as 2012.
Other EU Legislation and Regulations:The EU has adopted legislation that: (1) bans manifestly sub-standard vessels (defined as those over 15 years oldthat have been detained by port authorities at least twice in a six month period) from European waters, creates anobligation for port states to inspect at least 25% of vessels using their ports annually and provides for increasedsurveillance of vessels posing a high risk to maritime safety or the marine environment, and (2) provides the EU withgreater authority and control over Classification Societies, including the ability to seek to suspend or revoke theauthority of negligent societies. OSG does not believe that any of its vessels meet the ‘‘sub-standard’’ vesseldefinitions contained in the EU legislation. The EU is considering the adoption of criminal sanctions for certainpollution events, such as the unauthorized discharge of tank washings. Certain member states of the EuropeanUnion, by virtue of their national legislation, already impose criminal sanctions for pollution events under certaincircumstances. It is impossible to predict what additional legislation or regulations, if any, may be promulgated by theEU or any other country or authority, or how these might impact OSG.
International Air Emission Standards:Annex VI to MARPOL, which was designed to address air pollution from vessels and which became effectiveinternationally on May 19, 2005, sets limits on sulfur dioxide and nitrogen oxide emissions from ship exhausts andprohibits deliberate emissions of ozone depleting substances, such as chlorofluorocarbons. Annex VI also imposes aglobal cap (currently 4.50%) on the sulfur content of fuel oil and allows for specialized areas to be establishedinternationally with more stringent controls on sulfur emissions. For vessels over 400 gross tons, Annex VI imposesvarious survey and certification requirements. The U.S. Maritime Pollution Prevention Act of 2008, signed into law byPresident Bush in July 2008, amended the U.S. Act to Prevent Pollution from Ships to provide for the adoption ofAnnex VI of MARPOL. In October 2008, the U.S. ratified Annex VI, which came into force in the U.S. on January 8,2009.
Annex VI was amended in 2008 to provide for a progressive and substantial reduction in sulfur oxide (‘‘SOx’’) andnitrogen oxide (‘‘NOx’’) emissions from vessels and allow for the designation of Emission Control Areas in which morestringent controls would apply. The primary changes are that the global cap on the sulfur content of fuel oil isreduced to 3.50% effective from January 1, 2012, and such cap is further reduced progressively to 0.50% effectivefrom January 1, 2020, subject to a feasibility review to be completed no later than 2018. Further, the sulfur content offuel oil for vessels operating in designated Emission Control Areas is progressively reduced from 1.5% to 1.0%effective July 2010 and further reduced to 0.1% effective January 2015.
All vessels in the Company’s International and U.S. Flag fleets are currently Annex VI compliant. However, additionalor new conventions, laws and regulations may be adopted in the future that could adversely affect the Company’s
16 Overseas Shipholding Group, Inc.

ability to comply with applicable air pollution regulations or could result in material cost increases to assure suchcompliance.
U.S. Environmental and Safety Regulations and StandardsThe U.S. regulates the shipping industry with an extensive regulatory and liability regime for environmental protectionand cleanup of oil spills, consisting primarily of OPA 90, and the Comprehensive Environmental Response,Compensation, and Liability Act, or CERCLA. OPA 90 affects all owners and operators whose vessels trade with theU.S. or its territories or possessions, or whose vessels operate in the waters of the U.S., which include the U.S.territorial sea and the 200 nautical mile exclusive economic zone around the United States. CERCLA applies to thedischarge of hazardous substances (other than oil) whether on land or at sea. Both OPA 90 and CERCLA impact theCompany’s operations.
Phase Out of Non Double Hull Tankers:Under OPA 90, single hull vessels can operate in U.S. waters until 2015 if they discharge at deep water ports, orlighter more than 60 miles offshore. Single hull vessels cannot operate in U.S. waters under OPA 90 beginning in2015.
The Company’s two double bottom U.S. Flag Product Carriers would be affected by the OPA 90 phase-out schedulein 2012 and 2013, with both vessels being 30 years old when they are first affected by the phase-out schedule.However, both of these vessels have been sold for delivery to buyers in the first half of 2011. The OPA 90 phase-outdate for the Company’s one double sided International Flag vessel (the charter for which expires in August 2011) issubsequent to its IMO phase-out date.
Liability Standards and Limits:Under OPA 90, vessel owners, operators and bareboat or demise charterers are ‘‘responsible parties’’ who are liable,without regard to fault, for all containment and clean-up costs and other damages, including property and naturalresource damages and economic loss without physical damage to property, arising from oil spills and pollution fromtheir vessels. Currently, the limits of OPA 90 liability with respect to (i) tanker vessels with a qualifying double hull arethe greater of $2,000 per gross ton or $17.088 million per vessel that is over 3,000 gross tons; (ii) tanker vessels witha qualifying single hull, the greater of $3,200 per gross ton or $23.496 million per vessel that is over 3,000 grosstons; and (iii) non-tanker vessels, the greater of $1,000 per gross ton or $854,400 per vessel. The statute specificallypermits individual states to impose their own liability regimes with regard to oil pollution incidents occurring withintheir boundaries, and some states have enacted legislation providing for unlimited liability for discharge of pollutantswithin their waters. In some cases, states that have enacted this type of legislation have not yet issued implementingregulations defining vessel owners’ responsibilities under these laws. CERCLA, which applies to owners andoperators of vessels, contains a similar liability regime and provides for cleanup, removal and natural resourcedamages associated with discharges of hazardous substances (other than oil). Liability under CERCLA is limited tothe greater of $300 per gross ton or $5 million.
These limits of liability do not apply, however, where the incident is caused by violation of applicable U.S. federalsafety, construction or operating regulations, or by the responsible party’s gross negligence or willful misconduct.Similarly, these limits do not apply if the responsible party fails or refuses to report the incident or to cooperate andassist in connection with the substance removal activities. OPA 90 and CERCLA each preserve the right to recoverdamages under existing law, including maritime tort law.
OPA 90 also requires owners and operators of vessels to establish and maintain with the U.S. Coast Guard evidenceof financial responsibility sufficient to meet the limit of their potential strict liability under the statute. The U.S. CoastGuard enacted regulations requiring evidence of financial responsibility consistent with the previous limits of liabilitydescribed above for OPA 90 and CERCLA. Under the regulations, evidence of financial responsibility may bedemonstrated by insurance, surety bond, self-insurance, guaranty or an alternative method subject to approval by theDirector of the U.S. Coast Guard National Pollution Funds Center. Under OPA 90 regulations, an owner or operator ofmore than one vessel is required to demonstrate evidence of financial responsibility for the entire fleet in an amountequal only to the financial responsibility requirement of the vessel having the greatest maximum strict liability underOPA 90 and CERCLA. OSG has provided the requisite guarantees and has received certificates of financialresponsibility from the U.S. Coast Guard for each of its vessels required to have one.
2010 Annual Report 17

OSG has insurance for each of its vessels with pollution liability insurance in the amount of $1 billion. However, acatastrophic spill could exceed the insurance coverage available, in which event there could be a material adverseeffect on the Company’s business.
In response to the Deepwater Horizon oil spill in the Gulf of Mexico in 2010, the U.S. House of Representativesproposed legislation to create certain more stringent requirements related to the prevention and response to oil spillsin U.S. waters and to increase both financial responsibility requirements and the limits in liability under OPA 90. Nolegislation was enacted during the term of the 2009-2010 Congress. Similar legislation was introduced in the U.S.House of Representatives in the 2011-2012 Congress. In addition to potential liability under OPA 90, vessel ownersmay in some instances incur liability on an even more stringent basis under state law in the particular state where thespillage occurred.
Other U.S. Environmental and Safety Regulations:OPA 90 also amended the Federal Water Pollution Control Act to require owners and operators of vessels to adoptvessel response plans, including marine salvage and firefighting plans, for reporting and responding to oil spillscenarios up to a ‘‘worst case’’ scenario and to identify and ensure, through contracts or other approved means, theavailability of necessary private response resources to respond to a ‘‘worst case discharge’’. The plans must includecontractual commitments with clean-up response contractors in order to ensure an immediate response to an oilspill. While OSG has developed and completed the necessary submittals of the plans to the U.S. Coast Guard, theU.S. Coast Guard recently came out with procedures (due to a review backlog on their part) in which they will nowissue Interim Operating Authorization (IOA) letters to companies as evidence of compliance with the February 22,2011 deadline. These IOAs are good for six months during which time the U.S. Coast Guard will complete their fullreview of the submittals and then issue final approval letters. OSG has received the IOAs for each of the vessels itmanages.
The U.S. Coast Guard has announced its intention to propose similar regulations requiring certain vessels to prepareresponse plans for the release of hazardous substances.
OPA 90 requires training programs and periodic drills for shore side staff and response personnel and for vessels andtheir crews. OSG conducts such required training programs and periodic drills.
OPA 90 does not prevent individual U.S. states from imposing their own liability regimes with respect to oil pollutionincidents occurring within their boundaries. In fact, most U.S. states that border a navigable waterway have enactedenvironmental pollution laws that impose strict liability on a person for removal costs and damages resulting from adischarge of oil or a release of a hazardous substance. These laws are in some cases more stringent than U.S.federal law.
In addition, the U.S. Clean Water Act, or CWA, prohibits the discharge of oil or hazardous substances in U.S.navigable waters and imposes strict liability in the form of penalties for unauthorized discharges. The Clean Water Actalso imposes substantial liability for the costs of removal, remediation and damages and complements the remediesavailable under the more recent OPA 90 and CERCLA, discussed above.
The discharge of ballast water and other substances incidental to the normal operation of vessels in U.S. ports issubject to U.S. Clean Water Act permitting requirements. In accordance with the EPA’s National Pollutant DischargeElimination System, the Company was issued a Vessel General Permit, or VGP, which addresses, among othermatters, the discharge of ballast water and effluents. The VGP identifies twenty-six vessel discharge streams,establishes effluent limits for constituents of those streams and requires that best management practices beimplemented to decrease the amounts of certain constituents of the discharges. The VGP does not impose numericaltreatment standards for the discharge of living organisms in ballast water. Rather, the VGP mandates managementpractices that decrease the risk of introduction of aquatic nuisance species to bodies of water receiving ballast waterdischarges. The EPA has indicated, however, that, as ballast water treatment technologies become available in thefuture, the EPA will revisit its approach to the management of ballast water discharges. Compliance with the VGPcould require the installation of equipment on OSG’s vessels to treat ballast water before it is discharged or theimplementation of other ballast water disposal arrangements, or it could otherwise restrict OSG’s vessels fromentering U.S. waters.
The VGP system also permits individual states and territories to impose more stringent requirements for dischargesinto the navigable waters of such state or territory. Certain individual states have enacted legislation or regulations
18 Overseas Shipholding Group, Inc.

addressing hull cleaning and ballast water management. For example, on October 10, 2007, California GovernorSchwarzenegger signed into law AB 740, legislation expanding regulation of ballast water discharges and themanagement of hull-fouling organisms. California has extensive requirements for more stringent effluent limits anddischarge monitoring and testing requirements with respect to discharges in its waters.
Legislation has been proposed in the U.S. Congress to amend the Nonindigenous Aquatic Nuisance Prevention andControl Act of 1990, which had been previously amended and reauthorized by the National Invasive Species Act of1996, to further increase the regulation of ballast water discharges. However, it can not currently be determinedwhether such legislation will eventually be enacted, and if enacted, what requirements might be imposed on theCompany’s operations under such legislation.
U.S. Air Emissions Standards:As discussed above, MARPOL Annex VI came into force in the U.S. in January 2009. In April 2010, EPA adoptedregulations implementing the provisions of MARPOL Annex VI. Under these regulations, both U.S. and InternationalFlag vessels subject to the engine and fuel standards of MARPOL Annex VI must comply with the applicableAnnex VI provisions when they enter U.S. ports or operate in most internal U.S. waters. The Company’s vessels arecurrently Annex VI compliant. Accordingly, absent any new and onerous Annex VI implementing regulations, theCompany does not expect to incur material additional costs in order to comply with this convention.
The U.S. Clean Air Act of 1970, as amended by the Clean Air Act Amendments of 1977 and 1990, or CAA, requiresthe EPA to promulgate standards applicable to emissions of volatile organic compounds and other air contaminants.OSG’s vessels are subject to vapor control and recovery requirements for certain cargoes when loading, unloading,ballasting, cleaning and conducting other operations in regulated port areas. Each of the Company’s vesselsoperating in the transport of clean petroleum products in regulated port areas where vapor control standards arerequired has been outfitted with a vapor recovery system that satisfies these requirements. In addition, the EPAissued emissions standards for marine diesel engines. The EPA has implemented rules comparable to those ofMARPOL Annex VI to increase the control of air pollutant emissions from certain large marine engines by requiringcertain new marine-diesel engines installed on U.S. registered ships to meet lower nitrogen oxide (NOx) standardswhich will be implemented in two phases. The new near-term standards for newly built engines will apply beginningin 2011 and will require more efficient use of current engine technologies, including engine timing, engine cooling,and advanced computer controls to achieve a 15 to 25 percent NOx reduction below the current levels. The newlong-term standards for newly built engines will apply beginning in 2016 and will require the use of high efficiencyemission control technology such as selective catalytic reduction to achieve NOx reductions 80 percent below thecurrent levels. Adoption of these and emerging standards may require substantial modifications to some of theCompany’s existing marine diesel engines and may require the Company to incur substantial capital expenditures.Moreover, on March 26, 2010, the IMO amended MARPOL Annex VI, which amendments were incorporated into EPAregulations, to designate the area extending 200 miles from the coastlines of the Atlantic/Gulf and Pacific coasts andthe eight main Hawaiian Islands as Emission Control Areas (ECAs) under the Annex VI amendments. The new ECAsbecome effective in August 2012, whereupon fuel used by all vessels operating in the ECAs cannot exceed 1.0%sulfur, dropping to 0.1% sulfur in 2015. From 2016, NOx after-treatment requirements will also apply. If other ECAsare approved by the IMO or other new or more stringent requirements relating to emissions from marine dieselengines or port operations by vessels are adopted by the EPA or the states where OSG operates, compliance withthese regulations could entail significant capital expenditures or otherwise increase the costs of OSG’s operations.
The Delaware Department of Natural Resources and Environment Control, or DNREC, monitors OSG’s U.S. Flaglightering activities within the Delaware River. Lightering activities in Delaware are subject to Title V of the CAA, andOSG is the only marine operator with a Title V permit to engage in lightering operations. These lightering activities aremonitored and regulated through DNREC’s Title V air permitting process. The regulations are designed to reduce theamount of VOCs entering into the atmosphere during a crude oil lightering operation. DNREC and OSG have workedin cooperation to reduce the amount of emitted VOCs by defining the vapor balancing process between lighteringvessels and ships to be lightered. This defined process has reduced air emissions. In addition, OSG continues toevaluate other vapor reduction technologies and has incorporated vapor control technologies in the design of theCompany’s new ATBs. Under its Title V permit, OSG is required to have a 100 percent vapor balance capableDelaware lightering fleet and OSG will be compliant upon the delivery of the OSG Horizon/OSG 351, which iscurrently expected in March 2011. DNREC has been informed of OSG’s vessel delivery schedule.
2010 Annual Report 19
The CAA also requires states to draft State Implementation Plans, or SIPs, designed to attain national health-basedair quality standards in major metropolitan and industrial areas. Where states fail to present approvable SIPs, or SIPrevisions by certain statutory deadlines, the U.S. government is required to draft a Federal Implementation Plan.Several SIPs regulate emissions resulting from barge loading and degassing operations by requiring the installation ofvapor control equipment. Where required, the Company’s vessels are already equipped with vapor control systemsthat satisfy these requirements. Although a risk exists that new regulations could require significant capitalexpenditures and otherwise increase its costs, the Company believes, based upon the regulations that have beenproposed to date, that no material capital expenditures beyond those currently contemplated and no materialincrease in costs are likely to be required as a result of the SIPs program.
Individual states have been considering their own restrictions on air emissions from engines on vessels operatingwithin state waters. California requires certain vessels operating within 24 nautical miles of the Californian coast toreduce air pollution by using only low-sulfur marine distillate fuel rather than bunker fuel. Vessels sailing within 24miles of the California coastline whose itineraries call for them to enter any California ports, terminal facilities, orinternal or estuarine waters must use marine gas oil at or below 1.5% sulfur and marine diesel oil at or below 0.5%sulfur and, effective January 1, 2012, marine fuels with a sulfur content at or below 0.1% (1,000 parts per million)sulfur. The Company believes that its vessels that operate in California waters are in compliance with theseregulations.
Security Regulations and PracticesSecurity at sea has been a concern to governments, shipping lines, port authorities and importers and exporters foryears. Since the terrorist attacks of September 11, 2001, there have been a variety of initiatives intended to enhancevessel security. In 2002, the U.S. Maritime Transportation Security Act of 2002, or MTSA, came into effect and theU.S. Coast Guard issued regulations in 2003 implementing certain portions of the MTSA by requiring theimplementation of certain security requirements aboard vessels operating in waters subject to the jurisdiction of theU.S. Similarly, in December 2002, a coalition of 150 IMO contracting states drafted amendments to SOLAS bycreating a new subchapter dealing specifically with maritime security. This new subchapter, which became effective inJuly 2004, imposes various detailed security obligations on vessels and port authorities, most of which are containedin the International Ship and Port Facilities Security Code, or the ISPS Code. The objective of the ISPS Code is toestablish the framework that allows detection of security threats and implementation of preventive measures againstsecurity incidents that can affect ships or port facilities used in international trade. Among other things, the ISPSCode requires the development of vessel security plans and compliance with flag state security certificationrequirements. To trade internationally, a vessel must attain an International Ship Security Certificate, or ISSC, from arecognized security organization approved by the vessel’s flag state.
The U.S. Coast Guard regulations, intended to align with international maritime security standards, exempt fromMTSA vessel security measures for non-U.S. vessels that have on board a valid ISSC attesting to the vessel’scompliance with SOLAS security requirements and the ISPS Code.
All of OSG’s vessels have developed and implemented vessel security plans that have been approved by theappropriate regulatory authorities, have obtained ISSCs and comply with applicable security requirements.
The recent surge in piracy activity in the region of the Gulf of Aden and off of the Somali coast has again focusedinternational attention on methods for preventing and mitigating risks of piracy incidents. The attack against a U.S.Flag container ship in 2009 and its dramatic conclusion led to significant interest on the part of the U.S. governmentleading to additional requirements applicable to U.S. flag vessels transiting in high risk areas. Company vessels thattransit such high risk areas follow best management practices for reducing risk and preventing pirate attacks and arein compliance with protocols established by the naval coalition protective forces operating in such areas.
InsuranceConsistent with the currently prevailing practice in the industry, the Company presently carries protection andindemnity (‘‘P&I’’) insurance coverage for pollution of $1.0 billion per occurrence on every vessel in its fleet. P&Iinsurance is provided by mutual protection and indemnity associations (‘‘P&I Associations’’). The P&I Associationsthat comprise the International Group insure approximately 90% of the world’s commercial tonnage and have enteredinto a pooling agreement to reinsure each association’s liabilities. Each P&I Association has capped its exposure toeach of its members at approximately $5.45 billion. As a member of a P&I Association which is a member of the
20 Overseas Shipholding Group, Inc.
International Group, the Company is subject to calls payable to the Associations based on its claim record as well asthe claim records of all other members of the individual Associations of which it is a member, and the members ofthe pool of P&I Associations comprising the International Group. As of December 31, 2010, the Company was amember of three P&I Associations with each of its vessels insured by one of these three Associations. While theCompany has historically been able to obtain pollution coverage at commercially reasonable rates, no assurancescan be given that such insurance will continue to be available in the future.
The Company carries marine hull and machinery and war risk insurance, which includes the risk of actual orconstructive total loss, for all of its vessels. The vessels are each covered up to at least their fair market value, withdeductibles ranging from $100,000 to $500,000 per vessel per incident. The Company is self insured for hull andmachinery claims in amounts in excess of the individual vessel deductibles up to a maximum aggregate loss of$3,500,000, per policy year.
The Company currently maintains loss of hire insurance to cover loss of charter income resulting from accidents orbreakdowns of its vessels that are covered under the vessels’ marine hull and machinery insurance. Loss of hireinsurance covers up to 120 or 180 days lost charter income per vessel per incident in excess of the first 60 days lostfor each covered incident, which is borne by the Company.
Taxation of the CompanyThe following summary of the principal United States tax laws applicable to the Company, as well as the conclusionsregarding certain issues of tax law, are based on the provisions of the U.S. Internal Revenue Code of 1986, asamended (the ‘‘Code’’), existing and proposed U.S. Treasury Department regulations, administrative rulings,pronouncements and judicial decisions, all as of the date of this Annual Report. No assurance can be given thatchanges in or interpretation of existing laws will not occur or will not be retroactive or that anticipated futurecircumstances will in fact occur. The Company’s views should not be considered official, and no assurance can begiven that the conclusions discussed below would be sustained if challenged by taxing authorities.
All of the Company’s International Flag vessels are owned or operated by foreign corporations that are subsidiaries ofOSG International, Inc., a wholly owned subsidiary of the Company incorporated in the Marshall Islands (‘‘OIN’’).These corporations have made special U.S. tax elections under which they are treated as ‘‘branches’’ of OIN ratherthan separate corporations for U.S. federal income tax purposes.
As a result of changes made by the American Jobs Creation Act of 2004 (‘‘2004 Act’’), as discussed below, fortaxable years beginning after December 31, 2004, the Company is no longer required to include the undistributedforeign shipping income earned by OIN in its taxable income on a current basis under the ‘‘Subpart F’’ provisions ofthe Code.
Legislation has been proposed that is aimed at deferring the claiming by a taxpayer of interest deductionsattributable to foreign source income that is not subject to current U.S. taxation until the income is repatriated. Theenactment of such proposed legislation is uncertain and the effect on the Company can not be determined untilagreement has been reached on the exact wording of the provision.
Taxation to OIN of its Shipping Income: In GeneralOIN derives substantially all of its gross income from the use and operation of vessels in international commerce.This income principally consists of hire from time and voyage charters for the transportation of cargoes and theperformance of services directly related thereto, which is referred to herein as ‘‘shipping income.’’
Shipping income that is attributable to transportation that begins or ends, but that does not both begin and end, inthe U.S. will be considered to be 50% derived from sources within the United States. Shipping income attributable totransportation that both begins and ends in the United States will be considered to be 100% derived from sourceswithin the United States. OIN does not engage in transportation that gives rise to 100% U.S. source income.Shipping income attributable to transportation exclusively between non-U.S. ports will be considered to be 100%derived from sources outside the United States. Shipping income derived from sources outside the U.S. will not besubject to any U.S. federal income tax. OIN’s vessels will operate in various parts of the world, including to or fromU.S. ports. Unless exempt from U.S. taxation under Section 883 of the Code, OIN will be subject to U.S. federalincome taxation of 4% of its U.S. source shipping income on a gross basis without the benefit of deductions.
2010 Annual Report 21

Application of Code Section 883Under Section 883 of the Code and Treasury regulations, OIN will be exempt from the foregoing U.S. taxation of itsU.S source shipping income if, for more than half of the days in its taxable year, it is a ‘‘controlled foreigncorporation’’ within the meaning of Section 957 of the Code and more than 50 percent of the total value of its stockis owned by certain U.S. persons including a domestic corporation. These requirements should be met and thereforeOIN should continue to benefit from the application of Section 883 of the Code. To the extent OIN is unable toqualify for exemption from tax under Section 883, OIN’s U.S. source shipping income will become subject to the 4%gross basis tax regime described above.
Taxation to OSG of OIN’s Shipping IncomeFor taxable years beginning on or after January 1, 1987 and ending on or before December 31, 2004, the Company,as a 10% shareholder or more of controlled foreign corporations, was subject to current taxation on the shippingincome of its foreign subsidiaries. To make U.S.-controlled shipping companies competitive with foreign-controlledshipping companies, through the passage of the 2004 Act, Congress repealed the current income inclusion by 10%shareholders of the shipping income of controlled foreign corporations. Accordingly, for years beginning on or afterJanuary 1, 2005, the Company is not required to include in income OIN’s undistributed shipping income.
For taxable years beginning on or after January 1, 1976 and ending on or before December 31, 1986, the Companywas not required to include in income the undistributed shipping income of its foreign subsidiaries that wasreinvested in qualified shipping assets. For taxable years beginning on or after January 1, 1987, the Company isrequired to include in income the deferred shipping income from this period to the extent that at the end of any yearthe investment in qualified shipping assets is less than the corresponding amount at December 31, 1986. By virtue ofthe nature of OIN’s business, the Company anticipates that the recognition of this deferred income will be postponedindefinitely. This is discussed in more detail in the notes to the Company’s consolidated financial statements set forthin Item 8.
U.S. Tonnage Tax RegimeThe 2004 Act changed the U.S. tax treatment of the foreign operations of the Company’s U.S. Flag vessels byallowing it to make an election to have such vessels taxed under a new ‘‘tonnage tax’’ regime rather than the usualU.S. corporate income tax regime. Because OSG made the tonnage tax election, its gross income for U.S. incometax purposes with respect to eligible U.S. flag vessels for 2005 and subsequent years does not include (1) incomefrom qualifying shipping activities in U.S. foreign trade (i.e., transportation between the U.S. and foreign ports orbetween foreign ports), (2) income from cash, bank deposits and other temporary investments that are reasonablynecessary to meet the working capital requirements of qualifying shipping activities, and (3) income from cash orother intangible assets accumulated pursuant to a plan to purchase qualifying shipping assets. The Company’staxable income with respect to the operations of its eligible U.S. Flag vessels, of which there are two, is based on a‘‘daily notional taxable income,’’ which is taxed at the highest U.S. corporate income tax rate. The daily notionaltaxable income from the operation of a qualifying vessel is 40 cents per 100 tons of the net tonnage of the vessel upto 25,000 net tons, and 20 cents per 100 tons of the net tonnage of the vessel in excess of 25,000 net tons. Thetaxable income of each qualifying vessel is the product of its daily notional taxable income and the number of daysduring the taxable year that the vessel operates in U.S. foreign trade.
Glossary
Aframax—A medium size crude oil tanker of approximately 80,000 to 120,000 deadweight tons. Modern Aframaxescan generally transport from 500,000 to 800,000 barrels of crude oil and are also used in Lightering. A coatedAframax operating in the refined petroleum products trades may be referred to as an LR2.
American Tanker Rate Schedule (ATRS)—The nominal freight rate scale published by the Association of Ship Brokersand Agents (U.S.A.), Inc. (ASBA) as a rate reference for shipping companies, brokers and their customers engaged inthe bulk shipping of oil in the U.S. Flag markets. Refer also to Worldscale definition below.
Articulated Tug Barge or ATB—A tug-barge combination system capable of operating on the high seas, coastwiseand further inland. It combines a normal barge, with a bow resembling that of a ship, but having a deep indent at thestern to accommodate the bow of a tug. The fit is such that the resulting combination behaves almost like a singlevessel at sea as well as while maneuvering.
22 Overseas Shipholding Group, Inc.

Bareboat Charter—A Charter under which a customer pays a fixed daily or monthly rate for a fixed period of time foruse of the vessel. The customer pays all costs of operating the vessel, including voyage and vessel expenses.Bareboat charters are usually long term.
CAP—The Condition Assessment Program of ABS Consulting, a subsidiary of the American Bureau of Shipping,which evaluates a vessel’s operation, machinery, maintenance and structure using the ABS Safe Hull Criteria. A CAP1 rating indicates that a vessel meets the standards of a newly built vessel.
Capesize Bulk Carrier—A large Dry Bulk Carrier (any vessel used to carry non-liquid bulk commodities) with acapacity of more than 80,000 deadweight tons that mainly transports iron ore and coal.
Charter—Contract entered into with a customer for the use of the vessel for a specific voyage at a specific rate perunit of cargo (‘‘Voyage Charter’’), or for a specific period of time at a specific rate per unit (day or month) of time(‘‘Time Charter’’).
Classification Societies—Organizations that establish and administer standards for the design, construction andoperational maintenance of vessels. As a practical matter, vessels cannot trade unless they meet these standards.
Compressed Natural Gas or CNG—A gas that has been compressed for transportation in pressurized containers andcan be transported on ships, barges or trucks. In many parts of the world, gas fields that cannot be readilyconnected by pipeline or are not large enough to support the cost of developing LNG facilities are excellentcandidates for CNG development.
Commercial Management or Commercially Managed—The management of the employment, or chartering, of a vesseland associated functions, including seeking and negotiating employment for vessels, billing and collecting revenues,issuing voyage instructions, purchasing fuel, and appointing port agents.
Commercial Pool—A commercial pool is a group of similar size and quality vessels with different shipowners that areplaced under one administrator or manager. Pools allow for scheduling and other operating efficiencies such as multi-legged charters and Contracts of Affreightment and other operating efficiencies.
Condition Assessment Scheme—An inspection program designed to check and report on the vessel’s physicalcondition and on its past performance based on survey and IMO’s International Safety Management audit reportsand port state performance records.
Contract of Affreightment or COA—An agreement providing for the transportation between specified points for aspecific quantity of cargo over a specific time period but without designating specific vessels or voyage schedules,thereby allowing flexibility in scheduling since no vessel designation is required. COAs can either have a fixed rate ora market-related rate. One example would be two shipments of 70,000 tons per month for two years at the prevailingspot rate at the time of each loading.
Consecutive Voyage Charters or CVC—A CVC is used when a customer contracts for a particular vessel for a certainperiod of time to transport cargo between specified points for a rate that is determined based on the volume ofcargo delivered. The Company bears the risk of delays under CVC arrangements.
Crude Oil—Oil in its natural state that has not been refined or altered.
Cubic Meters or cbm—The industry standard for measuring the carrying capacity of an LNG Carrier.
Deadweight tons or dwt—The unit of measurement used to represent cargo carrying capacity of a vessel, butincluding the weight of consumables such as fuel, lube oil, drinking water and stores.
Demurrage—Additional revenue paid to the shipowner on its Voyage Charters for delays experienced in loadingand/or unloading cargo that are not deemed to be the responsibility of the shipowner, calculated in accordance withspecific Charter terms.
Double Hull—Hull construction design in which a vessel has an inner and an outer side and bottom separated byvoid space, usually two meters in width.
Drydocking—An out-of-service period during which planned repairs and maintenance are carried out, including allunderwater maintenance such as external hull painting. During the drydocking, certain mandatory Classification
2010 Annual Report 23
Society inspections are carried out and relevant certifications issued. Normally, as the age of a vessel increases, thecost of drydocking increases.
Floating Storage Offloading Unit or FSO—A converted or new build barge or tanker, moored at a location to receivecrude or other products for storage and transfer purposes. FSOs are not equipped with processing facilities.
Handysize Product Carrier—A small size Product Carrier of approximately 29,000 to 53,000 deadweight tons. Thistype of vessel generally operates on shorter routes (short haul). Also, may be referred to as an MR Product Carrier.
International Maritime Organization or IMO—An agency of the United Nations, which is the body that is responsiblefor the administration of internationally developed maritime safety and pollution treaties, including MARPOL.
International Flag vessel—A vessel that is registered under a flag other than that of the U.S.
Jones Act—U.S. law that applies to port-to-port shipments within the continental U.S. and between the continentalU.S. and Hawaii, Alaska, Puerto Rico, and Guam, and restricts such shipments to U.S. Flag Vessels that are built inthe U.S. and that are owned by a U.S. company that is more than 75% owned and controlled by U.S. citizens.
Lightering—The process of off-loading crude oil or petroleum products from large size tankers, typically VLCCs, intosmaller tankers and/or barges for discharge in ports from which the larger tankers are restricted due to the depth ofthe water, narrow entrances or small berths.
LNG Carrier—A vessel designed to carry liquefied natural gas, that is, natural gas cooled to �163� centigrade,turning it into a liquid and reducing its volume to 1/600 of its volume in gaseous form. LNG is the abbreviation forliquefied natural gas.
LR1—A coated Panamax tanker. LR is an abbreviation of Long Range.
LR2—A coated Aframax tanker.
MARPOL—International Convention for the Prevention of Pollution from Ships, 1973, as modified by the Protocol of1978 relating thereto. This convention includes regulations aimed at preventing and minimizing pollution from shipsby accident and by routine operations.
MR—A Handysize Product Carrier. MR is an abbreviation of Medium Range.
OECD—Organization for Economic Cooperation and Development is a group of 30 developed countries in NorthAmerica, Europe and Asia.
OPA 90—OPA 90 is the abbreviation for the U.S. Oil Pollution Act of 1990.
Panamax—A medium size vessel of approximately 53,000 to 80,000 deadweight tons. A coated Panamax operatingin the refined petroleum products trades may be referred to as an LR1.
Product Carrier—General term that applies to any tanker that is used to transport refined oil products, such asgasoline, jet fuel or heating oil.
Pure Car Carrier—A single-purpose vessel with many decks, designed to carry automobiles, which are driven on andoff using ramps.
Safety Management System or SMS—A framework of processes and procedures that addresses a spectrum ofoperational risks associated with quality, environment, health and safety. The SMS is certified by ISM (InternationalSafety Management Code), ISO 9001 (Quality Management) and ISO 14001 (Environmental Management).
Scrapping—The disposal of vessels by demolition for scrap metal.
Shuttle Tanker—A tanker, usually with special fittings for mooring, which lifts oil from offshore fields and transports itto a shore storage or refinery terminal on repeated trips.
Special Survey—An extensive inspection of a vessel by classification society surveyors that must be completed oncewithin every five year period. Special Surveys require a vessel to be drydocked.
Suezmax—A large crude oil tanker of approximately 120,000 to 200,000 deadweight tons. Modern Suezmaxes cangenerally transport about one million barrels of crude oil.
24 Overseas Shipholding Group, Inc.
Technical Management—The management of the operation of a vessel, including physically maintaining the vessel,maintaining necessary certifications, and supplying necessary stores, spares, and lubricating oils. Responsibilitiesalso generally include selecting, engaging and training crew, and arranging necessary insurance coverage.
Time Charter—A Charter under which a customer pays a fixed daily or monthly rate for a fixed period of time for useof the vessel. Subject to any restrictions in the Charter, the customer decides the type and quantity of cargo to becarried and the ports of loading and unloading. The customer pays all voyage expenses such as fuel, canal tolls, andport charges. The shipowner pays all vessel expenses such as the Technical Management expenses.
Time Charter Equivalent or TCE—TCE is the abbreviation for Time Charter Equivalent. TCE revenues, which is voyagerevenues less voyage expenses, serves as an industry standard for measuring and managing fleet revenue andcomparing results between geographical regions and among competitors.
Tonne-mile demand—A calculation that multiplies the average distance of each route a tanker travels by the volumeof cargo moved. The greater the increase in long haul movement compared with shorter haul movements, the higherthe increase in tonne-mile demand.
ULCC—ULCC is an abbreviation for Ultra Large Crude Carrier, a crude oil tanker of more than 350,000 deadweighttons. Modern ULCCs can transport three million barrels of crude oil and are mainly used on the same long haulroutes as VLCCs.
U.S. Flag vessel—A U.S. Flag vessel must be crewed by U.S. sailors, and owned and operated by a U.S. company.
Vessel Expenses—Includes crew costs, vessel stores and supplies, lubricating oils, maintenance and repairs,insurance and communication costs associated with the operations of vessels.
VLCC—VLCC is the abbreviation for Very Large Crude Carrier, a large crude oil tanker of approximately 200,000 to320,000 deadweight tons. Modern VLCCs can generally transport two million barrels or more of crude oil. Thesevessels are mainly used on the longest (long haul) routes from the Arabian Gulf to North America, Europe, and Asia,and from West Africa to the U.S. and Far Eastern destinations.
Voyage Charter—A Charter under which a customer pays a transportation charge for the movement of a specificcargo between two or more specified ports. The shipowner pays all voyage expenses, and all vessel expenses,unless the vessel to which the Charter relates has been time chartered in. The customer is liable for Demurrage, ifincurred.
Voyage Expenses—Includes fuel, port charges, canal tolls, cargo handling operations and brokerage commissionspaid by the Company under Voyage Charters. These expenses are subtracted from shipping revenues to calculateTime Charter Equivalent revenues for Voyage Charters.
Worldscale—Industry name for the Worldwide Tanker Nominal Freight Scale published annually by the WorldscaleAssociation as a rate reference for shipping companies, brokers, and their customers engaged in the bulk shipping ofoil in the international markets. Worldscale is a list of calculated rates for specific voyage itineraries for a standardvessel, as defined, using defined voyage cost assumptions such as vessel speed, fuel consumption and port costs.Actual market rates for voyage charters are usually quoted in terms of a percentage of Worldscale.
Available InformationThe Company makes available free of charge through its internet website, www.osg.com, its Annual Report onForm 10-K, quarterly reports on Form 10-Q, current reports on Form 8-K and amendments to these reports filed orfurnished pursuant to Section 13(a) or 15(d) of the Securities Exchange Act of 1934, as amended, as soon asreasonably practicable after the Company electronically files such material with, or furnishes it to, the Securities andExchange Commission.
The Company also makes available on its website, its corporate governance guidelines, its code of businessconduct, and charters of the Audit Committee, Compensation Committee and Corporate Governance and NominatingCommittee of the Board of Directors.
2010 Annual Report 25

ITEM 1A. RISK FACTORS
The following important risk factors could cause actual results to differ materially from those contained in theforward-looking statements made in this report or presented elsewhere by management from time to time. If any ofthe circumstances or events described below actually arise or occur, the Company’s business, results of operationsand financial condition could be materially adversely affected.
Industry specific risk factors:
The highly cyclical nature of the industry may lead to volatile changes in charter rates and vessel values,which may adversely affect the Company’s earnings
Factors affecting the supply and demand for vessels are outside of the Company’s control, and the nature, timingand degree of changes in industry conditions are unpredictable and may adversely affect the values of theCompany’s vessels and result in significant fluctuations in the amount of charter hire the Company may earn, whichcould result in significant fluctuations in OSG’s quarterly results. The factors that influence the demand for tankercapacity include:
• demand for oil and oil products, which affect the need for vessel capacity;
• global and regional economic and political conditions which among other things, could impact the supply of oil aswell as trading patterns and the demand for various types of vessels;
• changes in the production of crude oil, particularly by OPEC and other key producers, which impact the need forvessel capacity;
• developments in international trade;
• changes in seaborne and other transportation patterns, including changes in the distances that cargoes aretransported;
• environmental concerns and regulations;
• new pipeline construction and expansions;
• weather; and
• competition from alternative sources of energy.
The factors that influence the supply of vessel capacity include:
• the number of newbuilding deliveries;
• the scrapping rate of older vessels;
• the number of vessels that are used for storage or as floating storage offloading service vessels;
• the conversion of vessels from transporting oil and oil products to carrying dry bulk cargo and the reverseconversion;
• the number of vessels that are out of service; and
• environmental and maritime regulations.
An increase in the supply of vessels without a commensurate increase in demand for such vessels couldcause charter rates to remain at depressed levels or to further decline, which could have a material adverseeffect on OSG’s revenues and profitability
OSG depends on spot charters for a significant portion of its revenues. In 2010, 2009 and 2008, OSG derivedapproximately 64%, 49% and 65%, respectively, of its TCE revenues in the spot market.
Historically, the marine transportation industry has been cyclical. The profitability and asset values of companies inthe industry have fluctuated based on changes in the supply and demand of vessels. The supply of vessels generallyincreases with deliveries of new vessels and decreases with the scrapping of older vessels. The newbuilding orderbook equaled 28% of the existing world tanker fleet as of December 31, 2010, a significant percentage but adecrease from 31% as of December 31, 2009.
26 Overseas Shipholding Group, Inc.

If the number of new ships delivered exceeds the number of vessels being scrapped, capacity will increase. Inaddition, vessel supply is affected by the number of vessels that are used for floating storage because vessels thatare used for storage are not available to transport crude oil and petroleum products. Utilization of vessels for storageis affected by expectations of changes in the price of oil and products, such utilization generally increasing if pricesare expected to increase more than storage costs and generally decreasing if they are not. A reduction in vesselutilization for storage, which occurred in 2010 when 81 vessels were released from storage use and reentered thetrading fleet, will increase vessel supply. If supply exceeds demand as it did in 2009 and 2010, the charter rates forthe Company’s vessels could be depressed to levels well below historical averages, which rates would if maintainedover a long period of time have a material adverse effect on OSG’s revenues and profitability.
Although charter rates increased in 2010 they remained significantly below 2008 levels for all tanker classes operatedby OSG.
OSG’s revenues are subject to seasonal variations
OSG operates its tankers in markets that have historically exhibited seasonal variations in demand for tankercapacity, and therefore, charter rates. Charter rates for tankers are typically higher in the fall and winter months as aresult of increased oil consumption in the Northern Hemisphere. Because a majority of the Company’s vessels tradein the spot market, seasonality has affected OSG’s operating results on a quarter-to-quarter basis and could continueto do so in the future. Such seasonality may be outweighed in any period by then current economic conditions ortanker industry fundamentals.
Constraints on capital availability adversely affect the tanker industry and OSG’s business
Constraints on capital that have occurred during recent years have adversely affected the financial condition ofentities throughout the world, including certain of the Company’s customers, joint venture partners, financial lendersand suppliers, including shipyards from whom the Company has contracted to purchase vessels. Those entities thatsuffer a material adverse impact on their financial condition may be unable or unwilling to comply with theircontractual commitments to OSG which, in turn, could have an adverse impact on OSG. The failure of entities tocomply with contractual commitments could include the refusal or inability of customers to pay charter hire to OSG,shipyards’ failure to construct and deliver to OSG newbuilds or joint ventures’ or financial lenders’ inability orunwillingness to honor their commitments, such as to contribute funds to a joint venture with OSG or to lend fundsto OSG. While OSG seeks to monitor the financial condition of such entities, the availability and accuracy ofinformation about the financial condition of such entities may be limited and the actions that OSG may take toreduce possible losses resulting from the failure of such entities to comply with their contractual obligations may berestricted. See also under the heading ‘‘Company specific risk factors’’ below the risk factor concerning credit riskswith counterparties.
Terrorist attacks, piracy and international hostilities and instability can affect the tanker industry, which couldadversely affect OSG’s business
Additional terrorist attacks like those in New York on September 11, 2001 and in London on July 7, 2005, piracyattacks against merchant ships, including oil tankers, particularly in the Gulf of Aden, off the East Coast of Africa,especially Somalia, and the South China sea, the outbreak of war, or the existence of international hostilities could alldamage the world economy, adversely affect the availability of and demand for crude oil and petroleum products andadversely affect the Company’s ability to re-charter its vessels on the expiration or termination of the charters and thecharter rates payable under any renewal or replacement charters.
The Company conducts its operations internationally, and its business, financial condition and results of operationsmay be adversely affected by changing economic, political and government conditions in the countries and regionswhere its vessels are employed, including
• pandemics or epidemics which may result in a disruption of worldwide trade including quarantines of certain areas;
• currency fluctuations;
• the imposition of taxes by flag states, port states and jurisdictions in which OSG or its subsidiaries areincorporated or where its vessels operate; and
• expropriation of its vessels.
2010 Annual Report 27
Moreover, OSG operates in a sector of the economy that is likely to be adversely impacted by the effects of politicalinstability, terrorist or other attacks, war, international hostilities or piracy. These factors could also increase the coststo OSG of conducting its business, particularly crew, insurance and security costs, which could have a materialadverse effect on the Company’s profitability.
The market value of vessels fluctuates significantly, which could adversely affect OSG’s liquidity, result inbreaches of its financing agreements or otherwise adversely affect its financial condition
The market value of vessels has fluctuated over time. The fluctuation in market value of vessels over time is basedupon various factors, including:
• age of the vessel;
• general economic and market conditions affecting the tanker industry, including the availability of vessel financing;
• number of vessels in the world fleet;
• types and sizes of vessels available;
• changes in trading patterns affecting demand for particular sizes and types of vessels;
• cost of newbuildings;
• prevailing level of charter rates;
• competition from other shipping companies;
• other modes of transportation; and
• technological advances in vessel design and propulsion.
Vessel values have declined in the past two years. Although OSG has a modern fleet, as vessels grow older, theygenerally decline in value. These factors will affect the value of the Company’s vessels at the time of any vessel sale.If for any reason, OSG sells a vessel at a time when prices have fallen, the sale may be at less than the vessel’scarrying amount on its financial statements, with the result that the Company would incur a loss on the sale and areduction in earnings and surplus. In addition, declining values of the Company’s vessels could adversely affect theCompany’s liquidity by limiting its ability to raise cash by refinancing vessels. Declining vessel values could also resultin a breach of loan covenants or trigger events of default under relevant financing agreements that require theCompany to maintain certain loan-to-value ratios. In such instances, if OSG is unable or unwilling to pledgeadditional collateral to offset the decline in vessel values, its lenders could accelerate its debt and foreclose on itsvessels pledged as collateral for the loans.
Shipping is a business with inherent risks, and OSG’s insurance may not be adequate to cover its losses
OSG’s vessels and their cargoes are at risk of being damaged or lost because of events such as:
• marine disasters;
• bad weather;
• mechanical failures;
• human error;
• war, terrorism and piracy; and
• other unforeseen circumstances or events.
In addition, transporting crude oil creates a risk of business interruptions due to political circumstances in foreigncountries, hostilities, labor strikes, port closings and boycotts. Any of these events may result in loss of revenues andincreased costs.
The Company carries insurance to protect against most of the accident-related risks involved in the conduct of itsbusiness. OSG currently maintains one billion dollars in coverage for each of its vessels for liability for spillage orleakage of oil or pollution. OSG also carries insurance covering lost revenue resulting from vessel off-hire due tovessel damage. Nonetheless, risks may arise against which the Company is not adequately insured. For example, a
28 Overseas Shipholding Group, Inc.

catastrophic spill could exceed OSG’s insurance coverage and have a material adverse effect on its operations. Inaddition, OSG may not be able to procure adequate insurance coverage at commercially reasonable rates in thefuture, and OSG cannot guarantee that any particular claim will be paid. In the past, new and stricter environmentalregulations have led to higher costs for insurance covering environmental damage or pollution, and new regulationscould lead to similar increases or even make this type of insurance unavailable. Furthermore, even if insurancecoverage is adequate to cover the Company’s losses, OSG may not be able to timely obtain a replacement ship inthe event of a loss. OSG may also be subject to calls, or premiums, in amounts based not only on its own claimrecords but also the claim records of all other members of the P & I Associations through which OSG obtainsinsurance coverage for tort liability. OSG’s payment of these calls could result in significant expenses which wouldreduce its profits or cause losses.
Compliance with environmental laws or regulations, including those relating to the emission of greenhousegases, may adversely affect OSG’s business
The Company’s operations are affected by extensive and changing international, national and local environmentalprotection laws, regulations, treaties, conventions and standards in force in international waters, the jurisdictionalwaters of the countries in which OSG’s vessels operate, as well as the countries of its vessels’ registration. Many ofthese requirements are designed to reduce the risk of oil spills and other pollution and to decrease emission ofgreenhouse gases, and OSG’s compliance with these requirements can be costly.
These requirements can affect the resale value or useful lives of the Company’s vessels, require a reduction incarrying capacity, ship modifications or operational changes or restrictions, lead to decreased availability or highercost of insurance coverage for environmental matters or result in the denial of access to certain jurisdictional watersor ports, or detention in, certain ports. Under local, national and foreign laws, as well as international treaties andconventions, OSG could incur material liabilities, including cleanup obligations, in the event that there is a release ofpetroleum or other hazardous substances from its vessels or otherwise in connection with its operations. OSG couldalso become subject to personal injury or property damage claims relating to the release of or exposure to hazardousmaterials associated with its current or historic operations. Violations of or liabilities under environmental requirementsalso can result in substantial penalties, fines and other sanctions, including in certain instances, seizure or detentionof the Company’s vessels.
OSG could incur significant costs, including cleanup costs, fines, penalties, third-party claims and natural resourcedamages, as the result of an oil spill or other liabilities under environmental laws. The Company is subject to theoversight of several government agencies, including the U.S. Coast Guard, the Environmental Protection Agency andthe Maritime Administration of the U.S. Department of Transportation. OPA 90 affects all vessel owners shipping oil orhazardous material to, from or within the United States. OPA 90 allows for potentially unlimited liability without regardto fault for owners, operators and bareboat charterers of vessels for oil pollution in U.S. waters. Similarly, theInternational Convention on Civil Liability for Oil Pollution Damage, 1969, as amended, which has been adopted bymost countries outside of the United States, imposes liability for oil pollution in international waters. OPA 90expressly permits individual states to impose their own liability regimes with regard to hazardous materials and oilpollution incidents occurring within their boundaries. Coastal states in the United States have enacted pollutionprevention liability and response laws, many providing for unlimited liability.
In addition, in complying with OPA, IMO regulations, EU directives and other existing laws and regulations and thosethat may be adopted, shipowners may incur significant additional costs in meeting new maintenance and inspectionrequirements, in developing contingency arrangements for potential spills and in obtaining insurance coverage.Government regulation of vessels, particularly in the areas of safety and environmental requirements, can beexpected to become more strict in the future and require the Company to incur significant capital expenditures on itsvessels to keep them in compliance, or even to scrap or sell certain vessels altogether.
In recent years, the IMO and EU have both accelerated their existing non double hull phase out schedules inresponse to highly publicized oil spills and other shipping incidents involving companies unrelated to OSG. Futureaccidents can be expected in the industry, and such accidents or other events could be expected to result in theadoption of even stricter laws and regulations, which could limit the Company’s operations or its ability to dobusiness and which could have a material adverse effect on OSG’s business and financial results.
Due to concern over the risk of climate change, a number of countries, including the U.S., and internationalorganizations, including the EU, the IMO and the United Nations, have adopted, or are considering the adoption of,
2010 Annual Report 29
regulatory frameworks to reduce greenhouse gas emissions. These regulatory measures include, among others,adoption of cap and trade regimes, carbon taxes, increased efficiency standards, and incentives or mandates forrenewable energy. Such actions could result in significant financial and operational impacts on the Company’sbusiness, including requiring OSG to install new emission controls, acquire allowances or pay taxes related to itsgreenhouse gas emissions, or administer and manage a greenhouse gas emission program. See the discussion of‘‘Environmental and Security Matters Relating to Bulk Shipping’’ above.
Company specific risk factors:
The Company’s business would be adversely affected if it failed to comply with the Jones Act provisions oncoastwise trade, or if these provisions were repealed and if changes in international trade agreements wereto occur.
The Company is subject to the Jones Act and other federal laws that restrict maritime transportation between pointsin the U.S. (known as marine cabotage services or coastwise trade) to vessels built and registered in the U.S. andowned and manned by U.S. citizens. The Company is responsible for monitoring the foreign ownership of itscommon stock and other interests to insure compliance with the Jones Act. If the Company does not comply withthese restrictions, it would be prohibited from operating its vessels in U.S. coastwise trade, and under certaincircumstances would be deemed to have undertaken an unapproved foreign transfer, resulting in severe penalties,including permanent loss of U.S. coastwise trading rights for the Company’s vessels, fines or forfeiture of the vessels.
In order to ensure compliance with Jones Act citizenship requirements, and in accordance with the certificate ofincorporation and by-laws of the Company, the Board of Directors of the Company adopted a requirement in July1976 that at least 77% (the ‘‘Minimum Percentage’’) of the Company’s common stock must be held by U.S. citizens.While the percentage of U.S. citizenship ownership of the Company’s outstanding common stock fluctuates daily, attimes in the past several years it has declined to the Minimum Percentage. Any purported transfer of common stockin violation of these ownership provisions will be ineffective to transfer the shares of common stock or any voting,dividend or other rights associated with them. The existence and enforcement of this U.S. citizen ownershiprequirement could have an adverse impact on the liquidity or market value of our common stock in the event thatU.S. citizens were unable to transfer shares of our common stock to non-U.S. citizens. Furthermore, under certaincircumstances this ownership requirement could discourage, delay or prevent a change in control of the Company.
Additionally, the Jones Act restrictions on the provision of maritime cabotage services are subject to exceptionsunder certain international trade agreements, including the General Agreement on Trade in Services and the NorthAmerican Free Trade Agreement. If maritime cabotage services were included in the General Agreement on Trade inServices, the North American Free Trade Agreement or other international trade agreements, or if the restrictionscontained in the Jones Act were otherwise repealed or altered, the transportation of maritime cargo between U.S.ports could be opened to international flag or international-manufactured vessels. During the past several years,interest groups have lobbied Congress to repeal the Jones Act to facilitate international flag competition for tradesand cargoes currently reserved for U.S. Flag vessels under the Jones Act and cargo preference laws. The Companybelieves that continued efforts will be made to modify or repeal the Jones Act and cargo preference laws currentlybenefiting U.S. Flag vessels. Because international vessels may have lower construction costs, wage rates andoperating costs, this could significantly increase competition in the coastwise trade, which could have a materialadverse effect on the Company’s business, results of operations and financial condition.
OSG’s financial condition would be materially adversely affected if the shipping income of OSG’s foreignsubsidiaries becomes subject to current taxation in the U.S.
As a result of changes made by the 2004 Act, the Company does not report in taxable income on a current basis theundistributed shipping income earned by its international flag vessels, which in recent years represented substantiallyall of the Company’s pre-tax income. These changes in the 2004 Act were made to make U.S. controlled shippingcompanies competitive with foreign-controlled shipping companies, which are generally incorporated in jurisdictionsin which they either do not pay income taxes or pay minimal income taxes.
The President and several Congressmen and Senators have announced support for ending ‘‘tax breaks forcompanies that ship our jobs overseas and give those tax breaks for companies that create jobs in the United Statesof America’’. While the Company believes that the changes made in the 2004 Act with respect to foreign shipping
30 Overseas Shipholding Group, Inc.

income do not ‘‘ship jobs overseas,’’ and, in fact, have enabled the Company to expand its U.S. Flag fleet and createjobs in the U.S., Congress may decide to repeal the changes made in the 2004 Act with respect to taxation offoreign shipping income for the aforementioned reason or as part of initiatives to reduce the U.S. budget deficit or toreform the U.S. corporate tax regime. Such repeal, either directly or indirectly by limiting or reducing benefits receivedunder the 2004 Act, would have a materially adverse affect on the Company’s business and financial results.
The Company’s substantial debt and charter in commitments could adversely affect its financial condition andwhen OSG’s credit facilities mature, OSG may not be able to refinance or replace them
OSG has substantial debt and debt service requirements. At December 31, 2010, the Company’s consolidated totaldebt was $2.0 billion and its unused borrowing capacity under its revolving credit facility was $1.0 billion (before areduction of $150 million effective February 2011) and its charter in commitments were $1.6 billion.
The amount of the Company’s debt could have important consequences. For example, it could:
• increase OSG’s vulnerability to general adverse economic and industry conditions;
• limit OSG’s ability to fund future capital expenditures, working capital and other general corporate requirements;
• require the Company to dedicate a substantial portion of its cash flow from operations to make interest andprincipal payments on its debt;
• limit OSG’s flexibility in planning for, or reacting to, changes in its business and the shipping industry;
• place OSG at a competitive disadvantage compared with competitors that have less debt or charter-incommitments including by causing OSG to have a lower credit rating; and
• limit OSG’s ability to borrow additional funds, even when necessary to maintain adequate liquidity.
In January 2011, Standard & Poor’s credit agency reduced the Company’s long-term corporate credit rating from BB-to B, citing, among other reasons, the Company’s high debt burden and the significantly reduced earnings caused byprolonged low tanker rates. While Standard & Poor’s stated that it expects OSG to continue to have sufficientliquidity to work through the weak operating environment and to eventually benefit from a recovery in tanker ratesover the next several years, the reduced credit rating may result in the Company incurring increased borrowing costsif the Company enters new credit facilities.
The Company’s debt burden and low tanker rates may adversely affect the availability and terms of debt and equitycapital. When OSG’s indebtedness matures, the Company may need to refinance it and may not be able to do so onfavorable terms or at all. If OSG is able to refinance maturing indebtedness, the terms of any refinancing or alternatecredit arrangements may contain terms and covenants that restrict OSG’s financial and operating flexibility.
OSG may not be able to renew time charters when they expire or enter into new time charters for newbuilds
There can be no assurance that any of the Company’s existing time charters will be renewed at comparable rates orthat it will be successful in entering into new time charters on certain of the newbuilds that will be delivered to theCompany or if renewed or entered into, that they will be at favorable rates. If, upon expiration of the existing timecharters or delivery of newbuilds, OSG is unable to obtain time charters or voyage charters at desirable rates, theCompany’s profitability may be adversely affected.
Delays or cost overruns in building new vessels (including the failure to deliver new vessels), in the scheduledshipyard maintenance of the Company’s vessels, or in rebuilding or conversion of the Company’s vesselscould adversely affect OSG’s results of operations
Building new vessels, scheduled shipyard maintenance or rebuilding or conversion of vessels are subject to risks ofdelay (including the failure to deliver new vessels) or cost overruns caused by one or more of the following:
• financial difficulties of the shipyard building or repairing a vessel, including bankruptcy;
• unforeseen quality or engineering problems;
• work stoppages;
• weather interference;
2010 Annual Report 31

• unanticipated cost increases;
• delays in receipt of necessary materials or equipment;
• changes to design specifications; and
• inability to obtain the requisite permits, approvals or certifications from the U.S. Coast Guard or internationalforeign flag state authorities and the applicable classification society upon completion of work.
Significant delays, cost overruns and failure to deliver new vessels could increase the Company’s expected contractcommitments, which would have an adverse effect on the Company’s revenues, borrowing capacity and results ofoperations. Furthermore, delays would result in vessels being out-of-service for extended periods of time, andtherefore not earning revenue, which could have a material adverse effect on OSG’s financial condition and results ofoperations. The Company’s remedies for losses resulting from shipyards’ failure to comply with their contractualcommitments may be limited by the relevant contracts, including by liquidated damages provisions, such as thosethat limit the amount of monetary damages that may be claimed or that limit the Company’s right to cancellation ofthe building contract. While purchase price payments for newbuild vessels made prior to vessel delivery tointernational shipyards historically have been supported by guarantees from financial institutions, such as banks orinsurance companies, such payments to U.S. shipyards historically have been supported by liens on the work inprogress, including steel and equipment used for constructing the vessel, and not by guarantees from financialinstitutions. If an international shipyard fails to deliver a contracted newbuild vessel for which there is a guarantee,the Company may claim against the guarantee, substantially reducing the risk that the Company will suffer a loss ofits investment. If a U.S. shipyard fails to deliver a contracted vessel, the Company’s investment may be supportedonly by the Company’s liens on the work in progress, which may result in a loss of part or all of the Company’sinvestment.
Termination or change in the nature of OSG’s relationship with any of the pools in which it participates couldadversely affect its business
All of the Company’s VLCCs participate in the Tankers International pool. At December 31, 2010, eleven of OSG’sAframaxes participate in the Aframax International pool. Eight of its crude Panamaxes and three of its PanamaxProduct Carriers participate directly in Panamax International. Participation in these pools enhances the financialperformance of the Company’s vessels as a result of the higher vessel utilization. Any participant in any of thesepools has the right to withdraw upon notice in accordance with the relevant pool agreement. The Company cannotpredict whether the pools in which its vessels operate will continue to exist in the future. In addition, in recent yearsthe EU has published guidelines on the application of the EU antitrust rules to traditional agreements for maritimeservices such as pools. While the Company believes that all the pools it participates in comply with EU rules, therehas been limited administrative and judicial interpretation of the rules. Restrictive interpretations of the guidelinescould adversely affect the ability to commercially market the respective types of vessels in pools.
OSG’s strategy of growing its business in part through acquisitions is capital intensive, time consuming andsubject to a number of inherent risks
Part of OSG’s business strategy is to opportunistically acquire complementary businesses or vessels. The Company’sability to grow its fleets will depend upon a number of factors, many of which the Company cannot control. Thesefactors include OSG’s ability to:
• identify acquisition candidates and joint venture opportunities;
• replace expiring charters-in at comparable rates;
• identify suitable charter-in opportunities;
• consummate acquisitions or joint ventures;
• integrate any acquired vessels or businesses successfully with its existing operations;
• hire and train qualified personnel; and
• obtain required financing.
32 Overseas Shipholding Group, Inc.

OSG’s strategy includes the opportunistic acquisition of quality second hand vessels either directly or throughcorporate acquisitions. Second hand vessels typically do not carry warranties with respect to their condition, whereaswarranties are generally available for newbuildings. While the Company generally inspects all second hand vesselsprior to purchase, such inspections would normally not provide OSG with as much knowledge about vessel conditionas the Company would possess if the vessels had been built for it.
Operating costs and capital expenses will increase as the Company’s vessels age
In general, capital expenditures and other costs necessary for maintaining a vessel in good operating conditionincrease as the age of the vessel increases. Accordingly, it is likely that the operating costs of OSG’s vessels willincrease. In addition, changes in governmental regulations and compliance with Classification Society standards mayrequire OSG to make additional expenditures for new equipment. In order to add such equipment, OSG may berequired to take its vessels out of service. There can be no assurance that market conditions will justify suchexpenditures or enable OSG to operate its older vessels profitably during the remainder of their economic lives.
Certain potential customers will not use vessels older than a specified age, even if they have been recentlyrebuilt
All of the Company’s existing ATBs with the exception of the OSG Vision/OSG 350 were originally constructed morethan 25 years ago. While all of these tug-barge units were rebuilt and double-hulled since 1998 and are ‘‘in-class,’’meaning the vessel has been certified by a classification society as being built and maintained in accordance withthe rules of that classification society and complies with the applicable rules and regulations of the vessel’s countryof registry and applicable international conventions, some potential customers have stated that they will not chartervessels that are more than 20 years old, even if they have been rebuilt. Although there has to date been no materialdifference in time charter rates earned by a vessel of a specified age and a rebuilt vessel of the same age measuredfrom the date of rebuilding, no assurance can be given that customers will continue to view rebuilt vessels ascomparable to newbuild vessels. If more customers differentiate between rebuilt and newbuild vessels, time charterrates for our rebuilt ATBs will likely be adversely affected or they may not be employable.
In the highly competitive international market, OSG may not be able to effectively compete for charters withcompanies with greater resources
The Company’s vessels are employed in a highly competitive market. Competition arises from other vessel owners,including major oil companies, which may have substantially greater resources than OSG does. Competition for thetransportation of crude oil and other petroleum products depends on price, location, size, age, condition, and theacceptability of the vessel operator to the charterer. The Company believes that because ownership of the worldtanker fleet is highly fragmented, no single vessel owner is able to influence charter rates. To the extent OSG entersinto new geographic regions or provides new services, it may not be able to compete profitably. New markets mayinvolve competitive factors that differ from those of the Company’s current markets, and the competitors in thosemarkets may have greater financial strength and capital resources than OSG does.
Trading and complementary hedging activities in Forward Freight Agreements (‘‘FFAs’’) subject the Companyto trading risks and the Company may suffer trading losses that reduce earnings
Due to shipping market volatility, success in this industry requires constant adjustment of the balance betweenchartering out vessels for long periods of time and trading them on a spot basis. The Company seeks to manage andmitigate that risk through trading and complementary hedging activities in forward freight agreements, or FFAs.However, there is no assurance that the Company will be able at all times to successfully protect itself from volatilityin the shipping market. The Company may not successfully mitigate its risks, leaving it exposed to unprofitablecontracts and may suffer trading losses that reduce earnings and surplus.
The Company is subject to certain credit risks with respect to its counterparties on contracts and failure ofsuch counterparties to meet their obligations could cause the Company to suffer losses on such contracts,decreasing revenues and earnings
The Company charters its vessels to other parties, who pay the Company a daily rate of hire. The Company alsoenters into COAs and Voyage Charters. As OSG increases the portion of its revenues from time charters, it increases
2010 Annual Report 33

its reliance on the ability of time charterers to pay charter hire, especially when spot market rates are less thanpreviously agreed upon time charter rates. Historically, the Company has not experienced material problemscollecting charter hire but the global economic downturn of recent years has affected charterers more severely thanthe prior recessions that have occurred since the Company’s establishment more than 40 years ago. The Companyalso time charters or bareboat charters some of its vessels from other parties and its continued use and operation ofsuch vessels depends on the vessel owners’ compliance with the terms of the time charter or bareboat charter.Additionally, the Company enters into derivative contracts (FFAs, bunker swaps, interest rate swaps and foreigncurrency contracts). All of these contracts subject the Company to counterparty credit risk. As a result, the Companyis subject to credit risks at various levels, including with charterers or cargo interests. If the counterparties fail tomeet their obligations, the Company could suffer losses on such contracts which would decrease revenues andearnings.
As the Company expands its business, it will need to improve its operations and financial systems, and recruitadditional staff and crew; if it cannot improve these systems or recruit suitable employees, it may noteffectively control its operations
The Company’s current operating and financial systems may not be adequate as it implements its plan to expand,and its attempts to improve these systems may be ineffective. If the Company is unable to operate its financial andoperations systems effectively or to recruit suitable employees for its vessels and offices as it expands its operations,it may be unable to effectively control and manage substantially larger operations. Although it is impossible to predictwhat errors might occur as the result of inadequate controls, it is the case that it is harder to oversee a sizableoperation and, accordingly, more likely that errors will occur as operations grow and that additional managementinfrastructure and systems will be required to attempt to avoid such errors.
OSG’s vessels call on ports located in countries that are subject to restrictions imposed by the U.S.government, which could negatively affect the trading price of the Company’s common stock
From time to time, vessels in OSG’s fleet call on ports located in countries subject to sanctions and embargoesimposed by the U.S. government and countries identified by the U.S. government as state sponsors of terrorism,such as Iran. Although these sanctions and embargoes do not prevent OSG’s vessels from making calls to ports inthese countries, potential investors could view such port calls negatively, which could adversely affect the Company’sreputation and the market for its common stock.
OSG depends on its key personnel and may have difficulty attracting and retaining skilled employees
OSG’s success depends to a significant extent upon the abilities and efforts of its key personnel. The loss of theservices of any of the Company’s key personnel or its inability to attract and retain qualified personnel in the futurecould have a material adverse effect on OSG’s business, financial condition and operating results.
The Company may face unexpected drydock costs for its vessels
Vessels must be drydocked periodically. The cost of repairs and renewals required at each drydock are difficult topredict with certainty and can be substantial. The Company’s insurance does not cover these costs. In addition,vessels may have to be drydocked in the event of accidents or other unforeseen damage. OSG’s insurance may notcover all of these costs. Large drydocking expenses could adversely affect the Company’s financial results.
Maritime claimants could arrest OSG’s vessels, which could interrupt its cash flow
Crew members, suppliers of goods and services to a vessel, shippers of cargo and other parties may be entitled to amaritime lien against that vessel for unsatisfied debts, claims or damages. In many jurisdictions, a maritime lienholder may enforce its lien by arresting a vessel through foreclosure proceedings. The arrest or attachment of one ormore of the Company’s vessels could interrupt OSG’s cash flow and require it to pay a significant amount of moneyto have the arrest lifted. In addition, in some jurisdictions, such as South Africa, under the ‘‘sister ship’’ theory ofliability, a claimant may arrest both the vessel that is subject to the claimant’s maritime lien and any ‘‘associated’’vessel, which is any vessel owned or controlled by the same owner. Claimants could try to assert ‘‘sister ship’’liability against one vessel in the Company’s fleet for claims relating to another vessel in its fleet.
34 Overseas Shipholding Group, Inc.

ITEM 1B. UNRESOLVED STAFF COMMENTS
None.
ITEM 2. PROPERTIES
Vessels:
At December 31, 2010, the Company owned or operated (including newbuilds) an aggregate of 122 vessels. Seetables presented under Item 1. Additional information about the Company’s fleet is set forth on the Company’swebsite, www.osg.com.
ITEM 3. LEGAL PROCEEDINGS
The Company is a party, as plaintiff or defendant, to various suits in the ordinary course of business for monetaryrelief arising principally from personal injuries, collision or other casualty and to claims arising under charter parties.All such personal injury, collision or other casualty claims against the Company are fully covered by insurance(subject to deductibles not material in amount). Each of the claims involves an amount which, in the opinion ofmanagement, is not material to the Company’s financial position, results of operations and cash flows.
Executive Officers of the Registrant
Name Age Position Held Has Served as Such Since
Morten Arntzen 55 President and Chief Executive Officer January 2004
Myles R. Itkin 63 Executive Vice President, June 2006Chief Financial Officer and Treasurer June 1995
Mats H. Berglund 48 Senior Vice President and Head of International Crude September 2005Transportation Strategic Business Unit
Ian T. Blackley 56 Senior Vice President, May 2009Head of International Shipping and January 2009Managing Director and Chief Operating Officer, OSG September 2005Ship Management (UK) Ltd.
James I. Edelson 54 Senior Vice President, March 2010General Counsel and January 2005Secretary March 2005
Robert E. Johnston 63 Senior Vice President and October 1998Head of U.S. Strategic Business Unit January 2009
Lois K. Zabrocky 41 Senior Vice President and June 2008Head of International Product Carrier and Gas September 2005Strategic Business Unit
George Dienis 58 Managing Director and Chief Operating Officer, OSG January 2005Ship Management (GR) Ltd.
Robert R. Mozdean 57 Head of Worldwide Human Resources August 2005
Janice K. Smith 49 Chief Risk Officer February 2010
The term of office of each executive officer continues until the first meeting of the Board of Directors of the Companyimmediately following the next annual meeting of its stockholders, to be held on June 7, 2011, and until the electionand qualification of his or her successor. There is no family relationship between the executive officers.
Mr. Itkin served as Senior Vice President for at least five years prior to his appointment as Executive Vice President.Mr. Johnston served as Head of Shipping Operations from September 2005 until his appointment as Head of theU.S. Strategic Business Unit in January 2009. Ms. Smith served as Deputy General Counsel of the Company sinceJuly 2007. For at least three years prior to joining the Company, Ms. Smith was a corporate partner at ProskauerRose LLP, where her practice focused on advising clients on a variety of corporate finance transactions.
2010 Annual Report 35

PART II
ITEM 5. MARKET FOR REGISTRANT’S COMMON EQUITY, RELATED STOCKHOLDER MATTERS AND ISSUERPURCHASES OF EQUITY SECURITIES
(a) The Company’s common stock is listed for trading on the New York Stock Exchange under the trading symbolOSG. The range of high and low closing sales prices of the Company’s common stock as reported on the NewYork Stock Exchange for each of the quarters during the last two years are set forth below.
2010 High Low
(In dollars)First Quarter 51.39 39.23Second Quarter 53.13 35.49Third Quarter 42.34 31.89Fourth Quarter 37.80 32.73
2009 High Low
First Quarter 46.18 21.02Second Quarter 43.29 23.94Third Quarter 41.10 29.70Fourth Quarter 46.02 35.59
(b) On February 22, 2011, there were 510 stockholders of record of the Company’s common stock.
(c) In June 2008, OSG increased its annual dividend by 40% to $1.75 per share from $1.25 per share of commonstock. Subsequent thereto, the Company has paid ten regular quarterly dividends of $0.4375 per share ofcommon stock. Prior to the above change, the Company paid regular quarterly dividends of $0.3125 per share ofcommon stock subsequent to June 2007, regular quarterly dividends of $0.25 per share of common stockbetween April 2006 and June 2007 and $0.175 per share of common stock prior to April 2006. The payment ofcash dividends in the future will depend upon the Company’s operating results, cash flow, working capitalrequirements and other factors deemed pertinent by the Company’s Board of Directors.
36 Overseas Shipholding Group, Inc.

14APR201113571181
STOCKHOLDER RETURN PERFORMANCE PRESENTATION
Set forth below is a line graph for the five years ended December 31, 2010 comparing the yearly percentage changein the cumulative total stockholder return on the Company’s common stock against the cumulative return of thepublished Standard and Poor’s 500 index, a peer group index consisting of Frontline Ltd., Teekay Corporation,General Maritime Corporation, Kirby Corporation, Seacor Holdings Inc., Tsakos Energy Navigation Limited and theCompany referred to as the peer group index. The companies in this peer group index consist of those corporationsused for determining vesting of performance share units for the Company’s senior management whose stock hasbeen publicly traded in the U.S. for at least five years. The Company believes that this peer group index is relevantfor comparative purposes.
STOCK PERFORMANCE GRAPHCOMPARISON OF FIVE YEAR CUMULATIVE TOTAL RETURN*
THE COMPANY, S&P 500 INDEX, PEER GROUP INDEX
$50
$100
$150
$200
$250
$300
12/31/2005 12/31/201012/31/2009
Corporation S&P 500 Index Peer Group Index
12/31/2006 12/31/2007 12/31/2008
VAL
UE
OF
$10
0 IN
VE
ST
ED
ON
12/
31/0
5
* Assumes that the value of the investment in the Company’s common stock and each index was $100 onDecember 31, 2005 and that all dividends were reinvested.
2010 Annual Report 37

During June 2006, the Board approved a repurchase program, authorizing $300,000,000 to be expended on therepurchase of common stock. On April 24, 2007, the OSG’s Board of Directors authorized, and the Company agreedto purchase all of the outstanding shares of the Company’s common stock held by Archer- Daniels-MidlandCompany (‘‘ADM’’), or 5,093,391 shares, at $65.42 per share. In addition, on April 24, 2007, the Board of Directorsauthorized a new share repurchase program of $200,000,000, which replaced the prior $300,000,000 sharerepurchase program. The Company completed the 2007 repurchase program in the second quarter of 2008. OnJune 9, 2008, a new share purchase program of $250,000,000 was authorized by the Board of Directors. Total sharesrepurchased to date under all of the above authorities, aggregates approximately $826,465,000, or 13,062,100shares.
ITEM 6. SELECTED FINANCIAL DATA
The following unaudited selected consolidated financial data for the years ended December 31, 2010, 2009 and2008, and at December 31, 2010 and 2009, are derived from the audited consolidated financial statements of theCompany set forth in Item 8, which have been audited by PricewaterhouseCoopers (2010 and 2009) and Ernst &Young LLP (2008), independent registered public accounting firms. The unaudited selected consolidated financialdata for the years ended December 31, 2007 and 2006, and at December 31, 2008, 2007 and 2006, are derived fromaudited consolidated financial statements of the Company not appearing in this Annual Report, which have beenaudited by Ernst & Young LLP.
In thousands, except per share amounts 2010 2009 2008 2007 2006
Shipping revenues $1,045,610 $1,093,618 $1,704,697 $1,129,305 $1,047,403(Loss)/Income from vessel operations (79,295) 77,130 345,186 207,572 378,544(Loss)/Income before income taxes (141,699) 34,450 271,182 217,186 384,473Net (loss)/income attributable to OverseasShipholding Group, Inc. (134,243) 70,170 317,665 211,310 392,660Depreciation and amortization 170,670 172,404 189,163 185,499 141,940Net cash (used by)/provided by operatingactivities (27,714) 218,121 376,337 167,624 445,975Total vessels, deferred drydock and otherproperty, at net book amount (a) 3,245,515 3,000,768 2,818,060 2,797,023 2,583,370Total assets 4,241,103 4,208,441 3,890,061 4,158,917 4,230,669Debt—long-term debt and capital leaseobligations (exclusive of short-term debt andcurrent portions) (b) 1,941,583 1,813,289 1,396,135 1,531,334 1,306,947Reserve for deferred income taxes andunrecognized tax benefits—noncurrent 214,188 205,295 196,815 230,924 234,269Total equity 1,810,143 1,867,855 1,824,633 1,950,495 2,207,311Debt/total capitalization 51.8% 49.3% 43.3% 44.0% 37.2%Per share amounts:Basic net (loss)/income attributable toOverseas Shipholding Group, Inc. (4.55) 2.61 10.71 6.19 9.94Diluted net (loss)/income attributable toOverseas Shipholding Group, Inc. (4.55) 2.61 10.65 6.16 9.92Overseas Shipholding Group, Inc.’s equity 59.53 69.55 64.07 58.47 56.27Cash dividends paid 1.75 1.75 1.50 1.125 0.925Average shares outstanding for basic earningsper share 29,498 26,864 29,648 34,136 39,515Average shares outstanding for dilutedearnings per share 29,498 26,869 29,814 34,327 39,586Other data:Time charter equivalent revenues (c) 853,278 952,621 1,545,385 1,039,211 992,817EBITDA (d) 96,015 251,002 530,273 476,332 595,065
(a) Includes vessels held for sale of $3,305 and $53,975 at December 31 2010 and 2008, respectively.
(b) Amounts do not include debt of affiliated companies in which the Company participates.
38 Overseas Shipholding Group, Inc.

(c) Reconciliations of time charter equivalent revenues to shipping revenues as reflected in the consolidated statements of operations follow:
In thousands for the year ended December 31, 2010 2009 2008 2007 2006
Time charter equivalent revenues $ 853,278 $ 952,621 $1,545,385 $1,039,211 $ 992,817Add: Voyage expenses 192,332 140,997 159,312 90,094 54,586
Shipping revenues $1,045,610 $1,093,618 $1,704,697 $1,129,305 $1,047,403
Consistent with general practice in the shipping industry, the Company uses time charter equivalent revenues, which represents shippingrevenues less voyage expenses, as a measure to compare revenue generated from a voyage charter to revenue generated from a timecharter. Time charter equivalent revenues, a non-GAAP measure, provides additional meaningful information in conjunction with shippingrevenues, the most directly comparable GAAP measure, because it assists Company management in making decisions regarding thedeployment and use of its vessels and in evaluating their financial performance.
(d) EBITDA represents operating earnings excluding net income/(loss) attributable to the noncontrolling interest, which is before interestexpense and income taxes, plus other income/(expense) and depreciation and amortization expense. EBITDA is presented to provideinvestors with meaningful additional information that management uses to monitor ongoing operating results and evaluate trends overcomparative periods. EBITDA should not be considered a substitute for net income/(loss) attributable to the Company or cash flow fromoperating activities prepared in accordance with accounting principles generally accepted in the United States or as a measure ofprofitability or liquidity. While EBITDA is frequently used as a measure of operating results and performance, it is not necessarilycomparable to other similarly titled captions of other companies due to differences in methods of calculation.
The following table reconciles net (loss)/income attributable to the Company, as reflected in the consolidated statements of operations, toEBITDA:
In thousands for the year ended December 31, 2010 2009 2008 2007 2006
Net (loss)/income attributable to Overseas Shipholding Group, Inc. $(134,243) $ 70,170 $317,665 $211,310 $392,660Income tax (benefit)/provision (7,456) (36,697) (34,004) 4,827 (8,187)Interest expense 67,044 45,125 57,449 74,696 68,652Depreciation and amortization 170,670 172,404 189,163 185,499 141,940
EBITDA $ 96,015 $251,002 $530,273 $476,332 $595,065
ITEM 7. MANAGEMENT’S DISCUSSION AND ANALYSIS OF FINANCIAL CONDITION AND RESULTS OFOPERATIONS
GENERALThe Company is one of the largest independent bulk shipping companies in the world. The Company’s operating fleetas of December 31, 2010, consisted of 111 vessels aggregating 11.3 million dwt and 864,800 cbm, including 48vessels that have been chartered-in under operating leases. In addition to its operating fleet of 111 vessels,charters-in for two vessels are scheduled to commence upon delivery of the vessels in 2011 and nine newbuilds arescheduled for delivery between 2011 and 2013, bringing the total operating and newbuild fleet to 122 vessels.
COMPLETION OF TENDER OFFER FOR OSG AMERICA L.P.On November 5, 2009, OSG initiated a tender offer for the 6,999,565 outstanding publicly held common units of OSGAmerica L.P., a Delaware limited partnership formed by the Company, for $10.25 in cash per unit. At the time of thetender offer, the Company effectively owned 77.1% of OSG America L.P. The number of common units (‘‘Units’’)validly tendered in the initial offering period satisfied the non-waivable condition that more than 4,003,166 Units bevalidly tendered, such that OSG owned more than 80% of the outstanding Units. OSG exercised its right pursuant toSection 15.01 of the amended and restated limited partnership agreement of the partnership to purchase all of theremaining Units that were not tendered in the Offer and acquired the remaining outstanding Units on December 17,2009. As a result, the Company became the owner of 100% of OSG America L.P. The Company financed thepurchase price of $71,792,000 through funds drawn under its $1.8 billion credit facility.
OPERATIONSThe Company’s revenues are highly sensitive to patterns of supply and demand for vessels of the size and designconfigurations owned and operated by the Company and the trades in which those vessels operate. Rates for thetransportation of crude oil and refined petroleum products from which the Company earns a substantial majority of itsrevenue are determined by market forces such as the supply and demand for oil, the distance that cargoes must betransported, and the number of vessels expected to be available at the time such cargoes need to be transported.The demand for oil shipments is significantly affected by the state of the global economy and level of OPEC’sexports. The number of vessels is affected by newbuilding deliveries and by the removal of existing vessels fromservice, principally because of scrappings or conversions. The Company’s revenues are also affected by the mix of
2010 Annual Report 39

charters between spot (Voyage Charter) and long-term (Time or Bareboat Charter). Because shipping revenues andvoyage expenses are significantly affected by the mix between voyage charters and time charters, the Companymanages its vessels based on TCE revenues. Management makes economic decisions based on anticipated TCErates and evaluates financial performance based on TCE rates achieved.
OverviewAverage freight rates based on fixtures executed in 2010 for VLCCs, Suezmaxes, Aframaxes, Panamaxes andProduct Carriers were at depressed levels, although somewhat higher then they were in 2009. Rates in 2010 were stillsignificantly below 2008 levels for all tanker classes operated by the Company. Rates during 2010 were adverselyimpacted by the excess tonnage that existed at the beginning of the year. The decline in oil demand in OECD areasin 2009 of over 2 million barrels per day (‘‘b/d’’) resulted in a reduction in longer-haul crude movements from theMiddle East to the U.S., Europe and Japan as well as a decline in movements from West Africa to the U.S., reducingtonne-mile demand. This occurred concurrently with an increase of about 6% in the tanker fleet size in 2009.
Following the 2009 global economic downturn, based on reports issued by the International Monetary Fund (‘‘IMF’’),the world’s GDP grew by approximately 4.8% during 2010. Economic growth occurred in all the major regions in theworld, but was particularly strong in developing countries in Asia and Latin America. This resulted in an increase inworld oil demand of approximately 2.8 million b/d to 87.8 million b/d from 85.0 million b/d in 2009, the secondlargest demand increase in the last 30 years, exceeded only by the 3.1 million b/d increase that occurred in 2004. Oildemand increased by about 2.1 million b/d in non-OECD areas, led by an increase of approximately one million b/din China.
Higher oil demand in the U.S., China and Other Asia spurred an increase in refinery utilization and throughput levels.Refinery utilization in the U.S. averaged 86% during 2010, 3% higher than in 2009. Refining runs in China averaged8.5 million b/d, an increase of one million b/d over 2009. Refinery throughput volumes increased by approximately550,000 b/d in Other Asia as new refining capacity was added to meet growing local demand for oil products. Theincrease in refining runs in Asia was a major driving force behind the increase in tonne-mile demand in 2010.
The increase in oil demand in 2010 was met by a combination of higher production and inventory drawdowns fromboth onshore and offshore sources, including a significant reduction in products and crude oil held in floatingstorage, which had a negative impact on tonne-mile demand. Approximately 40%, or 1.2 million b/d, of the demandincrease, was met from higher non-OPEC production levels. An approximately one million b/d increase in OPECproduction of crude oil and Natural Gas Liquids (‘‘NGLs’’) and the drawdown in world inventory levels satisfied theremaining increase in oil demand growth.
Onshore inventory levels in OECD areas remained relatively constant as a decline in Europe was offset by increasesin Japan and in the U.S. The main source of the inventory drawdown in 2010 was the release of products and crudeoil being stored in tankers. At the end of 2009, there were approximately 118 tankers of various sizes that were usedglobally to store clean products and 18 VLCCs used to hold crude oil. As oil prices increased during 2010, the oilprice contango narrowed to the point where it became uneconomical for tankers to store products or crude oil.Products held in floating storage were then discharged, resulting in lower refining utilization levels that reduced crudeoil and product tanker demand and adversely impacted 2010 tonne-mile demand. By the third quarter, a significantnumber of tankers that were being used as floating storage had discharged their cargoes and reentered the tradingfleet. At the end of 2010, there were only 30 non-VLCC tankers being utilized to store clean products and 25 VLCCsbeing used to hold crude oil and products. The reentry of these 81 vessels into the trading fleet had a significantadverse impact on freight rates.
There was a significant difference between the actual number of tanker deliveries that occurred during 2010 andClarkson’s forecast at the beginning of the year. Crude and Product Carrier deliveries were reduced by about 30%and 45%, respectively, from that original Clarkson’s forecast, because of delays and cancellations that took placeduring the year. Nevertheless, the size of the world tanker fleet increased by approximately 4.0% during 2010 asadditions were only partially offset by the scrapping of single-hull tonnage in accordance with the IMO phase-outmandate. The Aframax fleet realized the largest net increase in tonnage of 6.3% while the Product Carrier fleetremained basically unchanged. There are still single hull vessels (primarily product tankers) being used in themarketplace but these tankers should be marginalized as oil companies and charterers increasingly demand that onlydouble hull tankers be used to carry their cargoes and call at their facilities. The total world tanker orderbook at theend of 2010 represented 29% of the total fleet, based on deadweight tons (‘‘dwt’’), down from 31% at the end of2009.
40 Overseas Shipholding Group, Inc.
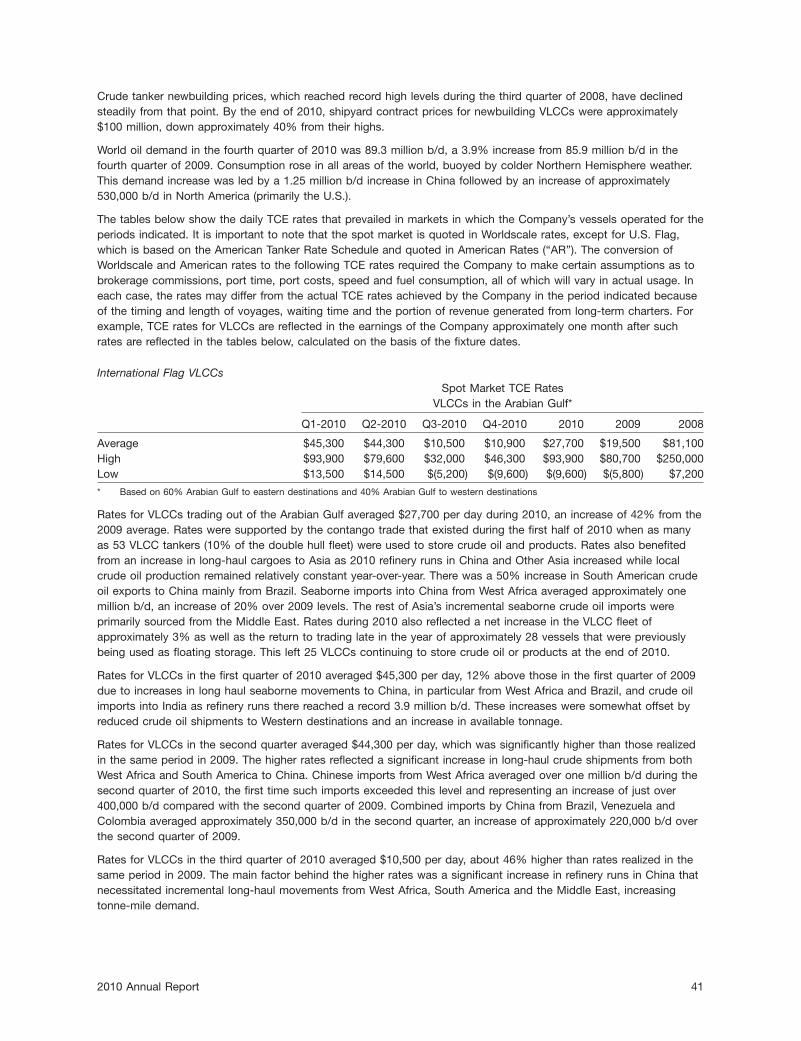
Crude tanker newbuilding prices, which reached record high levels during the third quarter of 2008, have declinedsteadily from that point. By the end of 2010, shipyard contract prices for newbuilding VLCCs were approximately$100 million, down approximately 40% from their highs.
World oil demand in the fourth quarter of 2010 was 89.3 million b/d, a 3.9% increase from 85.9 million b/d in thefourth quarter of 2009. Consumption rose in all areas of the world, buoyed by colder Northern Hemisphere weather.This demand increase was led by a 1.25 million b/d increase in China followed by an increase of approximately530,000 b/d in North America (primarily the U.S.).
The tables below show the daily TCE rates that prevailed in markets in which the Company’s vessels operated for theperiods indicated. It is important to note that the spot market is quoted in Worldscale rates, except for U.S. Flag,which is based on the American Tanker Rate Schedule and quoted in American Rates (‘‘AR’’). The conversion ofWorldscale and American rates to the following TCE rates required the Company to make certain assumptions as tobrokerage commissions, port time, port costs, speed and fuel consumption, all of which will vary in actual usage. Ineach case, the rates may differ from the actual TCE rates achieved by the Company in the period indicated becauseof the timing and length of voyages, waiting time and the portion of revenue generated from long-term charters. Forexample, TCE rates for VLCCs are reflected in the earnings of the Company approximately one month after suchrates are reflected in the tables below, calculated on the basis of the fixture dates.
International Flag VLCCsSpot Market TCE Rates
VLCCs in the Arabian Gulf*
Q1-2010 Q2-2010 Q3-2010 Q4-2010 2010 2009 2008
Average $45,300 $44,300 $10,500 $10,900 $27,700 $19,500 $81,100High $93,900 $79,600 $32,000 $46,300 $93,900 $80,700 $250,000Low $13,500 $14,500 $(5,200) $(9,600) $(9,600) $(5,800) $7,200
* Based on 60% Arabian Gulf to eastern destinations and 40% Arabian Gulf to western destinations
Rates for VLCCs trading out of the Arabian Gulf averaged $27,700 per day during 2010, an increase of 42% from the2009 average. Rates were supported by the contango trade that existed during the first half of 2010 when as manyas 53 VLCC tankers (10% of the double hull fleet) were used to store crude oil and products. Rates also benefitedfrom an increase in long-haul cargoes to Asia as 2010 refinery runs in China and Other Asia increased while localcrude oil production remained relatively constant year-over-year. There was a 50% increase in South American crudeoil exports to China mainly from Brazil. Seaborne imports into China from West Africa averaged approximately onemillion b/d, an increase of 20% over 2009 levels. The rest of Asia’s incremental seaborne crude oil imports wereprimarily sourced from the Middle East. Rates during 2010 also reflected a net increase in the VLCC fleet ofapproximately 3% as well as the return to trading late in the year of approximately 28 vessels that were previouslybeing used as floating storage. This left 25 VLCCs continuing to store crude oil or products at the end of 2010.
Rates for VLCCs in the first quarter of 2010 averaged $45,300 per day, 12% above those in the first quarter of 2009due to increases in long haul seaborne movements to China, in particular from West Africa and Brazil, and crude oilimports into India as refinery runs there reached a record 3.9 million b/d. These increases were somewhat offset byreduced crude oil shipments to Western destinations and an increase in available tonnage.
Rates for VLCCs in the second quarter averaged $44,300 per day, which was significantly higher than those realizedin the same period in 2009. The higher rates reflected a significant increase in long-haul crude shipments from bothWest Africa and South America to China. Chinese imports from West Africa averaged over one million b/d during thesecond quarter of 2010, the first time such imports exceeded this level and representing an increase of just over400,000 b/d compared with the second quarter of 2009. Combined imports by China from Brazil, Venezuela andColombia averaged approximately 350,000 b/d in the second quarter, an increase of approximately 220,000 b/d overthe second quarter of 2009.
Rates for VLCCs in the third quarter of 2010 averaged $10,500 per day, about 46% higher than rates realized in thesame period in 2009. The main factor behind the higher rates was a significant increase in refinery runs in China thatnecessitated incremental long-haul movements from West Africa, South America and the Middle East, increasingtonne-mile demand.
2010 Annual Report 41

Fourth quarter rates declined approximately 36% compared with the fourth quarter of 2009, but were slightly aboverates in the third quarter of 2010. The impact of the increase in world oil demand relative to the fourth quarter of2009 was more than offset by the entry of additional tonnage into the marketplace and an inventory drawdown thatreduced tanker requirements during the fourth quarter of 2010.
OPEC crude oil production in the fourth quarter of 2010 averaged approximately 29.5 million b/d, which was 600,000b/d above levels in the fourth quarter of 2009. Additionally, Brazil increased exports to both Asia and the U.S. byapproximately 100,000 b/d relative to the same timeframe in 2009
Refinery runs in China reached a record level of 9.1 million b/d in December and averaged 8.9 million b/d in thefourth quarter of 2010, spurred by strong demand for diesel oil. Diesel demand rose primarily due to the increaseduse of generators following power rationing by the Chinese Government as it tried to meet emission targets in itscurrent five-year plan. Higher refinery runs in China were somewhat offset by lower refinery throughput levels in Indiadue to maintenance activities.
The world VLCC fleet stood at 526 tankers (159.7 million dwt) at December 31, 2010. The VLCC fleet included 23single hull tankers representing about 5% of the trading fleet. The year-end 2010 VLCC orderbook totaled 191vessels (59.9 million dwt) representing 38% of the existing VLCC fleet, based on deadweight tons.
International Flag SuezmaxesSpot Market TCE Rates
Suezmaxes in the Atlantic*
Q1-2010 Q2-2010 Q3-2010 Q4-2010 2010 2009 2008
Average $30,500 $30,000 $10,500 $17,200 $22,000 $21,000 $59,800High $64,000 $50,000 $21,000 $31,000 $64,000 $49,200 $140,000Low $16,400 $16,000 $4,000 $4,900 $4,000 $2,000 $18,400
* Rates based on West Africa to the U.S. Gulf Coast
Average rates for Suezmax tankers in 2010 increased 5% from 2009, benefiting primarily from incremental crude oilmovements from North Africa to both China and the U.S. and from Brazil to U.S. Gulf Coast refiners. However, thesepositive factors were offset by a more than 5% net increase in the Suezmax fleet and the return to trading in early2010 of 20 Suezmax tankers that were previously used for floating storage.
Rates during the first quarter averaged $30,500 per day, approximately 19% less than the corresponding year agoquarter due primarily to an increase in the size of the Suezmax fleet and to a reduction in crude oil exports fromRussian ports. Higher domestic demand in Russia combined with maintenance at Primorsk and stormy weather inthe Black Sea were the main factors behind the decline. In addition, Russia began to redirect its crude exports awayfrom its Western ports to its Pacific Coast port of Kozmino to meet the growing demand for oil in the Pacific Basin,which is primarily an Aframax trade.
Rates in the second quarter of 2010 averaged $30,000 per day, 70% higher than rates in the second quarter of 2009.An increase in Nigerian crude oil production of approximately 200,000 b/d resulted in increased shipments to the U.S.Suezmax demand out of the Black Sea declined due to the opening of Russia’s new Kozmino terminal.
Third quarter 2010 rates were approximately 10% higher than the comparable period in 2009 as Nigerian crude oilproduction reached 2.1 million b/d, about 400,000 b/d higher than the same period in 2009. Consequently, U.S.imports of Nigerian crude rose by approximately 17% compared with the third quarter of 2009. Most of this increasewent to the U.S. East Coast and was carried primarily in Suezmaxes. This positive factor was offset by thesimultaneous entry into the marketplace of both newbuildings and tankers previously used for storage that createdmore-than-ample tonnage availability and forced some owners to employ their tankers at below cash breakevenlevels.
Fourth quarter rates averaged $17,200 per day, approximately 10% below those in the fourth quarter of 2009 despitetight tonnage balances caused by transit delays in the Bosporus Straits of approximately three weeks. Significantcompetition from VLCCs for West African OPEC cargoes weighed on rates in both of these sectors. Additionally,there were no Suezmax tankers used for floating storage in the fourth quarter of 2010 compared with approximately20 Suezmax newbuildings that were used as floating storage for clean products in the fourth quarter of 2009.
42 Overseas Shipholding Group, Inc.
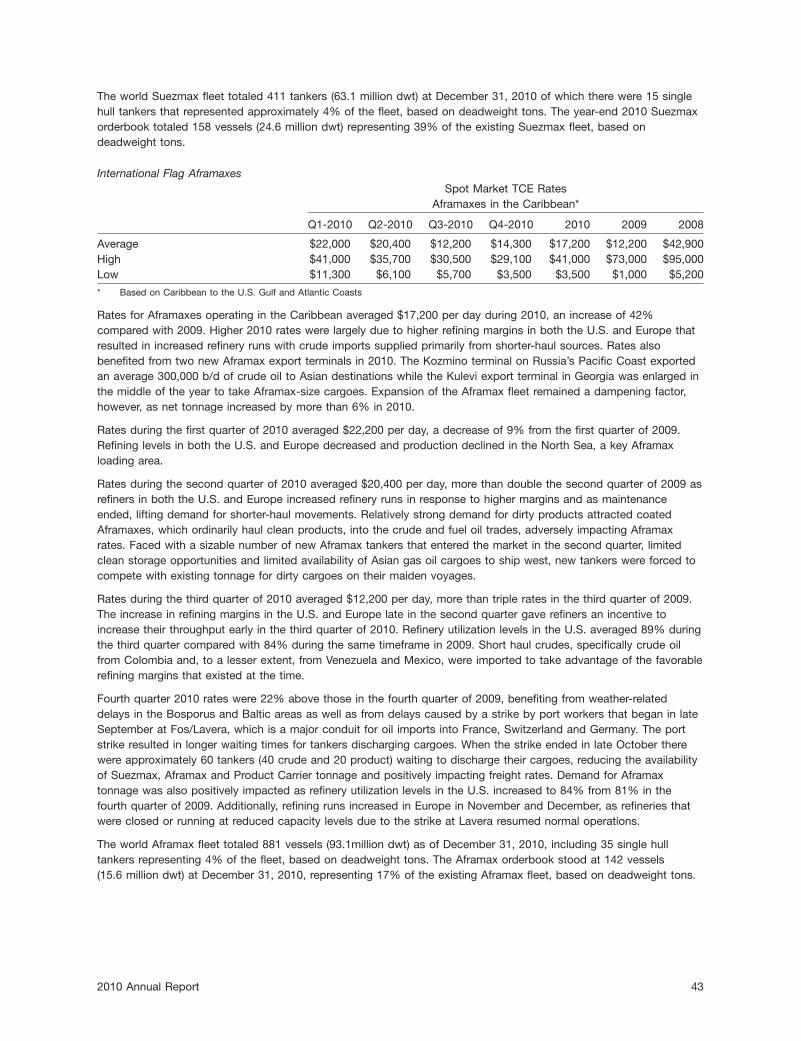
The world Suezmax fleet totaled 411 tankers (63.1 million dwt) at December 31, 2010 of which there were 15 singlehull tankers that represented approximately 4% of the fleet, based on deadweight tons. The year-end 2010 Suezmaxorderbook totaled 158 vessels (24.6 million dwt) representing 39% of the existing Suezmax fleet, based ondeadweight tons.
International Flag AframaxesSpot Market TCE Rates
Aframaxes in the Caribbean*
Q1-2010 Q2-2010 Q3-2010 Q4-2010 2010 2009 2008
Average $22,000 $20,400 $12,200 $14,300 $17,200 $12,200 $42,900High $41,000 $35,700 $30,500 $29,100 $41,000 $73,000 $95,000Low $11,300 $6,100 $5,700 $3,500 $3,500 $1,000 $5,200
* Based on Caribbean to the U.S. Gulf and Atlantic Coasts
Rates for Aframaxes operating in the Caribbean averaged $17,200 per day during 2010, an increase of 42%compared with 2009. Higher 2010 rates were largely due to higher refining margins in both the U.S. and Europe thatresulted in increased refinery runs with crude imports supplied primarily from shorter-haul sources. Rates alsobenefited from two new Aframax export terminals in 2010. The Kozmino terminal on Russia’s Pacific Coast exportedan average 300,000 b/d of crude oil to Asian destinations while the Kulevi export terminal in Georgia was enlarged inthe middle of the year to take Aframax-size cargoes. Expansion of the Aframax fleet remained a dampening factor,however, as net tonnage increased by more than 6% in 2010.
Rates during the first quarter of 2010 averaged $22,200 per day, a decrease of 9% from the first quarter of 2009.Refining levels in both the U.S. and Europe decreased and production declined in the North Sea, a key Aframaxloading area.
Rates during the second quarter of 2010 averaged $20,400 per day, more than double the second quarter of 2009 asrefiners in both the U.S. and Europe increased refinery runs in response to higher margins and as maintenanceended, lifting demand for shorter-haul movements. Relatively strong demand for dirty products attracted coatedAframaxes, which ordinarily haul clean products, into the crude and fuel oil trades, adversely impacting Aframaxrates. Faced with a sizable number of new Aframax tankers that entered the market in the second quarter, limitedclean storage opportunities and limited availability of Asian gas oil cargoes to ship west, new tankers were forced tocompete with existing tonnage for dirty cargoes on their maiden voyages.
Rates during the third quarter of 2010 averaged $12,200 per day, more than triple rates in the third quarter of 2009.The increase in refining margins in the U.S. and Europe late in the second quarter gave refiners an incentive toincrease their throughput early in the third quarter of 2010. Refinery utilization levels in the U.S. averaged 89% duringthe third quarter compared with 84% during the same timeframe in 2009. Short haul crudes, specifically crude oilfrom Colombia and, to a lesser extent, from Venezuela and Mexico, were imported to take advantage of the favorablerefining margins that existed at the time.
Fourth quarter 2010 rates were 22% above those in the fourth quarter of 2009, benefiting from weather-relateddelays in the Bosporus and Baltic areas as well as from delays caused by a strike by port workers that began in lateSeptember at Fos/Lavera, which is a major conduit for oil imports into France, Switzerland and Germany. The portstrike resulted in longer waiting times for tankers discharging cargoes. When the strike ended in late October therewere approximately 60 tankers (40 crude and 20 product) waiting to discharge their cargoes, reducing the availabilityof Suezmax, Aframax and Product Carrier tonnage and positively impacting freight rates. Demand for Aframaxtonnage was also positively impacted as refinery utilization levels in the U.S. increased to 84% from 81% in thefourth quarter of 2009. Additionally, refining runs increased in Europe in November and December, as refineries thatwere closed or running at reduced capacity levels due to the strike at Lavera resumed normal operations.
The world Aframax fleet totaled 881 vessels (93.1million dwt) as of December 31, 2010, including 35 single hulltankers representing 4% of the fleet, based on deadweight tons. The Aframax orderbook stood at 142 vessels(15.6 million dwt) at December 31, 2010, representing 17% of the existing Aframax fleet, based on deadweight tons.
2010 Annual Report 43

International Flag PanamaxesSpot Market TCE Rates
Panamaxes—Crude and Residual Oils*
Q1-2010 Q2-2010 Q3-2010 Q4-2010 2010 2009 2008
Average $16,300 $16,300 $10,600 $10,500 $13,400 $13,100 $32,400High $24,900 $22,600 $19,400 $22,300 $24,900 $38,000 $53,800Low $3,500 $6,700 $3,000 $900 $900 $0 $14,300
* Based on 50% Caribbean to the U.S. Gulf and Atlantic Coasts and 50% Ecuador to the U.S. West Coast
Rates for Panamaxes averaged $13,400 per day during 2010, an increase of 2% compared with 2009. A Februaryearthquake in Chile caused damage to its refining infrastructure, resulting in Ecuadorian crude oil shipments thatwould have ordinarily gone to Chile being diverted to the U.S., a longer-haul destination, which was supportive ofrates. Most other shipping pattern changes affecting Panamxes, however, were not as favorable. The trend towardincreasing economies of scale continued as charterers combined stems and utilized larger size tankers (bothAframaxes and Suezmaxes) to move cargoes usually carried on Panamax vessels. The shutdown of Valero’s Arubarefinery since mid-2009 resulted in lost employment opportunities for Panamax vessels during this time. Increasedshipments of Russian crude oil from the port of Kozmino to the U.S. West Coast and an increase in the Panamaxfleet of 2% during 2010 also adversely impacted rates.
Rates during the first quarter averaged $16,300 per day, 23% lower than the first quarter of 2009. Muted demand forcrude and fuel oil on both sides of the Atlantic Basin led to an oversupply of Panamaxes in the Caribbean.Additionally, charterers were able to benefit from economies of scale by combining cargoes on Aframaxes.
Rates during the second quarter averaged $16,300 per day, 17% above the corresponding quarter in 2009. Theearthquake in Chile that caused damage to its refineries curtailed crude oil import requirements but increased Chile’sneed to import more oil products. Ecuadorian crude oil normally sent to Chile was diverted to longer-haul U.S. Westand Gulf Coast refineries, increasing tonne-mile demand.
Rates during the third quarter averaged $10,600 per day, approximately 24% higher than in the correspondingquarter of 2009. The Panamax trade was subdued in the third quarter due to heightened competition from theAframax market, which kept pressure on rates. The lack of opportunities in other Panamax markets provided littleincentive for owners to leave the Caribbean to seek cargoes elsewhere. More cargoes from Ecuador ultimatelydestined for the U.S. West Coast (a 21-day voyage) were instead delivered to storage facilities in Panama (a five-dayvoyage), where cargoes were combined and larger tankers used to transport cargoes to U.S. West Coast refineries.
Fourth quarter rates were 22% higher than those in the fourth quarter of 2009, bolstered by a strong December asrefiners in both Europe and the U.S. responded quickly to higher refining margins by seeking crude oil fromshorter-haul sources, boosting Panamax and Aframax demand. Panamax rates were also buoyed by delays resultingfrom the one-day closure of the Panama Canal in early December.
Increased shipments of Russian crude oil during 2010 from the port of Kozmino to the U.S. West Coast adverselyimpacted Panamax requirements. Increased Russian crude oil deliveries on Aframax tonnage precluded Panamaxmovements from Vancouver and reduced the number of VLCC voyages to the West Coast, which also limitedlightering opportunities for Panamaxes.
The world Panamax fleet at December 31, 2010 stood at 433 vessels (30.4 million dwt), including 26 single hullvessels representing 6% of the current Panamax fleet, based on deadweight tons. The orderbook of 89 vessels(6.4 million dwt) at December 31, 2010 represented 21% of the existing fleet based on deadweight tons.
International Flag Handysize Product CarriersSpot Market TCE Rates
Handysize Product Carriers*
Q1-2010 Q2-2010 Q3-2010 Q4-2010 2010 2009 2008
Average $9,600 $6,500 $7,700 $6,400 $7,600 $5,900 $20,800High $17,400 $11,900 $18,500 $16,500 $18,500 $18,200 $35,800Low $4,900 $1,700 $2,900 $2,600 $1,700 $0 $7,700
* Based on 60% trans-Atlantic and 40% Caribbean to the U.S. Atlantic Coast
44 Overseas Shipholding Group, Inc.

Rates for Handysize Product Carriers operating in the Caribbean and trans-Atlantic trades averaged $7,600 per dayin 2010, 28% above 2009 rates The higher rates in 2010 primarily reflected a worldwide increase in dieselmovements, including a significant increase in diesel exported from U.S. Gulf Coast refineries to Latin America andEurope.
Rates during the first quarter of 2010 averaged $9,600 per day, 13% below rates in the first quarter of 2009. Thedecline in rates reflected a decrease in trans-Atlantic and Caribbean-to-U.S. East and Gulf Coast productmovements. The shutdown of Valero’s Aruba refinery since mid-2009 has resulted in the elimination of approximately120,000 b/d of product exports to the U.S. The Aruba refinery is scheduled to commence operations in the first halfof 2011 and should provide employment for Panamax tankers moving crude oil to Aruba and for Product Carriersmoving products from Aruba to both U.S. and Latin American destinations. An increase in product imports to bothChile and Argentina in March from the U.S. Gulf Coast provided some support for freight rates. The Februaryearthquake in Chile damaged its only two refineries. Additionally, strong gasoline demand in Argentina resulted inimports of about 300,000 b/d in March from the U.S. Gulf Coast, the first time that Argentina has imported gasolinein 30 years.
Rates during the second quarter of 2010 averaged $6,500 per day, about 4% below those in the second quarter of2009. Lower rates reflected a reduction in refinery utilization in Europe due to both lower demand for oil products andan increase in refinery maintenance activities, especially in April and May. The reduction in refinery utilization levels inEurope resulted in less gasoline being produced and available for trans-Atlantic shipment. There was also adrawdown of middle distillates stored on tankers in close proximity to Europe, which reduced European diesel oilimport requirements. Somewhat offsetting these negative events were an increase in imports of clean products intothe Caribbean and Latin America regions, where refining activity declined due to both planned maintenance andunanticipated refinery outages.
Rates during the third quarter averaged $7,700 per day, more than twice the average of the third quarter of 2009. Anincrease in middle distillate demand in Latin America in conjunction with unexpected refinery downtime in theCaribbean and South America created an arbitrage opportunity for imports into this area. U.S. refiners producedincremental volumes of diesel that were exported from Gulf Coast refineries to both Latin America and Europe,benefiting product tanker rates. There were also additional movements from Asia into Latin America to meet risingdistillate demand. However, trans-Atlantic movements of gasoline from Europe to the U.S. were subdued as U.S.refining runs in the third quarter were at a high enough level to meet gasoline demand without the need for additionalimports.
Rates in the fourth quarter of 2010 were more than double those in the same timeframe in 2009. Rates benefitedfrom strong middle distillate demand in China that resulted in a significant increase in intra-Asian diesel imports intoChina. Higher refinery runs at U.S. Gulf Coast refineries enabled diesel exports to increase to over 800,000 b/d in thefourth quarter from approximately 515,000 b/d in the fourth quarter of 2009. In Europe, an increase in refining runs inNovember and December following the conclusion of the port strike at Lavera resulted in an increase in gasolineexports to West Africa and the U.S. East Coast.
The world Handysize fleet reached 1,524 vessels (65.9 million dwt) at December 31, 2010, including 123 single hulltankers that comprised 7% of the total Handysize fleet, based on deadweight tons. The orderbook at year-end 2010stood at 251 vessels (11.9 million dwt) representing 18% of the existing Handysize fleet, based on deadweight tons.
U.S. Flag Jones Act Product Carriers and Articulated Tug Barges (‘‘ATBs’’)
Average Spot Market TCE Rates
Q1-2010 Q2-2010 Q3-2010 Q4-2010 2010 2009 2008
45,000 dwt Tankers $34,300 $40,900 $39,600 $38,700 $38,400 $36,650 $45,02530,000 dwt ATBs $23,300 $27,300 $26,200 $25,500 $25,400 $24,850 $27,100
Jones Act Product Carrier and ATB rates in 2010 were 5% and 2%, respectively, higher than in 2009. Theimprovement in spot rates primarily reflected higher U.S. refinery utilization levels, which rose from 83% in 2009 to86% in 2010, and a reduction in tonnage.
2010 Annual Report 45

Rates for Jones Act Product Carriers and ATBs averaged $34,300 per day and $23,300 per day, respectively, duringthe first quarter, down approximately 25% from the first quarter of 2009. U.S. Gulf Coast refinery utilization rates were82% in the first quarter compared with 83% in the first quarter of 2009, limiting the availability of oil product cargoes.The decreased supply of cargoes in the spot market resulted in eight vessels (about 12% of the fleet) being in lay-upat the end of the first quarter.
Rates for Jones Act Product Carriers and ATBs during the second quarter averaged $40,900 per day and $27,300per day, respectively, and were 28% and 23%, respectively, higher than those in the second quarter of 2009. Thehigher rates reflected an increase in demand for oil products in the U.S., higher refinery utilization rates in the GulfCoast region and a reduction in the number of tankers operating in the marketplace. Second quarter U.S. oil demandincreased by 500,000 b/d compared with the second quarter of 2009 while U.S. Gulf Coast refinery utilization ratesaveraged over 90%, the first time this level was attained since the third quarter of 2007. The Jones Act ProductCarrier fleet of tankers, ATBs and ITBs (‘‘Integrated Tug Barges’’) declined to 62 vessels at the end of the secondquarter from 66 vessels operating at the end of 2009.
Rates for Jones Act Product Carriers and ATBs averaged $39,600 per day and $26,200 per day, respectively, duringthe third quarter, approximately 20% and 14% above their respective third quarter 2009 rates. U.S. Gulf Coastrefinery utilization rates in the third quarter averaged 91% compared with 86% in the third quarter of 2009. Thisresulted in an increase in inventory levels as well as an increase in middle distillate exports. An accident at Mexico’sCadereyta refinery in early September damaged production units, reducing throughput volumes. To compensate forthis reduction in throughput volumes, additional quantities of gasoline were moved on ATBs from Gulf Coast refineriesinto Brownsville, Texas for uploading into a product pipeline that runs into Mexico.
Rates for Jones Act Product Carriers and ATBs during the fourth quarter averaged $38,700 per day and $25,000 perday, respectively, approximately 11% and 5%, respectively, higher than fourth quarter 2009 rates. The increase inrates reflected higher U.S. Gulf Coast refinery utilization rates, increased movements to the Northeast and a reductionin fleet size. In response to higher refining margins, U.S. Gulf Coast refinery utilization reached 90% in December andaveraged 88% in the fourth quarter compared with an average of 83% in the corresponding quarter in 2009.Maintenance at a refinery in Canada, which typically ships products to the Northeast, created demand for Jones ActCarriers to carry additional cargoes from the U.S. Gulf to the U.S. Northeast. Additional gasoline shipments were alsomade to Brownsville for uploading into a product pipeline that runs into Mexico. These factors, and a decrease in thesize of the fleet from 66 vessels in the fourth quarter of 2009 to 60 vessels in the fourth quarter of 2010, contributedtowards the improvement in rates.
The Delaware Bay lightering business transported an average of 224,000 b/d during 2010, an increase of 7% fromthe 210,000 b/d transported in 2009. Increased refinery margins late in the second quarter and again late in thefourth quarter led to increased refinery utilization rates and lightering volumes from June through August and again inDecember. Currently, the Delaware City and Eagle Point refineries on the U.S. East Coast remain shut. The increasein lightering volumes reflected higher demand from other refineries operating on the U.S. East Coast. The DelawareCity refinery, sold by Valero to PBF Holding Company LLC, is now undergoing significant maintenance, but isexpected to restart operations during the first half of 2011 and could benefit Delaware Bay lightering activities in2011.
As of December 31, 2010, the total Jones Act Product Carrier fleet of tankers, ATBs and ITBs consisted of 60vessels. Seven vessels entered the fleet during 2010 while thirteen vessels were scrapped. The Jones Act ProductCarrier orderbook for deliveries scheduled through 2014 consists of eight tankers and barges in the 160,000 to420,000 barrel size range. These additions will be offset by the scrapping of seven tankers that will reach theirOPA-90 phase-out dates and one double-hull vessel that will reach 35 years of age during this period.
OutlookThe global economy during 2010 grew at a much higher-than-expected rate, pushing oil demand growth to2.8 million b/d. Economic growth is forecast to continue through 2011, albeit at a less robust pace, prompting theInternational Energy Agency (‘‘IEA’’) to forecast a more moderate oil demand growth rate for 2011 of 1.5 million b/d.This forecast would result in two consecutive years of oil demand increases totaling 4.2 million b/d followingconsecutive annual declines in 2008 and 2009 totaling 1.7 million b/d.
46 Overseas Shipholding Group, Inc.
Except for OECD Europe and OECD Pacific, oil demand is expected to increase in all areas of the world in 2011. TheIEA forecasts that oil demand in China will increase by a still strong 570,000 b/d in 2011, after growing by one millionb/d in 2010, and by 300,000 b/d in Other Asia, after growing by 290,000 b/d in 2010. Refining capacity in Asia isforecast to grow in line with oil demand growth and will require increased volumes of imported oil from West Africa,South America and the Middle East as Asian oil production is forecast to remain at 2010 levels. Approximately 90%of total crude oil imports into China result from seaborne movements, primarily on VLCCs. The IEA also predicts thatoil demand will rise by 240,000 b/d in the Middle East, 200,000 b/d in Latin America and 120,000 b/d in the FormerSoviet Union (‘‘FSU’’) that will boost crude and product movements and increase tonne-mile demand in 2011.
Non-OPEC production is expected to increase by approximately 660,000 b/d in 2011 as production declines in theU.S., Mexico and the North Sea are more than offset by increased production in Brazil, Colombia, the FSU andGhana, where the new Jubilee field will go into production
The call on OPEC production is forecast to increase by approximately one million b/d during 2011 as the forecast1.5 million b/d increase in world oil demand exceeds the projected 660,000 b/d increase in non-OPEC production.Most of the OPEC surplus production is located in the Middle East, which should result in additional long-haulmovements to both Asia and the Western Hemisphere and a commensurate increase in tonne-mile demand.
Crude inventory levels in 2011 are forecast to slightly increase from end of year 2010 levels and will provide thenecessary throughput for incremental refining capacity that is expected to come on line. China’s ongoing program toincrease its strategic crude oil reserves will also contribute toward the buildup in inventories. It is anticipated thatthese additions to inventories will have a positive impact on tonne-mile demand during 2011.
There are also some notable events that will benefit both crude oil and product tanker demand during 2011. Thestartup of the Aruba refinery during 2011 will generate incremental shipments of short-haul crudes from Venezuelaand Mexico that will benefit Aframax and Panamax demand in the Caribbean. Feedstocks produced in Aruba willmove to the U.S. Gulf and East Coasts while refined products will go to Latin America. The startup of the DelawareCity refinery during 2011 will increase crude oil imports into the U.S. East Coast that will stimulate demand for crudeoil tankers as well as lightering operations in the Delaware Bay area.
Fundamentals in the U.S. Flag tanker markets are also forecast to improve in the next few years. The increase inrefinery expansion projects on the U.S. Gulf Coast, including the 180,000 b/d Marathon refinery expansion in 2010and the 325,000 b/d Motiva refinery expansion project that is scheduled to commence operations during 2012, willincrease clean product volumes available for transport on Jones Act vessels to Florida and the South Atlantic region.In addition, incremental mid-continent refinery capacity expansion will reduce product movements from Gulf Coastrefineries to the Midwest resulting in increased seaborne product movements. Higher demand combined with a stablefleet through 2014 should benefit rates in this time period.
Improved fundamentals are also foreseen for the Product Carrier market. Growth in tonne-mile demand is expectedto exceed the 3% per year average growth in tonnage supply in the 2011 through 2014 timeframe, ameliorating thecurrent oversupply situation. Long-haul product shipments from India to Europe and the U.S., as India’s exportcapacity increases, will contribute to growth in tonne-mile demand. Increasing world demand for diesel shouldprovide arbitrage opportunities for exports from the U.S. Gulf Coast refineries to Europe and South America wherethere is a growing diesel deficit. Diesel exports on Handysize Product Carriers are longer haul trades resulting inincreased tonne-miles. Growth in naphtha demand in Asia will require additional shipments from the Middle Eastwhile product demand growth in Asia will generate additional intra-Asian movements.
While the outlook for crude tonne-mile demand in 2011 is positive, it may not be sufficient to offset the anticipatedincrease in crude tanker supply of 7% to 9%, depending on the number of order cancellations and deliveries that aredeferred into later years. Crude oil tonne-mile demand is forecast to increase by between 4% and 6% in 2011,somewhat less than the growth in tanker supply. Today’s high bunker prices of over $500 per ton provide anincentive for slow steaming, an action that would reduce bunker consumption, reduce emissions and increase tankerutilization rates. While current crude futures prices do not support holding oil in storage, the new sanctions againstIran make it more difficult for Iran to market its crudes. Should Japan and Europe decide to cut back crude oilimports from Iran, more tankers may need to be utilized for storage purposes, which would absorb some of theexisting surplus tonnage and be somewhat supportive of 2011 rates.
2010 Annual Report 47

The explosion that occurred on the Deepwater Horizon drilling platform on April 20, 2010 resulted in the destructionof that platform, the loss of 11 lives and a significant oil spill in the Gulf of Mexico. The ramifications from thiscatastrophe are still being felt, impacting deepwater drilling programs and Gulf of Mexico production levels.Development projects are being delayed as companies review new proposed regulations that would raise costs tofind and produce oil from their deepwater blocks. Delays in drilling have resulted in reduced production levels relativeto pre-oil spill forecasts, necessitating an increase in imports to meet demand.
Freight rates remain highly sensitive to severe weather and geopolitical events. Hurricanes in the Gulf of Mexicocould have a pronounced effect on freight rates for both crude oil and product movements depending on the extentto which upstream and downstream facilities are affected. Winter-related delays in the Bosporus straits couldincrease tanker utilization rates. Geopolitical events, such as the presidential election in Nigeria could adverselyimpact oil production in the Niger delta. Escalating tensions with Iran and other regional conflicts in the Middle East,such as unrest in Egypt and Libya, could also cause changes in supply patterns that could significantly impact rates.Additionally, any changes in OPEC production quotas will have an impact on tanker utilization and rates.
CRITICAL ACCOUNTING POLICIESThe Company’s consolidated financial statements are prepared in accordance with accounting principles generallyaccepted in the United States, which require the Company to make estimates in the application of its accountingpolicies based on the best assumptions, judgments, and opinions of management. Following is a discussion of theaccounting policies that involve a higher degree of judgment and the methods of their application. For a descriptionof all of the Company’s material accounting policies, see Note A to the Company’s consolidated financial statementsset forth in Item 8.
Revenue RecognitionThe Company generates a majority of its revenue from voyage charters, including vessels in pools that predominantlyperform voyage charters. Within the shipping industry, there are two methods used to account for voyage charterrevenue: (1) ratably over the estimated length of each voyage and (2) completed voyage. The recognition of voyagerevenues ratably over the estimated length of each voyage is the most prevalent method of accounting for voyagerevenues in the shipping industry and the method used by OSG. Under each method, voyages may be calculated oneither a load-to-load or discharge-to-discharge basis. In applying its revenue recognition method, managementbelieves that the discharge-to-discharge basis of calculating voyages more accurately estimates voyage results thanthe load-to-load basis. Since, at the time of discharge, management generally knows the next load port andexpected discharge port, the discharge-to-discharge calculation of voyage revenues can be estimated with a greaterdegree of accuracy. OSG does not begin recognizing voyage revenue until a Charter has been agreed to by both theCompany and the customer, even if the vessel has discharged its cargo and is sailing to the anticipated load port onits next voyage, because it is at this time the charter rate is determinable for the specified load and discharge portsand collectibility is reasonably assured.
Revenues from time charters and bareboat charters are accounted for as operating leases and are thus recognizedratably over the rental periods of such charters, as service is performed. The Company does not recognize timecharter revenues during periods that vessels are off hire.
For the Company’s vessels operating in commercial pools, revenues and voyage expenses are pooled and allocatedto each pool’s participants on a time charter equivalent basis in accordance with an agreed-upon formula. Theformulas in the pool agreements for allocating gross shipping revenues net of voyage expenses are based on pointsallocated to participants’ vessels based on cargo carrying capacity and other technical characteristics, such as speedand fuel consumption. The selection of charterers, negotiation of rates and collection of related receivables and thepayment of voyage expenses are the responsibility of the pools. The pools may enter into contracts that earn eithervoyage charter revenue or time charter revenue. Each of the pools follows the same revenue recognition principles,as applied by the Company, in determining shipping revenues and voyage expenses, including recognizing revenueonly after a Charter has been agreed to by both the pool and the customer, even if the vessel has discharged itscargo and is sailing to the anticipated load port on its next voyage.
Vessel LivesThe carrying value of each of the Company’s vessels represents its original cost at the time it was delivered orpurchased less depreciation calculated using an estimated useful life of 25 years (except for FSO service vessels and
48 Overseas Shipholding Group, Inc.

new ATBs for which estimated useful lives of 30 years are used and LNG Carriers for which estimated useful lives of35 years are used) from the date such vessel was originally delivered from the shipyard or 20 years from the date theCompany’s ATBs were rebuilt. Effective January 1, 2008, the Company effected a change in estimate related to theestimated scrap rate for substantially all of its vessels from $150 per lightweight ton to $300 per lightweight ton. TheCompany’s assumptions used in the determination of estimated salvage value took into account then current scrapprices, which were in excess of $700 per lightweight ton, the historic pattern of scrap rates over the four years endedDecember 31, 2007, which ranged from $250 to over $500 per lightweight ton, estimated changes in future marketdemand for scrap steel and estimated future demand for vessels.
As of December 31, 2007, the average age for OSG’s owned International Flag Fleet sectors ranged from 4.3 yearsto 9.2 years. The industry standard for determining the economic life-span for tankers is 25 years. The steel scrapprice forecast to determine vessel salvage value was therefore based on economic assumptions and conditions thatwere expected to exist over a forward looking 15 to 20 year timeframe from December 31, 2007 given the currentage of the Company’s fleet. The strength of the world’s economic growth will vary during this timeframe from periodsof global recession and low commodity price levels to periods of varied economic growth where steel prices will bedetermined by industrial production, financing and credit availability for projects and government sponsoredinfrastructure investments throughout the world. Management reviewed steel plate prices in Asia and in NorthAmerica from January 2000 through December of 2007 that showed a more than doubling of steel plate prices inboth areas within this timeframe. Actual scrap prices were consistently priced at over $300 per lightweight ton fromJanuary 2004 through June 2008. Scrap values declined below $300 per lightweight ton towards the end of 2008,due to turmoil in the financial markets, which caused a general decline in vessel values. The scrap market alsoexperienced a period with very little activity in 2008 as scrappers were unable to obtain letters of credit, whichcaused further downward pressure on prices. The weak freight markets during 2009 resulted in owners scrappingmore vessels, and scrapping them earlier in their lives. During 2010, scrapping levels remained high, due to acombination of factors including the January 1, 2011 IMO phase out deadline for operating single hull tankers, lowutilization rates for single hull tankers and high scrap prices. Scrap prices during 2010 ranged from $350 perlightweight ton to $500 per lightweight ton. The Company expects scrapping levels to remain high during 2011 asowners, faced with the challenges of a market where scheduled newbuild deliveries are expected to further aggravatethe current oversupply of tonnage and low charter rate expectations, will likely be inclined to accelerate the disposalof older vessels within their fleets. Scrap prices are expected to remain strong during 2011 due to a backlog ofdemand for steel at the end of 2010 caused by the temporary closing of the Bangladesh scrapping market.Management believes that $300 per lightweight ton is a reasonable estimate of future scrap prices, taking intoconsideration the cyclicality of the nature of future demand for scrap steel. Although management believes that theassumptions used to determine the scrap rate are reasonable and appropriate, such assumptions are highlysubjective, in part, because of the cyclicality of the nature of future demand for scrap steel.
The Company’s owned International Flag tanker fleet is 100% double hull at December 31, 2010. If the economiclives assigned to the tankers prove to be too long because of new regulations or other future events, higherdepreciation expense and impairment losses could result in future periods related to a reduction in the useful lives ofany affected vessels.
The U.S. has not yet adopted the Hong Kong International Convention for the Safe and Environmentally SoundRecycling of Ships (the ‘‘Convention’’). While the U.S. Environmental Protection Agency (‘‘EPA’’) and the U.S. MaritimeAdministration (‘‘MarAd’’) discuss the implications and potential adoption of this Convention, scrapping U.S. Flagvessels could become subject to additional requirements, which could negatively impact sales prices obtainable inthe markets or require companies, such as OSG, to incur additional costs in order to sell U.S. Flag vessels to foreignbuyers for recycling or further trading. Currently, management believes that $300 per lightweight ton is a reasonableestimate of scrap prices for its U.S. Flag vessels.
Vessel ImpairmentThe carrying values of the Company’s vessels may not represent their fair market value at any point in time since themarket prices of second-hand vessels tend to fluctuate with changes in charter rates and the cost of newbuildings.Historically, both charter rates and vessel values tend to be cyclical. The Company records impairment losses onlywhen events occur that cause the Company to believe that future cash flows for any individual vessel will be lessthan its carrying value. The carrying amounts of vessels held and used by the Company are reviewed for potentialimpairment whenever events or changes in circumstances indicate that the carrying amount of a particular vessel
2010 Annual Report 49

may not be fully recoverable. In such instances, an impairment charge would be recognized if the estimate of theundiscounted future cash flows expected to result from the use of the vessel and its eventual disposition is less thanthe vessel’s carrying amount. This assessment is made at the individual vessel level as separately identifiable cashflow information for each vessel is available.
In developing estimates of future cash flows, the Company must make assumptions about future charter rates, shipoperating expenses, and the estimated remaining useful lives of the vessels. These assumptions are based onhistorical trends as well as future expectations. Although management believes that the assumptions used to evaluatepotential impairment are reasonable and appropriate at the time they were made, such assumptions are highlysubjective.
During 2008, the Company decided not to have two older U.S. Flag vessels (one Product Carrier and one ATB)undergo scheduled drydockings, which were required to continue operating such vessels. These vessels thereforeceased operating during the fourth quarter of 2008 and were placed in lay-up pending the sale of such vessels.Accordingly the Company recorded a charge of $32,597,000 to write down the carrying amount of these vessels totheir estimated net fair value as of December 31, 2008.
In early 2009, OSG began negotiations with Bender Shipbuilding & Repair Co., Inc. (‘‘Bender’’) to terminate theconstruction agreements covering the six ATBs and two tug boats associated with its U.S. Flag expansion plans dueto repeated delays in vessel delivery dates from the original contract delivery dates, Bender’s request for substantialprice increases on all contracted vessels and OSG’s concern about Bender’s ability to complete the ATBs and tugboats within contract terms, including Bender’s lack of performance under such agreements and its financialcondition. The Company reviewed the six ATBs and two tugboats for impairment based on the information known toit as of December 31, 2008. Accordingly, OSG recorded impairment charges of $105,111,000 in the fourth quarter of2008 related to four of such ATBs.
During the third quarter of 2009, events and circumstances indicated that the four single-hulled U.S. Flag ProductCarriers that have limited remaining lives due to OPA regulations that mandate their retirement between 2012 and2013 and one 1977-built double-hulled U.S. Flag Product Carrier that had a less-efficient gas turbine engine, mightbe impaired. In September 2009, the charterer of one of the four single-hulled U.S. Flag Product Carriers informedOSG that they would not be renewing the time charter upon its expiry in January 2010, which caused the Companyto evaluate the vessel’s future employment possibilities in light of its approaching May 2010 drydocking. Also inSeptember, two customers that were utilizing the Overseas Diligence, a 1977-built double-hulled U.S. Flag ProductCarrier, according to Contracts of Affreightment to perform lightering services in Delaware Bay, announcedrestructurings of their refinery operations, which would reduce lightering volumes, causing the Company to evaluatethe possibility of removing the vessel from lightering service prior to its required June 2010 drydocking. These facts,combined with continued weak market conditions, caused the Company to review all five vessels, which had anaggregate net book value of $45,602,000 as of September 30, 2009, for impairment. The estimates of theundiscounted future cash flows for the Overseas Diligence and one of the single-hulled vessels (OverseasPhiladelphia) did not support recovery of such vessels’ carrying value. Accordingly, the Company recorded animpairment charge of $12,500,000 to write down their carrying values to their estimated net fair values as ofSeptember 30, 2009, using estimates of discounted future cash flows for each of the vessels. The estimates ofundiscounted cash flows for each of the remaining three single-hulled vessels indicated that their carrying amountswere recoverable at that time.
During the first quarter of 2010, the Company determined that the continued weak conditions in the U.S. Flagmarkets represented an impairment indicator. The Company again reviewed future cash flows for the five U.S. Flagvessels discussed in the preceding paragraph. The Company considered the then-current market values and thescheduled 2010 drydockings on two of the single-hulled tankers in evaluating prospects for continued operation ofsuch vessels. The estimates of the undiscounted cash flows for one single-hulled vessel (Overseas Galena Bay)scheduled to drydock in 2010 and the Overseas Diligence did not support recovery of such vessels’ carrying value.Accordingly, the Company recorded an impairment charge of $3,607,000 (principally attributable to the OverseasGalena Bay) to write-down their carrying values to their estimated net fair values as of March 31, 2010, usingestimates of discounted future cash flows for each of the vessels. The estimates of undiscounted cash flows as ofMarch 31, 2010 for each of the remaining three single-hulled vessels indicated that their carrying amounts wererecoverable at that time.
50 Overseas Shipholding Group, Inc.
During the second quarter of 2010, the Company continued to experience difficulty employing its four single-hulledU.S. Flag vessels. The April 2010 explosion and sinking of the drilling rig, Deepwater Horizon, and the subsequent oilspill in the Gulf of Mexico resulted in proposed legislation that is expected to impact drilling and transportationservices in the Gulf of Mexico. In addition, discussions were held with regulators and the Delaware Bay lighteringcustomers concerning the future composition of the U.S. Flag lightering fleet and the requirement for vessels to havevapor-balancing capabilities. As a result of these two developments, the Company concluded that impairmentindicators were present and again performed an impairment analysis for its four single-hulled U.S. Flag vessels and,for the first time the OSG Constitution/OSG 400, a 1981-built U.S. Flag ATB engaged in lightering in Delaware Bay.One of the four single-hulled vessels (Overseas Philadelphia) was delivered to buyers on July 1, 2010. TheCompany’s estimate of undiscounted future cash flows for the other four U.S. Flag vessels included its expectationfor future market rates, a reduced likelihood of future employment opportunities, the timing and cost of upcomingdrydockings in 2010 and 2011, the potential cost of modifications to the ATB engaged in lightering and the potentialimpact of legislation described above. The Company’s estimates of undiscounted future cash flows for three of itsfour single-hulled vessels, including the one sold in July, and the lightering ATB did not support recovery of suchvessels’ carrying values at June 30, 2010. Accordingly, the Company recorded an impairment charge of $12,446,000(principally attributable to the lightering ATB and two single-hulled vessels for which a write-down had not beenpreviously taken) to write-down their carrying values to their estimated fair values at June 30, 2010.
During March 2010, OSG was informed by one of the major refineries along the U.S. Gulf that it would no longeraccept the Company’s two single-hulled Aframaxes employed in the International Crude Tankers segment’s lighteringbusiness, commencing April 1, 2010. OSG has a 50% interest in the residual value of these two Aframaxes, whichare chartered-in. These single-hulled Aframaxes are not subject to the IMO phase out until 2013. The Companyconsidered the impact of the resulting likely reduction in utilization on estimated future charter rates and was in theprocess of considering alternate employment or use for these vessels, which have additional features compared withstandard Aframaxes. The estimates of the undiscounted future cash flows as of March 31, 2010 for these two vesselsindicated that their carrying amounts at March 31, 2010 were recoverable. During the second quarter, both of thesevessels had substantial idle time awaiting employment. In addition, the Company reconsidered its ability to employthese two single-hulled Aframaxes in lightering in the Gulf of Mexico after the explosion and sinking of the DeepwaterHorizon, also taking into consideration proposed legislation that would have banned single hull tankers from servinglightering zones in the Gulf of Mexico effective January 1, 2011. These events also exerted downward pressure onprospective rates for alternative employment for these vessels. Given the revised employment outlook for these twovessels, the Company reevaluated the prospects for drydocking these vessels in 2011 and renewing the chartersupon their expiry in 2011 and no longer considered it likely that these charters will be extended. Based on itsevaluation of undiscounted future cash flows, the Company concluded that both single-hulled Aframaxes wereimpaired at June 30, 2010. Accordingly, the Company recorded an impairment charge of $12,730,000 to write-downthe carrying values of the intangible assets and costs related to the charters to their estimated fair values at June 30,2010.
The Company continued to experience difficulty in employing its three remaining single-hulled U.S. Flag vessels (oneof which was delivered to buyers in November 2010 and another that is scheduled for delivery to buyers during thefirst half of 2011) and the two chartered-in single-hulled International Flag Aframaxes engaged in lightering in the U.S.Gulf (one of which was delivered to buyers in December 2010) during the third and fourth quarters of 2010. However,no additional information was identified during the six-month period ended December 31, 2010 that would suggestthat the assumptions used in the Company’s June 30, 2010 evaluation of the future cash flows for the two unsoldvessels discussed above have changed. Accordingly, no impairment tests were performed as of December 31, 2010.It is possible that the Company’s estimates of undiscounted cash flows may change in the future, resulting in theneed for additional write-downs of one or more of the vessels discussed above.
TCE revenues across the International Flag Tanker fleet were lower on average in 2010 compared with 2009. Thiswas less to do with lower spot rates, but more a factor of vessels coming off of charters that had been fixed inperiods of higher TCE rates. The Company does not view the lower TCE rates as an event that would be an indicatorof potential impairment of its tankers. The tankers remain fully utilized and have relatively long average remaininguseful lives (ranging from 16 to19 years) in which to recover sufficient cash flows to offset their carrying values as ofDecember 31, 2010. The lower TCE rates in 2010 are viewed by management as part of a longer term economiccycle. Despite management’s view that a triggering event did not take place in 2010, the Company did review arepresentative sample of newbuildings and older tankers operating in the International Crude Tankers and
2010 Annual Report 51
International Product Carriers segments for potential impairment. The Company concluded that the future revenuestreams expected to be earned by such vessels over their remaining operating lives would be sufficient to recovertheir carrying values. Management will continue to monitor developments in charter rates in the markets in which itparticipates with respect to the expectation of future rates over an extended period of time that are utilized in theanalyses.
Goodwill and Intangible AssetsThe Company allocates the cost of acquired companies to the identifiable tangible and intangible assets andliabilities acquired, with the remaining amount being classified as goodwill. Certain intangible assets, such ascustomer relationships, are being amortized. The allocation of purchase price to intangible assets and goodwill maysignificantly affect our future operating results due to the amortization of such intangible assets and potentialimpairment charges related to goodwill.
Goodwill and indefinite lived assets are not amortized, but reviewed for impairment. The allocation of the purchaseprice of acquired companies requires management to make significant estimates and assumptions, includingestimates of future cash flows expected to be generated by the acquired assets and the appropriate discount rate tovalue these cash flows.
The Company tests the goodwill in its reporting units for impairment at least annually, or more frequently ifimpairment indicators arise, by comparing the estimated fair value of each operating segment with its net book value.OSG derives the fair value of each of its reporting units primarily based on discounted cash flow models. Theprocess of evaluating the potential impairment of goodwill and intangible assets is highly subjective and requiressignificant judgment with respect to estimates of future cash flows expected to be generated and the appropriatediscount rate to value these cash flows. The discounted cash flow models incorporate revenue assumptions basedon actual existing contracts and historical utilization rates for vessels not under contract. The related costs andexpenses are consistent with the Company’s historical levels to support revenue growth. The weighted average costof capital reflects the risks associated with the underlying cash flows taking into consideration both the industry andgeneral economic conditions at the time of testing.
In the fourth quarter of 2008, the economic downturn resulted in a number of market-related events that wereexpected to negatively impact the Company’s U. S. Flag operations in the near and medium-term. Lower demand forrefined petroleum products in North America resulted in a number of major refining companies reducing capacitythroughout the Gulf of Mexico. The reduction in planned refining expansion projects reduced future volumes of cleanproducts that had been forecast to move on Jones Act tankers. Recessionary forces also resulted in unfavorablechanges in trading patterns, as refiners shifted to higher margin low sulfur diesel for export, resulting in an adverseimpact on tonne-mile demand in the Jones Act market and associated rates. As a result of this deterioration in theforward supply/demand balance of the Jones Act market and the reduction in the Company’s U.S. Flag newbuildingprogram, the Company reduced its estimates of future cash flows to measure fair value and, accordingly, recorded animpairment charge of $62,874,000, representing the full value of the goodwill related to the U.S. Flag reportablesegment in the fourth quarter ended December 31, 2008.
The goodwill remaining on the consolidated balance sheet at December 31, 2010 relates to the lightering business inthe International Crude Tankers reportable segment. The Company performed its annual goodwill impairment testingas of April 1, 2010. This evaluation did not result in an impairment charge being recognized in 2010. Furthermore, thefair value of the lightering business was substantially in excess of its carrying value as of the impairment testing date.The Company has concluded that there have been no triggering events since the second quarter impairment testdate that would require an interim test for goodwill impairment as of December 31, 2010.
Market Value of Marketable SecuritiesThe Company’s holdings in marketable securities are classified as available-for-sale and, therefore, carried on thebalance sheet at fair value (determined using period-end sales prices on U.S. or foreign stock exchanges) withchanges in carrying value recorded in accumulated other comprehensive income/(loss) until the investments are sold.Accordingly, these changes in value are not reflected in the Company’s statements of operations. If, however, theCompany determines that a material decline in fair value below the Company’s cost basis is other than temporary,the Company would record a noncash impairment loss in the statement of operations in the period in which thatdetermination is made. As a matter of policy, the Company evaluates all material declines in fair value for impairment
52 Overseas Shipholding Group, Inc.
whenever the fair value of a stock has been below its cost basis for six consecutive months. In the period in which amaterial decline in fair value is determined to be other than temporary, the carrying value of that security would bewritten down to its fair value at the end of such period, thereby establishing a new cost basis.
During 2009, the decrease in the market value of its marketable securities was considered other-than-temporary andresulted in an impairment charge to earnings of $5,151,000, which charge previously had been included inaccumulated other comprehensive income/(loss). At December 31, 2009, the fair value of the Company’s marketablesecurities had declined below its newly established cost basis of $1,037,000. This decline has been recorded inaccumulated other comprehensive income/(loss) because the decline in value was not considered to beother-than-temporary since the market value of the securities had not been below its cost basis for six consecutivemonths.
During 2010, the decrease in the market value of its marketable securities was considered other-than-temporary andresulted in additional impairment charges of $656,000. At December 31, 2010, the fair value of the Company’smarketable securities was above its newly established cost basis of $381,000.
DrydockingWithin the shipping industry, there are two methods that are used to account for dry dockings: (1) capitalizedrydocking costs as incurred (deferral method) and amortize such costs over the period to the next scheduleddrydocking, and (2) expense drydocking costs as incurred. Since drydocking cycles typically extend over two and ahalf years or longer, management believes that the deferral method provides a better matching of revenues andexpenses than the expense-as-incurred method.
Deferred Tax Assets and Valuation AllowanceThe carrying value of the Company’s deferred tax assets is based on the assumption that the Company will generatesufficient taxable income in the future to permit the Company to take deductions. Each quarter, managementevaluates the realizability of the deferred tax assets and assesses the need for a valuation allowance. Any increase inthe valuation allowance against deferred tax assets will result in additional income tax expense in the Company’sstatement of operations. During 2008, the Company established a valuation allowance of $48,031,000 against thedeferred tax assets resulting from the write-down of vessels in the fourth quarter of 2008 and from net operating losscarryforwards arising in 2008. The valuation allowance was established because the Company could not determinethat it was more likely than not that the full amount of the deferred tax asset would be realized through thegeneration of taxable income in the future. The valuation allowance was recorded as a reduction in the income taxbenefit in the accompanying consolidated statement of operations for the year ended December 31, 2008. OnNovember 6, 2009, the President of the U.S. signed the Worker, Homeownership, and Business Assistance Act of2009. This law included a provision allowing taxpayers to elect an increased carryback for net operating lossesincurred in either 2008 or 2009. As a result of this change in the law, the write-down of certain vessels taken in 2008,which losses were 2009 events for tax purposes, was included in a net operating loss carryback from 2009 againstearnings generated in 2004. The valuation allowance associated with these deferred tax assets aggregating$21,624,000 was accordingly reversed since realization was probable. The Company has also established valuationallowances of $6,413,000 against deferred tax assets originating in 2009 and another $27,518,000 against a netoperating loss carryforward and other deferred tax assets arising in 2010.
Pension BenefitsThe Company has recorded pension benefit costs based on complex valuations developed by its actuarialconsultants. These valuations are based on key estimates and assumptions, including those related to the discountrates used and the rates expected to be earned on investments of plan assets. OSG is required to consider marketconditions in selecting a discount rate that is representative of the rates of return currently available on high-qualityfixed income investments. A higher discount rate would result in a lower benefit obligation and a lower rate wouldresult in a higher benefit obligation. The expected rate of return on plan assets is management’s best estimate ofexpected returns. A decrease in the expected rate of return will increase net periodic benefit costs and an increase inthe expected rate of return will decrease benefit costs.
In connection with the acquisition of Maritrans in November 2006, the Company assumed the obligations under thenoncontributory defined benefit pension plan that covered eligible employees of Maritrans (‘‘the Maritrans Plan’’). TheCompany froze the benefits payable under the Maritrans Plan as of December 31, 2006. The selection of a discount
2010 Annual Report 53

rate for the Maritrans Plan for all reporting periods between 2006 and December 31, 2008, was based on theassumption that the plan would be terminated and all eligible participants would receive insurance company annuitieswhen all necessary approvals were obtained. The Company, however, has not secured such insurance annuities duelargely to the impact of the historically low long-term interest rates on the cost of obtaining such annuities.Accordingly, at December 31, 2010 and 2009, the Company used discount rates of 5.25% and 5.5%, respectively,which it believed as of such dates, to be appropriate for ongoing plans with a long duration, such as the MaritransPlan. The Company also assumed a long term rate of return of on the Maritrans Plan assets of 6.75%. The actualreturn achieved over the past year was well in excess of 7%. Based on the current asset mix, Management believesthe probability of achieving a long-term return of 6.75% over the remaining duration of the Maritrans Plan is morelikely than not.
Certain of the Company’s foreign subsidiaries have pension plans that, in the aggregate, are not significant to theCompany’s financial position.
Newly Issued Accounting StandardsSee Note A to the Company’s consolidated financial statements set forth in Item 8.
INCOME FROM VESSEL OPERATIONSReliance on the spot market contributes to fluctuations in the Company’s revenue, cash flow, and net income, butaffords the Company greater opportunity to increase income from vessel operations when rates rise. On the otherhand, time and bareboat charters provide the Company with a predictable level of revenues. During 2010, resultsfrom vessel operations decreased by $156,425,000, or 203%, to a loss of $79,295,000 from income of $77,130,000in 2009. During 2009, income from vessel operations decreased by $268,056,000, or 78%, to $77,130,000 from$345,186,000 in 2008. These decreases resulted primarily from the year-over-year declines in TCE revenues. Inaddition, results from vessel operations for 2010 included net charges of $26,561,000 related to impairment charges,vessel sales and contract termination costs compared with net gains of $100,526,000 in 2009 and net charges of$112,612,000 (including $62,874,000 attributable to goodwill impairment) in 2008.
During 2010, TCE revenues decreased by $99,343,000, or 10%, to $853,278,000 from $952,621,000 in 2009,primarily reflecting lower average daily TCE rates earned by the Company’s VLCC’s, Aframaxes, Panamaxes andHandysize Product Carriers, as well as a 861 day decrease in revenue days. During 2010, approximately 64% of theCompany’s TCE revenues were derived from spot earnings, compared with 49% and 65% in 2009 and 2008,respectively. Fixed earnings from time or bareboat charters (‘‘term’’) and synthetic time charters (which representearnings for certain vessels operating in pools that have been converted to synthetic time charters through hedgingwith FFAs and bunker swaps that qualify as cash flow hedges) accounted for approximately 36% of TCE revenuesgenerated during 2010 compared with 51% and 35% of the Company’s TCE revenues in 2009 and 2008,respectively.
During 2009, TCE revenues decreased by $592,764,000, or 38%, to $952,621,000 from $1,545,385,000 in 2008,mainly due to a significant decrease in the daily TCE rates earned by all of the Company’s International Flag vesselclasses, as well as a 1,809 day decrease in revenue days.
OSG operates most of its crude oil tankers in commercial pooling arrangements (‘‘Pools’’). The Pools’ cargocommitments make them attractive, but such cargo commitments limit the Pools’ ability to support any significantportfolio of time charters. Accordingly, OSG enters into FFAs and bunker swaps seeking to create synthetic timecharters. The results of derivative positions that qualify for hedge accounting treatment and that are effective arereflected in TCE revenues in the periods to which such hedges relate. The Company achieved average TCE rates of$43,415 per day for 552 days in 2010, $41,959 per day for 3,342 days in 2009 and $73,632 per day for 1,795 daysduring 2010, 2009 and 2008, respectively, on VLCCs covered by such effective hedges. The results of derivativepositions that do not qualify for hedge accounting treatment are reflected in other income/(expense) and resulted inincome of $276,000 and $1,672,000 in 2010 and 2009 and expense of $33,774,000 in 2008.
See Note D to the consolidated financial statements set forth in Item 8 for additional information on the Company’ssegments, including equity in income of affiliated companies and reconciliations of (i) time charter equivalentrevenues to shipping revenues and (ii) income/(loss) from vessel operations for the segments to income/(loss) beforeincome taxes, including net income attributable to noncontrolling interest, as reported in the consolidated statementsof operations. Information with respect to the Company’s proportionate share of revenue days for vessels operating in
54 Overseas Shipholding Group, Inc.

companies accounted for using the equity method is shown below in the discussion of ‘‘Equity in Income of AffiliatedCompanies.’’
International Crude Tankers
Dollars in thousands 2010 2009 2008
TCE revenues $ 422,970 $ 488,021 $1,003,331Vessel expenses (99,795) (104,052) (117,815)Charter hire expenses (187,493) (230,123) (303,215)Depreciation and amortization (73,399) (72,654) (73,934)
Income from vessel operations (a) $ 62,283 $ 81,192 $ 508,367
Average daily TCE rate $ 23,506 $ 26,307 $ 52,344Average number of owned vessels (b) 25.9 24.8 25.4Average number of vessels chartered-in under operating leases 24.1 27.0 27.8Number of revenue days (c) 17,994 18,550 19,167Number of ship-operating days: (d)
Owned vessels 9,450 9,039 9,286Vessels bareboat chartered-in under operating leases 1,825 2,246 2,265Vessels time chartered-in under operating leases 6,232 6,679 7,090Vessels spot chartered-in under operating leases 730 921 819
(a) Income(loss) from vessel operations by segment is before general and administrative expenses, severance and relocation costs, shipyardcontract termination costs, gain/(loss) on disposal of vessels and impairment charges (vessel and goodwill).
(b) The average is calculated to reflect the addition and disposal of vessels during the year.
(c) Revenue days represent ship-operating days less days that vessels were not available for employment due to repairs, drydock or lay-up.Revenue days are weighted to reflect the Company’s interest in chartered-in vessels.
(d) Ship-operating days represent calendar days.
The following table provides a breakdown of TCE rates achieved for the years ended December 31, 2010, 2009 and2008 between spot and fixed earnings and the related revenue days. The Company entered into FFAs and relatedbunker swaps as hedges against the volatility of earnings from operating the Company’s VLCCs and Aframaxes inthe spot market. These derivative instruments seek to create synthetic time charters because their intended impact isto create a level of fixed TCE earnings, which because of basis risk may vary (possibly substantially) from thetargeted rate. From the perspective of a vessel owner, such as the Company, the results of these synthetic timecharters are intended to be substantially equivalent to results from time chartering vessels in the physical market. Theimpact of these derivatives, which qualify for hedge accounting treatment, are reported together with time charters
2010 Annual Report 55

entered in the physical market, under ‘‘Fixed Earnings.’’ The information in these tables is based, in part, oninformation provided by the pools or commercial joint ventures in which the segment’s vessels participate.
2010 2009 2008
Spot Fixed Spot Fixed Spot FixedEarnings Earnings Earnings Earnings Earnings Earnings
VLCCs:Average rate $34,109 $43,415 $33,511 $41,959 $92,351 $73,632Revenue days 4,653 552 1,866 3,342 4,044 1,795
Suezmaxes:Average rate $25,504 $ — $26,174 $ — $49,550 $ —Revenue days 1,057 — 864 — 772 —
Aframaxes:Average rate $17,349 $21,581 $20,037 $32,868 $38,432 $31,765Revenue days 7,215 879 7,244 1,009 6,237 1,451
Panamaxes:Average rate $18,714 $17,755 $18,983 $25,424 $36,311 $26,687Revenue days 1,819 1,456 2,257 1,604 2,386 1,778
During 2010, TCE revenues for the International Crude Tankers segment decreased by $65,051,000, or 13%, to$422,970,000 from $488,021,000 in 2009. This decrease in TCE revenues reflects decreases in average blended ratesfor VLCCs and average time charter rates for Panamaxes and Aframaxes, as well as a 556 day decrease in revenuedays. The decline in average rates earned by the VLCCs reflected a reduction in fixed coverage from FFAs andrelated bunker swaps. The decrease in revenue days is primarily due to decreases in chartered-in days in thePanamax and Aframax fleets. The spot Aframax rate for 2010 reflects substantial idle and repositioning time as wellas poor returns on the two double-sided Aframaxes chartered-in by the OSG Lightering business. One of the twovessels was repositioned to the Far East during the third quarter and subsequently delivered to buyers in December2010.
Vessel expenses decreased by $4,257,000 to $99,795,000 in 2010 from $104,052,000 in 2009. This decreaseprimarily results from a reserve of $3,357,000 recorded in the fourth quarter of 2009 for an expected assessment in2010 (based on the 2009 pension plan valuation) by the MNOPF. The MNOPF is a multi-employer pension plancovering British crew members that served as officers onboard OSG’s vessels (as well as vessels of other owners) inprior years. Although the Company has not been an active member of the plan for a number of years, because theplan is underfunded, additional assessments are possible in future years. The Company paid this assessment in2010. Charter hire expenses decreased by $42,630,000 to $187,493,000 in 2010 from $230,123,000 in 2009,reflecting a decrease of 1,059 chartered-in days, including 345 days attributable to VLCCs, and substantially lowerprofit share due to the owners of chartered-in VLCCs, Aframaxes and OSG Lightering vessels.
During 2009, TCE revenues for the International Crude Tankers segment decreased by $515,310,000, or 51%, to$488,021,000 from $1,003,331,000 in 2008. The decrease in TCE revenues resulted primarily from a significantdecrease in daily TCE rates earned on all classes of tankers across the crude fleet and, to a lesser extent, adecrease of 617 revenue days. The decrease in revenue days reflects the sale in January 2009 of one VLCC and thecommencement of conversion of a ULCC to an FSO, as well as a reduction in chartered-in VLCCs and Panamaxes.These decreases were partially offset by increased days attributable to the OSG Lightering business during 2009.
Vessel expenses decreased by $13,763,000 to $104,052,000 in 2009 from $117,815,000 in 2008. In the fourth quarterof 2009, the Company recorded a reserve of $3,357,000 for a probable assessment by the MNOPF, as discussedabove. The remaining change in vessel expenses was principally attributable to a decrease in average daily vesselexpenses of $1,303 per day. The decrease was primarily due to a reduction in contracted prices of stores andspares, lower insurance premiums and reductions in repairs and the renegotiation of fixed rate technical managementagreements between the Company and DHT Maritime, Inc., formerly Double Hull Tankers, Inc. (‘‘DHT’’), on seventankers, effective January 17, 2009. Under the renegotiated agreements, DHT is responsible for all vessel expenses.Charter hire expenses decreased by $73,092,000 to $230,123,000 in 2009 from $303,215,000 in 2008. This decreasewas principally as a result of lower profit share due to owners reflecting lower TCE rates achieved on the VLCC andAframax fleets, and a 431 day reduction in bareboat and time chartered-in days. Additionally, OSG Lightering wasable to fill its spot charter-in requirements at lower rates in 2009 compared with 2008 due to the significant reductionin Aframax rates.
56 Overseas Shipholding Group, Inc.

International Product Carriers
Dollars in thousands 2010 2009 2008
TCE revenues $ 188,520 $ 225,059 $298,132Vessel expenses (66,746) (80,899) (93,111)Charter hire expenses (102,321) (105,813) (79,648)Depreciation and amortization (36,193) (41,508) (55,796)
Income/(loss) from vessel operations $ (16,740) $ (3,161) $ 69,577
Average daily TCE rate $ 15,250 $ 17,976 $ 22,803Average number of owned vessels 14.5 13.4 15.3Average number of vessels chartered-in under operating leases 20.8 21.9 21.4Number of revenue days 12,361 12,521 13,074Number of ship-operating days:
Owned vessels 5,294 4,903 5,598Vessels bareboat chartered-in under operating leases 3,421 4,819 5,900Vessels time chartered-in under operating leases 4,160 3,161 1,917
The following table provides a breakdown of TCE rates achieved for the years ended December 31, 2010, 2009 and2008 between spot and fixed earnings and the related revenue days. The information is based, in part, on informationprovided by the commercial joint ventures in which certain of the segment’s vessels participate.
2010 2009 2008
Spot Fixed Spot Fixed Spot FixedEarnings Earnings Earnings Earnings Earnings Earnings
Panamax Product Carriers:Average rate $17,837 $ 7,741 $17,227 $19,094 $39,189 $18,653Revenue days 987 18 1,378 282 785 730
Handysize Product Carriers:Average rate $12,723 $20,759 $15,867 $20,148 $26,718 $19,851Revenue days 7,637 3,360 4,879 5,542 4,025 7,534
During 2010, TCE revenues for the International Product Carrier segment decreased by $36,539,000, or 16%, to$188,520,000 from $225,059,000 in 2009. This decrease in TCE revenues principally resulted from a decrease in theaverage rates earned on the Handysize Product Carriers operating in the spot market and a 160 day decrease inrevenue days. This decrease in revenue days was principally related to the redelivery of older, single-hulled HandysizeProduct Carriers (all 13 of which had redelivered to the owners at the expiry of their respective charters by August2009), the sale of two Panamax Product Carriers in the second quarter of 2009 and two other Panamax ProductCarriers, which were out-of-service for a significant portion of 2010. Partially offsetting these decreases was anincrease in revenue days of 2,157 days, reflecting an increase in owned and chartered-in modern Handysize ProductCarriers. Spot days for the Handysize Product Carrier fleet as a percentage of total revenue days increased to 69%from 47% in 2010. This shift combined with a reduction in average spot rates negatively impacted segment results.As a result of a bankruptcy filing by one of the Company’s charterers in January 2011, it is expected that theInternational Product Carriers segment will experience further exposure to the spot market given that it is unlikely thatthe Company will be able to replace the fixed rates currently being earned under the time charter-out commitmentsto this charterer ($22,000 per day on two vessels) at comparable levels.
Vessel expenses decreased by $14,153,000 to $66,746,000 in 2010 from $80,899,000 in the prior year reflecting a1,007 day decrease in owned and bareboat chartered-in days. This decrease primarily results from the redeliveries tothe owners of the older Handysize Product Carriers, which had been bareboat chartered-in by OSG. Also contributingwas a $662 per day decrease in average daily vessel expenses, which was primarily due to lower crew costs. Charterhire expenses decreased by $3,492,000 to $102,321,000 in 2010 from $105,813,000 in 2009 due to the recognition ofcertain third party recoveries of approximately $6,100,000 on the two Panamax Product Carriers undergoing repairs in2010 as a reduction of charter hire expense, as well as a net 399 day reduction for chartered-in vessels in the currentyear. Repairs on the two Panamax Product Carriers were completed late in the fourth quarter of 2010. The impact of
2010 Annual Report 57

the decrease in days was partially offset by modern Handysize Product Carriers being time chartered-in at higheraverage rates than the older Handysize Product Carriers that were redelivered in 2009, all of which were bareboatchartered-in. Depreciation and amortization decreased by $5,315,000 to $36,193,000 from $41,508,000 in 2009principally due to the expiration of the bareboat charters on the older Handysize Product Carriers.
During 2009, TCE revenues for the International Product Carrier segment decreased by $73,073,000, or 25%, to$225,059,000 from $298,132,000 in 2008. This decrease in TCE revenues principally resulted from a decrease in theaverage rates earned on the Handysize Product Carriers and Panamax Product Carriers operating in the spot market.In addition, revenue days also decreased by 554 days. By the end of August 2009, all 13 of the segment’s older,single-hulled Handysize Product Carriers had redelivered to their owners. These redeliveries were partially offset byan increase in chartered-in modern Handysize Product Carriers, one Aframax Product Carrier (LR2), which operatedin the International Product Carrier segment for 2009, and a net increase in chartered-in Panamax Product Carriers.
Vessel expenses decreased by $12,212,000 to $80,899,000 in 2009 from $93,111,000 in the prior year reflecting a1,776 day decrease in owned and bareboat chartered-in days. This decrease results from the changes in theoperating fleet discussed above. Charter hire expenses increased by $26,165,000 to $105,813,000 in 2009 from$79,648,000 in 2008 due to the increase in time chartered-in modern Handysize Product Carriers, the sale andcharter back of two newbuild Panamax Product Carriers since the third quarter of 2008, and the inclusion of the LR2.These increases were partially offset by the expiration of bareboat charters on the older Handysize Product Carriersdiscussed above. Depreciation and amortization decreased by $14,288,000 to $41,508,000 from $55,796,000 in 2008principally due to the expiration of the bareboat charters on the older Handysize Product Carriers.
In 2005, the Company reflagged three Handysize Product Carriers (the Overseas Ambermar, the Overseas Maremarand the Overseas Luxmar) under the U.S. Flag and entered them in the U.S. Maritime Security Program (the‘‘Program’’). In September 2008, the Overseas Ambermar exited the program and was reflagged under the MarshallIslands Flag. Through 2008, each of the vessel owning companies received approximately $2,600,000 per year. Suchsubsidy, which was increased to $2,900,000 in 2009, is intended to offset the increased cost incurred by suchvessels from operating under the U.S. Flag. Since these vessels trade primarily in the international market, theycontinue to be reflected in the International Product Carrier segment.
Other International
Dollars in thousands 2010 2009 2008
TCE revenues $12,215 $ 7,848 $ 22,102Vessel expenses (2,142) (2,643) (3,204)Charter hire expenses (4,483) — (7,627)Depreciation and amortization (6,152) (6,628) (6,557)
Income/(loss) from vessel operations $ (562) $ (1,423) $ 4,714
Average daily TCE rate $22,089 $21,500 $ 27,942Average number of owned vessels 1.0 1.0 1.0Average number of vessels chartered-in under operating leases 0.6 — 1.2Number of revenue days 553 365 791Number of ship-operating days:
Owned vessels 365 365 366Vessels time chartered-in under operating leases 203 — 425
As of December 31, 2010, the Company operated two Other International Flag vessels, a Pure Car Carrier and a LPGCarrier. The Pure Car Carrier, which is owned by the Company, is employed on a long-term charter. The LPG Carrieris chartered-in by the Company under a charter that commenced in June 2010 and has been extended until June2011. During the third quarter of 2008, the time charters-in of two International Flag Dry Bulk Carriers and relatedpurchase options for such vessels were sold.
58 Overseas Shipholding Group, Inc.

U.S. Segment
Dollars in thousands 2010 2009 2008
TCE revenues $229,573 $ 231,693 $221,820Vessel expenses (96,568) (96,358) (100,423)Charter hire expenses (75,370) (60,296) (39,318)Depreciation and amortization (54,926) (51,614) (52,876)
Income from vessel operations $ 2,709 $ 23,425 $ 29,203
Average daily TCE rate $ 37,455 $ 35,849 $ 33,222Average number of owned vessels 14.8 15.0 16.4Average number of vessels chartered-in under operating leases 8.0 6.4 4.0Number of revenue days 6,130 6,463 6,677Number of ship-operating days:
Owned vessels 5,395 5,479 6,003Vessels bareboat chartered-in under operating leases 2,909 2,350 1,466
The following table provides a breakdown of TCE rates achieved for the years ended December 31, 2010, 2009 and2008 between spot and fixed earnings and the related revenue days.
2010 2009 2008
Spot Fixed Spot Fixed Spot FixedEarnings Earnings Earnings Earnings Earnings Earnings
Handysize Product Carriers:Average rate $13,479 $48,693 $27,622 $43,264 $28,105 $39,494Revenue days 91 3,123 264 2,927 608 2,531
ATBs:Average rate $22,955 $33,500 $28,946 $32,133 $30,615 $30,714Revenue days 1,537 229 1,505 693 1,404 1,225
Lightering:Average rate $28,989 $ — $29,726 $ — $26,580 $ —Revenue days 1,149 — 1,075 — 908 —
In 2010, TCE revenues for the U.S. Segment decreased by $2,120,000, or 1%, to $229,573,000 from $231,693,000 in2009. The decrease in revenue was primarily attributable to weaker market conditions, which resulted in six vesselsbeing in lay-up for a total of 1,727 days during 2010 compared with six vessels being in lay-up for a total of1,196 days in 2009. Four of these vessels were older single-hulled Product Carriers due to reach their OPA-mandatedretirement dates in 2012 and 2013. Partially offsetting the impact of this decrease in revenue days was an increase inaverage daily TCE rates caused by the delivery of three newbuild Product Carriers (including the Overseas Cascade,which completed conversion to a shuttle tanker in March) during 2010 and the full year operation in 2010 of twonewbuild Product Carriers delivered during 2009. Upon delivery from the shipyard, all of these newbuild ProductCarriers began working for customers according to multi-year time charters with fixed rates that were agreed tobefore the start of the economic recession that has negatively affected spot market rates to which the ATBs wereincreasingly exposed in 2010 as their fixed-rate time charters expired.
During 2010, OSG sold and delivered to recyclers two of the Product Carriers that were in lay-up and agreed to sellfor recycling a third tanker, which is shown as held for sale at December 31, 2010, with delivery due in the first halfof 2011. Subsequently, in February 2011, the Company agreed to sell the last of its single-hulled Product Carrierswith delivery due in the first half of 2011. The OSG Honour/OSG 209 was broken out of layup in the fourth quarter assupply/demand fundamentals in the U.S. market improved.
In 2010, vessel expenses increased by $210,000 to $96,568,000 from $96,358,000 in 2009. This increase wasprincipally attributable to a 481 days increase in owned and bareboat chartered-in days during 2010, which reflectsthe deliveries discussed above, partially offset by the impact of the increase in lay-up days discussed above. Charterhire expenses increased by $15,074,000 to $75,370,000 in 2010 from $60,296,000 in 2009 principally due to the
2010 Annual Report 59

delivery in 2010 and 2009 of the newbuild tankers discussed above, four of which are bareboat chartered-in.Depreciation and amortization increased by $3,312,000 to $54,926,000 in 2010 from $51,614,000 in 2009 primarilydue to the deliveries of the Overseas Cascade and the OSG Vision/OSG 350 during 2010.
In 2009, TCE revenues increased by $9,873,000, or 4%, to $231,693,000 from $221,820,000 in 2008. The increasewas the result of an increase in the average rates earned during the period. This increase in rates reflects the deliveryof five additional bareboat chartered-in Jones Act Product Carriers subsequent to mid April 2008, four of whichimmediately commenced time charters. In addition, the Overseas Cascade, which is owned by OSG, delivered inDecember and operated briefly in 2009 in the Delaware Bay lightering trade. The related increase in revenueattributable to these new Jones Act Product Carriers was substantially offset by an increase in lay-up days of 945 inthe current year and the removal from service of two vessels in the fourth quarter of 2008 pending their sale, whichoccurred in 2009. During 2009, there were 364 fewer out-of-service days as a result of drydock and repair days.
In 2009, vessel expenses decreased by $4,065,000 to $96,358,000 from $100,423,000 in 2008. This decrease wasprincipally attributable to the lay-up of four vessels for significant portions of 2009, and the removal from service ofthe Overseas Integrity and M 300 in the fourth quarter of 2008. Charter hire expenses increased $20,978,000 to$60,296,000 in 2009 from $39,318,000 in 2008 principally due to the delivery of four Jones Act Product Carriersreferred to above, which are bareboat chartered-in. Depreciation and amortization decreased by $1,262,000 to$51,614,000 in 2009 from $52,876,000 in 2008 primarily due to the Overseas Integrity and M 300 being classified asheld for sale during the fourth quarter of 2008. Depreciation ceased on these vessels when they were classified asheld for sale, in accordance with applicable accounting guidance.
General and Administrative ExpensesDuring 2010, general and administrative expenses decreased by $20,688,000 to $100,424,000 from $121,112,000 in2009 principally because of the following:
• a decrease in compensation and benefits paid to shore-based staff of approximately $6,209,000;
• reduced legal and consulting costs totaling $4,748,000;
• favorable changes in foreign exchange rates and the impact of foreign currency contracts that reduced losses by$2,016,000;
• lower other non-discretionary costs of $1,096,000; and
• costs in 2009 aggregating $6,309,000 incurred in connection with the tender for all outstanding publicly heldcommon units of OSG America L.P. in the fourth quarter of 2009.
During 2009, general and administrative expenses decreased by $22,951,000 to $121,112,000 from $144,063,000 in2008 principally because of the following:
• a decrease in compensation and benefits paid to shore-based staff of $14,602,000, primarily driven by lowerincentive compensation;
• reduced travel and entertainment costs of $2,526,000;
• favorable changes in foreign exchange rates and the impact of foreign currency contracts that reduced currencylosses by $1,657,000; and
• lower other discretionary costs of $4,577,000.
These decreases were offset by an increase in legal and consulting costs of approximately $1,327,000 attributable toadvisory fees associated with the resolution of commercial disputes with Aker in December 2009 and approximately$6,309,000 of costs incurred in connection with the tender related to OSG America L.P. referred to above.
EQUITY IN INCOME OF AFFILIATED COMPANIESDuring 2010, equity in income of affiliated companies increased by $2,820,000 to $3,593,000 from $773,000 in 2009.The increase was as a result of the completion of the conversion of two ULCCs by the FSO joint venture (asdescribed below) partially offset by the impact of the de-designation of the interest rate swap covering the FSOAfrica’s portion of the joint venture’s debt outstanding.
60 Overseas Shipholding Group, Inc.

As a result of delays in the completion of the conversion of the TI Asia to an FSO, the joint venture chartered-in theTI Oceania, a ULCC wholly owned by the Company, as a temporary replacement floating storage unit. Charter hirereceived from MOQ from early August 2009 through the vessel’s redelivery in January 2010 was substantially offsetby liquidated damages payable by the joint venture to MOQ under the service contracts. The FSO Africa completedconversion in March 2010 and costs incurred subsequent thereto, including fuel costs incurred while at anchorage,have been reflected in profit and loss. The FSO Africa was idle from its delivery through August 30, 2010, at whichtime it commenced a three year service contract with MOQ. Because of MOQ’s notification that it was cancelling theservice contract for the FSO Africa, the joint venture recorded a charge in the first quarter of 2010 attributable to thede-designation of interest rate swaps that were being accounted for as cash flow hedges. The change in the fairvalue of the FSO Africa interest rate swaps resulted in charges of $19,770,000 in 2010. The Company’s share of suchcharges, $9,885,000, was recognized in results from affiliated companies. The reduction in borrowing capacity relatedto the FSO Africa debt agreed to in the fourth quarter of 2010 resulted in the joint venture recognizing a charge of$716,000 for the write-off of a portion of the unamortized balance of deferred finance charges. For more informationwith respect to the conversion of the two ULCCs to FSOs see below in the discussion of ‘‘Liquidity and Sources ofCapital.’’
During 2009, equity in income of affiliated companies decreased by $11,519,000 to $773,000 from $12,292,000 in2008. The decrease resulted from the Company’s share of costs incurred by the FSO joint venture (as describedbelow) and lower earnings from the LNG joint venture resulting from the impact of interest rate swaps that principallycommenced subsequent to June 30, 2008.
The FSO Asia completed conversion in November 2009 and costs incurred subsequent thereto have been reflected inprofit and loss. The FSO Asia experienced mechanical problems that delayed commencement of its charter untilJanuary 4, 2010. The delay in the conversion of the TI Africa to an FSO resulted in additional costs, includingliquidating damages commencing in late September 2009. Because of the delays in completion of conversion of bothFSOs, the joint venture recorded charges aggregating $6,546,000 attributable to the ineffectiveness of interest rateswaps that were being accounted as cash flow hedges.
Results for 2008 also include OSG’s share, approximately $1,600,000, of a severance arrangement recorded by acompany that is accounted for using the equity method as well as the Company’s share of the results of the FSOjoint venture that was converting the first of two ULCCs to FSOs at December 31, 2008. The 2008 results of this jointventure consisted principally of project management costs.
Additionally, the Company has a 37.5% interest in ATC, a company that operates U.S. Flag tankers to transportAlaskan crude oil for BP. ATC earns additional income (in the form of incentive hire paid by BP) based on meetingcertain predetermined performance standards. Such income is included in the U.S. segment.
The following table summarizes OSG’s proportionate share of the revenue days for the respective vessels held in itsvessel owning equity method investments, excluding ATC. Revenue days are adjusted for OSG’s percentageownership in order to state the revenue days on a basis comparable to that of a wholly-owned vessel. The ownershippercentages reflected below are the Company’s actual ownership percentages as of December 31 of each year.
2010 2009 2008
Revenue % of Revenue % of Revenue % ofDays Ownership Days Ownership Days Ownership
LNG Carriers operating on long-term charters 729 49.9% 729 49.9% 681 49.9%FSOs operating on long-term charter 243 50.0% — — — —ULCC operating as temporary FSO 11 50.0% 81 50.0% — —
Total 983 810 681
INTEREST EXPENSEThe components of interest expense are as follows:
In thousands for the year ended December 31, 2010 2009 2008
Interest before impact of swaps and capitalized interest $ 64,692 $ 44,661 $ 78,666Impact of swaps 12,686 11,223 2,584Capitalized interest (10,334) (10,759) (23,801)
Interest expense $ 67,044 $ 45,125 $ 57,449
2010 Annual Report 61

The Company’s issuance of $300,000,000 principal amount of 8.125% senior unsecured notes in March 2010 anduse of the net proceeds to reduce amounts borrowed under the long-term revolving credit facility, resulted in anincrease in interest expense for the year ended December 31, 2010. Interest expense for the year endedDecember 31, 2010 also includes a $1,029,000 write off of the unamortized balance of deferred finance charges withrespect to the $200,000,000 secured revolving credit facility, which the Company terminated in June 2010. The aboveincreases were offset by the prepayment on July 1, 2010 of $42,174,000 of fixed rate term loans with a weightedaverage interest rate of 6%. Such prepayment was funded using funds borrowed under the long-term revolving creditfacility.
The Company’s redemption of the $176,115,000 outstanding balance of its 8.25% Senior Notes in May 2008, usingfunds borrowed under the long-term revolving credit facility that were swapped into fixed rates at a weighted averageof approximately 3.3%, locked in a reduction in interest expense of approximately $7,000,000 per annum throughMarch 2013.
Interest expense increased by $21,919,000 to $67,044,000 in 2010 from $45,125,000 in 2009 as a result of increasesin the average amount of variable debt outstanding of $170,431,000 and the issuance of 8.125% senior unsecurednotes, net of the impact of the prepayment of 6% term loans, described above, partially offset by a decrease in theaverage rate paid on floating rate debt of 10 basis points to 1.4% from 1.5% in 2009.
Interest expense decreased by $12,324,000 to $45,125,000 in 2009 from $57,449,000 in 2008 as a result of theCompany’s redemption of the $176,115,000 outstanding balance of its 8.25% Senior Notes and a decrease in theaverage rate paid on floating rate debt of about 240 basis points to 1.5% from 3.9% in 2008. These decreases werepartially offset by an increase in the average amount of debt outstanding of $32,000,000, higher expenses on theinterest rate swaps resulting from the decline in LIBOR rates for 2009 compared with 2008 and a reduction in interestcapitalized.
INCOME TAX PROVISION/(BENEFIT)The income tax benefits for 2010, 2009 and 2008 are substantially based on the pre-tax results of the Company’sU.S. operations, adjusted to include non shipping income of the Company’s foreign subsidiaries.
The tax benefit for 2010 reflects the net reversal of previously established deferred tax liabilities aggregatingapproximately $10,100,000, including the impact of adjusting prior year differences (between financial statementtreatment and tax accounting for certain items), which were estimated as of year-end 2009, to actual based on taxreturns as filed.
On November 6, 2009, the President of the U.S. signed the Worker, Homeownership, and Business Assistance Act of2009. This law included a provision allowing taxpayers to elect an increased carryback for net operating lossesincurred in either 2008 or 2009. As a result, the Company was permitted to carryback 2009 tax losses ofapproximately $120,000,000 against earnings generated in 2004. In addition, OSG also recognized a charge ofapproximately $3,700,000 attributable to the net increase in deferred tax liabilities in 2009. This increase was net of abenefit aggregating approximately $4,700,000 attributable to a reduction in deferred tax liabilities recognized upondissolution for tax purposes of the partnership, OSG America L.P., in 2009.
The 2008 year reflects the carryback of approximately $11,000,000 of 2008 tax losses against the Company’s 2007taxable income. In addition, the vessel write-downs recorded in 2008 gave rise to the reversal of previouslyestablished deferred tax liabilities aggregating approximately $26,300,000.
EBITDAEBITDA represents operating earnings excluding net income/(loss) attributable to the noncontrolling interest, which isbefore interest expense and income taxes, plus other income/(expense) and depreciation and amortization expense.EBITDA is presented to provide investors with meaningful additional information that management uses to monitorongoing operating results and evaluate trends over comparative periods. EBITDA should not be considered asubstitute for net income/(loss) attributable to the Company or cash flow from operating activities prepared inaccordance with accounting principles generally accepted in the United States or as a measure of profitability orliquidity. While EBITDA is frequently used as a measure of operating results and performance, it is not necessarilycomparable to other similarly titled captions of other companies due to differences in methods of calculation. The
62 Overseas Shipholding Group, Inc.

following table reconciles net (loss)/income, as reflected in the consolidated statements of operations, to EBITDA (inthousands):
In thousands for the year ended December 31, 2010 2009 2008
Net (loss)/income attributable to Overseas Shipholding Group, Inc. $(134,243) $ 70,170 $317,665Income tax benefit (7,456) (36,697) (34,004)Interest expense 67,044 45,125 57,449Depreciation and amortization 170,670 172,404 189,163
EBITDA $ 96,015 $251,002 $530,273
EFFECTS OF INFLATIONThe Company does not believe that inflation has had or is likely, in the foreseeable future, to have a significantimpact on vessel operating expenses, drydocking expenses and general and administrative expenses.
LIQUIDITY AND SOURCES OF CAPITALWorking capital at December 31, 2010 was approximately $421,000,000 compared with $634,000,000 atDecember 31, 2009 and $483,000,000 at December 31, 2008. Current assets are highly liquid, consisting principallyof cash, interest-bearing deposits and receivables. The Company maintained a Capital Construction Fund with amarket value of approximately $41,000,000 at December 31, 2009, which was used during 2010 to fund remainingpayments towards the construction of two U.S. Flag ATBs.
Net cash used by operating activities approximated $28,000,000 in 2010 compared with net cash provided byoperating activities of $218,000,000 in 2009 and $376,000,000 in 2008. Current financial resources, together withcash anticipated to be generated from operations, which includes a tax refund of approximately $41,000,000 receivedin January 2011 (relating to the 2009 tax loss carryback discussed in ‘‘Income Tax Provision/(Benefit)’’ above), areexpected to be adequate to meet requirements in the next year.
The Company’s reliance on the spot market contributes to fluctuations in cash flows from operating activitieshistorically as a result of the exposure to highly cyclical tanker rates and more recently as a result of the impact ofthe downturn in the world economy on shipping markets, as described in more detail under ‘‘Operations’’ earlier inItem 7. Spot (voyage) charter rates in 2010 and 2009 have been at depressed levels and opportunities to enter longerterm time charters at satisfactory rates have been very limited. Therefore, expiring time charters and synthetic timecharters (utilizing FFAs and bunker swaps) have been replaced at significantly lower TCE rates.
In order to increase liquidity, the Company periodically evaluates transactions which may result in either the sale orthe sale and leaseback of certain vessels in its fleet. The Company continues to monitor and evaluate the timing ofrepurchases of stock under its share buy back program. Because of continued weakness in the financial and creditmarkets and the depressed shipping markets there is greater focus on maintaining cash balances and liquidity. TheCompany continually reviews the amount of its regular quarterly dividend to determine whether it is sustainable atcurrent levels as part of its strategy to provide growth in returns to stockholders while maintaining a strong balancesheet. Future dividends, similar to the stock repurchase program, will be evaluated as part of managing the balancesheet and cash.
On March 9, 2010, pursuant to a Form S-3 shelf registration, the Company sold 3,500,000 shares of its commonstock at a price of $45.33 per share. The Company received net proceeds of $158,266,000, after deductingestimated expenses. OSG used the net proceeds from this offering for working capital purposes and the repaymentof outstanding indebtedness under its unsecured revolving credit facility.
On March 29, 2010, pursuant to a Form S-3 shelf registration filed on March 4, 2010, the Company issued$300,000,000 principal amount of senior unsecured notes. The notes are due in March 2018 and have a coupon of8.125%. The Company received net proceeds of approximately $289,745,000, after deducting underwriting discountsand commissions and estimated expenses. OSG used the net proceeds from the offering to reduce outstandingindebtedness under its unsecured revolving credit facility. The indentures pursuant to which the Company’s seniorunsecured notes were issued require the Company to secure its senior unsecured notes equally and comparably withany other unsecured indebtedness in the event OSG is required to secure such debt.
On June 24, 2010, the Company terminated its $200,000,000 secured revolver credit facility.
2010 Annual Report 63

On July 1, 2010, the Company prepaid fixed rate secured term loans due through 2014 with an outstanding balanceof $42,174,000. The weighted average interest rate of this debt was 6.0%. The Company funded this repayment withborrowings from its $1,800,000,000 unsecured credit facility. The unsecured credit facility has a floating rate based onLIBOR, which was approximately 0.3% at December 31, 2010.
In December 2009, the Company completed its purchase of all of the outstanding publicly held Units of OSGAmerica L.P., a master limited partnership (‘‘MLP’’), for $10.25 in cash per unit. The Company financed the purchaseprice of $71,792,000 through funds drawn under its $1.8 billion credit facility. The Company had completed an initialpublic offering of OSG America L.P. in November 2007, issuing 7,500,000 Units priced at $19.00 per unit. The MLPtraded on the New York Stock Exchange under the ticker ‘‘OSP’’. That transaction generated approximately$129,300,000 in proceeds to OSG, which the Company used to pay down debt in the fourth quarter of 2007.
In August 2009, the Company entered into a $389,000,000, 12-year secured facility with the Export-Import Bank ofChina. Borrowings under the facility will be used toward financing three VLCCs and two Aframaxes constructed inChina. Borrowings under the facility bear interest at a rate based on LIBOR. In September 2009, the Companyborrowed $299,156,000 under this facility. As of December 31, 2010, the Company had unused availability ofapproximately $89,807,000 under this facility.
In addition to the secured facility described above, the Company has a $1,800,000,000 seven-year unsecuredrevolving credit agreement maturing in 2013 with a group of banks (except that in February 2011 the maximumamount the Company may borrow under the credit agreement is reduced by $150 million and such amount is furtherreduced by an additional $150 million in February 2012). Borrowings under this facility bear interest at a rate basedon LIBOR. As of December 31, 2010, OSG had approximately $807,000,000 outstanding under this facility and anadditional $1,256,000 had been used for letters of credit. The current financial resources available under theunsecured credit facility are significant and remain a stable source of funds for the Company especially in the currentweak financial and tight credit markets. The availability under the unsecured credit facility plus cash on hand andcash expected to be generated from operations should be sufficient to allow the Company to meet both its operatingand capital requirements for vessels under construction in the short and medium term.
The Company was in compliance with all of the financial covenants contained in the Company’s debt agreements asof December 31, 2010 and projects continued compliance over the next twelve months. Certain of the Company’sdebt agreements contain loan-to-value clauses, which could require OSG to post collateral or prepay a portion of theoutstanding borrowings should the value of the vessels securing borrowings under each of such agreementsdecrease below their current valuations.
The financing agreements impose operating restrictions and establish minimum financial covenants. Failure to complywith any of the covenants in the financing agreements could result in a default under those agreements and underother agreements containing cross-default provisions. A default would permit lenders to accelerate the maturity of thedebt under these agreements and to foreclose upon any collateral securing that debt. Under those circumstances,the Company might not have sufficient funds or other resources to satisfy its obligations.
In March 2010, Moody’s affirmed the Ba2 corporate rating of the Company but downgraded the Company’s seniorunsecured debt to Ba3 from Ba2 and changed the ratings outlook to negative. Moody’s downgrade of the seniorunsecured rating is a consequence of a shift in the composition of the Company’s debt to capital ratio to one with ahigher proportion of senior secured debt. In January 2011, Standard & Poor’s downgraded the Company’s long-termcorporate credit rating and the rating on the Company’s senior unsecured debt from BB- to B while maintaining itsoutlook as stable. Standard and Poor’s rating is currently three notches below that of Moody’s corporate rating.Standard and Poor’s attributed its downgrade to revenue and earnings declines resulting from the prolongedweakness in the tanker markets and the Company’s leverage. Further increases in debt, either from sharerepurchases, acquisitions or additional charter-in commitments could result in additional downgrades as could aprotracted downturn in freight rates. The downgrade does not impact any of the existing financial covenantscontained in the Company’s debt agreements, which do not contain ratings triggers, nor does it increase theCompany’s current cost of funds, but could increase the cost of future borrowings it seeks to negotiate.
Off-Balance Sheet ArrangementsAs of December 31, 2010, the affiliated companies in which OSG held an equity interest had total bank debtoutstanding of $1,187,257,000 of which $844,864,000 was nonrecourse to the Company.
64 Overseas Shipholding Group, Inc.

In February 2008, MOQ awarded two service contracts to a joint venture between OSG and Euronav NV for terms ofapproximately eight years, ending in the second half of 2017, to provide to MOQ two vessels, the FSO Asia and theFSO Africa, respectively, to perform Floating, Storage and Offloading (‘‘FSO’’) services in the Al Shaheen field offshore Qatar after each vessel had been converted to an FSO. The Company has a 50% interest in this joint venture.The first ULCC, the TI Asia, which was wholly owned by Euronav NV, was sold to the joint venture in October 2008for approximately $200,000,000. The second ULCC, the TI Africa, which was wholly owned by OSG, was sold to thejoint venture in January 2009 for approximately $200,000,000. The joint venture financed the purchase of the vesselsthrough long-term secured bank financing and partner loans. The joint venture entered into a $500,000,000 creditfacility, which was secured by the service contracts to partially finance the acquisition of the two ULCCs and the costof conversion. The joint venture entered into floating-to-fixed interest rate swaps with major financial institutionscovering notional amounts aggregating $439,622,000 as of December 31, 2010, which pay fixed rates of 3.9% andreceive floating rates based on LIBOR. These agreements commenced in the third quarter of 2009 and have maturitydates ranging from July to September 2017.
After experiencing construction delays, the FSO Asia delivered to MOQ on January 5, 2010. The conversion of the TIAfrica to an FSO also experienced construction delays and on January 21, 2010, MOQ notified the joint venturepartners that it was canceling the service contract for the FSO Africa due to the delayed delivery. The conversion ofthe FSO Africa was completed on March 14, 2010. As a result of the cancellation of the service contract of the FSOAfrica, the joint venture partners were required to post $143,000,000 in cash collateral in consideration of the banksagreeing to waive, for a period that ended in November 2010, the acceleration of amounts outstanding under thefacility related to the FSO Africa, which aggregated to $143,000,000 as of January 21, 2010. As of March 31, 2010,the Company concluded that it was no longer probable that the forecasted transaction applicable to the FSO Africaswaps would occur. Accordingly, the Company de-designated the FSO Africa swaps and recognized a loss of$4,548,000, representing its share of amounts previously included in accumulated other comprehensive income/(loss)by the joint venture applicable to the FSO Africa swaps, which have a remaining notional balance of $219,811,000 atDecember 31, 2010. On December 1, 2010, the joint venture entered into an agreement with the lenders torestructure the FSO Africa tranche of the loan facility reducing the balance available to borrow to $120,000,000,shortening the term of the loan to approximately three years and increasing the margin over LIBOR. As a result ofthis amendment, cash collateral aggregating $111,000,000, was released to the joint venture partners in December2010. Approximately $342,393,000 was outstanding under this facility as of December 31, 2010, with the outstandingamount of this facility being subject to acceleration, in whole or in part, on termination of one or both of such servicecontracts. In connection with the secured bank financing, the partners severally issued 50% guaranties.
In November 2004, the Company formed a joint venture with Qatar Gas Transport Company Limited (Nakilat) wherebycompanies in which OSG holds a 49.9% interest ordered four 216,000 cbm LNG Carriers. Upon delivery in 2007 and2008, these vessels commenced 25-year time charters to Qatar Liquefied Gas Company Limited (II). The aggregateconstruction cost for such newbuildings of $918,026,000 was financed by the joint venture through long-term bankfinancing that is nonrecourse to the partners and partner contributions. The joint venture has entered intofloating-to-fixed interest rate swaps with a group of major financial institutions that are being accounted for as cashflow hedges. The interest rate swaps cover notional amounts aggregating approximately $819,987,000 atDecember 31, 2010, pursuant to which it pays fixed rates of approximately 4.9% and receives a floating rate basedon LIBOR. These agreements have maturity dates ranging from July to November 2022.
2010 Annual Report 65
Aggregate Contractual ObligationsA summary of the Company’s long-term contractual obligations as of December 31, 2010 follows:
BeyondIn thousands 2011 2012 2013 2014 2015 2015 Total
Debt (1) $117,323 $123,739 $ 990,446 $108,349 $ 88,561 $1,033,185 $2,461,603Operating lease
obligations (2)
Bareboat Charter-ins 151,003 153,304 152,832 142,490 87,108 199,543 886,280Time Charter-ins (3) 198,355 137,010 83,230 77,106 69,348 118,079 683,128
Construction contracts (4) 151,772 33,638 36,633 — — — 222,043Operating lease
obligations (officespace) 4,689 4,677 4,694 3,973 3,444 16,469 37,946
Total $623,142 $452,368 $1,267,835 $331,918 $248,461 $1,367,276 $4,291,000
(1) Amounts shown include contractual interest obligations. The interest obligations for floating rate debt of $1,445,106 as of December 31,2010 have been estimated based on the fixed rates stated in related floating-to-fixed interest rate swaps, where applicable, or the LIBORrate at December 31, 2010 of 0.30%. The Company is a party to floating-to-fixed interest rate swaps covering notional amountsaggregating approximately $401,828 at December 31, 2010 that effectively convert the Company’s interest rate exposure from a floatingrate based on LIBOR to an average fixed rate of 4.0%.
(2) As of December 31, 2010, the Company had charter-in commitments for 50 vessels on leases that are, or will be, accounted for asoperating leases. Certain of these leases provide the Company with various renewal and purchase options. The future minimumcommitments for time charters-in have been reduced to reflect estimated days that the vessels will not be available for employment dueto drydock.
(3) The Company estimates that its obligations under these time charter-in contracts expressed on a bareboat charter-in equivalent basiswould be reduced to $127,453 (2011), $85,203 (2012), $48,203 (2013), $43,832 (2014), $39,359 (2015) and $66,585 (2016 and thereafter),an aggregate reduction of $272,494. The Company estimated the bareboat equivalent charter-in obligations, by adjusting the applicabledaily time charter-in rate by the daily average vessel operating expenses for the Company’s different vessel classes in 2010.
(4) Represents remaining commitments under shipyard construction contracts or estimates thereof, excluding capitalized interest and otherconstruction costs.
In addition to the above long-term contractual obligations the Company has certain obligations for its domesticshore-based employees as of December 31, 2010, related to pension and other post retirement benefit plans asfollows:
In thousands 2011 2012 2013 2014 2015
Supplemental pension plan obligations (1) $ 62 $ 44 $ 37 $ 30 $ 24Defined benefit pension plan contributions (2) 1,783 1,550 1,625 1,575 1,375Postretirement health care plan obligations (3) 180 195 206 221 223
(1) Obligations are included herein only if the retirement of a covered individual is known as of December 31, 2010.
(2) Represents estimated contributions under the Maritrans Inc. defined benefit retirement plan.
(3) Amounts are estimated based on the 2010 cost taking the assumed health care cost trend rate for 2011 to 2015 into consideration. SeeNote P to the consolidated financial statements set forth in Item 8. Because of the subjective nature of the assumptions made, actualpremiums paid in future years may differ significantly from the estimated amounts.
OSG has used interest rate swaps to convert a portion of its debt from a floating rate to a fixed rate based onmanagement’s interest rate outlook at various times. These agreements contain no leverage features and havevarious final maturity dates from March 2011 to August 2014.
OSG expects to finance any vessel commitments from working capital, cash anticipated to be generated fromoperations, existing long-term credit facilities and additional long-term debt, as required. The amounts of workingcapital and cash generated from operations that may, in the future, be utilized to finance vessel commitments aredependent on the rates at which the Company can charter its vessels. Such charter rates are volatile.
66 Overseas Shipholding Group, Inc.
RISK MANAGEMENTThe Company is exposed to market risk from changes in interest rates, which could impact its results of operationsand financial condition. The Company manages this exposure to market risk through its regular operating andfinancing activities and, when deemed appropriate, through the use of derivative financial instruments. The Companymanages its ratio of fixed-to-floating rate debt with the objective of achieving a mix that reflects management’sinterest rate outlook at various times. To manage this mix in a cost-effective manner, the Company, from time-to-time,enters into interest rate swap agreements, in which it agrees to exchange various combinations of fixed and variableinterest rates based on agreed upon notional amounts. The Company uses such derivative financial instruments asrisk management tools and not for speculative or trading purposes. In addition, derivative financial instruments areentered into with a diversified group of major financial institutions in order to manage exposure to nonperformance onsuch instruments by the counterparties.
The Company seeks to reduce its exposure to fluctuations in foreign exchange rates through the use of foreigncurrency forward contracts and through the purchase of bulk quantities of currencies at rates that managementconsiders favorable. For these contracts, which qualify as cash flow hedges for accounting purposes, hedgeeffectiveness is assessed based on changes in foreign exchange spot rates with the change in fair value of theeffective portions being recorded in accumulated other comprehensive income/(loss). As of December 31, 2010, theCompany has recorded a net asset of approximately $298,000 related to the fair values of these contracts, whichsettle monthly between January and May 2011 and cover approximately £1,000,000 and e2,000,000 per month.
OSG’s management regularly reviews the strategic decision with respect to the appropriate ratio of spot charterrevenues to fixed rate charter revenues taking into account its expectations about spot and time charter forwardrates. Decisions to modify fixed rate coverage are implemented in either the physical markets through changes intime charters or in the FFA markets, thus managing the desired strategic position while maintaining flexibility of shipavailability to customers. OSG enters into Forward Freight Agreements and bunker swaps with an objective ofeconomically hedging risk. The Company enters into FFAs and bunker swaps as economic hedges, some of whichqualify as cash flow hedges for accounting purposes, seeking to reduce its exposure to changes in TCE revenueearned by some of its vessels in the normal course of its shipping business. By using FFAs and bunker swaps, OSGmanages the financial risk associated with fluctuating market conditions. FFAs and bunker swaps generally coverperiods ranging from one month to one year and involve contracts entered into at various rates with the intention ofoffsetting the variability of the TCE earnings from certain of the pools in which it participates. FFAs and bunker swapsare executed predominantly through NOS ASA, a Norwegian clearing house or, LCH, London Clearing House. NOSASA and LCH require the posting of collateral by all participants. The use of a clearing house reduces the Company’sexposure to counterparty credit risk.
The Company’s VLCCs are deployed and earn revenue through commercial pools that operate on multiple routes onvoyages of varying durations, which differs from the standard routes associated with the related hedging instruments.Therefore, the FFA and bunker hedges that qualify as cash flow hedges for accounting purposes have basis risk. TheTCE rates for the pools are computed from the results of actual voyages performed during the period whereas therates used for settling FFA and bunker hedges are calculated as simple averages of the daily rates for standardroutes reported with each daily rate weighted equally. High volatility tends to weaken the statistical relationshipbetween pool performance and the FFA market results.
The second half of 2008 for example experienced extremely high volatility both in freight rates and bunker prices.Tankers International pool’s VLCC earnings do not fluctuate as much as TD-3 since the pool’s cargo system withlonger Arabian Gulf to Western destination and West Africa to Eastern destination combination voyages smoothes outthe pool’s earnings. The historical difference in volatility between TD-3 and Tankers International pool’s earnings isanalyzed and the volume of the hedge position optimized to maximize correlation.
The Company also seeks to reduce its exposure to future increases in fuel prices in the normal course of itsInternational Crude Tankers lightering business, which includes a number of fixed rate Contracts of Affreightment, byentering into stand alone bunker swaps. During August 2010, the Company entered into an agreement with acounterparty to purchase 787 metric tons per month of fuel oil for $429.57 per metric ton. This contract settles on anet basis at the end of each calendar month from September 2010 through June 2011 based on the average dailyclosing prices, as quoted by the Baltic Exchange, of the commodity during each month. This swap, representing anaggregate volume of 7,874 metric tons of fuel, does not qualify as a cash flow hedge for accounting purposes. As ofDecember 31, 2010, the Company has recorded an asset of $271,000 related to the remaining fair value of thiscontract.
2010 Annual Report 67

The shipping industry’s functional currency is the U.S. dollar. All of the Company’s revenues and most of its operatingcosts are in U.S. dollars.
INTEREST RATE SENSITIVITYThe following tables provide information about the Company’s derivative financial instruments and other financialinstruments that are sensitive to changes in interest rates. For debt obligations, the tables present principal cashflows and related weighted average interest rates by expected maturity dates. For interest rate swaps, the tablespresent notional amounts and weighted average interest rates by contractual maturity dates. Notional amounts areused to calculate the contractual cash flows to be exchanged under the contracts.
Principal (Notional) Amount (dollars in millions) by Expected Maturity and Average Interest (Swap) RateFair Value at
Beyond Dec. 31,At December 31, 2010 2011 2012 2013 2014 2015 2015 Total 2010
LiabilitiesLong-term debt, including current
portion:Fixed rate $3.0 $3.0 $76.3 $16.7 — $446.0 $545.0 $533.8Average interest rate 5.0% 5.0% 8.6% 5.0% — 7.9%Variable rate $41.6 $50.9 $857.9 $46.8 $45.4 $402.5 $1,445.1 $1,394.4Average spread over LIBOR 1.2% 1.4% 0.7% 1.3% 1.3% 1.4%
Interest Rate SwapsPay fixed/receive variable* $90.9 $120.9 $184.3 $5.6 — — $401.8 $16.0Average pay rate 3.2% 3.6% 3.3% 4.7% — —
Fair Value atBeyond Dec. 31,
At December 31, 2009 2010 2011 2012 2013 2014 2014 Total 2009
LiabilitiesLong-term debt including current
portion:Fixed rate $6.2 $6.4 $6.6 $94.8 $33.0 $146.0 $293.1 $272.8Average interest rate 5.5% 5.5% 5.5% 8.1% 5.6% 7.5%Variable rate $27.0 $30.8 $70.1 $993.1 $40.1 $392.3 $1,553.5 $1,488.1Average spread over LIBOR 0.9% 1.1% 1.1% 0.7% 1.4% 1.5%
Interest Rate SwapsPay fixed/receive variable* $50.9 $90.9 $120.9 $184.3 $5.6 — $452.8 $15.3Average pay rate 3.4% 3.2% 3.6% 3.3% 4.7% —
* LIBOR
As of December 31, 2010, the Company had one long-term revolving credit facility under which borrowings bearinterest at a rate based on LIBOR, plus the applicable margin, as stated in the credit facility agreement.
68 Overseas Shipholding Group, Inc.
ITEM 7A. QUANTITATIVE AND QUALITATIVE DISCLOSURES ABOUT MARKET RISK
See Item 7.
ITEM 8.
FINANCIAL STATEMENTS AND SUPPLEMENTARY DATA
TABLE OF CONTENTS
PageYears ended December 31, 2010, 2009 and 2008
Consolidated Balance Sheets at December 31, 2010 and 2009 . . . . . . . . . . . . . . . . . . . . . . . . . . . . . 70
Consolidated Statements of Operations for the Years Ended December 31, 2010, 2009 and 2008 . . . . . . 71
Consolidated Statements of Cash Flows for the Years Ended December 31, 2010, 2009 and 2008 . . . . . . 72
Consolidated Statements of Changes in Equity for the Years Ended December 31, 2010, 2009 and 2008 . 73
Notes to Consolidated Financial Statements . . . . . . . . . . . . . . . . . . . . . . . . . . . . . . . . . . . . . . . . . 74
Reports of Independent Registered Public Accounting Firms . . . . . . . . . . . . . . . . . . . . . . . . . . . . . . . 109
2010 Annual Report 69
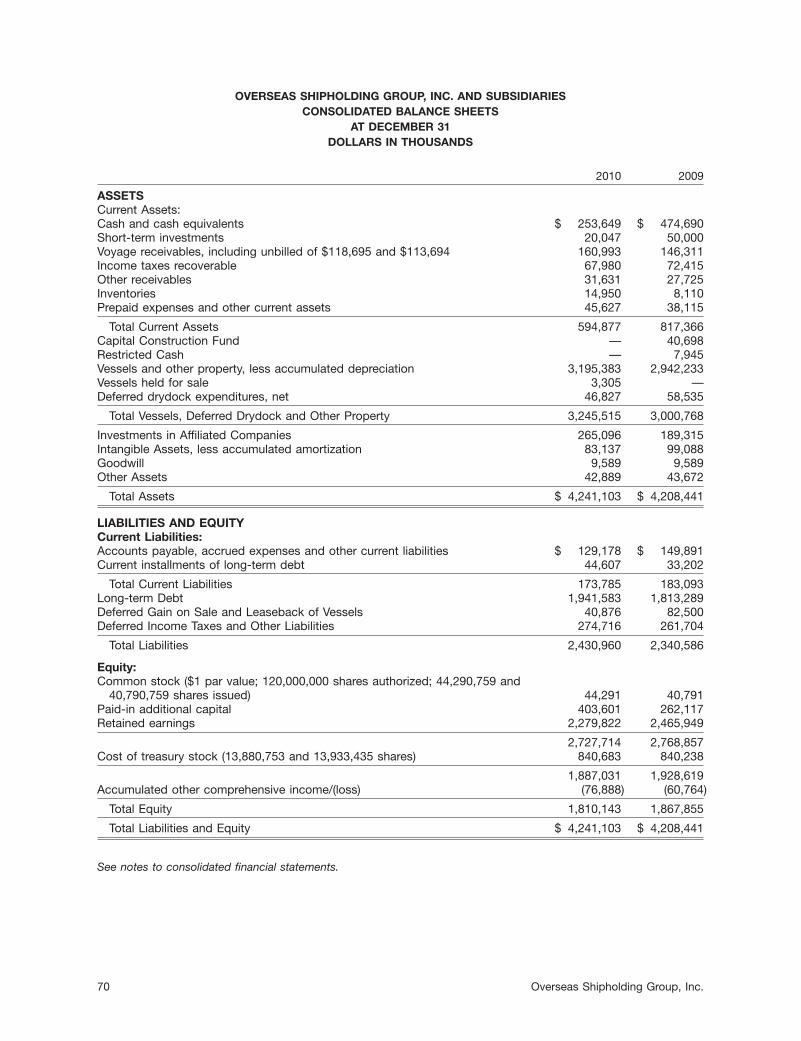
OVERSEAS SHIPHOLDING GROUP, INC. AND SUBSIDIARIESCONSOLIDATED BALANCE SHEETS
AT DECEMBER 31DOLLARS IN THOUSANDS
2010 2009
ASSETSCurrent Assets:Cash and cash equivalents $ 253,649 $ 474,690Short-term investments 20,047 50,000Voyage receivables, including unbilled of $118,695 and $113,694 160,993 146,311Income taxes recoverable 67,980 72,415Other receivables 31,631 27,725Inventories 14,950 8,110Prepaid expenses and other current assets 45,627 38,115
Total Current Assets 594,877 817,366Capital Construction Fund — 40,698Restricted Cash — 7,945Vessels and other property, less accumulated depreciation 3,195,383 2,942,233Vessels held for sale 3,305 —Deferred drydock expenditures, net 46,827 58,535
Total Vessels, Deferred Drydock and Other Property 3,245,515 3,000,768
Investments in Affiliated Companies 265,096 189,315Intangible Assets, less accumulated amortization 83,137 99,088Goodwill 9,589 9,589Other Assets 42,889 43,672
Total Assets $ 4,241,103 $ 4,208,441
LIABILITIES AND EQUITYCurrent Liabilities:Accounts payable, accrued expenses and other current liabilities $ 129,178 $ 149,891Current installments of long-term debt 44,607 33,202
Total Current Liabilities 173,785 183,093Long-term Debt 1,941,583 1,813,289Deferred Gain on Sale and Leaseback of Vessels 40,876 82,500Deferred Income Taxes and Other Liabilities 274,716 261,704
Total Liabilities 2,430,960 2,340,586
Equity:Common stock ($1 par value; 120,000,000 shares authorized; 44,290,759 and
40,790,759 shares issued) 44,291 40,791Paid-in additional capital 403,601 262,117Retained earnings 2,279,822 2,465,949
2,727,714 2,768,857Cost of treasury stock (13,880,753 and 13,933,435 shares) 840,683 840,238
1,887,031 1,928,619Accumulated other comprehensive income/(loss) (76,888) (60,764)
Total Equity 1,810,143 1,867,855
Total Liabilities and Equity $ 4,241,103 $ 4,208,441
See notes to consolidated financial statements.
70 Overseas Shipholding Group, Inc.

OVERSEAS SHIPHOLDING GROUP, INC. AND SUBSIDIARIESCONSOLIDATED STATEMENTS OF OPERATIONS
FOR THE YEARS ENDED DECEMBER 31DOLLARS IN THOUSANDS, EXCEPT PER SHARE AMOUNTS
2010 2009 2008
Shipping Revenues:Pool revenues, including $68,231 in 2010, $101,914 in 2009 and
$160,972 in 2008 received from companies accounted for by theequity method $ 355,915 $ 398,321 $ 906,291
Time and bareboat charter revenues 276,636 325,590 366,629Voyage charter revenues 413,059 369,707 431,777
Total Shipping Revenues 1,045,610 1,093,618 1,704,697
Operating Expenses:Voyage expenses 192,332 140,997 159,312Vessel expenses 265,251 283,952 314,553Charter hire expenses 369,667 396,232 429,808Depreciation and amortization 170,670 172,404 189,163General and administrative 100,424 121,112 144,063Severance and relocation costs — 2,317 —Shipyard contract termination costs (recoveries) (2,061) 26,960 —Goodwill impairment charge — — 62,874(Gain)/loss on disposal of vessels, net of impairments 28,622 (127,486) 59,738
Total Operating Expenses 1,124,905 1,016,488 1,359,511
(Loss)/Income from Vessel Operations (79,295) 77,130 345,186Equity in Income of Affiliated Companies 3,593 773 12,292
Operating (Loss)/Income (75,702) 77,903 357,478Other Income/(Expense) 1,047 1,672 (28,847)
(Loss)/Income before Interest Expense and Taxes (74,655) 79,575 328,631Interest Expense (67,044) (45,125) (57,449)
(Loss)/Income before Income Taxes (141,699) 34,450 271,182Income Tax Benefit 7,456 36,697 34,004
Net (Loss)/Income (134,243) 71,147 305,186Less: Net (Income)/Loss Attributable to the Noncontrolling Interest — (977) 12,479
Net (Loss)/Income Attributable to Overseas Shipholding Group, Inc. $ (134,243) $ 70,170 $ 317,665
Weighted Average Number of Common Shares Outstanding:Basic 29,498,127 26,863,958 29,648,230Diluted 29,498,127 26,869,427 29,814,221
Per Share Amounts:Basic net (loss)/income attributable to Overseas Shipholding
Group, Inc. common stockholders $ (4.55) $ 2.61 $ 10.71Diluted net (loss)/income attributable to Overseas Shipholding
Group, Inc. common stockholders $ (4.55) $ 2.61 $ 10.65Cash dividends declared $ 1.75 $ 1.75 $ 1.50
See notes to consolidated financial statements.
2010 Annual Report 71

OVERSEAS SHIPHOLDING GROUP, INC. AND SUBSIDIARIESCONSOLIDATED STATEMENTS OF CASH FLOWS
FOR THE YEARS ENDED DECEMBER 31DOLLARS IN THOUSANDS
2010 2009 2008
Cash Flows from Operating Activities:Net (loss)/income $(134,243) $ 71,147 $ 305,186Items included in net (loss)/income not affecting cash flows:
Depreciation and amortization 170,670 172,404 189,163Goodwill impairment charge — — 62,874Loss on write-down of vessels 28,783 12,500 137,708Amortization of deferred gain on sale and leasebacks (41,624) (44,946) (47,971)Amortization of debt discount and other deferred financing costs 4,081 1,983 4,624Compensation relating to restricted stock and
stock option grants 11,940 14,214 12,674Deferred income tax provision/(benefit) (10,176) 3,698 (26,136)Unrealized gains on forward freight agreements and bunker swaps (345) (460) (2,137)Undistributed earnings of affiliated companies 7,388 18,445 (6,445)Deferred payment obligations on charters-in 4,931 4,644 3,732Other—net 5,717 8,966 4,272
Items included in net (loss)/income related to investing and financing activities:Loss on sale or write-down of securities and other investments—net 753 3,287 1,284Gain on disposal of vessels and shipyard contract termination costs—net (2,222) (139,986) (77,970)
Payments for drydocking (20,015) (30,125) (53,560)Changes in operating assets and liabilities:
Decrease/(increase) in receivables (18,586) 84,821 (16,043)Net change in prepaid items and accounts payable, accrued expenses and
other current liabilities (34,766) 37,529 (114,918)
Net cash (used in)/provided by operating activities (27,714) 218,121 376,337
Cash Flows from Investing Activities:Short-term investments (20,048) (50,000) —Disposal of short-term investments 50,000 — —Purchases of marketable securities — — (15,112)Proceeds from sale of marketable securities and investments 253 159 7,208Expenditures for vessels (421,363) (595,086) (608,271)Withdrawals from Capital Construction Fund 40,727 8,265 105,700Proceeds from disposal of vessels 14,888 300,894 461,872Expenditures for other property (2,656) (4,247) (10,809)Investments in and advances to affiliated companies (126,904) (107,690) (37,871)Distributions from affiliated companies 25,823 93,203 20,148Shipyard contract termination payments (1,973) (20,452) —Other—net 1,592 2,188 113
Net cash used in investing activities (439,661) (372,766) (77,022)
Cash Flows from Financing Activities:Purchase of OSG America L.P. units — (71,792) (2,802)Issuance of common stock, net of issuance costs 158,266 — —Decrease/(increase) in restricted cash 7,945 (7,945) —Purchases of treasury stock (1,718) (1,514) (258,747)Issuance of debt, net of issuance costs 643,080 558,156 77,812Payments on debt and obligations under capital leases (510,409) (135,136) (220,165)Cash dividends paid (51,884) (47,128) (44,856)Issuance of common stock upon exercise of stock options 1,054 580 970Distributions from subsidiaries to noncontrolling interest owners — (7,880) (9,660)Other—net — (1,615) (678)
Net cash provided by/(used in) financing activities 246,334 285,726 (458,126)
Net increase/(decrease) in cash and cash equivalents (221,041) 131,081 (158,811)Cash and cash equivalents at beginning of year 474,690 343,609 502,420
Cash and cash equivalents at end of year $ 253,649 $ 474,690 $ 343,609
See notes to consolidated financial statements.
72 Overseas Shipholding Group, Inc.

OVERSEAS SHIPHOLDING GROUP, INC. AND SUBSIDIARIESCONSOLIDATED STATEMENTS OF CHANGES IN EQUITY
DOLLARS IN THOUSANDS
Overseas Shipholding Group, Inc. Stockholders
TotalAccumulated Overseas
Paid-in Other ShipholdingTreasury StockCommon Additional Retained Comprehensive Group, Inc. Noncontrolling
Stock Capital Earnings Shares Amount Loss Stockholders Interest Total
Balance at December 31, 2007 $ 40,791 $ 208,817 $ 2,170,098 9,697,620 $ (583,708) $ (17,973) $ 1,818,025 $ 132,470 $ 1,950,495
Net Income 317,665 317,665 (12,479) 305,186Other Comprehensive Income/(Loss), net of taxes:Net Change in Unrealized Holding Losses on
Available-for-Sale Securities (3,969) (3,969) (3,969)Effect of Derivative Instruments (117,756) (117,756) (117,756)Effect of Pension and Other Postretirement Benefit Plans (6,661) (6,661) (6,661)
Comprehensive Income 189,279 (12,479) 176,800
Cash Dividends Declared (44,856) (44,856) (44,856)Compensation Related to Options Granted 5,057 5,057 5,057Issuance of Restricted Stock Awards (3,070) (268,135) 3,070 — —Amortization of Restricted Stock Awards 7,617 7,617 7,617Options Exercised and Employee Stock Purchase Plan 579 (30,711) 391 970 970Purchases of Treasury Stock 4,499,767 (258,747) (258,747) (258,747)Purchase of OSG America L.P. Units (2,802) (2,802)Gain on Purchase of OSG America L.P. Units 5,705 5,705 (5,705)Increase in Loss on Public Offering of OSG America L.P.
Units (183) (183) (57) (240)Distributions from Subsidiary to Noncontrolling Interest
Owners (9,660) (9,660)
Balance at December 31, 2008 40,791 224,522 2,442,907 13,898,541 (838,994) (146,359) 1,722,867 101,766 1,824,633Net Income 70,170 70,170 977 71,147Other Comprehensive Income/(Loss), net of taxesNet Change in Unrealized Holding Losses on
Available-for-Sale Securities 3,585 3,585 3,585Effect of Derivative Instruments 77,802 77,802 77,802Effect of Pension and Other Postretirement Benefit Plans 4,208 4,208 4,208
Comprehensive Income 155,765 977 156,742
Cash Dividends Declared (47,128) (47,128) (47,128)Compensation Related to Options Granted 5,440 5,440 5,440Amortization of Restricted Stock Awards 8,774 8,774 8,774Options Exercised and Employee Stock Purchase Plan 310 (21,296) 270 580 580Purchases of Treasury Stock 56,190 (1,514) (1,514) (1,514)Purchase of OSG America L.P. Units (71,792) (71,792)Gain on Purchase of OSG America L.P. Units 23,071 23,071 (23,071) —Distributions from Subsidiary to Noncontrolling Interest
Owners (7,880) (7,880)
Balance at December 31, 2009 40,791 262,117 2,465,949 13,933,435 (840,238) (60,764) 1,867,855 — 1,867,855Net Loss (134,243) (134,243) (134,243)Other Comprehensive Income/(Loss), net of taxesNet Change in Unrealized Holding Losses on
Available-for-Sale Securities 649 649 649Effect of Derivative Instruments (17,237) (17,237) (17,237)Effect of Pension and Other Postretirement Benefit Plans 464 464 464
Comprehensive Loss (150,358) (150,358)
Cash Dividends Declared (51,884) (51,884) (51,884)Issuance of Common Stock 3,500 154,766 158,266 158,266Issuance of Restricted Stock Awards (862) (57,654) 862 — —Compensation Related to Options Granted 4,240 4,240 4,240Amortization of Restricted Stock Awards 7,700 7,700 7,700Options Exercised and Employee Stock Purchase Plan 643 (32,419) 411 1,054 1,054Purchases of Treasury Stock 37,391 (1,718) (1,718) (1,718)Reduction in Tax Basis of Assets Held by OSG America L.P. (25,003) (25,003) (25,003)
Balance at December 31, 2010 $ 44,291 $ 403,601 $ 2,279,822 13,880,753 $ (840,683) $ (76,888) $ 1,810,143 — $ 1,810,143
See notes to consolidated financial statements.
2010 Annual Report 73

Overseas Shipholding Group, Inc. and Subsidiaries
Notes to Consolidated Financial Statements
NOTE A—SUMMARY OF SIGNIFICANT ACCOUNTING POLICIES:
1. Basis of presentation and description of business—The consolidated financial statements include the accounts ofOverseas Shipholding Group, Inc., a Delaware corporation, and its majority-owned subsidiaries (the ‘‘Company’’or ‘‘OSG’’). For the three years ended December 31, 2010, all subsidiaries were wholly owned, with the exceptionof OSG America L.P., which became a wholly owned subsidiary of the Company in December 2009 (see Note C).All significant intercompany balances and transactions have been eliminated in consolidation. Investments in50% or less owned affiliated companies, in which the Company exercises significant influence, are accounted forby the equity method.
The Company owns and operates a fleet of oceangoing vessels engaged in the transportation of liquid cargoesin the international market and the U.S. Flag trades.
2. Cash and cash equivalents—Interest-bearing deposits that are highly liquid investments and have a maturity ofthree months or less when purchased are included in cash and cash equivalents.
3. Marketable securities—The Company’s investments in marketable securities are classified as available-for-saleand are carried at fair value. The Company utilizes the first-in, first-out method to determine the cost ofmarketable securities sold or the amount reclassified out of accumulated other comprehensive income/(loss) intoearnings. Net unrealized gains or losses are reported as a component of accumulated other comprehensiveincome/(loss) within equity. If a material decline in the fair value below the Company’s cost basis is determinedto be other than temporary, a noncash impairment loss is recorded in the statement of operations in the periodin which that determination is made. As a matter of policy, the Company evaluates all material declines in fairvalue for impairment whenever the fair value of a security has been below its cost basis for more than sixconsecutive months. In the period in which a decline in fair value is determined to be other than temporary, thecarrying value of that security is written down to its fair value at the end of such period, thereby establishing anew cost basis.
4. Inventories—Inventories, which consists principally of fuel, are stated at cost determined on a first-in, first-outbasis.
5. Vessels, deferred drydocking expenditures and other property—Vessels are recorded at cost and are depreciatedto their estimated salvage value on the straight-line basis over the lives of the vessels, which are generally25 years. Each vessel’s salvage value is equal to the product of its lightweight tonnage and an estimated scraprate of $300 per ton. Accumulated depreciation was $723,849,000 and $636,799,000 at December 31, 2010 and2009, respectively.
Other property, including buildings and leasehold improvements, are recorded at cost and amortized on astraight-line basis over the shorter of the terms of the leases or the estimated useful lives of the assets, whichrange from three to 35 years.
Interest costs are capitalized to vessels during the period that vessels are under construction. Interest capitalizedaggregated $10,334,000 in 2010, $10,759,000 in 2009 and $23,801,000 in 2008.
Expenditures incurred during a drydocking are deferred and amortized on the straight-line basis over the perioduntil the next scheduled drydocking, generally two and a half to five years. The Company only includes indeferred drydocking costs those direct costs that are incurred as part of the drydocking to meet regulatoryrequirements, or are expenditures that add economic life to the vessel, increase the vessel’s earnings capacity orimprove the vessel’s efficiency. Direct costs include shipyard costs as well as the costs of placing the vessel inthe shipyard. Expenditures for normal maintenance and repairs, whether incurred as part of the drydocking ornot, are expensed as incurred.
6. Impairment of long-lived assets—The carrying amounts of long-lived assets held and used by the Company arereviewed for potential impairment whenever events or changes in circumstances indicate that the carryingamount of a particular asset may not be fully recoverable. In such instances, an impairment charge would be
74 Overseas Shipholding Group, Inc.

recognized if the estimate of the undiscounted future cash flows expected to result from the use of the asset andits eventual disposition is less than the asset’s carrying amount. This assessment is made at the individual vessellevel since separately identifiable cash flow information for each vessel is available. The amount of an impairmentcharge, if any, would be determined using discounted cash flows.
7. Goodwill and intangible assets—Goodwill and indefinite lived intangible assets acquired in a businesscombination are not amortized but are reviewed for impairment annually or more frequently if impairmentindicators arise. Intangible assets with estimable useful lives are amortized over their estimated useful lives. TheCompany’s intangible assets consist primarily of long-term customer relationships acquired as part of thepurchase of Maritrans, Inc. and long-term customer relationships and charter-in contracts acquired as part of the2007 purchase of the Heidmar Lightering business. The long-term customer relationships are being amortized ona straight-line basis over 20 years and the charter-in contracts were being amortized on a straight-line basis overapproximately four years. The amortizable portion of the charter-in contracts was written down by $9,611,000 aspart of the impairment charge taken on six vessels during the quarter ended June 30, 2010 (see Note E).Accumulated amortization was $29,444,000 and $22,743,000 at December 31, 2010 and 2009, respectively.Amortization expense amounted to $6,340,000 in 2010, $7,496,000 in 2009 and $7,499,000 in 2008. Amortizationof intangible assets for the five years subsequent to December 31, 2010 is expected to approximate $5,183,000per year.
The Company tests the goodwill in its reporting units for impairment at least annually, or more frequently ifimpairment indicators arise, by comparing the estimated fair value of each operating segment with its net bookvalue. The Company performed its annual goodwill impairment testing as of April 1, 2010. This evaluation did notresult in an impairment charge being recognized in 2010. Furthermore, the fair value of the International CrudeTankers lightering business to which all of the goodwill is allocated was substantially in excess of its carryingvalue as of the second quarter impairment testing date. The Company has concluded that there have been notriggering events since the second quarter impairment test date that would require an interim test for goodwillimpairment as of December 31, 2010.
8. Deferred finance charges—Finance charges incurred in the arrangement of debt are deferred and amortized tointerest expense on the straight-line basis over the life of the related debt. Deferred finance charges of$13,644,000 and $10,594,000 are included in Other Assets at December 31, 2010 and 2009, respectively.Amortization expense amounted to $3,663,000 in 2010, $1,984,000 in 2009 and $4,625,000 in 2008.
9. Revenue and expense recognition—Revenues from time charters and bareboat charters are accounted for asoperating leases and are thus recognized ratably over the rental periods of such charters, as service isperformed. Voyage revenues and expenses are recognized ratably over the estimated length of each voyage and,therefore, are allocated between reporting periods based on the relative transit time in each period. The impactof recognizing voyage expenses ratably over the length of each voyage is not materially different on a quarterlyand annual basis from a method of recognizing such costs as incurred. OSG does not begin recognizing voyagerevenue until a Charter has been agreed to by both the Company and the customer, even if the vessel hasdischarged its cargo and is sailing to the anticipated load port on its next voyage.
Under voyage charters, expenses such as fuel, port charges, canal tolls, cargo handling operations andbrokerage commissions are paid by the Company whereas, under time and bareboat charters, such voyagecosts are paid by the Company’s customers.
For the Company’s vessels operating in pools, revenues and voyage expenses are pooled and allocated to eachpool’s participants on a time charter equivalent basis in accordance with an agreed-upon formula.
10. Derivatives—Accounting standards require the Company to recognize all derivatives on the balance sheet at fairvalue. Derivatives that are not effective hedges must be adjusted to fair value through earnings. If the derivativeis an effective hedge, depending on the nature of the hedge, a change in the fair value of the derivative is eitheroffset against the change in fair value of the hedged item (fair value hedge), or recognized in othercomprehensive income/(loss) and reclassified into earnings in the same period or periods during which the hedgetransaction affects earnings (cash flow hedge). The ineffective portion (that is, the change in fair value of thederivative that does not offset the change in fair value of the hedged item) of an effective hedge and the fullamount of the change in fair value of derivative instruments that do not qualify for hedge accounting areimmediately recognized in earnings.
2010 Annual Report 75

At December 31, 2010, no ineffectiveness gains or losses have been recorded in earnings relative to interest rateswaps entered into by the Company or its subsidiaries that qualify as hedges. Any gain or loss realized upon theearly termination of an interest rate swap is recognized as an adjustment of interest expense over the shorter ofthe remaining term of the swap or the hedged debt.
11. Use of estimates—The preparation of financial statements in conformity with accounting principles generallyaccepted in the United States requires management to make estimates and assumptions that affect the amountsreported in the financial statements and accompanying notes. Actual results could differ from those estimates.
12. Issuance of shares or units by subsidiaries—The Company accounts for gains or losses from the issuance ofshares or units by its subsidiaries as an adjustment to equity.
13. Newly issued accounting standards—In June 2009, the Financial Accounting Standards Board (‘‘FASB’’) amendedthe consolidation guidance for variable-interest entities (‘‘VIEs’’). The amended guidance requires the Company todetermine qualitatively if it is the primary beneficiary of a VIE based on whether the entity (1) has the power todirect the activities of the VIE that most significantly impact the entity’s economic performance and (2) has theobligation to absorb losses of the entity that could potentially be significant to the VIE or the right to receivebenefits from the entity that could potentially be significant to the VIE. It also requires additional disclosures forany enterprise that holds a variable interest in a VIE. The new accounting and disclosure requirements wereeffective for the Company on January 1, 2010.
In January 2010, the FASB revised the guidance to include additional disclosure requirements related to fair valuemeasurements. The guidance adds the requirement to disclose transfers in and out of Level 1 and 2measurements and the reasons for the transfers and a gross presentation of activity within the Level 3roll-forward. The guidance also includes clarifications to existing disclosure requirements on the level ofdisaggregation and disclosures regarding inputs and valuation techniques. The guidance applies to all entitiesrequired to make disclosures about recurring and nonrecurring fair value measurements. The adoption of thisguidance as of March 31, 2010 did not have an impact on the Company’s consolidated financial statements.
In December 2010, the FASB amended the criteria for performing Step 2 of the goodwill impairment test forreporting units with zero or negative carrying amounts and requires performing Step 2 if qualitative factorsindicate that it is more likely than not that a goodwill impairment exists. This guidance becomes effective for theCompany on January 1, 2011. Any impairment to be recorded as a result of the adoption is required to berecognized as a cumulative-effect adjustment to the Company’s beginning retained earnings. Based onpreliminary evaluations, OSG does not believe the adoption of the new accounting guidance will have an impacton its consolidated financial statements.
NOTE B—EARNINGS PER COMMON SHARE:
The computation of basic earnings per share is based on the weighted average number of common sharesoutstanding during the period. The computation of diluted earnings per share assumes the exercise of all dilutivestock options and restricted stock units using the treasury stock method. The components of the calculation of basicearnings per share and diluted earnings per share are as follows:
Dollars in thousands for the year ended December 31, 2010 2009 2008
Net (loss)/income attributable to Overseas Shipholding Group, Inc. $ (134,243) $ 70,170 $ 317,665
Common shares outstanding, basic:Weighted average shares outstanding, basic 29,498,127 26,863,958 29,648,230
Common shares outstanding, diluted:Weighted average shares outstanding, basic 29,498,127 26,863,958 29,648,230Dilutive equity awards — 5,469 165,991
Weighted average shares outstanding, diluted 29,498,127 26,869,427 29,814,221
Awards of 1,731,285 and 1,603,340 shares of common stock for 2010 and 2009, respectively, were not included inthe computation of diluted earnings per share because inclusion of these awards would be anti-dilutive. The
76 Overseas Shipholding Group, Inc.
anti-dilutive effects of equity awards that were excluded from the calculation of diluted earnings per share for 2008were not material.
Unvested share-based payment awards that contain non-forfeitable rights to dividends are considered to beparticipating securities and have been included in the computation of earnings per share pursuant to the two-classmethod.
NOTE C—REPURCHASE OF COMMON UNITS OF OSG AMERICA L.P.:
On November 8, 2007, a subsidiary of the Company, OSG America L.P., a master limited partnership (‘‘MLP’’),completed its initial public offering of 7,500,000 common units (‘‘Units’’), representing a 24.5% limited partner interest,at a price of $19.00 per Unit. On November 5, 2009, OSG initiated a tender offer for the 6,999,565 outstandingpublicly held Units of OSG America L.P. for $10.25 in cash per Unit. At the time of the tender offer, the Companyeffectively owned 77.1% of OSG America L.P. The number of Units validly tendered in the initial offering periodsatisfied the non�waivable condition that more than 4,003,166 Units be validly tendered, such that OSG ownedmore than 80% of the outstanding Units, OSG exercised its right pursuant to Section 15.01 of the amended andrestated limited partnership agreement of the partnership to purchase all of the remaining Units that were nottendered in the Offer and acquired the remaining outstanding Units on December 17, 2009. The Company financedthe purchase price of $71,792,000 through funds drawn under its $1.8 billion credit facility.
NOTE D—BUSINESS AND SEGMENT REPORTING:
The Company is engaged primarily in the ocean transportation of crude oil and petroleum products in both theinternational market and the U.S. Flag trades through the ownership and operation of a diversified fleet of vessels.The shipping industry has many distinct market segments based, in large part, on the size and design configurationof vessels required and, in some cases, on the flag of registry. Rates in each market segment are determined by avariety of factors affecting the supply and demand for vessels to move cargoes in the trades for which they aresuited. Tankers are not bound to specific ports or schedules and therefore can respond to market opportunities bymoving between trades and geographical areas. The Company charters its vessels to commercial shippers and U.S.and foreign governments and governmental agencies primarily on voyage charters and on time charters.
The Company has three reportable segments: International Crude Tankers, International Product Carriers and U.S.vessels. Segment results are evaluated based on income/(loss) from vessel operations before general andadministrative expenses, severance and relocation costs, shipyard contract termination costs, gain/(loss) on disposalof vessels and impairment charges (vessel and goodwill). The accounting policies followed by the reportablesegments are the same as those followed in the preparation of the Company’s consolidated financial statements.
2010 Annual Report 77
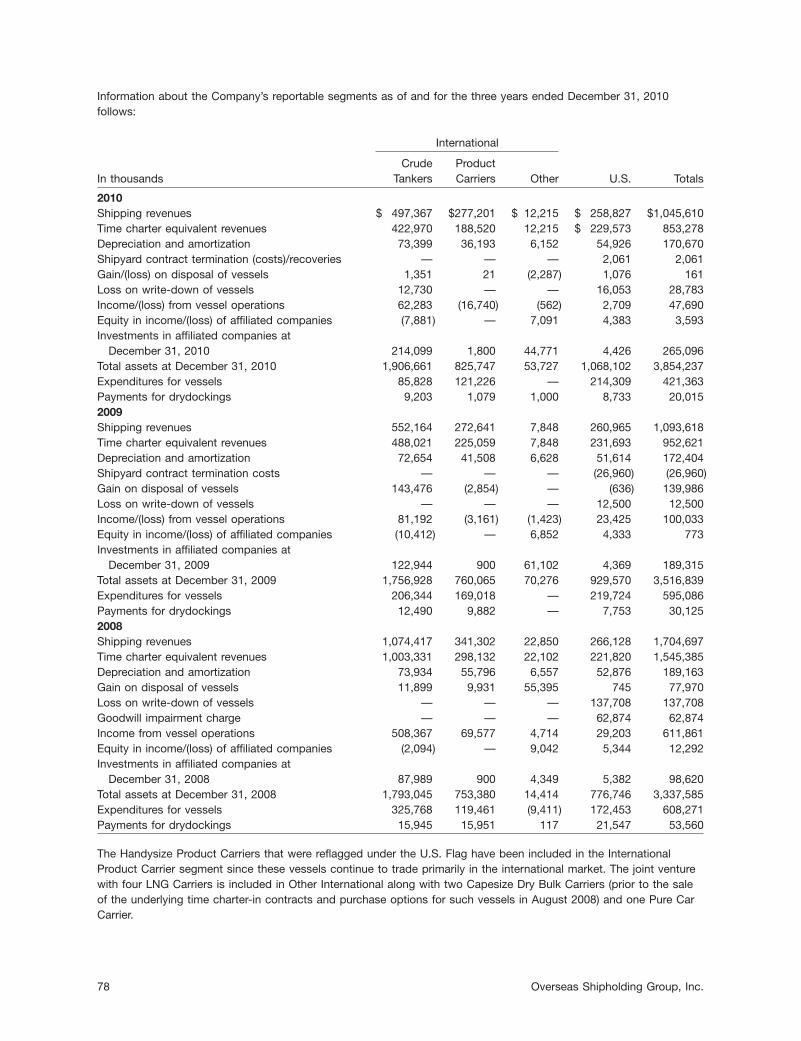
Information about the Company’s reportable segments as of and for the three years ended December 31, 2010follows:
International
Crude ProductIn thousands Tankers Carriers Other U.S. Totals
2010Shipping revenues $ 497,367 $277,201 $ 12,215 $ 258,827 $1,045,610Time charter equivalent revenues 422,970 188,520 12,215 $ 229,573 853,278Depreciation and amortization 73,399 36,193 6,152 54,926 170,670Shipyard contract termination (costs)/recoveries — — — 2,061 2,061Gain/(loss) on disposal of vessels 1,351 21 (2,287) 1,076 161Loss on write-down of vessels 12,730 — — 16,053 28,783Income/(loss) from vessel operations 62,283 (16,740) (562) 2,709 47,690Equity in income/(loss) of affiliated companies (7,881) — 7,091 4,383 3,593Investments in affiliated companies at
December 31, 2010 214,099 1,800 44,771 4,426 265,096Total assets at December 31, 2010 1,906,661 825,747 53,727 1,068,102 3,854,237Expenditures for vessels 85,828 121,226 — 214,309 421,363Payments for drydockings 9,203 1,079 1,000 8,733 20,0152009Shipping revenues 552,164 272,641 7,848 260,965 1,093,618Time charter equivalent revenues 488,021 225,059 7,848 231,693 952,621Depreciation and amortization 72,654 41,508 6,628 51,614 172,404Shipyard contract termination costs — — — (26,960) (26,960)Gain on disposal of vessels 143,476 (2,854) — (636) 139,986Loss on write-down of vessels — — — 12,500 12,500Income/(loss) from vessel operations 81,192 (3,161) (1,423) 23,425 100,033Equity in income/(loss) of affiliated companies (10,412) — 6,852 4,333 773Investments in affiliated companies at
December 31, 2009 122,944 900 61,102 4,369 189,315Total assets at December 31, 2009 1,756,928 760,065 70,276 929,570 3,516,839Expenditures for vessels 206,344 169,018 — 219,724 595,086Payments for drydockings 12,490 9,882 — 7,753 30,1252008Shipping revenues 1,074,417 341,302 22,850 266,128 1,704,697Time charter equivalent revenues 1,003,331 298,132 22,102 221,820 1,545,385Depreciation and amortization 73,934 55,796 6,557 52,876 189,163Gain on disposal of vessels 11,899 9,931 55,395 745 77,970Loss on write-down of vessels — — — 137,708 137,708Goodwill impairment charge — — — 62,874 62,874Income from vessel operations 508,367 69,577 4,714 29,203 611,861Equity in income/(loss) of affiliated companies (2,094) — 9,042 5,344 12,292Investments in affiliated companies at
December 31, 2008 87,989 900 4,349 5,382 98,620Total assets at December 31, 2008 1,793,045 753,380 14,414 776,746 3,337,585Expenditures for vessels 325,768 119,461 (9,411) 172,453 608,271Payments for drydockings 15,945 15,951 117 21,547 53,560
The Handysize Product Carriers that were reflagged under the U.S. Flag have been included in the InternationalProduct Carrier segment since these vessels continue to trade primarily in the international market. The joint venturewith four LNG Carriers is included in Other International along with two Capesize Dry Bulk Carriers (prior to the saleof the underlying time charter-in contracts and purchase options for such vessels in August 2008) and one Pure CarCarrier.
78 Overseas Shipholding Group, Inc.

Reconciliations of time charter equivalent revenues of the segments to shipping revenues as reported in theconsolidated statements of operations follow:
In thousands for the year ended December 31, 2010 2009 2008
Time charter equivalent revenues $ 853,278 $ 952,621 $1,545,385Add: Voyage expenses 192,332 140,997 159,312
Shipping revenues $1,045,610 $1,093,618 $1,704,697
Consistent with general practice in the shipping industry, the Company uses time charter equivalent revenues, whichrepresents shipping revenues less voyage expenses, as a measure to compare revenue generated from a voyagecharter to revenue generated from a time charter. Time charter equivalent revenues, a non-GAAP measure, providesadditional meaningful information in conjunction with shipping revenues, the most directly comparable GAAPmeasure, because it assists Company management in making decisions regarding the deployment and use of itsvessels and in evaluating their financial performance.
Reconciliations of income/(loss) from vessel operations of the segments to income/(loss) before income taxes,including net income attributable to noncontrolling interest, as reported in the consolidated statements of operationsfollow:
In thousands for the year ended December 31, 2010 2009 2008
Total income from vessel operations of all segments $ 47,690 $ 100,033 $ 611,861General and administrative expenses (100,424) (121,112) (144,063)Severance and relocation costs — (2,317) —Shipyard contract termination recoveries/(costs) 2,061 (26,960) —Gain/(loss) on disposal of vessels, net of impairments (28,622) 127,486 (59,738)Goodwill impairment charge — — (62,874)
Consolidated income/(loss) from vessel operations (79,295) 77,130 345,186Equity in income of affiliated companies 3,593 773 12,292Other income/(expense) 1,047 1,672 (28,847)Interest expense (67,044) (45,125) (57,449)
(Loss)/income before income taxes $(141,699) $ 34,450 $ 271,182
Reconciliations of total assets of the segments to amounts included in the consolidated balance sheets follow:
In thousands at December 31, 2010 2009 2008
Total assets of all segments $3,854,237 $3,516,839 $3,337,585Corporate cash and securities, including Capital Construction Fund and
restricted cash 273,696 573,333 392,290Other unallocated amounts 113,170 118,269 160,186
Consolidated total assets $4,241,103 $4,208,441 $3,890,061
2010 Annual Report 79
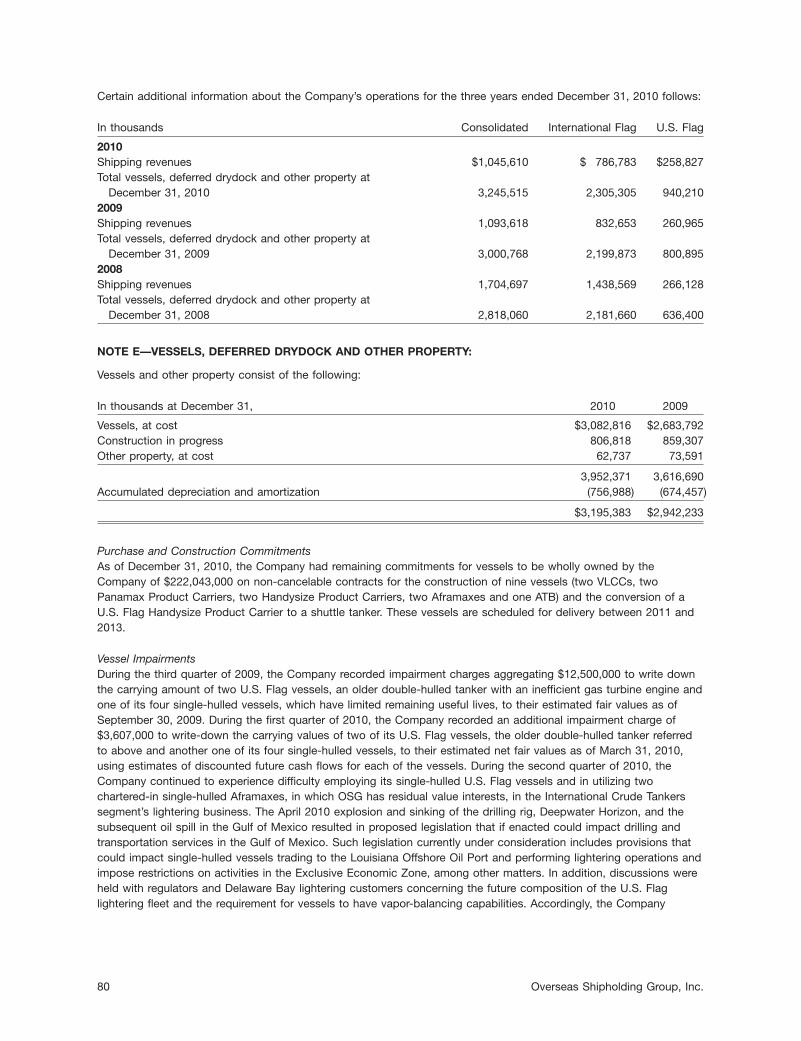
Certain additional information about the Company’s operations for the three years ended December 31, 2010 follows:
In thousands Consolidated International Flag U.S. Flag
2010Shipping revenues $1,045,610 $ 786,783 $258,827Total vessels, deferred drydock and other property at
December 31, 2010 3,245,515 2,305,305 940,2102009Shipping revenues 1,093,618 832,653 260,965Total vessels, deferred drydock and other property at
December 31, 2009 3,000,768 2,199,873 800,8952008Shipping revenues 1,704,697 1,438,569 266,128Total vessels, deferred drydock and other property at
December 31, 2008 2,818,060 2,181,660 636,400
NOTE E—VESSELS, DEFERRED DRYDOCK AND OTHER PROPERTY:
Vessels and other property consist of the following:
In thousands at December 31, 2010 2009
Vessels, at cost $3,082,816 $2,683,792Construction in progress 806,818 859,307Other property, at cost 62,737 73,591
3,952,371 3,616,690Accumulated depreciation and amortization (756,988) (674,457)
$3,195,383 $2,942,233
Purchase and Construction CommitmentsAs of December 31, 2010, the Company had remaining commitments for vessels to be wholly owned by theCompany of $222,043,000 on non-cancelable contracts for the construction of nine vessels (two VLCCs, twoPanamax Product Carriers, two Handysize Product Carriers, two Aframaxes and one ATB) and the conversion of aU.S. Flag Handysize Product Carrier to a shuttle tanker. These vessels are scheduled for delivery between 2011 and2013.
Vessel ImpairmentsDuring the third quarter of 2009, the Company recorded impairment charges aggregating $12,500,000 to write downthe carrying amount of two U.S. Flag vessels, an older double-hulled tanker with an inefficient gas turbine engine andone of its four single-hulled vessels, which have limited remaining useful lives, to their estimated fair values as ofSeptember 30, 2009. During the first quarter of 2010, the Company recorded an additional impairment charge of$3,607,000 to write-down the carrying values of two of its U.S. Flag vessels, the older double-hulled tanker referredto above and another one of its four single-hulled vessels, to their estimated net fair values as of March 31, 2010,using estimates of discounted future cash flows for each of the vessels. During the second quarter of 2010, theCompany continued to experience difficulty employing its single-hulled U.S. Flag vessels and in utilizing twochartered-in single-hulled Aframaxes, in which OSG has residual value interests, in the International Crude Tankerssegment’s lightering business. The April 2010 explosion and sinking of the drilling rig, Deepwater Horizon, and thesubsequent oil spill in the Gulf of Mexico resulted in proposed legislation that if enacted could impact drilling andtransportation services in the Gulf of Mexico. Such legislation currently under consideration includes provisions thatcould impact single-hulled vessels trading to the Louisiana Offshore Oil Port and performing lightering operations andimpose restrictions on activities in the Exclusive Economic Zone, among other matters. In addition, discussions wereheld with regulators and Delaware Bay lightering customers concerning the future composition of the U.S. Flaglightering fleet and the requirement for vessels to have vapor-balancing capabilities. Accordingly, the Company
80 Overseas Shipholding Group, Inc.

recorded an impairment charge of $25,176,000 to write-down six vessels to their estimated fair values at June 30,2010. The aforementioned write-downs covered (i) two single-hulled International Flag Aframaxes engaged inlightering in the U.S. Gulf, (ii) three single-hulled U.S. Flag vessels, including one vessel for which an impairmentcharge was previously recorded in the third quarter of 2009 and (iii) a 1981-built U.S. Flag lightering ATB.
During the second half of 2010, the Company continued to experience difficulty in employing its four single-hulledU.S. Flag vessels (two of which were delivered to buyers subsequent to June 30, 2010 and another that is classifiedas held for sale in the consolidated balance sheet as of December 31, 2010) and the two chartered-in single-hulledInternational Flag Aframaxes (one of which was delivered to buyers in December 2010) engaged in lightering in theU.S. Gulf during the second half of 2010. However, no additional information was identified during the six monthperiod ended December 31, 2010 that would suggest that the assumptions used in the Company’s June 30, 2010impairment analysis for the two unsold vessels discussed in the preceding paragraph have changed. Accordingly, noimpairment tests were performed on these vessels as of December 31, 2010. The Company also gave considerationto events or changes in circumstances that could indicate that the carrying amounts of the vessels in the Company’sInternational Flag fleet may not be recoverable and concluded that the current depressed charter rates in theInternational Tanker and Product Carrier markets were not an indicator that would warrant a test for impairment as ofDecember 31, 2010.
During the third quarter of 2008, the Company decided not to have two older U.S. Flag vessels (one Product Carrierand one ATB) undergo scheduled drydockings, which were required to continue operating such vessels. Thesevessels therefore ceased operating during the fourth quarter of 2008 and were placed in lay-up pending the plannedsale of such vessels. Accordingly, the Company recorded charges of $32,597,000, including $8,754,000 in the fourthquarter of 2008, to write down the carrying amount of these vessels to their estimated fair value as of December 31,2008. During the second quarter of 2009, the Company changed its plans to sell the U.S. Flag tug boat previouslyclassified as held for sale, as described above. The tug boat was used as a replacement for certain other tug boatsscheduled to drydock. The impact of this change in classification on the statements of operations for the year endedDecember 31, 2009 was not material.
Shipyard Contract TerminationIn early 2009, OSG began negotiations with Bender Shipbuilding & Repair Co., Inc. (‘‘Bender’’) to terminate theconstruction agreements covering the six ATBs and two tug boats associated with its U.S. Flag expansion plans dueto repeated delays in vessel delivery dates from the original contract delivery dates, Bender’s request for substantialprice increases on all contracted vessels and OSG’s concern about Bender’s ability to complete the ATBs and tugboats within contract terms, including Bender’s lack of performance under such agreements and its financialcondition. The Company took an impairment charge of $105,111,000 in the fourth quarter of 2008 related to four ofsuch ATBs.
On March 13, 2009, the Company entered into a termination agreement with Bender. Under the terms of theagreement, Bender agreed to transfer ownership of the unfinished vessels (and all related components andequipment) to OSG in their current state of completion in consideration for which OSG would, among other things(1) pay and/or reimburse Bender for the costs associated with positioning the units for transportation to thealternative shipyards and certain other material and labor costs related to construction of the units, (2) assumecertain specified obligations related to construction of the units and (3) render a payment of $14,000,000 to a thirdparty for the release of priority liens on the vessels being transferred to the Company. As of December 31, 2010, theamounts referred to in (1), (2) and (3) above aggregated $48,737,000 of which $24,484,000 has been charged toexpense from the date of the termination agreement through December 31, 2010, with the balance being capitalizedas construction in progress. The Company completed construction of one of the above ATBs in the first quarter of2010 and is in the process of completing one additional ATB and the two tug boats at alternative shipyards.
Unsecured creditors filed an involuntary petition for bankruptcy against Bender in June 2009 that was subsequentlyconverted to a voluntary petition. In December 2010, a settlement agreement was reached by the creditors of Bender,leading to the approval by the bankruptcy court of a liquidation plan that should result in OSG making furtherrecoveries against the $14,000,000 described above, which was documented as a secured loan. The liquidationprocess is expected to take up to a year.
2010 Annual Report 81

Vessel Acquisitions and DeliveriesDuring 2010, the Company completed construction of one VLCC, two International Flag Handysize Product Carriersand one ATB. In addition, OSG purchased one U.S. Flag Product Carrier upon its delivery from a shipyard. During thethird quarter of 2010, another International Flag Handysize Product Carrier commenced a bareboat charter-in with aterm of approximately five years upon its delivery from a shipyard. OSG entered into negotiations to purchase thisvessel and in late-October 2010, OSG completed the purchase of the vessel and the bareboat charter-in wascanceled.
During 2009, the Company completed construction of two International Flag Aframaxes and one International FlagPanamax Product Carrier, which was sold and chartered back on a bareboat basis upon delivery. In addition, OSGpurchased, one International Flag Handysize Product Carrier and one U.S. Flag Product Carrier upon their deliveryfrom shipyards.
During 2008, the Company completed construction of two International Flag Aframaxes and purchased oneInternational Flag Panamax Product Carrier upon its delivery from a shipyard, all of which were sold and charteredback on a bareboat basis upon delivery.
Vessel SalesIn November 2010, the Company delivered one of its single-hulled U.S. Flag Tankers to buyers. Also, in December2010, one of the chartered-in single-hulled International Flag Aframaxes in which the Company had a residual interestand for which an impairment charge was recorded in the second quarter of 2010, was delivered to buyers. TheCompany recognized a gain of $1,162,000 on these transactions.
During the third quarter of 2010, the Company delivered two U.S. Flag Tankers (one single-hulled and one double-hulled) to buyers. The Company recognized a net gain of $679,000 on the sale of these vessels. In addition, theCompany determined that an order placed with a CNG equipment supplier would not be completed. Accordingly, theCompany recognized a loss of approximately $2,300,000 related to a deposit advanced to the supplier.
On January 7, 2011, the Company entered into an agreement for the sale of one of its single hull U.S. Flag Tankers,which is presently in lay up and classified as held for sale on the consolidated balance sheet as of December 31,2010. Also, in February 2011, the Company agreed to sell the last of its single-hulled Product Carriers. The Companyexpects to deliver both vessels to their respective buyers in the first half of 2011.
During the first quarter of 2009, the Company delivered one of its 2000-built VLCCs to the buyer pursuant to aforward sales agreement entered in 2007. Accordingly, OSG recognized a gain on the sale of $76,654,000 in the firstquarter of 2009. A ULCC, the TI Africa, which was wholly-owned by OSG, was sold in January 2009 to a jointventure in which the Company has a 50% interest for conversion to an FSO for approximately $200,000,000. TheCompany recorded a gain of $106,686,000, of which $53,343,000 was recognized in the first quarter of 2009 with thebalance deferred to be amortized over the remaining life of the vessel. The gain recognized on the transaction wasequal to 50% of the excess of the sales price over the carrying amount of the vessel. In addition, OSG sold andchartered back one International Flag Panamax Product Carrier.
During the second quarter of 2009, the Company sold three vessels and a barge: two International Flag Panamaxesfor which the charterer had previously exercised purchase options and one U.S. Flag Tanker and one U.S. Flag barge,both of which had been classified as held for sale. The Company recognized a net gain of $422,000 on the sale of allthese vessels.
During 2008, OSG sold five vessels, one International Flag Aframax, one International Flag Handysize Product Carrier,its remaining single hull U.S. Flag barge and the underlying time charter-in contracts and purchase options for its tworemaining International Flag Dry Bulk Carriers. The Company recognized a net gain of $78,952,000 on thesetransactions. In addition, the Company sold and chartered back two International Flag Aframaxes and twoInternational Flag Product Carriers.
82 Overseas Shipholding Group, Inc.

Drydocking activity for the three years ended December 31, 2010 is summarized as follows:
In thousands for the year ended December 31, 2010 2009 2008
Balance at January 1 $ 58,535 $ 79,837 $ 81,619Payments for drydocking 20,015 30,125 53,560
Sub-total 78,550 109,962 135,179Drydock amortization (30,530) (43,669) (53,026)Amounts recognized upon sale of vessels and non-cash adjustments (1,193) (7,758) (2,316)
Balance at December 31 $ 46,827 $ 58,535 $ 79,837
NOTE F—EQUITY METHOD INVESTMENTS:
Investments in affiliated companies include joint ventures accounted for using the equity method. As of December 31,2010, the Company had approximately a 50% interest in two joint ventures. One joint venture operates four LNGCarriers. The other joint venture converted two ULCCs to FSOs, one of which commenced service on January 5,2010 and the other which commenced service on August 30, 2010. In addition, the Company has a 37.5% interest inAlaska Tanker Company, LLC, which manages vessels carrying Alaskan crude for BP.
Floating Storage and Offloading Service Vessels (‘‘FSO’’)In February 2008, Maersk Oil Qatar AS (‘‘MOQ’’) awarded two service contracts to a joint venture between OSG andEuronav NV for terms of approximately eight years ending in 2017. The service contracts provided for two ULCCs tobe converted to FSOs. The first ULCC, the TI Asia, which was wholly owned by Euronav NV, was sold to the jointventure in October 2008 for approximately $200,000,000. The second ULCC, the TI Africa, which was wholly ownedby OSG, was sold to the joint venture in January 2009. Conversion of both vessels to FSOs was delayed. The FSOAsia completed conversion in November 2009 and costs incurred subsequent thereto have been expensed by thejoint venture. The FSO Asia experienced mechanical problems and effective hook-up did not occur until January 5,2010. The service contract for the FSO Africa (formerly named the TI Africa) required that its conversion to an FSObe completed and it begin providing FSO services to MOQ by January 19, 2010 (the ‘‘Africa Cancellation Date’’). OnJanuary 21, 2010, MOQ issued a notice of cancellation to the joint venture partners concerning the FSO Africaservice contract due to the delayed delivery.
The service contracts provided for the payment of liquidated damages by the joint ventures to MOQ for delays indelivery of the FSOs. Such liquidated damages, which were paid either through the date of delivery of the FSO Asiaor termination of the service contract of the FSO Africa, were expensed by the joint venture as incurred.
The FSO Africa was completed on March 14, 2010 and costs incurred subsequent thereto have been expensed bythe joint venture. The FSO Africa commenced a three-year service contract with MOQ on August 30, 2010.
The joint venture financed the purchase of the vessels through long-term secured bank financing and partner loans.In October 2008, the joint venture entered into a $500,000,000 secured credit facility to partially finance theacquisition of the two ULCCs and the cost of the conversion. In connection with the secured bank financing, thepartners severally issued guaranties. As of December 31, 2010 and 2009, the carrying value of the Company’sguaranty, which is included in other liabilities in the accompanying balance sheet, was $278,000 and $583,000,respectively. As a result of the cancellation of the service contract of the FSO Africa, the joint venture partners wererequired to post $143,000,000 in cash collateral in consideration of the banks agreeing to waive, for a period thatended on November 30, 2010, the acceleration of amounts outstanding under the facility related to the FSO Africa,which aggregated $143,000,000 as of January 21, 2010 and approximately $120,000,000 as of November 30, 2010.On December 1, 2010, the joint venture entered into an agreement with the lenders to restructure the FSO Africatranche of the loan facility reducing the balance available to borrow to $120,000,000, shortening the term of the loanto approximately three years and increasing the margin over LIBOR (‘‘London Interbank Offered Rate’’). As a result ofthis amendment, cash collateral aggregating $111,000,000 was released to the joint venture partners in December2010.
The joint venture entered into floating-to-fixed interest rate swaps with major financial institutions all of which werebeing accounted for as cash flow hedges as of December 31, 2009. The interest rate swaps, covering notional
2010 Annual Report 83

amounts aggregating $439,622,000 and $480,000,000 at December 31, 2010 and 2009, respectively, pay fixed ratesof 3.9% and receive floating rates based on LIBOR. These agreements commenced in the third quarter of 2009 andhave maturity dates ranging from July to September 2017. As a result of the delays in the completion of conversionand commencement of the service contracts for the FSO Asia and FSO Africa, the joint venture recognized a chargeof approximately $6,546,000 related to the ineffective portion of the hedges during 2009. In the first quarter of 2010,the Company concluded that it was no longer probable that the forecasted transaction applicable to the FSO Africaswaps would occur. Accordingly, as a result of the de-designation of the FSO Africa swaps, amounts previouslyincluded in accumulated comprehensive income/(loss) and all subsequent changes in the market value of the swapshave been recognized in the joint venture’s statement of operations. The Company’s share of such charges for theyear ended December 31, 2010, $9,885,000, were recognized in equity income from affiliated companies. As ofDecember 31, 2010 and 2009, the joint venture had a liability of $28,815,000 and $15,790,000, respectively, for thefair value of the swaps associated with the FSO Africa and FSO Asia. The Company’s share of the effective portionof such amounts, aggregating $6,990,000 and $7,170,000 at December 31, 2010 and 2009, respectively, is includedin accumulated other comprehensive loss in the accompanying balance sheet and is associated with the FSO Asiaswaps only at December 31, 2010, since the swaps associated with the FSO Africa were de-designated and deemedto be ineffective during 2010.
As a result of delays in the completion of the conversion of the TI Asia to an FSO, the joint venture chartered-in theTI Oceania, a ULCC wholly-owned by the Company, as a temporary replacement unit. The Company recognized itsshare of the earnings related to this transaction with the joint venture. Charter hire payable by the joint ventureaggregated $1,332,000 and $9,780,000 in 2010 and 2009, respectively. Fifty percent of such amounts, or $666,000and $4,890,000, in 2010 and 2009, respectively, have been eliminated from equity in income of affiliated companiesand shipping revenues in the accompanying statement of operations.
VLCC Joint VenturesIn January 2007, the company acquired a 49.99% interest in a company, which was constructing two VLCCs, forapproximately $24,100,000. In May 2008, the Company and its joint venture partner entered into an agreementterminating the joint venture arrangement. Under the agreement, the joint venture distributed 100% of the stock ofone of the two joint venture subsidiaries, which was constructing a VLCC that delivered in 2010, to the Company.The stock of the other joint venture subsidiary was distributed to the Company’s joint venture partner.
LNG Joint VentureIn November 2004, the Company formed a joint venture with Qatar Gas Transport Company Limited (Nakilat) wherebycompanies in which OSG holds a 49.9% interest ordered four 216,200 cbm LNG Carriers. Upon delivery in late 2007and early 2008, these vessels commenced 25-year time charters to Qatar Liquefied Gas Company Limited (II). Theaggregate construction cost for such newbuildings of $918,026,000 was financed by the joint venture throughlong-term bank financing that is non recourse to the partners and partner contributions. The joint venture has enteredinto floating-to-fixed interest rate swaps with a group of major financial institutions pursuant to which it will pay fixedrates of approximately 4.9% and receives a floating rate based on LIBOR. The interest rate swaps agreements havematurity dates ranging from July to November 2022 and cover notional amounts aggregating $819,987,000 and$847,381,000 at December 31, 2010 and 2009, respectively. These swaps are being accounted for as cash flowhedges. As of December 31, 2010 and 2009, the joint venture recorded a liability of $102,705,000 and $67,798,000,respectively, for the fair value of these swaps. The Company’s share of the effective portion of the fair value of theseswaps, $51,174,000 and $33,742,000 at December 31, 2010 and 2009, respectively, is included in accumulated othercomprehensive loss in the accompanying balance sheet.
Alaska Tanker CompanyIn the first quarter of 1999, OSG, BP, and Keystone Shipping Company formed Alaska Tanker Company, LLC (‘‘ATC’’)to manage the vessels carrying Alaskan crude oil for BP. ATC provides marine transportation services in theenvironmentally sensitive Alaskan crude oil trade. Each member in ATC is entitled to receive its respective share ofany incentive charter hire payable by BP to ATC.
84 Overseas Shipholding Group, Inc.
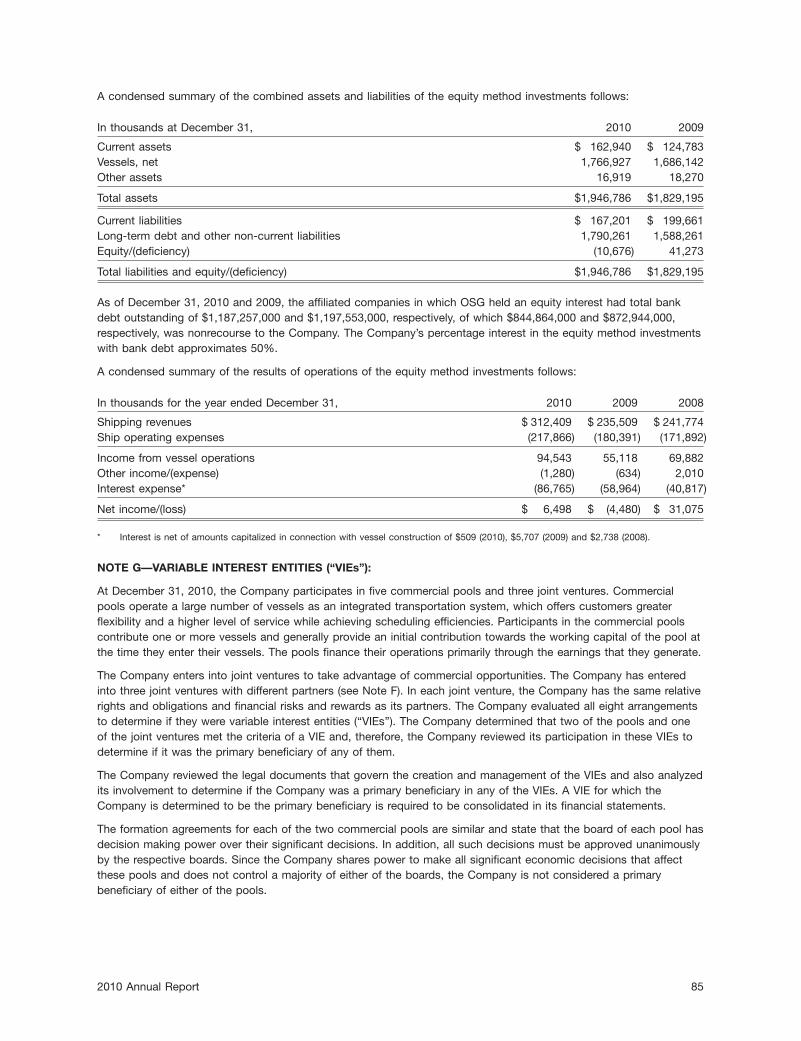
A condensed summary of the combined assets and liabilities of the equity method investments follows:
In thousands at December 31, 2010 2009
Current assets $ 162,940 $ 124,783Vessels, net 1,766,927 1,686,142Other assets 16,919 18,270
Total assets $1,946,786 $1,829,195
Current liabilities $ 167,201 $ 199,661Long-term debt and other non-current liabilities 1,790,261 1,588,261Equity/(deficiency) (10,676) 41,273
Total liabilities and equity/(deficiency) $1,946,786 $1,829,195
As of December 31, 2010 and 2009, the affiliated companies in which OSG held an equity interest had total bankdebt outstanding of $1,187,257,000 and $1,197,553,000, respectively, of which $844,864,000 and $872,944,000,respectively, was nonrecourse to the Company. The Company’s percentage interest in the equity method investmentswith bank debt approximates 50%.
A condensed summary of the results of operations of the equity method investments follows:
In thousands for the year ended December 31, 2010 2009 2008
Shipping revenues $ 312,409 $ 235,509 $ 241,774Ship operating expenses (217,866) (180,391) (171,892)
Income from vessel operations 94,543 55,118 69,882Other income/(expense) (1,280) (634) 2,010Interest expense* (86,765) (58,964) (40,817)
Net income/(loss) $ 6,498 $ (4,480) $ 31,075
* Interest is net of amounts capitalized in connection with vessel construction of $509 (2010), $5,707 (2009) and $2,738 (2008).
NOTE G—VARIABLE INTEREST ENTITIES (‘‘VIEs’’):
At December 31, 2010, the Company participates in five commercial pools and three joint ventures. Commercialpools operate a large number of vessels as an integrated transportation system, which offers customers greaterflexibility and a higher level of service while achieving scheduling efficiencies. Participants in the commercial poolscontribute one or more vessels and generally provide an initial contribution towards the working capital of the pool atthe time they enter their vessels. The pools finance their operations primarily through the earnings that they generate.
The Company enters into joint ventures to take advantage of commercial opportunities. The Company has enteredinto three joint ventures with different partners (see Note F). In each joint venture, the Company has the same relativerights and obligations and financial risks and rewards as its partners. The Company evaluated all eight arrangementsto determine if they were variable interest entities (‘‘VIEs’’). The Company determined that two of the pools and oneof the joint ventures met the criteria of a VIE and, therefore, the Company reviewed its participation in these VIEs todetermine if it was the primary beneficiary of any of them.
The Company reviewed the legal documents that govern the creation and management of the VIEs and also analyzedits involvement to determine if the Company was a primary beneficiary in any of the VIEs. A VIE for which theCompany is determined to be the primary beneficiary is required to be consolidated in its financial statements.
The formation agreements for each of the two commercial pools are similar and state that the board of each pool hasdecision making power over their significant decisions. In addition, all such decisions must be approved unanimouslyby the respective boards. Since the Company shares power to make all significant economic decisions that affectthese pools and does not control a majority of either of the boards, the Company is not considered a primarybeneficiary of either of the pools.
2010 Annual Report 85

The joint venture described in Note F that converted two ULCCs to FSOs was determined to be a VIE. The formationagreements state that all significant decisions must be approved by the majority of the board. As a result, theCompany shares power to make all significant economic decisions that affect this joint venture and does not controla majority of the board and is not considered a primary beneficiary. Accordingly, the Company accounts for thisinvestment under the equity method of accounting.
The joint venture’s formation agreements require the Company and its joint venture partner to provide financialsupport as needed. The Company has provided and will continue to provide such support as described in Note F.
The following table presents the carrying amounts of assets and liabilities in the balance sheet related to the VIEsdescribed above as of December 31, 2010:
In thousands Consolidated Balance Sheet
Investments in Affiliated Companies $214,357Deferred Income Taxes and Other Liabilities (1) 278
(1) Represents the Company’s valuation of its several guaranty of the FSO joint venture’s outstanding debt at December 31, 2010.
In accordance with accounting guidance, the Company evaluated its maximum exposure to loss related to these VIEsby assuming a complete loss of the Company’s investment in these VIEs and that it would incur an obligation torepay the full amount of the VIE’s outstanding secured debt. The table below compares the Company’s liability in theconsolidated balance sheet to the maximum exposure to loss at December 31, 2010.
In thousands Consolidated Balance Sheet Maximum Exposure to Loss
Deferred Income Taxes and Other Liabilities $278 $388,950
In addition, as of December 31, 2010, the Company had approximately $14,422,000 of trade receivables from poolsthat were determined to be VIEs. These trade receivables, which are included in voyage receivables in theaccompanying balance sheet, have been excluded from the above tables and the calculation of OSG’s maximumexposure to loss. The Company does not record the maximum exposure to loss as a liability because it does notbelieve that such a loss is probable of occurring as of December 31, 2010. Further, the joint venture debt is securedby the joint venture’s FSOs. Therefore, the Company’s exposure to loss under its several guaranty would first bereduced by the fair value of such FSOs.
NOTE H—GOODWILL
Goodwill as of December 31, 2010 and 2009 is summarized as follows:
In thousands Crude Segment and Total
Balance at January 1 and December 31, 2010 and 2009Goodwill $9,589Accumulated impairment losses —
$9,589
Refer to Note A for a description of the Company’s accounting policy for Goodwill and the results of the annualimpairment test performed on the goodwill balance relating to the International Crude Tankers lightering businessacquired in 2007.
Considering the decline in stock price of OSG America L.P. and the general weakening of the economic outlook andthe decline in the financial and banking sectors, the Company performed an impairment test as of September 30,2008, an annual impairment test as of October 1, 2008, and an impairment test as of December 31, 2008. In thefourth quarter of 2008, the economic downturn resulted in a number of market-related events that were expected tonegatively impact the Company’s U.S. Flag operations in the near and medium-term. Lower demand for refinedpetroleum products in North America at that time resulted in a number of major refining companies reducing capitalexpenditures and deferring and/or eliminating projects that would have increased production capacity throughout theGulf of Mexico. The reduction in planned refining expansion projects reduced future volumes of clean products that
86 Overseas Shipholding Group, Inc.
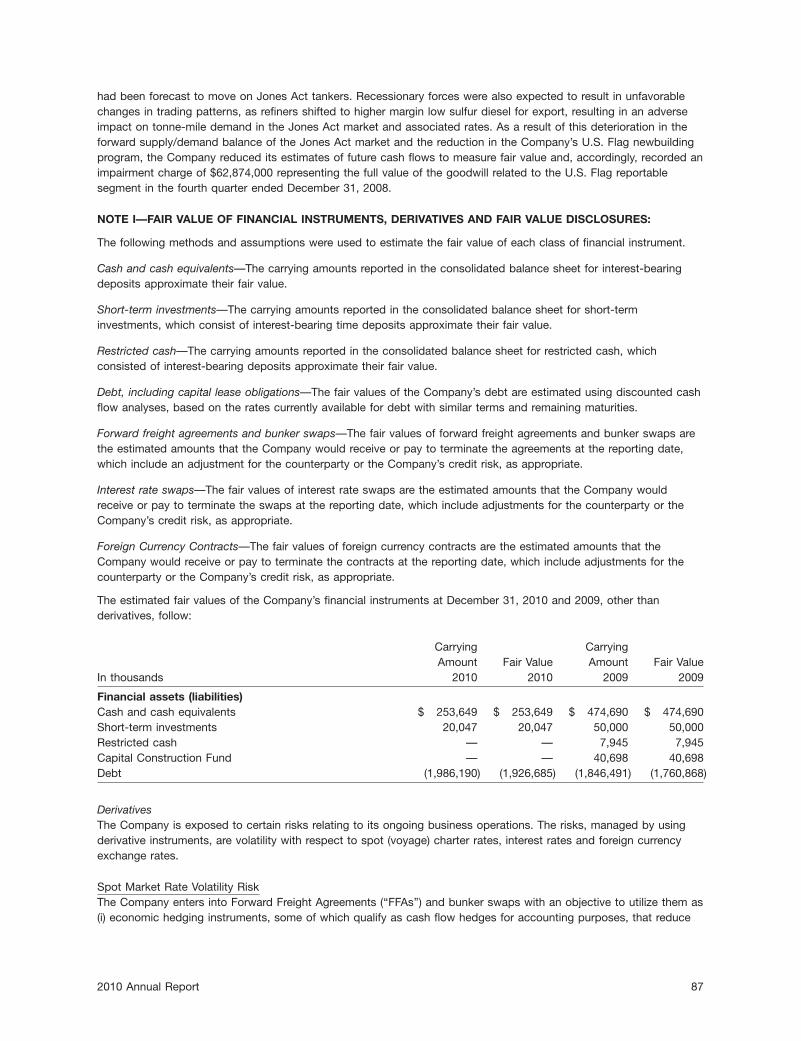
had been forecast to move on Jones Act tankers. Recessionary forces were also expected to result in unfavorablechanges in trading patterns, as refiners shifted to higher margin low sulfur diesel for export, resulting in an adverseimpact on tonne-mile demand in the Jones Act market and associated rates. As a result of this deterioration in theforward supply/demand balance of the Jones Act market and the reduction in the Company’s U.S. Flag newbuildingprogram, the Company reduced its estimates of future cash flows to measure fair value and, accordingly, recorded animpairment charge of $62,874,000 representing the full value of the goodwill related to the U.S. Flag reportablesegment in the fourth quarter ended December 31, 2008.
NOTE I—FAIR VALUE OF FINANCIAL INSTRUMENTS, DERIVATIVES AND FAIR VALUE DISCLOSURES:
The following methods and assumptions were used to estimate the fair value of each class of financial instrument.
Cash and cash equivalents—The carrying amounts reported in the consolidated balance sheet for interest-bearingdeposits approximate their fair value.
Short-term investments—The carrying amounts reported in the consolidated balance sheet for short-terminvestments, which consist of interest-bearing time deposits approximate their fair value.
Restricted cash—The carrying amounts reported in the consolidated balance sheet for restricted cash, whichconsisted of interest-bearing deposits approximate their fair value.
Debt, including capital lease obligations—The fair values of the Company’s debt are estimated using discounted cashflow analyses, based on the rates currently available for debt with similar terms and remaining maturities.
Forward freight agreements and bunker swaps—The fair values of forward freight agreements and bunker swaps arethe estimated amounts that the Company would receive or pay to terminate the agreements at the reporting date,which include an adjustment for the counterparty or the Company’s credit risk, as appropriate.
Interest rate swaps—The fair values of interest rate swaps are the estimated amounts that the Company wouldreceive or pay to terminate the swaps at the reporting date, which include adjustments for the counterparty or theCompany’s credit risk, as appropriate.
Foreign Currency Contracts—The fair values of foreign currency contracts are the estimated amounts that theCompany would receive or pay to terminate the contracts at the reporting date, which include adjustments for thecounterparty or the Company’s credit risk, as appropriate.
The estimated fair values of the Company’s financial instruments at December 31, 2010 and 2009, other thanderivatives, follow:
Carrying CarryingAmount Fair Value Amount Fair Value
In thousands 2010 2010 2009 2009
Financial assets (liabilities)Cash and cash equivalents $ 253,649 $ 253,649 $ 474,690 $ 474,690Short-term investments 20,047 20,047 50,000 50,000Restricted cash — — 7,945 7,945Capital Construction Fund — — 40,698 40,698Debt (1,986,190) (1,926,685) (1,846,491) (1,760,868)
DerivativesThe Company is exposed to certain risks relating to its ongoing business operations. The risks, managed by usingderivative instruments, are volatility with respect to spot (voyage) charter rates, interest rates and foreign currencyexchange rates.
Spot Market Rate Volatility RiskThe Company enters into Forward Freight Agreements (‘‘FFAs’’) and bunker swaps with an objective to utilize them as(i) economic hedging instruments, some of which qualify as cash flow hedges for accounting purposes, that reduce
2010 Annual Report 87

its exposure to changes in TCE revenue earned by some of its vessels operating in the spot market; and prior toJune 30, 2008, (ii) for trading purposes to take advantage of short term fluctuations in the market. The FFAs andbunker swaps involve contracts to provide a fixed number of theoretical voyages at fixed rates, which generally rangefrom one month to one year and settle monthly based on a published index. These contracts expired on variousdates through September 2010.
Fuel Price Volatility RiskThe Company enters into stand alone bunker swaps to protect the Company against future increases in fuel prices inthe normal course of its International Crude Tankers lightering business, which includes a number of fixed rateContracts of Affreightment (‘‘COA’’). During August 2010, the Company entered into an agreement with a counterpartyto purchase 787 metric tons per month of fuel oil for $429.57 per metric ton. This contract settles on a net basis atthe end of each calendar month from September 2010 through June 2011 based on the average daily closing prices,as quoted by the Baltic Exchange, of the commodity during each month. This swap, representing an aggregatevolume of 7,874 metric tons of fuel, does not qualify as a cash flow hedge for accounting purposes.
Interest Rate RiskThe Company uses interest rate swaps for the management of interest rate risk exposure. The interest rate swapseffectively convert a portion of the Company’s debt from a floating to a fixed rate and are designated and qualify ascash flow hedges. The Company is a party to floating-to-fixed interest rate swaps with various major financialinstitutions covering notional amounts aggregating approximately $401,828,000 at December 31, 2010 pursuant towhich it pays fixed rates ranging from 3.2% to 4.7% and receives floating rates based on LIBOR (approximately0.3% at December 31, 2010). These agreements contain no leverage features and have various final maturity datesranging from March 2011 to August 2014.
Foreign Exchange RiskThe Company seeks to reduce its exposure to fluctuations in foreign exchange rates related to recurring monthlyforeign currency denominated general and administrative expenses through the use of foreign currency forwardcontracts and through the purchase of bulk quantities of currencies at rates which management considers favorable.At December 31, 2010, the notional amounts of the foreign currency forward contracts aggregated approximately£3,000,000 and e10,000,000 settling monthly through May 2011 and such contracts qualify as cash flow hedges.
Tabular disclosure of derivatives locationDerivatives are recorded in the balance sheet on a net basis by counterparty when a legal right of setoff exists. Thefollowing tables present information with respect to the fair values of derivatives reflected in the balance sheet on agross basis by transaction. The tables also present information with respect to gains and losses on derivativepositions reflected in the statement of operations or in the balance sheet, as a component of accumulated othercomprehensive loss.
88 Overseas Shipholding Group, Inc.

Fair Values of Derivative Instruments:
Asset Derivatives Liability Derivatives
In thousands at December 31, 2010 Balance Sheet Location Amount Balance Sheet Location Amount
Derivatives designated as hedginginstruments:Interest rate swaps:
Current portion Other receivables, $ — Accounts payable, $ (9,852)including federal income accrued expenses andtaxes recoverable other current liabilities
Long-term portion Other assets — Deferred income taxes (6,166)and other liabilities
Foreign currency contracts:
Prepaid expenses and 430 Accounts payable, (132)other current assets accrued expenses and
other current liabilities
Total derivatives designated ashedging instruments $430 $(16,150)
Derivatives not designated ashedging instruments:
Bunker swaps:
Current portion Prepaid expenses and $271 Accounts payable, $ —other current assets accrued expenses and
other current liabilities
Accounts payable, — Prepaid expenses and —accrued expenses and other current assetsother current liabilities
Long-term portion Other assets — Deferred income taxes —and other liabilities
Deferred income taxes — Other assets —and other liabilities
Total derivatives not designated ashedging instruments $271 $ —
Total derivatives $701 $(16,150)
2010 Annual Report 89

Asset Derivatives Liability DerivativesIn thousands atDecember 31, 2009 Balance Sheet Location Amount Balance Sheet Location Amount
Derivatives designated ashedging instruments:
FFAs and bunker swaps:
Current portion Prepaid expenses and other $ — Accounts payable, accrued $ —current assets expenses and other current
liabilities
Accounts payable, accrued — Prepaid expenses and other —expenses and other current current assetsliabilities
Interest rate swaps:
Current portion Other receivables — Accounts payable, accrued (10,847)expenses and other currentliabilities
Long-term portion Other assets — Deferred income taxes and (4,484)other liabilities
Foreign currency contracts:
Prepaid expenses and other — Accounts payable, accrued (492)current assets expenses and other current
liabilities
Total derivatives designatedas hedging instruments $ — $(15,823)
Derivatives not designated ashedging instruments:
FFAs and bunker swaps:
Prepaid expenses and other $394 Accounts payable, accrued $ (457)current assets expenses and other current
liabilities
Accounts payable, accrued — Prepaid expenses and other (11)expenses and other current current assetsliabilities
Long-term portion Other assets — Deferred income taxes and —other liabilities
Deferred income taxes and — Other assets —other liabilities
Total derivatives notdesignated as hedginginstruments $394 $ (468)
Total derivatives $394 $(16,291)
90 Overseas Shipholding Group, Inc.
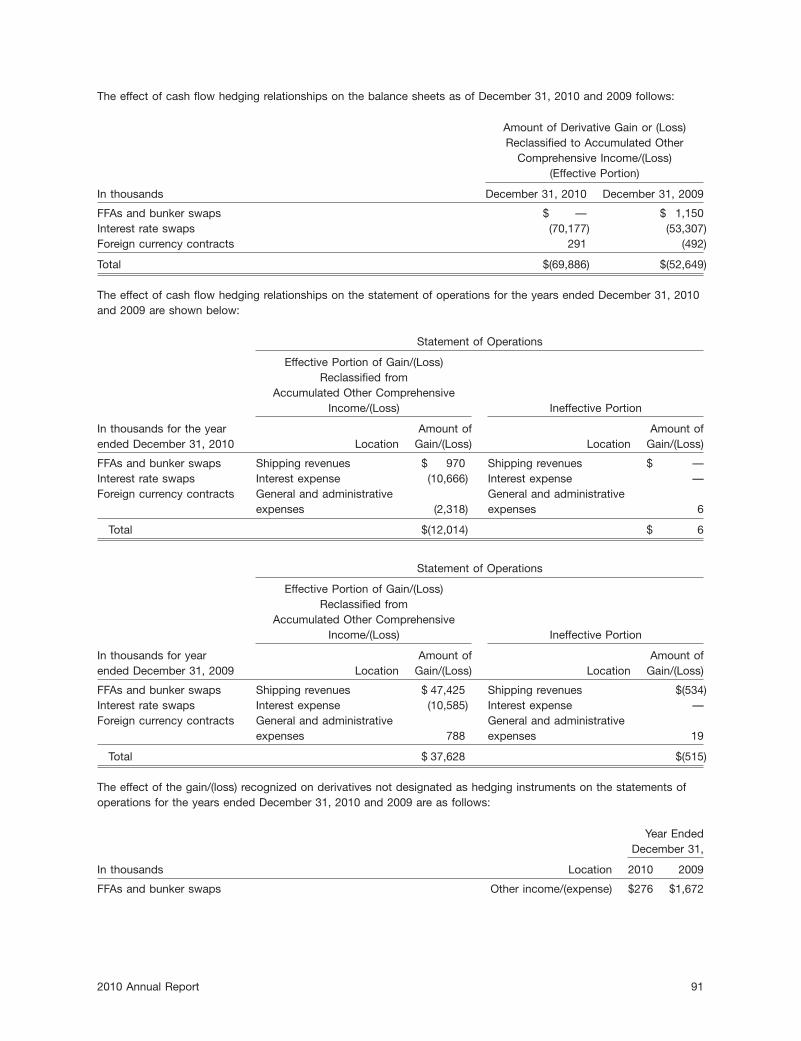
The effect of cash flow hedging relationships on the balance sheets as of December 31, 2010 and 2009 follows:
Amount of Derivative Gain or (Loss)Reclassified to Accumulated Other
Comprehensive Income/(Loss)(Effective Portion)
In thousands December 31, 2010 December 31, 2009
FFAs and bunker swaps $ — $ 1,150Interest rate swaps (70,177) (53,307)Foreign currency contracts 291 (492)
Total $(69,886) $(52,649)
The effect of cash flow hedging relationships on the statement of operations for the years ended December 31, 2010and 2009 are shown below:
Statement of Operations
Effective Portion of Gain/(Loss)Reclassified from
Accumulated Other ComprehensiveIncome/(Loss) Ineffective Portion
In thousands for the year Amount of Amount ofended December 31, 2010 Location Gain/(Loss) Location Gain/(Loss)
FFAs and bunker swaps Shipping revenues $ 970 Shipping revenues $ —Interest rate swaps Interest expense (10,666) Interest expense —Foreign currency contracts General and administrative General and administrative
expenses (2,318) expenses 6
Total $(12,014) $ 6
Statement of Operations
Effective Portion of Gain/(Loss)Reclassified from
Accumulated Other ComprehensiveIncome/(Loss) Ineffective Portion
In thousands for year Amount of Amount ofended December 31, 2009 Location Gain/(Loss) Location Gain/(Loss)
FFAs and bunker swaps Shipping revenues $ 47,425 Shipping revenues $(534)Interest rate swaps Interest expense (10,585) Interest expense —Foreign currency contracts General and administrative General and administrative
expenses 788 expenses 19
Total $ 37,628 $(515)
The effect of the gain/(loss) recognized on derivatives not designated as hedging instruments on the statements ofoperations for the years ended December 31, 2010 and 2009 are as follows:
Year EndedDecember 31,
In thousands Location 2010 2009
FFAs and bunker swaps Other income/(expense) $276 $1,672
2010 Annual Report 91

Fair Value HierarchyThe following tables present the fair values, which are pre tax, for assets and liabilities measured on a recurring basis(excluding investments in affiliated companies):
Level 1:Quoted prices in active Level 2:
markets for identical Significant otherIn thousands Fair Value assets or liabilities observable inputs
Assets/(Liabilities) at December, 2010:Available-for-sale marketable securities $ 646 $ 646 $ —
$ 271Derivative Assets $ 701 (1) $ 430 (1)Derivative Liabilities $(16,150) $ — $(16,150) (2)
Assets/(Liabilities) at December 31, 2009:Available-for-sale marketable securities $ 652 $ 652 $ —Derivative Assets $ 383 $ 383 (1) $ —Derivative Liabilities $(16,280) $(457) (1) $(15,823) (3)
(1) Bunker swaps (asset of $271) and foreign currency contracts (asset of $430) at December 31, 2010; Forward Freight Agreements andbunker swaps at December 31, 2009
(2) Standard interest rate swaps (liability of $16,018) and foreign currency contracts (liability of $132)
(3) Standard interest rate swaps (liability of $15,331) and foreign currency contracts (liability of $492)
The following table summarizes the fair values of items measured at fair value on a nonrecurring basis for the yearended December 31, 2010 (in thousands):
Level 3:Significant
Description unobservable inputs Fair Value Total Losses
Assets:U.S. impairment—Vessels held for use(1) $23,285 $23,285 $(15,624)U.S. impairment—Vessels held for sale(1) 3,843 3,843 (429)International Crude Tankers impairment—Intangible Assets (2) 8,276 8,276 (12,730)
(1) Aggregate pre-tax impairment charges of $3,607 and $12,446 were recorded in the first and second quarters of 2010, respectively,related to the U.S. segment. The fair value measurement used to determine the impairment for the vessels held for use was based uponthe income approach, which utilized cash flow projections consistent with the most recent projections of the Company, and a discountrate equivalent to a market participant’s weighted average cost of capital. The fair value measurement used to determine the impairmentfor the vessels held for sale was based upon the market approach, which utilized the expected sales prices of the two vessels, net ofexpenses of sale.
(2) A pre-tax impairment charge of $12,730 was recorded in the second quarter of 2010, related to the lightering business in theInternational Crude Tankers segment. The fair value measurement used to determine the impairment was based upon the incomeapproach, which utilized cash flow projections consistent with the most recent projections of the Company, and a discount rateequivalent to a market participant’s weighted average cost of capital.
Cash Collateral DisclosuresThe Company does not offset fair value amounts recognized for derivatives for the right to reclaim cash collateral orthe obligation to return cash collateral. The amounts of collateral to be posted are defined in the terms of respectivemaster agreements executed with counterparties or exchanges and are required when agreed upon threshold limitsare exceeded. The following table summarizes the amounts received as collateral related to derivative fair valuepositions:
In thousands December 31, 2010 December 31, 2009
Obligation to return cash collateral(1) $ — $ (261)
(1) The obligations to return cash collateral are reflected in accounts payable, accrued expenses and other current liabilities on the balancesheet.
92 Overseas Shipholding Group, Inc.
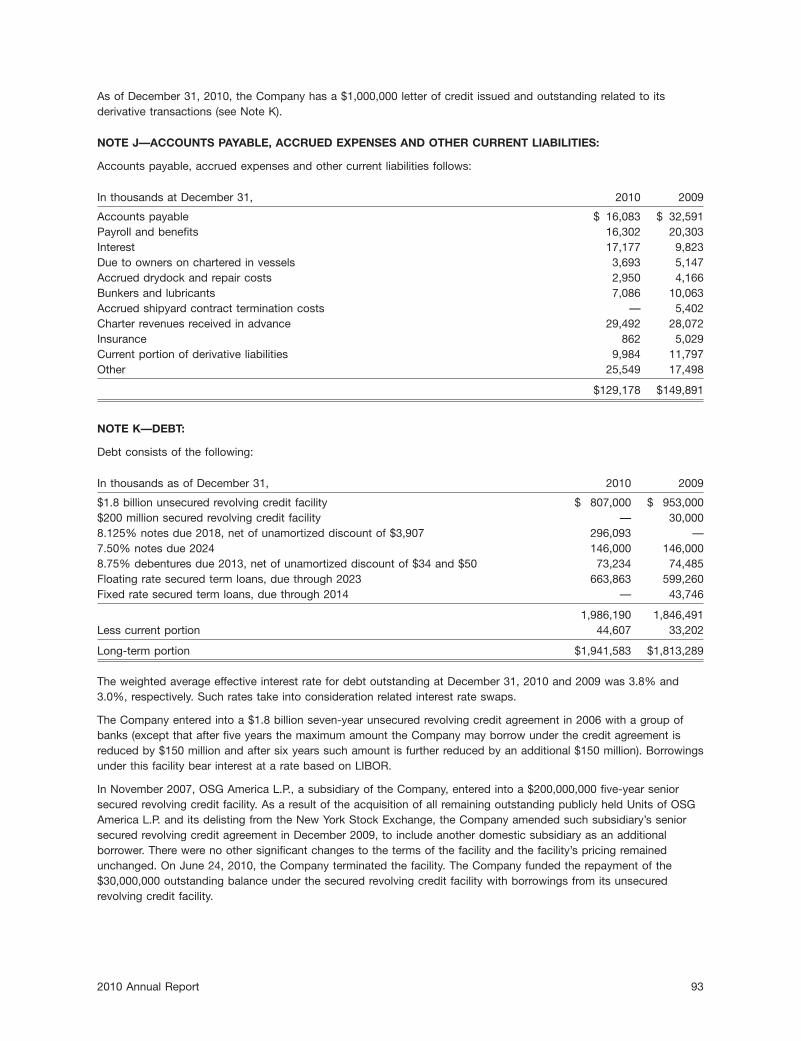
As of December 31, 2010, the Company has a $1,000,000 letter of credit issued and outstanding related to itsderivative transactions (see Note K).
NOTE J—ACCOUNTS PAYABLE, ACCRUED EXPENSES AND OTHER CURRENT LIABILITIES:
Accounts payable, accrued expenses and other current liabilities follows:
In thousands at December 31, 2010 2009
Accounts payable $ 16,083 $ 32,591Payroll and benefits 16,302 20,303Interest 17,177 9,823Due to owners on chartered in vessels 3,693 5,147Accrued drydock and repair costs 2,950 4,166Bunkers and lubricants 7,086 10,063Accrued shipyard contract termination costs — 5,402Charter revenues received in advance 29,492 28,072Insurance 862 5,029Current portion of derivative liabilities 9,984 11,797Other 25,549 17,498
$129,178 $149,891
NOTE K—DEBT:
Debt consists of the following:
In thousands as of December 31, 2010 2009
$1.8 billion unsecured revolving credit facility $ 807,000 $ 953,000$200 million secured revolving credit facility — 30,0008.125% notes due 2018, net of unamortized discount of $3,907 296,093 —7.50% notes due 2024 146,000 146,0008.75% debentures due 2013, net of unamortized discount of $34 and $50 73,234 74,485Floating rate secured term loans, due through 2023 663,863 599,260Fixed rate secured term loans, due through 2014 — 43,746
1,986,190 1,846,491Less current portion 44,607 33,202
Long-term portion $1,941,583 $1,813,289
The weighted average effective interest rate for debt outstanding at December 31, 2010 and 2009 was 3.8% and3.0%, respectively. Such rates take into consideration related interest rate swaps.
The Company entered into a $1.8 billion seven-year unsecured revolving credit agreement in 2006 with a group ofbanks (except that after five years the maximum amount the Company may borrow under the credit agreement isreduced by $150 million and after six years such amount is further reduced by an additional $150 million). Borrowingsunder this facility bear interest at a rate based on LIBOR.
In November 2007, OSG America L.P., a subsidiary of the Company, entered into a $200,000,000 five-year seniorsecured revolving credit facility. As a result of the acquisition of all remaining outstanding publicly held Units of OSGAmerica L.P. and its delisting from the New York Stock Exchange, the Company amended such subsidiary’s seniorsecured revolving credit agreement in December 2009, to include another domestic subsidiary as an additionalborrower. There were no other significant changes to the terms of the facility and the facility’s pricing remainedunchanged. On June 24, 2010, the Company terminated the facility. The Company funded the repayment of the$30,000,000 outstanding balance under the secured revolving credit facility with borrowings from its unsecuredrevolving credit facility.
2010 Annual Report 93

On July 1, 2010, the Company prepaid its fixed rate secured term loans due through 2014 with an outstandingbalance of $42,174,000. The weighted average interest rate of such debt was 6.0%. The Company funded thisrepayment with borrowings from its $1,800,000,000 unsecured credit facility.
On March 29, 2010, the Company issued $300,000,000 principal amount of senior unsecured notes at a discountpursuant to a Form S-3 shelf registration filed March 22, 2010. The notes are due in March 2018 and have a couponof 8.125%. The Company received proceeds of approximately $289,745,000, after deducting underwriting discountsand expenses. The Company used the net proceeds to reduce the outstanding indebtedness under its unsecuredrevolving credit facility.
In 2008, the Company repurchased principal amounts of $7,540,000 of its 8.75% debentures due in 2013 and its7.5% notes due in 2024 and recognized a net gain of approximately $331,000. In May 2008, the Companyredeemed, at a premium, its outstanding 8.25% Senior Notes due March 2013 with a principal amount of$176,115,000 and recognized a loss of $7,265,000, equal to the premium paid, in other income/(expense). Inaddition, the Company wrote off as additional interest expense, the balance of the unamortized deferred debtexpense of approximately $2,150,000.
In August 2009, the Company entered into a $389,000,000, 12-year secured facility with the Export-Import Bank ofChina. Borrowings under the facility will be used toward financing three VLCCs and two Aframaxes constructed inChina. Borrowings under the facility bear interest at a rate based on LIBOR. During 2009, the Company borrowed$299,156,000, under this facility. As of December 31, 2009, the Company maintained $7,495,000 of cashcontractually restricted to meet a loan-to-value covenant contained in the agreement. No such amounts wererequired as of December 31, 2010. At December 31, 2010, the Company had unused availability of approximately$89,807,000 under this facility.
At December 31, 2010, the Company had unused long-term unsecured credit availability, before the $150,000,000reduction in February 2011, of approximately $991,744,000 which reflects $1,256,000 of letters of credit issuedprincipally in connection with collateral requirements for derivative transactions.
Agreements related to long-term debt provide for prepayment privileges (in certain instances with penalties). Certainof the Company’s debt agreements contain loan-to-value clauses, which could require OSG, at its option, to postadditional collateral or prepay a portion of the outstanding borrowings should the value of the vessels securingborrowings under each of such agreements decrease below their current valuations. In addition, the financingagreements impose operating restrictions and establish minimum financial covenants, including limitations on theamount of total borrowings and secured debt and provide for acceleration of payment under certain circumstances,including failure to satisfy certain financial covenants. Failure to comply with any of the covenants in the financingagreements could also result in a default under those agreements and under other agreements containing cross-default provisions. The Company was in compliance with all of the financial covenants contained in the Company’sdebt agreements as of December 31, 2010.
As of December 31, 2010, 17 vessels, including two that are under construction, representing approximately 30.5%of the net book value of the Company’s vessels, are pledged as collateral under certain debt agreements.
The aggregate annual principal payments, including unamortized discounts, required to be made on debt are asfollows:
In thousands at December 31, 2010
2011 $ 44,6072012 53,9372013 934,2052014 63,4712015 45,436Thereafter 848,476
$1,990,132
Interest paid, excluding capitalized interest, amounted to $59,689,000 in 2010, $43,125,000 in 2009 and $66,464,000in 2008.
94 Overseas Shipholding Group, Inc.

NOTE L—TAXES:
From January 1, 1987 through December 31, 2004, earnings of the foreign shipping companies (exclusive of foreignjoint ventures in which the Company has a less than 50% interest) were subject to U.S. income taxation in the yearearned and could therefore be distributed to the U.S. parent without further tax. The full balance of previously taxedearnings of the foreign shipping subsidiaries’ earnings has been repatriated to the U.S. parent. Income of foreignshipping companies earned from January 1, 1976 through December 31, 1986 (‘‘Deferred Income’’) was excludedfrom U.S. income taxation to the extent that such income was reinvested in foreign shipping operations. Foreignshipping income earned before 1976 is not subject to tax unless distributed to the U.S. parent. A determination ofthe amount of qualified investments in foreign shipping operations, as defined, is made at the end of each year andsuch amount is compared with the corresponding amount at December 31, 1986. If, during any determination period,there is a reduction of qualified investments in foreign shipping operations, Deferred Income, limited to the amount ofsuch reduction, would become subject to tax.
On October 22, 2004, the President of the U.S. signed into law the American Jobs Creation Act of 2004. The JobsCreation Act reinstated tax deferral for OSG’s foreign shipping income for years beginning after December 31, 2004.Effective January 1, 2005, the earnings from shipping operations of the Company’s foreign subsidiaries are notsubject to U.S. income taxation as long as such earnings are not repatriated to the U.S. The Company intends topermanently reinvest these earnings, as well as its share of the undistributed earnings of its less than 50%-ownedforeign shipping joint ventures, in foreign operations. Accordingly, no provision for U.S. income taxes on the shippingincome of its foreign subsidiaries or its less than 50%-owned foreign shipping joint ventures was required in the threeyears ended December 31, 2010 and no provision for U.S. income taxes on the undistributed income of the foreignshipping companies accumulated through December 31, 1986 was required at December 31, 2010. As ofDecember 31, 2010, undistributed earnings on which U.S. income taxes have not been provided aggregatedapproximately $2,400,000,000, including $119,000,000 earned prior to 1976; the unrecognized deferred U.S. incometax attributable to such undistributed earnings approximated $840,000,000.
Pursuant to the Merchant Marine Act of 1936, as amended, the Company was a party to an agreement thatpermitted annual deposits, related to taxable income of certain of its domestic subsidiaries, into a CapitalConstruction Fund. Payments of federal income taxes on such deposits and earnings thereon were deferred until,and if, such funds would have been withdrawn for nonqualified purposes or termination of the agreement; however, ifwithdrawn for qualified purposes (acquisition of U.S. Flag vessels or retirement of debt on U.S. Flag vessels), suchfunds remained tax-deferred and the federal income tax basis of any such vessel were reduced by the amount ofsuch withdrawals. The remaining balance in the Capital Construction Fund was withdrawn in July 2010 for qualifiedpurposes.
2010 Annual Report 95
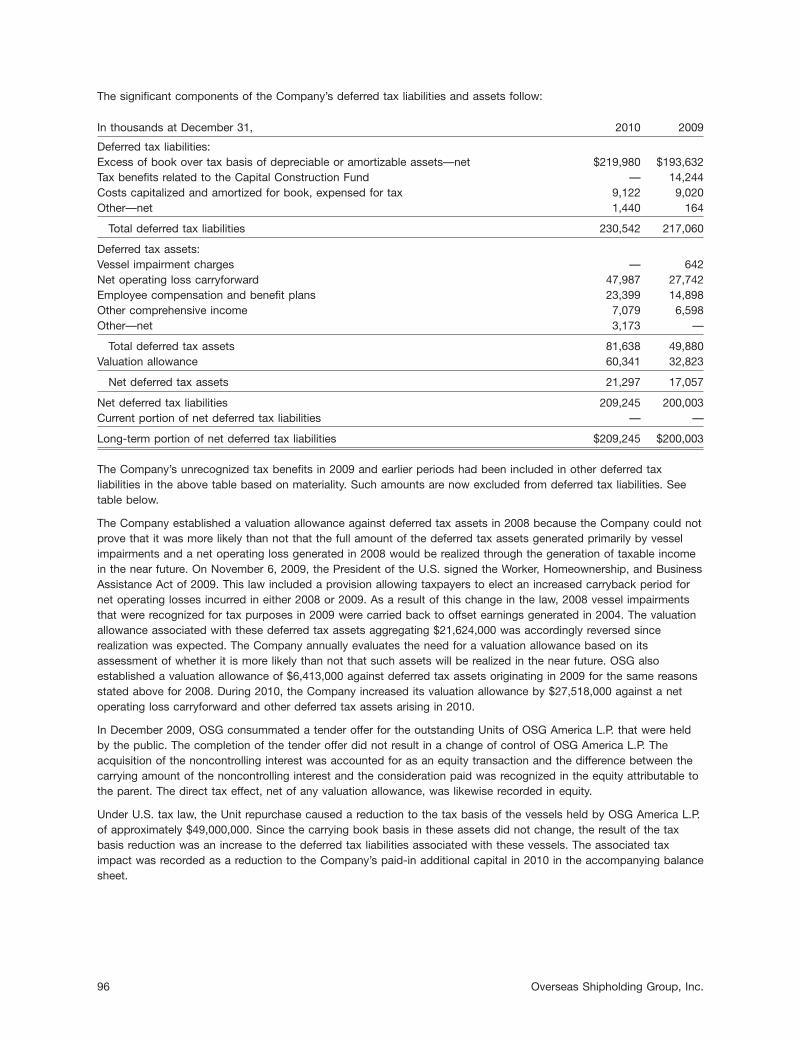
The significant components of the Company’s deferred tax liabilities and assets follow:
In thousands at December 31, 2010 2009
Deferred tax liabilities:Excess of book over tax basis of depreciable or amortizable assets—net $219,980 $193,632Tax benefits related to the Capital Construction Fund — 14,244Costs capitalized and amortized for book, expensed for tax 9,122 9,020Other—net 1,440 164
Total deferred tax liabilities 230,542 217,060
Deferred tax assets:Vessel impairment charges — 642Net operating loss carryforward 47,987 27,742Employee compensation and benefit plans 23,399 14,898Other comprehensive income 7,079 6,598Other—net 3,173 —
Total deferred tax assets 81,638 49,880Valuation allowance 60,341 32,823
Net deferred tax assets 21,297 17,057
Net deferred tax liabilities 209,245 200,003Current portion of net deferred tax liabilities — —
Long-term portion of net deferred tax liabilities $209,245 $200,003
The Company’s unrecognized tax benefits in 2009 and earlier periods had been included in other deferred taxliabilities in the above table based on materiality. Such amounts are now excluded from deferred tax liabilities. Seetable below.
The Company established a valuation allowance against deferred tax assets in 2008 because the Company could notprove that it was more likely than not that the full amount of the deferred tax assets generated primarily by vesselimpairments and a net operating loss generated in 2008 would be realized through the generation of taxable incomein the near future. On November 6, 2009, the President of the U.S. signed the Worker, Homeownership, and BusinessAssistance Act of 2009. This law included a provision allowing taxpayers to elect an increased carryback period fornet operating losses incurred in either 2008 or 2009. As a result of this change in the law, 2008 vessel impairmentsthat were recognized for tax purposes in 2009 were carried back to offset earnings generated in 2004. The valuationallowance associated with these deferred tax assets aggregating $21,624,000 was accordingly reversed sincerealization was expected. The Company annually evaluates the need for a valuation allowance based on itsassessment of whether it is more likely than not that such assets will be realized in the near future. OSG alsoestablished a valuation allowance of $6,413,000 against deferred tax assets originating in 2009 for the same reasonsstated above for 2008. During 2010, the Company increased its valuation allowance by $27,518,000 against a netoperating loss carryforward and other deferred tax assets arising in 2010.
In December 2009, OSG consummated a tender offer for the outstanding Units of OSG America L.P. that were heldby the public. The completion of the tender offer did not result in a change of control of OSG America L.P. Theacquisition of the noncontrolling interest was accounted for as an equity transaction and the difference between thecarrying amount of the noncontrolling interest and the consideration paid was recognized in the equity attributable tothe parent. The direct tax effect, net of any valuation allowance, was likewise recorded in equity.
Under U.S. tax law, the Unit repurchase caused a reduction to the tax basis of the vessels held by OSG America L.P.of approximately $49,000,000. Since the carrying book basis in these assets did not change, the result of the taxbasis reduction was an increase to the deferred tax liabilities associated with these vessels. The associated taximpact was recorded as a reduction to the Company’s paid-in additional capital in 2010 in the accompanying balancesheet.
96 Overseas Shipholding Group, Inc.

The components of income/(loss) before income taxes, adjusted for noncontrolling interest, follow:
In thousands for the year ended December 31, 2010 2009 2008
Foreign $ (13,259) $ 175,771 $ 593,025Domestic (128,440) (141,321) (309,364)
$(141,699) $ 34,450 $ 283,661
Substantially all of the above foreign income resulted from the operations of companies that were not subject toincome taxes in their countries of incorporation.
The adjustments for noncontrolling interest relate only to domestic income.
The components of the income tax (provisions)/benefits follow:
In thousands for the year ended December 31, 2010 2009 2008
Current $ (2,720) $40,395 $ 7,868Deferred 10,176 (3,698) 26,136
$ 7,456 $36,697 $34,004
Reconciliations of the actual income tax rate attributable to pretax results and the U.S. statutory income tax ratefollow:
For the year ended December 31, 2010 2009 2008
Actual income tax rate 5.2% (106.5)% (12.3)%Adjustments due to:
Goodwill impairment charge — — (6.0)%Operations not subject to U.S. income taxes 10.5% 97.3% 68.0%Basis adjustment recognized related to liquidation of OSG America L.P. 1.4% (13.6)% —Other 2.5% 13.6% 2.2%
Valuation allowance 15.4% 44.2% (16.9)%
U.S. statutory income tax rate 35.0% 35.0% 35.0%
The following is a roll-forward of the Company’s unrecognized tax benefits for 2010 and 2009:
In thousands 2010 2009
Balance of unrecognized tax benefits as of January 1, $5,292 $ 7,546Increases for positions taken in prior years 1,072 226Increases for positions related to the current year — 1,234Amounts of decreases related to settlements (812) (2,094)Reductions due to lapse of statutes of limitations (609) (1,620)
Balance of unrecognized tax benefits as of December 31, $4,943 $ 5,292
The Company does not presently anticipate that such uncertain tax positions will significantly increase or decrease inthe next 12 months; however actual developments could differ from those currently expected. The Company isgenerally no longer subject to federal, state and local income tax examinations by tax authorities for years prior to2004.
OSG records interest and penalties on unrecognized tax benefits in its provision for income taxes. The interest andpenalties on unrecognized tax benefits are included in the roll-forward schedule above and were approximately$1,065,000 in 2010 and $1,303,000 in 2009.
2010 Annual Report 97

NOTE M—CAPITAL STOCK AND STOCK COMPENSATION:
On March 9, 2010, pursuant to a Form S-3 shelf registration, the Company sold 3,500,000 shares of its commonstock at a price of $45.33 per share. The Company received net proceeds of $158,266,000, after deductingestimated expenses.
Stock Repurchase ProgramsIn June 2008, the Company’s Board of Directors authorized the repurchase of up to $250,000,000 of the Company’scommon stock from time-to-time. Such purchases of the Company’s common stock will be made at the Company’sdiscretion and take into account such factors as price and prevailing market conditions. As of December 31, 2010,the Company had repurchased 3,798,200 shares of its common stock under the 2008 program. In April 2007, theCompany’s Board of Directors authorized a share repurchase program of $200,000,000, which replaced a prior$300,000,000 share repurchase program authorized in June 2006. The Company completed the 2007 sharerepurchase program in the second quarter of 2008 and had repurchased 2,812,385 shares of its common stockunder such program.
The 2004 Stock Incentive PlanThe Company’s 2004 Stock Incentive Plan, as amended and restated as of June 2010 (the ‘‘2004 Plan’’), enables theCompany to grant stock- based awards, including stock options, stock appreciation rights, restricted stock andperformance awards to employees, consultants and non-employee directors. In March 2010, the Company’s Board ofDirectors approved an amendment and restatement of the 2004 Plan, subject to approval by the shareholders, whichapproval was received in June 2010. The amendment increased the total number of stock-based awards that can bemade under the 2004 Plan to 5,665,000 shares. A total of 3,029,602 shares of the Company’s stock may be issuedor used as the basis for awards under the 2004 Plan as of December 31, 2010.
Restricted Stock UnitsThe Company granted a total of 30,444, 33,840, and 15,228 restricted stock units during the years endedDecember 31, 2010, 2009 and 2008, respectively, to certain of its non-employee directors. At the date of the awardsthe fair market value of the Company’s stock was $39.41 (2010), $35.46 (2009) and $78.80 (2008) per share. Eachrestricted stock unit represents a contingent right to receive one share of common stock upon the non-executivedirector’s termination of service as a board member. Restricted stock units granted subsequent to 2007 vest ratablyover a four-year period, which period may be accelerated provided that the director has served until the earlier of(a) the first anniversary of the grant date or (b) the next annual meeting of the Company’s stockholders. The restrictedstock units have no voting rights and may not be transferred or otherwise disposed of while the non-employeedirector is a director. The non-employee director is entitled to dividends in the form of additional restricted stock unitsat the same time dividends are paid on the Company’s common stock in an amount equal to the result obtained bydividing (i) the product of (x) the amount of units owned by the non-employee director on the record date for thedividend times (y) the dividend per share by (ii) the closing price of a share of the Company’s common stock on thepayment date, which restricted units vest immediately on the payment date for the dividend.
Restricted Common Stock, Performance Related Restricted Stock Units and OptionsThe Company awarded a total of 71,008 (2010) and 272,515 (2008) shares during the three years endedDecember 31, 2010, of restricted common stock at no cost to certain of its employees, including senior officers.Restrictions limit the sale or transfer of these shares until they vest, which occurs over a four or five-year period.During the restriction period, the shares will have voting rights and cash dividends will be paid if declared. Theweighted average fair values of the restricted stock issued during the three years ended December 31, 2010, were$43.40 (2010) and $51.29 (2008) per share.
In 2010, the Company granted a total of 44,142 performance related restricted stock units to certain of itsemployees, including senior officers. Each performance stock unit represents a contingent right to receive a variablenumber of shares of common stock of the Company based upon certain market related performance goals being metand the covered employees being continuously employed through the end of the period over which the performancegoals are measured. The performance stock units have no voting rights and may not be transferred or otherwisedisposed of until they vest. Dividends will be paid in the form of additional performance units when the performanceperiod expires and are conditioned upon the attainment of the performance goals. The estimated weighted average
98 Overseas Shipholding Group, Inc.

grant-date fair value of performance stock units awarded during 2010 was $52.43. The performance related grants in2010 were valued using a Monte Carlo pricing model that takes into account the market related performance goalsdescribed in the grants.
In 2007, the Company granted a total of 278,083 performance related restricted stock units and performance relatedoptions covering 146,270 shares to certain of its employees, including senior officers. Each performance stock unitrepresents a contingent right to receive one share of common stock if certain market related performance goals weremet and the covered employees were continuously employed through the end of the period over which theperformance goals are measured. The performance stock units had no voting rights and could not be transferred orotherwise disposed of until they vest. Cash dividends, if declared, were to be held uninvested and without interestand paid in cash if and when such performance stock units vested. The weighted average grant-date market pricesof the performance stock units awarded during 2007 was $56.46 per share. The estimated weighted averagegrant-date fair value of performance stock units awarded during 2007 was $20.41 per share. The weighted averageexercise price of the performance options awarded during 2007 was $63.44 per share (the market price at date ofgrant). The estimated weighted average grant-date fair value of performance options awarded during 2007 was$17.23 per share. On December 31, 2009, a total of 195,407 performance related restricted stock units were forfeitedsince the related market related performance goal was not met. No performance related restricted stock units vestedduring the three years ended December 31, 2009 (term of the awards), since the market related performance goalswere not met.
Compensation expense is recognized over the vesting period, contingent or otherwise, applicable to each grant,using the straight-line method. Compensation expense as a result of all of these grants of restricted stock andrestricted stock units was $7,700,000, $8,774,000 and $7,617,000 during each of the years ended December 31,2010, 2009 and 2008, respectively.
Activity with respect to restricted common stock and restricted stock units is summarized as follows:
Nonvested Shares Outstanding at December 31, 2007 513,054Granted 287,582Vested ($35.70 to $79.16 per share) (82,494)Forfeited (11,938)
Nonvested Shares Outstanding at December 31, 2008 706,204Granted 33,840Vested ($40.95 to $78.80 per share) (142,931)Forfeited (234,884)
Nonvested Shares Outstanding at December 31, 2009 362,229Granted 145,594Vested ($35.46 to $64.92 per share) (140,292)Forfeited (15,836)
Nonvested Shares Outstanding at December 31, 2010 351,695
Stock OptionsOptions covering 1,399,094 shares are outstanding under the 2004 Plan with exercise prices ranging from $40.95 to$64.92 per share (the market prices at dates of grant).
Options covering 102,112 shares are outstanding under the 1998 stock option plan with exercise prices ranging from$18.16 to $35.70 per share (the market prices at dates of grant). Options granted under the 1998 stock option planvest and become exercisable over a three-year period and expire ten years from the date of grant. No further optionsmay be granted under this plan.
Options covering 42,000 shares are outstanding under the 1999 non-employee director stock option plan withexercise prices ranging from $16.35 to $44.47 per share (the market prices at dates of grant). The plan provided forthe grant of an initial option for 7,500 shares and an annual option for 1,000 shares thereafter to each non-employeedirector at an exercise price equal to market value at the date of the grant. Initial options vested and became
2010 Annual Report 99
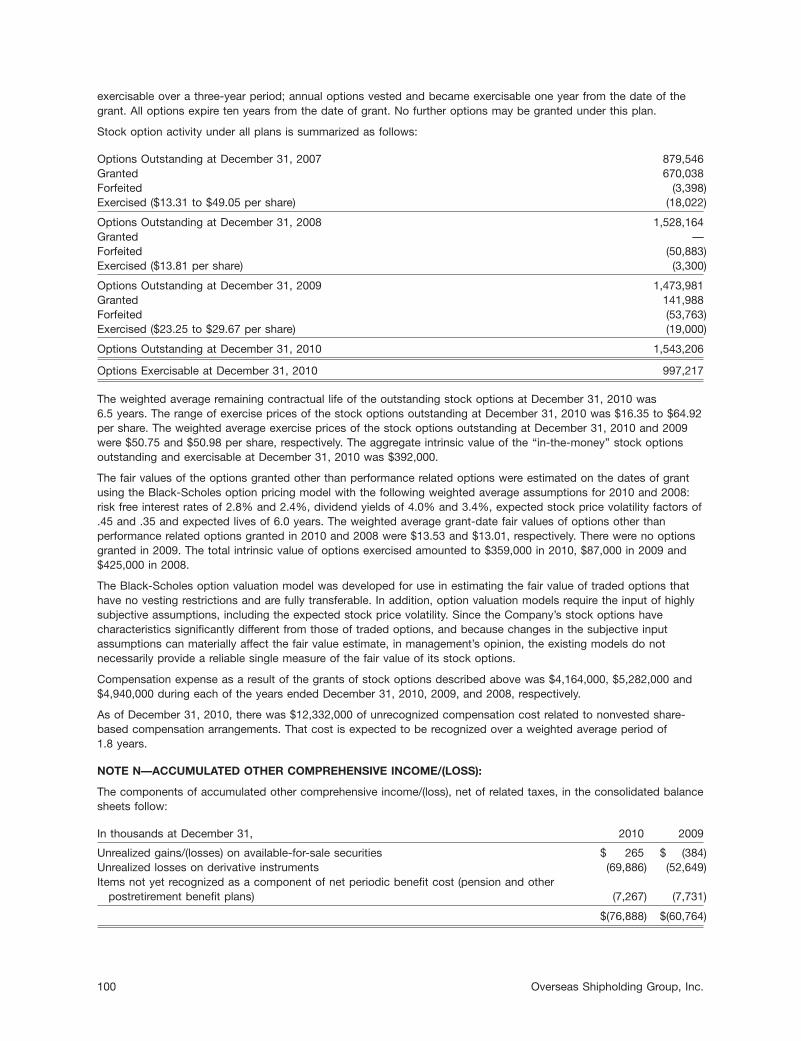
exercisable over a three-year period; annual options vested and became exercisable one year from the date of thegrant. All options expire ten years from the date of grant. No further options may be granted under this plan.
Stock option activity under all plans is summarized as follows:
Options Outstanding at December 31, 2007 879,546Granted 670,038Forfeited (3,398)Exercised ($13.31 to $49.05 per share) (18,022)
Options Outstanding at December 31, 2008 1,528,164Granted —Forfeited (50,883)Exercised ($13.81 per share) (3,300)
Options Outstanding at December 31, 2009 1,473,981Granted 141,988Forfeited (53,763)Exercised ($23.25 to $29.67 per share) (19,000)
Options Outstanding at December 31, 2010 1,543,206
Options Exercisable at December 31, 2010 997,217
The weighted average remaining contractual life of the outstanding stock options at December 31, 2010 was6.5 years. The range of exercise prices of the stock options outstanding at December 31, 2010 was $16.35 to $64.92per share. The weighted average exercise prices of the stock options outstanding at December 31, 2010 and 2009were $50.75 and $50.98 per share, respectively. The aggregate intrinsic value of the ‘‘in-the-money’’ stock optionsoutstanding and exercisable at December 31, 2010 was $392,000.
The fair values of the options granted other than performance related options were estimated on the dates of grantusing the Black-Scholes option pricing model with the following weighted average assumptions for 2010 and 2008:risk free interest rates of 2.8% and 2.4%, dividend yields of 4.0% and 3.4%, expected stock price volatility factors of.45 and .35 and expected lives of 6.0 years. The weighted average grant-date fair values of options other thanperformance related options granted in 2010 and 2008 were $13.53 and $13.01, respectively. There were no optionsgranted in 2009. The total intrinsic value of options exercised amounted to $359,000 in 2010, $87,000 in 2009 and$425,000 in 2008.
The Black-Scholes option valuation model was developed for use in estimating the fair value of traded options thathave no vesting restrictions and are fully transferable. In addition, option valuation models require the input of highlysubjective assumptions, including the expected stock price volatility. Since the Company’s stock options havecharacteristics significantly different from those of traded options, and because changes in the subjective inputassumptions can materially affect the fair value estimate, in management’s opinion, the existing models do notnecessarily provide a reliable single measure of the fair value of its stock options.
Compensation expense as a result of the grants of stock options described above was $4,164,000, $5,282,000 and$4,940,000 during each of the years ended December 31, 2010, 2009, and 2008, respectively.
As of December 31, 2010, there was $12,332,000 of unrecognized compensation cost related to nonvested share-based compensation arrangements. That cost is expected to be recognized over a weighted average period of1.8 years.
NOTE N—ACCUMULATED OTHER COMPREHENSIVE INCOME/(LOSS):
The components of accumulated other comprehensive income/(loss), net of related taxes, in the consolidated balancesheets follow:
In thousands at December 31, 2010 2009
Unrealized gains/(losses) on available-for-sale securities $ 265 $ (384)Unrealized losses on derivative instruments (69,886) (52,649)Items not yet recognized as a component of net periodic benefit cost (pension and other
postretirement benefit plans) (7,267) (7,731)
$(76,888) $(60,764)
100 Overseas Shipholding Group, Inc.

At December 31, 2010, the Company expects that it will reclassify $34,256,000 of net losses on derivativeinstruments from accumulated other comprehensive income/(loss) to earnings during the next twelve months relatedto the effective portions of qualifying foreign currency transactions that will affect earnings for 2011 and due to thepayment of variable rate interest associated with floating rate debt.
The components of the change in the accumulated unrealized loss on derivative instruments, net of related taxesfollow:
In thousands for the year ended December 31, 2010 2009
Reclassification adjustments for amounts included in net income/(loss), net:Interest expense $ 10,321 $ 9,309Shipping revenues (1,707) (41,445)
Change in unrealized impact of derivative instruments (25,851) 109,938
$(17,237) $ 77,802
The income tax expense/(benefit) allocated to each component of other comprehensive income/(loss) follows:
In thousands for the year ended December 31, 2010 2009 2008
Unrealized losses on derivative instruments $(4,055) $1,151 $(3,226)Pension liabilities 93 2,532 (3,646)Reclassification adjustments included in net income/(loss):
General and administrative expenses 21 112 87Losses on derivative instruments 2,365 1,913 290
$(1,576) $5,708 $(6,495)
NOTE O—LEASES:
1. Charters-in:
As of December 31, 2010, the Company had commitments to charter-in 50 vessels. All of the charter-ins are, or willbe, accounted for as operating leases, of which 23 are bareboat charters and 27 are time charters. The futureminimum commitments and related number of operating days under these operating leases are as follows:
Bareboat Charters-in:
Dollars in thousands at December 31, 2010 Amount Operating Days
2011 $151,003 7,5972012 153,304 7,6862013 152,832 7,6652014 142,490 6,1002015 87,108 3,850Thereafter 199,543 10,734
Net minimum lease payments $886,280 43,632
Time Charters-in:
Dollars in thousands at December 31, 2010 Amount Operating Days
2011 $198,355 9,8132012 137,010 6,8082013 83,230 4,8542014 77,106 4,6862015 69,348 4,232Thereafter 118,079 7,216
Net minimum lease payments $683,128 37,609
2010 Annual Report 101
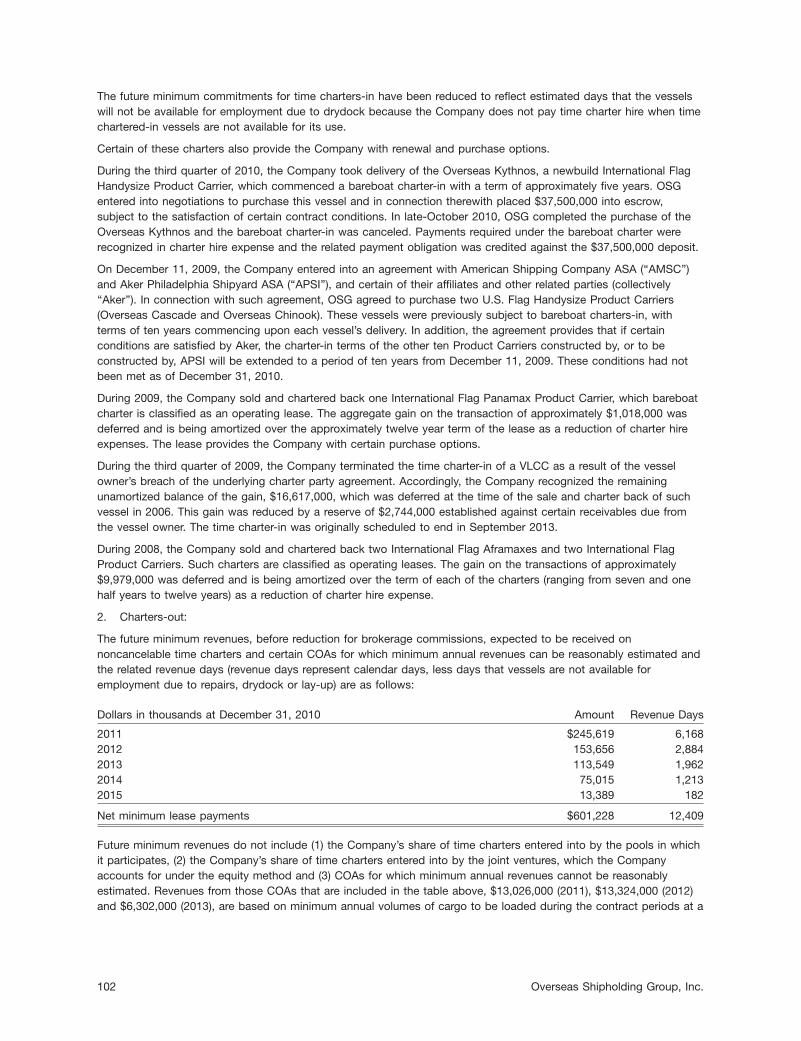
The future minimum commitments for time charters-in have been reduced to reflect estimated days that the vesselswill not be available for employment due to drydock because the Company does not pay time charter hire when timechartered-in vessels are not available for its use.
Certain of these charters also provide the Company with renewal and purchase options.
During the third quarter of 2010, the Company took delivery of the Overseas Kythnos, a newbuild International FlagHandysize Product Carrier, which commenced a bareboat charter-in with a term of approximately five years. OSGentered into negotiations to purchase this vessel and in connection therewith placed $37,500,000 into escrow,subject to the satisfaction of certain contract conditions. In late-October 2010, OSG completed the purchase of theOverseas Kythnos and the bareboat charter-in was canceled. Payments required under the bareboat charter wererecognized in charter hire expense and the related payment obligation was credited against the $37,500,000 deposit.
On December 11, 2009, the Company entered into an agreement with American Shipping Company ASA (‘‘AMSC’’)and Aker Philadelphia Shipyard ASA (‘‘APSI’’), and certain of their affiliates and other related parties (collectively‘‘Aker’’). In connection with such agreement, OSG agreed to purchase two U.S. Flag Handysize Product Carriers(Overseas Cascade and Overseas Chinook). These vessels were previously subject to bareboat charters-in, withterms of ten years commencing upon each vessel’s delivery. In addition, the agreement provides that if certainconditions are satisfied by Aker, the charter-in terms of the other ten Product Carriers constructed by, or to beconstructed by, APSI will be extended to a period of ten years from December 11, 2009. These conditions had notbeen met as of December 31, 2010.
During 2009, the Company sold and chartered back one International Flag Panamax Product Carrier, which bareboatcharter is classified as an operating lease. The aggregate gain on the transaction of approximately $1,018,000 wasdeferred and is being amortized over the approximately twelve year term of the lease as a reduction of charter hireexpenses. The lease provides the Company with certain purchase options.
During the third quarter of 2009, the Company terminated the time charter-in of a VLCC as a result of the vesselowner’s breach of the underlying charter party agreement. Accordingly, the Company recognized the remainingunamortized balance of the gain, $16,617,000, which was deferred at the time of the sale and charter back of suchvessel in 2006. This gain was reduced by a reserve of $2,744,000 established against certain receivables due fromthe vessel owner. The time charter-in was originally scheduled to end in September 2013.
During 2008, the Company sold and chartered back two International Flag Aframaxes and two International FlagProduct Carriers. Such charters are classified as operating leases. The gain on the transactions of approximately$9,979,000 was deferred and is being amortized over the term of each of the charters (ranging from seven and onehalf years to twelve years) as a reduction of charter hire expense.
2. Charters-out:
The future minimum revenues, before reduction for brokerage commissions, expected to be received onnoncancelable time charters and certain COAs for which minimum annual revenues can be reasonably estimated andthe related revenue days (revenue days represent calendar days, less days that vessels are not available foremployment due to repairs, drydock or lay-up) are as follows:
Dollars in thousands at December 31, 2010 Amount Revenue Days
2011 $245,619 6,1682012 153,656 2,8842013 113,549 1,9622014 75,015 1,2132015 13,389 182
Net minimum lease payments $601,228 12,409
Future minimum revenues do not include (1) the Company’s share of time charters entered into by the pools in whichit participates, (2) the Company’s share of time charters entered into by the joint ventures, which the Companyaccounts for under the equity method and (3) COAs for which minimum annual revenues cannot be reasonablyestimated. Revenues from those COAs that are included in the table above, $13,026,000 (2011), $13,324,000 (2012)and $6,302,000 (2013), are based on minimum annual volumes of cargo to be loaded during the contract periods at a
102 Overseas Shipholding Group, Inc.

fixed price. The largest COA in the Delaware Bay lightering trade is excluded from the table above because theminimum annual revenues for that contract cannot be reasonably estimated. Revenues from a time charter are notgenerally received when a vessel is off-hire, including time required for normal periodic maintenance of the vessel. Inarriving at the minimum future charter revenues, an estimated time off-hire to perform periodic maintenance on eachvessel has been deducted, although there is no assurance that such estimate will be reflective of the actual off-hire inthe future. Two of the Company’s vessels were chartered out to a company that filed for bankruptcy in January 2011.These charters, which were canceled in February 2011, represent $12,200,000 of the 2011 minimum future revenuesreflected in the table above. It is unlikely that the Company will be able to replace these time charters at comparablelevels in the spot market.
3. Office space:
The future minimum commitments under lease obligations for office space are as follows:
In thousands at December 31, 2010
2011 $ 4,6892012 4,6772013 4,6942014 3,9732015 3,444Thereafter 16,469
Net minimum lease payments $37,946
The rental expense for office space, which is included in general and administrative expenses in the consolidatedstatements of operations, amounted to $5,013,000 in 2010, $5,737,000 in 2009 and $5,531,000 in 2008.
NOTE P—PENSION AND OTHER POSTRETIREMENT BENEFIT PLANS:
Pension PlansIn connection with the November 2006 acquisition of Maritrans, the Company assumed the obligations under thedefined benefit retirement plan of Maritrans Inc. (‘‘the Maritrans Plan’’). As of December 31, 2006, the Company frozethe benefits under the Maritrans Plan. At December 31, 2010, the Maritrans Plan is the only domestic defined benefitpension plan in existence. The Maritrans Plan was noncontributory and covered substantially all shore-basedemployees and substantially all of the seagoing supervisors who were supervisors in 1984, or who were hired in, orpromoted into, supervisory roles between 1984 and 1998 for that period of time. Beginning in 1999, the seagoingsupervisors’ retirement benefits are provided through contributions to an industry-wide, multi-employer unionsponsored pension plan. Upon retirement, those seagoing supervisors are entitled to retirement benefits from theMaritrans Plan for service periods between 1984 and 1998 and from the multi-employer union sponsored plan forother covered periods. Retirement benefits are based primarily on years of service and average compensation for thefive consecutive plan years that produce the highest results.
The Company also has obligations outstanding under an unfunded, nonqualified supplemental defined benefitpension plan, which was terminated in December 2005, to five former employees entitled to deferred benefits andtwo retirees currently in receipt of benefits.
Certain of the Company’s foreign subsidiaries have pension plans that, in the aggregate, are not significant to theCompany’s consolidated financial position.
Certain subsidiaries make contributions to jointly managed (Company and union) multi-employer pension planscovering seagoing personnel. The Company’s contributions to such plans during 2010, 2009 and 2008 were notmaterial. The Employee Retirement Income Security Act of 1974 requires employers who are contributors to U.S.multi-employer plans to continue funding their allocable share of each plan’s unfunded vested benefits in the event ofwithdrawal from or termination of such plans. Based on information received from the trustees of such plans, theCompany believes that any withdrawal liabilities as of December 31, 2010 are not material. Certain other seagoingpersonnel of U.S. Flag vessels are covered under a defined contribution plan, the cost of which is funded asaccrued. The costs of these plans were not material during the three years ended December 31, 2010.
2010 Annual Report 103

Postretirement Benefit plansThe Company also provides certain postretirement health care and life insurance benefits to qualifying domesticretirees and their eligible dependents. The health care plan for shore-based employees and their dependents andseagoing licensed deck officers and their dependents is contributory, while the life insurance plan for all employees isnoncontributory. In general, postretirement medical coverage is provided to employees hired prior to January 1, 2005who retire and have met minimum age and service requirements under a formula related to total years of service. TheCompany no longer provides prescription drug coverage to its retirees or their beneficiaries, once they reach age 65.The Company does not currently fund these benefit arrangements and has the right to amend or terminate the healthcare and life insurance benefits at any time.
Included in accumulated other comprehensive income/(loss) at December 31, 2010 are the following amounts thathave not yet been recognized in net periodic cost: unrecognized transition obligation of $45,000 ($28,000 net of tax),unrecognized prior service costs of $1,161,000 ($935,000 net of tax) and unrecognized actuarial losses $9,145,000($6,304,000 net of tax). The transition obligation, prior service credit and actuarial loss included in accumulated othercomprehensive income/(loss) and expected to be recognized in net periodic cost during the year endedDecember 31, 2011 is $20,000 ($13,000 net of tax), $76,000 ($43,000 net of tax) and $239,000 ($163,000 net of tax),respectively.
Information with respect to the domestic pension and postretirement benefit plans for which the Company uses aDecember 31 measurement date, follow:
Pension benefits Other benefits
In thousands at December 31, 2010 2009 2010 2009
Change in benefit obligation:Benefit obligation at beginning of year $ 40,862 $ 45,756 $ 5,485 $ 4,076Cost of benefits earned (service cost) — — 223 205Interest cost on benefit obligation 2,212 2,235 295 223Amendments — — (639) —Actuarial losses/(gains) 1,605 (4,399) 170 1,130Benefits paid (2,219) (2,730) (132) (149)
Benefit obligation at year end 42,460 40,862 5,402 5,485
Change in plan assets:Fair value of plan assets at beginning of year 26,752 22,540 — —Actual return on plan assets 3,361 5,602 — —Employer contributions 2,359 1,265 — —Benefits paid (2,143) (2,655) — —
Fair value of plan assets at year end 30,329 26,752 — —
Funded (unfunded) status at December 31 $(12,131) $(14,110) $(5,402) $(5,485)
The unfunded benefit obligations for the Company’s pension and postretirement benefit plans are included in deferredincome taxes and other liabilities in the consolidated balance sheet.
Information for domestic defined benefit pension plans with accumulated benefit obligations in excess of plan assetsfollows:
In thousands at December 31, 2010 2009
Projected benefit obligation $42,460 $40,862Accumulated benefit obligation 42,460 40,862Fair value of plan assets 30,329 26,752
104 Overseas Shipholding Group, Inc.

Pension benefits Other benefits
In thousands for the year ended December 31, 2010 2009 2008 2010 2009 2008
Components of expense:Cost of benefits earned $ — $ — $ — $ 223 $ 205 $ 147Interest cost on benefit obligation 2,212 2,235 2,262 295 223 227Expected return on plan assets (1,796) (1,451) (2,086) — — —Amortization of prior-service costs — — — (240) (240) (240)Amortization of transition obligation — — — 20 20 20Recognized net actuarial loss 25 375 18 91 22 35
Net periodic benefit cost $ 441 $ 1,159 $ 194 $ 389 $ 230 $ 189
The weighted-average assumptions used to determine benefit obligations follow:
Pensionbenefits Other benefits
At December 31, 2010 2009 2010 2009
Discount rate 5.25% 5.50% 5.25% 5.50%Rate of future compensation increases — — — —
The selection of a discount rate for the Maritrans Plan for all reporting periods between 2006 and December 31,2008, was based on the assumption that the plan would be terminated and all eligible participants would receiveinsurance company annuities when all necessary approvals were obtained. The Company, however, has not securedsuch insurance annuities, due largely to the impact of historically low long-term interest rates on the cost of obtainingsuch annuities. Accordingly, at December 31, 2010 and 2009, the Company used a discount rate which it believed asof such dates, to be appropriate for ongoing plans with a long duration, such as the Maritrans Plan.
The weighted-average assumptions used to determine net periodic benefit cost follow:
Pension benefits Other benefits
For the year ended December 31, 2010 2009 2008 2010 2009 2008
Discount rate 5.50% 5.00% 5.25% 5.50% 5.75% 6.00%Expected (long-term) return on plan assets 6.75% 6.75% 6.75% — — —Rate of future compensation increases — — — — — —
The assumed health care cost trend rate for measuring the benefit obligation included in Other Benefits above is anincrease of 8% for 2011 over the actual 2010 rates, with the rate of increase declining steadily thereafter by 1% perannum to an ultimate trend rate of 5% per annum in 2014. Assumed health care cost trend rates have a significanteffect on the amounts reported for the health care plans. A 1% change in assumed health care cost trend rateswould have the following effects:
In thousands 1% increase 1% decrease
Effect on total of service and interest cost components in 2010 $111 $ (84)Effect on postretirement benefit obligation as of December 31, 2010 $842 $(658)
2010 Annual Report 105
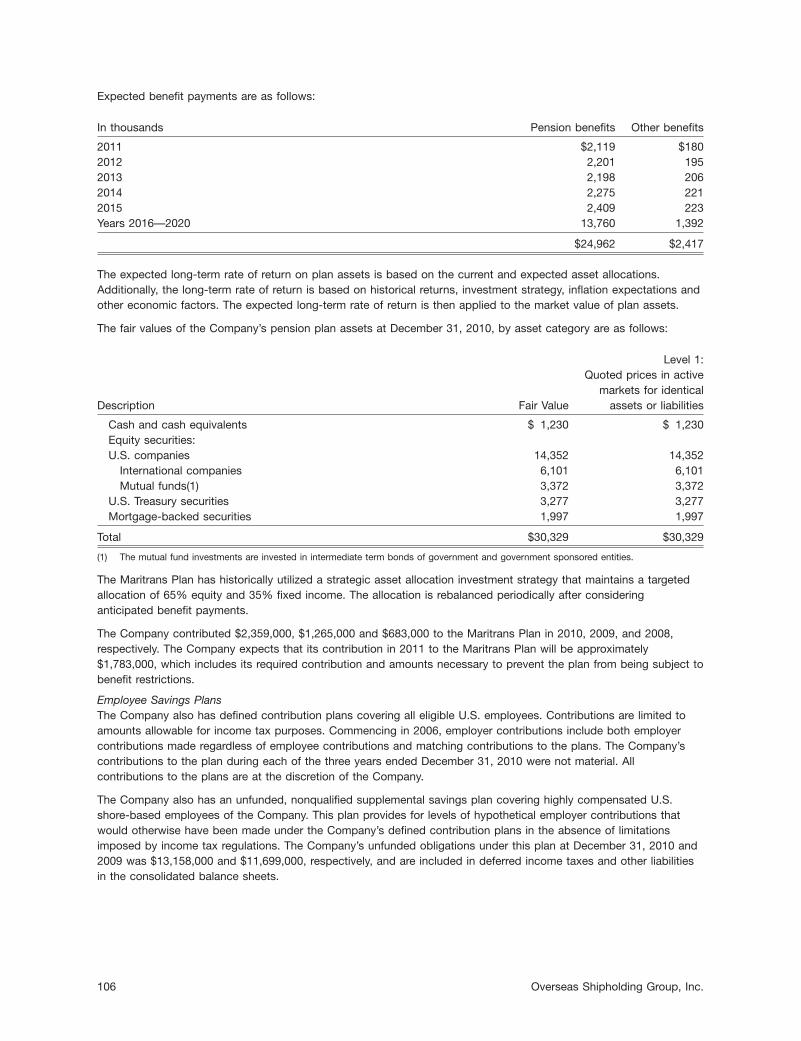
Expected benefit payments are as follows:
In thousands Pension benefits Other benefits
2011 $2,119 $1802012 2,201 1952013 2,198 2062014 2,275 2212015 2,409 223Years 2016—2020 13,760 1,392
$24,962 $2,417
The expected long-term rate of return on plan assets is based on the current and expected asset allocations.Additionally, the long-term rate of return is based on historical returns, investment strategy, inflation expectations andother economic factors. The expected long-term rate of return is then applied to the market value of plan assets.
The fair values of the Company’s pension plan assets at December 31, 2010, by asset category are as follows:
Level 1:Quoted prices in active
markets for identicalDescription Fair Value assets or liabilities
Cash and cash equivalents $ 1,230 $ 1,230Equity securities:U.S. companies 14,352 14,352
International companies 6,101 6,101Mutual funds(1) 3,372 3,372
U.S. Treasury securities 3,277 3,277Mortgage-backed securities 1,997 1,997
Total $30,329 $30,329
(1) The mutual fund investments are invested in intermediate term bonds of government and government sponsored entities.
The Maritrans Plan has historically utilized a strategic asset allocation investment strategy that maintains a targetedallocation of 65% equity and 35% fixed income. The allocation is rebalanced periodically after consideringanticipated benefit payments.
The Company contributed $2,359,000, $1,265,000 and $683,000 to the Maritrans Plan in 2010, 2009, and 2008,respectively. The Company expects that its contribution in 2011 to the Maritrans Plan will be approximately$1,783,000, which includes its required contribution and amounts necessary to prevent the plan from being subject tobenefit restrictions.
Employee Savings PlansThe Company also has defined contribution plans covering all eligible U.S. employees. Contributions are limited toamounts allowable for income tax purposes. Commencing in 2006, employer contributions include both employercontributions made regardless of employee contributions and matching contributions to the plans. The Company’scontributions to the plan during each of the three years ended December 31, 2010 were not material. Allcontributions to the plans are at the discretion of the Company.
The Company also has an unfunded, nonqualified supplemental savings plan covering highly compensated U.S.shore-based employees of the Company. This plan provides for levels of hypothetical employer contributions thatwould otherwise have been made under the Company’s defined contribution plans in the absence of limitationsimposed by income tax regulations. The Company’s unfunded obligations under this plan at December 31, 2010 and2009 was $13,158,000 and $11,699,000, respectively, and are included in deferred income taxes and other liabilitiesin the consolidated balance sheets.
106 Overseas Shipholding Group, Inc.

NOTE Q—OTHER INCOME/(EXPENSE):
Other income consists of:
In thousands for the year ended December 31, 2010 2009 2008
Investment income:Interest $1,294 $ 3,092 $ 13,087Dividends 29 31 1Losses on sale of securities and other investments and write-down of securities (753) (3,287) (1,284)
570 (164) 11,804Loss on repurchases of debt — — (6,934)Income/(loss) on derivative transactions 276 1,672 (33,774)Miscellaneous—net 201 164 57
$1,047 $ 1,672 $(28,847)
There were no sales transactions relating to available-for-sale securities during 2010. Proceeds from sales ofavailable-for-sale securities were $159,000 and $7,342,000 during the years ended December 31, 2009 and 2008,respectively. Gross realized gains on such sales that were included in income before income taxes for 2008 were$144,000. Gross realized losses on such sales were $253,000 in 2009 and $1,428,000 in 2008.
Based on a number of factors, including the magnitude of the drop in market value below the Company’s cost basisand the length of time that the decline had been sustained, management concluded that the decline in fair value ofcertain securities with an aggregate cost basis of $6,188,000 in 2009, was other-than-temporary. Accordingly, during2009, the Company recorded an impairment loss aggregating $5,151,000 in the accompanying consolidatedstatement of operations. During 2010, in accordance with the Company’s accounting policy (see Note A), theCompany recorded additional impairment losses aggregating $656,000.
NOTE R—AGREEMENTS WITH EXECUTIVE OFFICERS AND SEVERANCE AND RELOCATION COSTS:
The Company entered into an agreement effective February 1, 2009 in connection with the resignation of one of itssenior officers. The agreement provides for payments aggregating approximately $1,200,000 to be made to suchsenior officer in accordance with the Company’s amended and restated Severance Protection Plan, which waseffective December 31, 2008. The Company recognized this expense in the first quarter of 2009. In addition, in thefirst quarter of 2009, the Company completed a review of staffing requirements for its U.S. Flag business. Inconnection therewith, six employees were terminated and certain employees were relocated from the New Yorkheadquarters office to the Tampa office. In connection with such staff reductions, the Company recorded $514,000 inseverance costs and $748,000 in relocation costs in 2009.
NOTE S—RELATED PARTY TRANSACTIONS:
Effective April 1, 2008, OSG entered into time charter agreements with a subsidiary, OSG America L.P. for thecharter-out of the Liberty/M 300 and the OSG Constitution/OSG 400 at fixed daily rates. The agreement assigned thecharter contracts on these two ATBs to OSG America L.P. The terms of each of the charters ended simultaneouslywith the completion of each unit’s lightering service, which was in December 2008 for the Liberty/M 300 and wasexpected to occur in 2009 for the OSG Constitution/OSG 400. On October 10, 2008, OSG converted the time charteragreement on the OSG Constitution/OSG 400 to a bareboat charter agreement. In addition, also effective April 1,2008, the Company entered into time charter agreements with OSG America L.P. to charter-in five vessels, three ofwhich were employed by OSG America L.P. in the spot market (two ATBs, the OSG Columbia/OSG 242 and the OSGIndependence/OSG 243, and one Product Carrier, the Overseas New Orleans) and two Product Carriers (theOverseas Philadelphia and Overseas Puget Sound) upon the completion of their then current time charters in 2009.The charter-in of the Overseas Philadelphia did not start because its then current charter was extended. All five ofthese charter-in agreements were at fixed daily rates for terms commencing either on April 1, 2008 or upon the expiryof such vessel’s then current charter and ending on or about December 31, 2009. See Note C. At the time of theagreement, management believed that the fixed daily rates in the above charter-in agreements were at rates thatapproximated market rates.
2010 Annual Report 107

NOTE T—SUPPLEMENTAL SCHEDULE OF NONCASH INVESTING ACTIVITIES:
In May 2008, the Company and its joint venture partner entered into an agreement terminating a joint venture thatwas constructing two VLCCs.
Value of assets received $ 30,437,000Cost of investment in joint venture (30,437,000)
In October 2008, Euronav NV sold the TI Asia to a joint venture between the Company and Euronav NV in exchangefor cash and advances aggregating $150,000,000. The Company’s share of such advances was settled through itssale of the TI Africa to the joint venture in the first quarter of 2009.
Investment in Affiliated Companies $ 75,000,000Liability to Euronav NV (75,000,000)
In January 2009, OSG sold the TI Africa to a joint venture between the Company and Euronav NV in exchange forcash of $50,000,000 and advances of $150,000,000. Euronav’s share of such advances ($75,000,000) was settledthrough its sale of the TI Asia to the joint venture as described above.
Investment in Affiliated Companies $ 74,595,000Liability to Euronav NV 75,000,000Carrying Amount of Vessel and Deferred Drydock Expenditures (96,252,000)Gain on Disposal of Vessel (53,343,000)
NOTE U—2010 AND 2009 QUARTERLY RESULTS OF OPERATIONS (UNAUDITED):
Results of Operations for Quarter Ended(in thousands, except per share amounts) March 31, June 30, Sept. 30, Dec. 31,
2010Shipping revenues $269,754 $283,903 $259,928 $232,025Loss/(gain) on disposal of vessels, net of impairments 2,256 25,295 1,722 (615)Income/(loss) from vessel operations 4,393 (17,221) (15,521) (50,946)Net loss (9,353) (37,857) (31,754) (55,279)Net loss attributable to Overseas Shipholding Group, Inc. (9,353) (37,857) (31,754) (55,279)
Basic net loss per share $(0.34) $(1.26) $(1.06) $(1.83)Diluted net loss per share $(0.34) $(1.26) $(1.06) $(1.83)
2009Shipping revenues $324,804 $282,656 $243,576 $242,582Gain/(loss) on disposal of vessels, net of impairments 129,863 (2,568) 830 (639)Income/(loss) from vessel operations 128,545 799 (16,199) (36,015)Net income/(loss) 123,262 (7,821) (21,929) (22,365)Net income/(loss) attributable to Overseas Shipholding Group, Inc. 121,750 (8,794) (19,624) (23,162)
Basic net income/(loss) per share $4.53 $(0.33) $(0.73) $(0.86)Diluted net income/(loss) per share $4.53 $(0.33) $(0.73) $(0.86)
NOTE V—CONTINGENCIES:
The Internal Revenue Service (‘‘IRS’’) has proposed the imposition of penalties totaling approximately $3,500,000against certain U.S. Flag vessel owning subsidiaries of the Company due to alleged delinquent excise tax registrationapplications and delinquent filing of information returns. The Company has denied the applicability of the penalties inquestion, and is vigorously contesting the matter with the IRS. As a result of certain administrative protocols, theCompany expects it will have to pay all or a portion of the assessed penalties in order to formally file suit for arefund. The Company believes, based on the merits of the case, that the likelihood of an unfavorable judgment ismore than remote but less than probable. Accordingly, no provisions have been made in the Company’s financialstatements for a potential loss as of December 31, 2010 as the Company does not believe there is any one amountwithin the range of likely losses (from nil to $3,500,000) that is a better estimate than another.
108 Overseas Shipholding Group, Inc.
REPORT OF INDEPENDENT REGISTERED PUBLIC ACCOUNTING FIRM
To the Board of Directors and Shareholders ofOverseas Shipholding Group, Inc.:
In our opinion, the accompanying consolidated balance sheets and the related consolidated statements ofoperations, cash flows, and changes in equity present fairly, in all material respects, the financial position of OverseasShipholding Group, Inc. and its subsidiaries at December 31, 2010 and December 31, 2009, and the results of theiroperations and their cash flows for each of the two years in the period ended December 31, 2010 in conformity withaccounting principles generally accepted in the United States of America. Also in our opinion, the Companymaintained, in all material respects, effective internal control over financial reporting as of December 31, 2010, basedon criteria established in Internal Control—Integrated Framework issued by the Committee of SponsoringOrganizations of the Treadway Commission (COSO). The Company’s management is responsible for these financialstatements, for maintaining effective internal control over financial reporting and for its assessment of theeffectiveness of internal control over financial reporting, included in the accompanying Management’s Report onInternal Control over Financial Reporting. Our responsibility is to express opinions on these financial statements andon the Company’s internal control over financial reporting based on our integrated audits. We conducted our audits inaccordance with the standards of the Public Company Accounting Oversight Board (United States). Those standardsrequire that we plan and perform the audits to obtain reasonable assurance about whether the financial statementsare free of material misstatement and whether effective internal control over financial reporting was maintained in allmaterial respects. Our audits of the financial statements included examining, on a test basis, evidence supporting theamounts and disclosures in the financial statements, assessing the accounting principles used and significantestimates made by management, and evaluating the overall financial statement presentation. Our audit of internalcontrol over financial reporting included obtaining an understanding of internal control over financial reporting,assessing the risk that a material weakness exists, and testing and evaluating the design and operating effectivenessof internal control based on the assessed risk. Our audits also included performing such other procedures as weconsidered necessary in the circumstances. We believe that our audits provide a reasonable basis for our opinions.
A company’s internal control over financial reporting is a process designed to provide reasonable assuranceregarding the reliability of financial reporting and the preparation of financial statements for external purposes inaccordance with generally accepted accounting principles. A company’s internal control over financial reportingincludes those policies and procedures that (i) pertain to the maintenance of records that, in reasonable detail,accurately and fairly reflect the transactions and dispositions of the assets of the company; (ii) provide reasonableassurance that transactions are recorded as necessary to permit preparation of financial statements in accordancewith generally accepted accounting principles, and that receipts and expenditures of the company are being madeonly in accordance with authorizations of management and directors of the company; and (iii) provide reasonableassurance regarding prevention or timely detection of unauthorized acquisition, use, or disposition of the company’sassets that could have a material effect on the financial statements.
Because of its inherent limitations, internal control over financial reporting may not prevent or detect misstatements.Also, projections of any evaluation of effectiveness to future periods are subject to the risk that controls may becomeinadequate because of changes in conditions, or that the degree of compliance with the policies or procedures maydeteriorate.
PricewaterhouseCoopers LLP /s/
New York, New YorkMarch 1, 2011
2010 Annual Report 109

REPORT OF INDEPENDENT REGISTERED PUBLIC ACCOUNTING FIRM
To the StockholdersOverseas Shipholding Group, Inc.
We have audited the accompanying consolidated statements of operations, cash flows, and changes in equity ofOverseas Shipholding Group, Inc. and subsidiaries for the year ended December 31, 2008. These financialstatements are the responsibility of the Company’s management. Our responsibility is to express an opinion on thesefinancial statements based on our audit.
We conducted our audit in accordance with the standards of the Public Company Accounting Oversight Board(United States). Those standards require that we plan and perform the audit to obtain reasonable assurance aboutwhether the financial statements are free of material misstatement. An audit includes examining, on a test basis,evidence supporting the amounts and disclosures in the financial statements. An audit also includes assessing theaccounting principles used and significant estimates made by management, as well as evaluating the overall financialstatement presentation. We believe that our audit provides a reasonable basis for our opinion.
In our opinion, the financial statements referred to above present fairly, in all material respects, the consolidatedresults of the operations, cash flows, and changes in equity of Overseas Shipholding Group, Inc. and subsidiaries forthe year ended December 31, 2008, in conformity with U.S. generally accepted accounting principles.
/s/ Ernst & Young
New York, New YorkFebruary 26, 2009
110 Overseas Shipholding Group, Inc.

MANAGEMENT’S REPORT ON INTERNAL CONTROLSOVER FINANCIAL REPORTING
To the StockholdersOverseas Shipholding Group, Inc.
In accordance with Rule 13a-15(f) of the Securities Exchange Act of 1934, the management of Overseas ShipholdingGroup, Inc. and its subsidiaries (the ‘‘Company’’) is responsible for the establishment and maintenance of adequateinternal controls over financial reporting for the Company. Internal control over financial reporting is a processdesigned to provide reasonable assurance regarding the reliability of financial reporting and the preparation offinancial statements for external purposes in accordance with generally accepted accounting principles. TheCompany’s system of internal control over financial reporting includes those policies and procedures that (i) pertain tothe maintenance of records that, in reasonable detail, accurately and fairly reflect the transactions and dispositions ofthe assets of the Company; (ii) provide reasonable assurance that transactions are recorded as necessary to permitpreparation of financial statements in accordance with generally accepted accounting principles, and that receiptsand expenditures of the Company are being made only in accordance with authorizations of management anddirectors of the Company; and (iii) provide reasonable assurance regarding prevention or timely detection ofunauthorized acquisition, use, or disposition of the Company’s assets that could have a material effect on thefinancial statements. Management has performed an assessment of the effectiveness of the Company’s internalcontrols over financial reporting as of December 31, 2010 based on the provisions of Internal Control—IntegratedFramework issued by the Committee of Sponsoring Organizations of the Treadway Commission (‘‘COSO’’). Based onour assessment, management determined that the Company’s internal controls over financial reporting was effectiveas of December 31, 2010 based on the criteria in Internal Control—Integrated Framework issued by COSO.
PricewaterhouseCoopers LLP, the Company’s independent registered public accounting firm, who audited the 2010financial statements included in the Annual Report, has audited and reported on the effectiveness of the Company’sinternal controls over financial reporting as of December 31, 2010 as stated in their report which appears elsewherein this Annual Report.
February 25, 2011
OVERSEAS SHIPHOLDING GROUP, INC.
By: /s/ MORTEN ARNTZEN
Morten ArntzenPresident,
Chief Executive Officer
By: /s/ MYLES R. ITKIN
Myles R. ItkinExecutive Vice President,
Chief Financial Officer and Treasurer
2010 Annual Report 111

ITEM 9. CHANGES IN AND DISAGREEMENTS WITH ACCOUNTANTS ON ACCOUNTING AND FINANCIALDISCLOSURE
None.
ITEM 9A. CONTROLS AND PROCEDURES
(a) Evaluation of disclosure controls and procedures.
As of the end of the period covered by this Annual Report on Form 10-K, an evaluation was performed under thesupervision and with the participation of the Company’s management, including the Chief Executive Officer (‘‘CEO’’)and Chief Financial Officer (‘‘CFO’’), of the effectiveness of the design and operation of the Company’s disclosurecontrols and procedures pursuant to Rules 13a-15(e) and 15d-15(e) under the Securities Exchange Act of 1934 (the‘‘Exchange Act’’). Based on that evaluation, the Company’s management, including the CEO and CFO, concludedthat the Company’s current disclosure controls and procedures are effective to ensure that information required to bedisclosed by the Company in the reports the Company files or submits under the Exchange Act is (i) recorded,processed, summarized and reported, within the time periods specified in the Securities and Exchange Commission’srules and forms and (ii) accumulated and communicated to the Company’s management, including the CEO andCFO, as appropriate to allow timely decisions regarding required disclosure. There have been no changes in theCompany’s internal controls over financial reporting during the quarter ended December 31, 2010 that have materiallyaffected, or are reasonably likely to materially affect, the Company’s internal control over financial reporting
(b) Management’s report on internal controls over financial reporting.
Management’s report on internal controls over financial reporting, which appears elsewhere in this Annual Report, isincorporated herein by reference.
ITEM 9B. OTHER INFORMATION
None.
112 Overseas Shipholding Group, Inc.

PART III
ITEM 10. DIRECTORS, EXECUTIVE OFFICERS AND CORPORATE GOVERNANCE
See Item 14 below. Information with respect to executive officers of the Company is included at the end of Part I.The Company has adopted a code of ethics that applies to all of its directors, officers (including its principalexecutive officer, principal financial officer, principal accounting officer, controller and any person performing similarfunctions) and employees. The Company makes its code of ethics available free of charge through its internetwebsite, www.osg.com.
ITEM 11. EXECUTIVE COMPENSATION
See Item 14 below.
ITEM 12. SECURITY OWNERSHIP OF CERTAIN BENEFICIAL OWNERS AND MANAGEMENT AND RELATEDSTOCKHOLDER MATTERS
The following table provides information as of December 31, 2010 with respect to the Company’s equity (stock)compensation plans, all of which have been approved by the Company’s shareholders:
Number of securitiesremaining available forfuture issuance under
Number of securities to Weighted-average equity compensationbe issued upon exercise exercise price of plans (excludingof outstanding options, outstanding options, securities reflected in
warrants and rights warrants and rights column (a))Plan Category (a) (b) (c)
Equity compensation plansapproved by security holders 1,543,206 $50.75 3,068,631*
* Consists of 3,029,602 shares eligible to be granted under the Company’s 2004 stock incentive plan and 39,029 shares eligible to bepurchased pursuant to the Company’s 2000 Employee Stock Purchase Plan.
See also Item 14 below.
ITEM 13. CERTAIN RELATIONSHIPS AND RELATED TRANSACTIONS, AND DIRECTOR INDEPENDENCE
See Item 14 below.
ITEM 14. PRINCIPAL ACCOUNTANT FEES AND SERVICES
Except for the table in Item 12 above, the information called for under Items 10, 11, 12, 13 and 14 is incorporated byreference from the definitive Proxy Statement to be filed by the Company in connection with its 2011Annual Meetingof Stockholders.
2010 Annual Report 113
PART IV
ITEM 15. EXHIBITS, FINANCIAL STATEMENT SCHEDULES
The following consolidated financial statements of the Company are filed in response to Item 8.(a)(1)
Consolidated Balance Sheets at December 31, 2010 and 2009.
Consolidated Statements of Operations for the Years Ended December 31, 2010, 2009 and 2008.
Consolidated Statements of Cash Flows for the Years Ended December 31, 2010, 2009 and 2008.
Consolidated Statements of Changes in Equity for the Years Ended December 31, 2010, 2009 and2008.
Notes to Consolidated Financial Statements.
Reports of Independent Registered Public Accounting Firms.
(a)(2) Schedules of the Company have been omitted since they are not applicable or are not required.
(a)(3) The following exhibits are included in response to Item 15(c):
3(i) Certificate of Incorporation of the Registrant, as amended to date (filed as Exhibit 3(i) to theRegistrant’s Quarterly Report on Form 10-Q for quarter ended June 30, 2006 and incorporated hereinby reference).
3(ii) Amended and Restated Bylaws of the Registrant (filed as Exhibit 3.1 to the Registrant’s Current Reporton Form 8-K dated April 12, 2006 and incorporated herein by reference).
4(a)(1) Form of Indenture dated as of December 1, 1993 between the Registrant and The Chase ManhattanBank (National Association) providing for the issuance of debt securities by the Registrant from time totime (filed as Exhibit 4(b)(1) to the Registrant’s Quarterly Report on Form 10-Q for the quarter endedMarch 31, 2004 and incorporated herein by reference).
4(a)(2) Resolutions dated December 2, 1993 fixing the terms of two series of debt securities issued by theRegistrant under the Indenture (filed as Exhibit 4(b)(2) to the Registrant’s Quarterly Report onForm 10-Q for the quarter ended March 31, 2004 and incorporated herein by reference).
4(a)(3) Form of 83⁄4% Debentures due December 1, 2013 of the Registrant (filed as Exhibit 4(b)(3) to theRegistrant’s Quarterly Report on Form 10-Q for the quarter ended March 31, 2004 and incorporatedherein by reference).
4(b)(1) Indenture dated as of March 7, 2003 between the Registrant and Wilmington Trust Company, astrustee, providing for the issuance of debt securities of the Registrant from time to time (filed asExhibit 4(e)(1) to the Registrant’s Registration Statement on Form S-4 filed May 5, 2003 andincorporated herein by reference). Such Indenture is hereby modified, effective as of January 13, 2004,by deleting all references therein to ‘‘Wilmington Trust Company’’, ‘‘March 7, 2003’’ and any specificday, month and/or year and substituting therefore blank spaces.
4(b)(2) Form of Debt Security of the Registrant (filed as Exhibit 4.4 to the Registrant’s Registration Statementon Form S-3 filed January 13, 2004 and incorporated herein by reference).
4(c)(1) Indenture dated as of March 29, 2010, between the Registrant and the Bank of New York Mellon, astrustee, providing for the issuance of debt securities of the Registrant from time to time (filed asExhibit 4.1 to the Registrant’s Current Report on Form 8-K dated March 29, 2010 and incorporatedherein by reference).
4(c)(2) Form of 81⁄8% Senior Notes due 2018 of the Registrant (filed as Exhibit 4.2 to the Registrant’s CurrentReport on Form 8-K dated March 29, 2010 and incorporated herein by reference).
114 Overseas Shipholding Group, Inc.

4(d)(1) Credit Agreement dated as February 9, 2006, among the Registrant, OSG Bulk Ships, Inc., OSGInternational, Inc., various lenders, DnB NOR Bank ASA, New York Branch (‘‘DnB’’), as administrativeagent, HSBC Securities (USA) Inc. (‘‘HSBC’’), as documentation agent, Citigroup Global MarketsLimited (‘‘Citigroup’’) and Nordea Bank Finland, Plc, New York branch (‘‘Nordea’’), as bookrunners, andCitigroup, DnB, HSBC and Nordea as lead arrangers (filed as Exhibit 4(e)(6) to the Registrant’s AnnualReport on Form 10-K for 2005 and incorporated herein by reference).
4(d)(2) Second Pooled Assignment and Amendment dated as of May 10, 2006 (filed as Exhibit 4.1 to theRegistrant’s Current Report on Form 8-K dated May 10, 2006 and incorporated herein by reference).
NOTE: The Exhibits filed herewith do not include other instruments authorizing long-term debt of theRegistrant and its subsidiaries, where the amounts authorized thereunder do not exceed 10% of totalassets of the Registrant and its subsidiaries on a consolidated basis. The Registrant agrees to furnish acopy of each such instrument to the Commission upon request.
10(i)(a) Exchange Agreement dated December 9, 1969 (including exhibits thereto) between the Registrant andvarious parties relating to the formation of the Registrant (the form of which was filed as Exhibit 2(3) toRegistration Statement No. 2-34124 and incorporated herein by reference).
10(i)(b) Form of Additional Exchange Agreement referred to in Section 2.02 of Exhibit 10(i)(a) hereto (filed asExhibit 2(4) to Registration Statement No. 2-34124 and incorporated herein by reference).
10(i)(c) Time Charter Party relating to the Overseas Ann dated October 6, 2005 between DHT Ann VLCC Corp.and Ann Tanker Corporation (filed as Exhibit 10.3.1 to Double Hull Tankers, Inc.’s RegistrationStatement on Form F-1 (Registration No. 333-128460) and incorporated herein by reference), asamended by Amendment No. 1 dated January 15, 2009 (filed as Exhibit 10(i)(c) to the Registrant’sAnnual Report on Form 10-K for 2008 and incorporated herein by reference).
10(i)(d) Time Charter Party relating to the Overseas Chris dated October 6, 2005 between DHT Chris VLCCCorp. and Chris Tanker Corporation (filed as Exhibit 10.3.2 to Double Hull Tankers, Inc.’s RegistrationStatement on Form F-1 (Registration No. 333-128460) and incorporated herein by reference, asamended by Amendment No. 1 dated January 15, 2009 (filed as Exhibit 10(i)(d) to the Registrant’sAnnual Report on Form 10-K for 2008 and incorporated herein by reference).
10(i)(e) Time Charter Party relating to the Regal Unity dated October 6, 2005 between DHT Regal Unity VLCCCorp. and Regal Unity Tanker Corporation (filed as Exhibit 10.3.3 to Double Hull Tankers, Inc.’sRegistration Statement on Form F-1 (Registration No. 333-128460) and incorporated herein byreference), as amended by Amendment No. 1 dated January 15, 2009 (filed as Exhibit 10(i)(e) to theRegistrant’s Annual Report on Form 10-K for 2008 and incorporated herein by reference).
10(i)(f) Time Charter Party relating to the Overseas Cathy dated October 6, 2005 between DHT Cathy AframaxCorp. and Cathy Tanker Corporation (filed as Exhibit 10.3.4 to Double Hull Tankers, Inc.’s RegistrationStatement on Form F-1 (Registration No. 333-128460) and incorporated herein by reference), asamended by Amendment No. 1 dated January 15, 2009 (filed as Exhibit 10(i)(f) to the Registrant’sAnnual Report on Form 10-K for 2008 and incorporated herein by reference).
10(i)(g) Time Charter Party relating to the Overseas Sophie dated October 6, 2005 between DHT SophieAframax Corp. and Sophie Tanker Corporation (filed as Exhibit 10.3.5 to Double Hull Tankers, Inc.’sRegistration Statement on Form F-1 (Registration No. 333-128460) and incorporated herein byreference), as amended by Amendment No. 1 dated January 15, 2009 (filed as Exhibit 10(i)(g) to theRegistrant’s Annual Report on Form 10-K for 2008 and incorporated herein by reference).
10(i)(h) Time Charter Party relating to the Rebecca dated October 6, 2005 between Rebecca Aframax Corp.and Rebecca Tanker Corporation (filed as Exhibit 10.3.6 to Double Hull Tankers, Inc.’s RegistrationStatement on Form F-1 (Registration No. 333-128460) and incorporated herein by reference), asamended by Amendment No. 1 dated January 15, 2009 (filed as Exhibit 10(i)(h) to the Registrant’sAnnual Report on Form 10-K for 2008 and incorporated herein by reference).
2010 Annual Report 115

10(i)(i) Time Charter Party relating to the Ania dated October 6, 2005 between DHT Ania Aframax Corp. andAnia Aframax Corporation (filed as Exhibit 10.3.7 to Double Hull Tankers, Inc.’s Registration Statementon Form F-1 (Registration No. 333-128460) and incorporated herein by reference), as amended byAmendment No. 1 dated January 15, 2009 (filed as Exhibit 10(i)(i) to the Registrant’s Annual Report onForm 10-K for 2008 and incorporated herein by reference).
10(i)(j) Charter Framework Agreement dated October 6, 2005 between Double Hull Tankers, Inc., OSGInternational, Inc. and each of the Owners and Charterers named therein (filed as Exhibit 10.5 toDouble Hull Tankers, Inc.’s Registration Statement on Form F-1 (Registration No. 333-128460) andincorporated herein by reference).
*10(iii)(a) Supplemental Executive Savings Plan of the Registrant dated as of December 22, 2005, as amendedby Amendment One effective as of January 1, 2006 (filed as Exhibit 10(iii)(a) to the Registrant’s AnnualReport on Form 10-K for 2008 and incorporated herein by reference).
*10(iii)(b) 1998 Stock Option Plan adopted for employees of the Registrant and its affiliates (filed as Exhibit 10 tothe Registrant’s Quarterly Report on Form 10-Q for the quarter ended March 31, 1998 andincorporated herein by reference).
*10(iii)(c) Amendment to the 1998 Stock Option Plan adopted for employees of the Registrant and its affiliates(filed as Exhibit 10 to the Registrant’s Quarterly Report on Form 10-Q for the quarter ended June 30,2000 and incorporated herein by reference).
*10(iii)(d) 1999 Non-Employee Director Stock Option Plan of the Registrant (filed as Exhibit 10(e)(4) to theregistrant’s Annual Report on Form 10-K for 1998 and incorporated herein by reference), as amendedby Amendment No. 1 dated May 31, 2004 (filed as Exhibit 10 to the Registrant’s Quarterly Report onForm 10-Q for the quarter ended June 30, 2004 and incorporated herein by reference).
*10(iii)(e) Agreement dated January 19, 2004 with an executive officer (filed as Exhibit 10(iii)(v) to the Registrant’sAnnual Report on Form 10-K for 2003 and incorporated herein by reference), as amended by (i) a letteragreement dated February 15, 2007 (filed as Exhibit 10.1 to the Registrant’s Current Report onForm 8-K dated February 15, 2007 and incorporated herein by reference), (ii) a letter agreement datedFebruary 15, 2007 (filed as Exhibit 10.2 to the Registrant’s Current Report on Form 8-K datedFebruary 15, 2007 and incorporated herein by reference) and (iii) a letter agreement datedDecember 31, 2008 (filed as Exhibit 10.1 to the Registrant’s Current Report on Form 8-K datedDecember 31, 2008 and incorporated herein by reference).
*10(iii)(f) Amended and Restated Change of Control Agreement dated as of December 31, 2008 with anexecutive officer (filed as Exhibit 10.3 to the Registrant’s Current Report on Form 8-K datedDecember 31, 2008 and incorporated herein by reference).
*10(iii)(g) Form of Director and Officer Indemnity Agreement for the directors and officers of the Registrant (filedas Exhibit 10 to the Registrant’s Quarterly Report on Form 10-Q for the quarter ended March 31, 2004and incorporated herein by reference).
*10(iii)(h) 2004 Stock Incentive Plan of the Registrant as amended and restated as of June 2, 2010 (filed onApril 30, 2010 as Appendix A to the Registrant’s Proxy Statement on Schedule 14A and incorporatedherein by reference).
*10(iii)(i) Form of Amended and Restated Change of Control Protection Agreement dated as of December 31,2008 with each of three executive officers (filed as Exhibit 10.4 to the Registrant’s Current Report onForm 8-K dated December 31, 2008 and incorporated herein by reference).
*10(iii)(j) Form of Amended and Restated Change of Control Agreement dated as of December 31, 2008 with anexecutive officer (filed as Exhibit 10.3 to the Registrant’s Quarterly Report on Form 10-Q for the quarterended March 31, 2010 and incorporated herein by reference), as amended by a Letter Agreementdated as of May 24, 2010 between the Registrant and the executive officer (filed as Exhibit 10.1 to theRegistrant’s Current Report on Form 8-K dated July 26, 2010 and incorporated herein by reference).
*10(iii)(k) Severance Protection Plan of the Registrant effective January 1, 2006 as amended and restated as ofDecember 31, 2008 (filed as Exhibit 10.5 to the Registrant’s Current Report on Form 8-K datedDecember 31, 2008 and incorporated herein by reference).
116 Overseas Shipholding Group, Inc.

*10(iii)(l) Notice of Eligibility effective as of January 27, 2006 in favor of an executive officer (filed as Exhibit 10.2to the Registrant’s Current Report on Form 8-K dated January 27, 2006 and incorporated herein byreference).
*10(iii)(m) Notice of Eligibility effective as of January 27, 2006 in favor of an executive officer (filed as Exhibit 10.3to the Registrant’s Current Report on Form 8-K dated January 27, 2006 and incorporated herein byreference).
*10(iii)(n) Notice of Eligibility effective as of January 30, 2006 in favor of an executive officer (filed asExhibit 10(iii)(x) to the Registrant’s Annual Report on Form 10-K for 2007 and incorporated herein byreference).
*10(iii)(o) Notice of Eligibility effective as of May 24, 2010 in favor of an executive officer (filed as Exhibit 10.2 tothe Registrant’s Current Report on Form 8-K dated July 26, 2010 and incorporated herein byreference).
*10(iii)(p) Form of Restricted Stock Award (filed as Exhibit 10.1 to the Registrant’s Current Report on Form 8-Kdated January 17, 2007 and incorporated herein by reference).
*10(iii)(q) Form of Qualified Stock Option Agreement (filed as Exhibit 10.2 to the Registrant’s Current Report onForm 8-K dated January 17, 2007 and incorporated herein by reference).
*10(iii)(r) Restricted Stock Award dated as of February 15, 2007 between Registrant and an executive officer(filed as Exhibit 10.3 to the Registrant’s Current Report on Form 8-K dated February 15, 2007 andincorporated herein by reference).
*10(iii)(s) Nonqualified Stock Option Agreement dated as of February 15, 2007 between Registrant and anexecutive officer (filed as Exhibit 10.4 to the Registrant’s Current Report on Form 8-K datedFebruary 15, 2007 and incorporated herein by reference).
*10(iii)(t) Restricted Stock Unit Award dated as of February 15, 2007 between Registrant and an executiveofficer (filed as Exhibit 10.5 to the Registrant’s Current Report on Form 8-K dated February 15, 2007and incorporated herein by reference), as amended by a letter agreement dated December 31, 2008(filed as Exhibit 10.2 to the Registrant’s Current Report on Form 8-K dated December 31, 2008 andincorporated herein by reference).
*10(iii)(u) Nonqualified Stock Option Agreement dated as of February 15, 2007 between Registrant and anexecutive officer (filed as Exhibit 10.6 to the Registrant’s Current Report on Form 8-K datedFebruary 15, 2007 and incorporated herein by reference).
*10(iii)(v) Form of Restricted Stock Unit (filed as Exhibit 10.1 to the Registrant’s Current Report on Form 8-Kdated June 5, 2007 and incorporated herein by reference).
*10(iii)(w) Agreement dated June 29, 2005 with an executive officer (filed as Exhibit 10 to the Registrant’s CurrentReport on Form 8-K dated July 6, 2005 and incorporated herein by reference).
*10(iii)(x) Agreement dated September 11, 2006 with an executive officer (filed as Exhibit 10.2 to the Registrant’sQuarterly Report on Form 10-Q for the quarter ended March 31, 2010 and incorporated herein byreference).
*10(iii)(y) Enhanced Severance Plan for Employees Level 21-23 effective as of January 1, 2009 (filed asExhibit 10(iii)(z) to the Registrant’s Annual Report on Form 10-K for 2008 and incorporated herein byreference).
*10(iii)(z) Executive Performance Incentive Plan dated June 1, 2004 (filed on April 28, 2004 as Appendix B to theRegistrant’s Proxy Statement on Schedule 14A and incorporated herein by reference), as amended byAmendment No. 1 dated as of June 10, 2008 (filed as Exhibit 99 to the Registrant’s Current Report onForm 8-K dated June 10, 2008 and incorporated herein by reference).
10(iii)(aa) Stock Ownership Guidelines for Senior Management Employees Level 21 and Above (filed asExhibit 99.1 to the Registrant’s Current Report on Form 8-K dated January 19, 2010 and incorporatedherein by reference).
2010 Annual Report 117
10(iii)(bb) Incentive Compensation Recoupment Policy for Executive Officers (filed as Exhibit 99.2 to theRegistrant’s Current Report on Form 8-K dated January 19, 2010 and incorporated herein byreference).
10(iii)(cc) Form of Performance Award (filed as Exhibit 10.1 to the Registrant’s Current Report on Form 8-K datedFebruary 23, 2010 and incorporated herein by reference).
**21 List of subsidiaries of the Registrant.
**23.1 Consent of Independent Registered Public Accounting Firm of the Registrant.
**23.2 Consent of Independent Registered Public Accounting Firm of the Registrant.
**31.1 Certification of Chief Executive Officer pursuant to Rule 13a-14(a) and 15d-14(a), as amended.
**31.2 Certification of Chief Financial Officer pursuant to Rule 13a-14(a) and 15d-14(a), as amended.
**32 Certification of Chief Executive Officer and Chief Financial Officer pursuant to 18 U.S.C. Section 1350,as adopted pursuant to Section 906 of the Sarbanes-Oxley Act of 2002.
(1) The Exhibits marked with one asterisk (*) are a management contract or a compensatory plan or arrangement required to be filed as anexhibit.
(2) The Exhibits which have not previously been filed or listed are marked with two asterisks (**).
118 Overseas Shipholding Group, Inc.

SIGNATURES
Pursuant to the requirements of Section 13 or 15(d) of the Securities Exchange Act of 1934, the Registrant has dulycaused this report to be signed on its behalf by the undersigned, thereunto duly authorized.
Date: February 25, 2011
OVERSEAS SHIPHOLDING GROUP, INC.
By: /s/ MYLES R. ITKIN
Myles R. ItkinExecutive Vice President,
Chief Financial Officer and Treasurer
Pursuant to the requirements of the Securities Exchange Act of 1934, this report has been signed below by thefollowing persons on behalf of the Registrant and in the capacities and on the dates indicated. Each of such personsappoints Morten Arntzen and Myles R. Itkin, and each of them, as his agents and attorneys-in-fact, in his name,place and stead in all capacities, to sign and file with the SEC any amendments to this report and any exhibits andother documents in connection therewith, hereby ratifying and confirming all that such attorneys-in-fact or either ofthem may lawfully do or cause to be done by virtue of this power of attorney.
Name Date
/s/ MORTEN ARNTZEN February 25, 2011
Morten Arntzen, PrincipalExecutive Officer and Director
/s/ MYLES R. ITKIN February 25, 2011
Myles R. Itkin, PrincipalFinancial Officer and
Principal Accounting Officer
/s/ G. ALLEN ANDREAS, III February 25, 2011
G. Allen Andreas, III, Director
/s/ ALAN R. BATKIN
Alan R. Batkin, Director
/s/ THOMAS B. COLEMAN February 25, 2011
Thomas B. Coleman, Director
/s/ CHARLES A. FRIBOURG February 25, 2011
Charles A. Fribourg, Director
/s/ STANLEY KOMAROFF February 25, 2011
Stanley Komaroff, Director
2010 Annual Report 119
Name Date
/s/ SOLOMON N. MERKIN February 25, 2011
Solomon N. Merkin, Director
/s/ JOEL I. PICKET February 25, 2011
Joel I. Picket, Director
/s/ ARIEL RECANATI February 25, 2011
Ariel Recanati, Director
/s/ OUDI RECANATI February 25, 2011
Oudi Recanati, Director
/s/ THOMAS F. ROBARDS February 25, 2011
Thomas F. Robards, Director
/s/ JEAN-PAUL VETTIER February 25, 2011
Jean-Paul Vettier, Director
/s/ MICHAEL J. ZIMMERMAN February 25, 2011
Michael J. Zimmerman, Director
120 Overseas Shipholding Group, Inc.

New York Stock Exchange Certification Disclosure
On June 16, 2010, Overseas Shipholding Group, Inc. (the ‘‘Company’’) submitted to the New York Stock Exchange(‘‘NYSE’’) the certification of its Chief Executive Officer required by Section 303A.12(a) of the NYSE Listed CompanyManual that he was not aware of any violation of the NYSE’s Corporate Governance listing standards.
The Company filed with the Securities and Exchange Commission the certifications of its Chief Executive Officer andits Chief Financial Officer required under Section 302 of the Sarbanes-Oxley Act of 2002 as exhibits to its AnnualReport on Form 10-K for 2010.
2010 Annual Report 121
Transfer Agent, Registrar for Stock and Dividend Disbursing AgentBNY Mellon Shareholder Services480 Washington BoulevardJersey City, NJ 07310+1.800.851.9677+1.201.680.6578
Independent Registered Public Accounting FirmPriceWaterhouseCoopers300 Madison AvenueNew York, NY 10017+1.646.471.3000
CounselProskauer Rose LLP1585 BroadwayNew York, NY 10036+1.212.969.3000
Investor RelationsJohn F. Collins, Jr.Vice President, Investor RelationsOSG Ship Management, Inc.666 Third AvenueNew York, NY [email protected]
www.osg.com

(This page has been left blank intentionally.)