overexpression of glyoxalase-i reduces hyperglycemia ... file1 overexpression of glyoxalase-i...
TRANSCRIPT
1
Overexpression of Glyoxalase-I Reduces Hyperglycemia–induced Levels of Advanced GlycationEndproducts and Oxidative Stress in Diabetic Rats
Olaf Brouwersa, Petra M. Niessena, Isabel Ferreiraa, Toshio Miyatab, Peter G. Schefferc, TomTeerlinkc, Patrick Schrauwend, Michael Brownleee, Coen D. Stehouwera, Casper G. Schalkwijka.
aDepartment of Internal Medicine, Division of General Internal Medicine, Laboratory for Metabolism andVascular Medicine, Maastricht University, Maastricht, the Netherlands.
bCentre of Translational and Advanced Research, Tohoku University, Sendai, Japan.cDepartment of Clinical Chemistry, VU University Medical Center, Amsterdam, the Netherlands.
dDepartment of Human Biology, Maastricht University Medical Center, Maastricht, the Netherlands.eInternational Center for Diabetic Complications Research, Albert Einstein College of Medicine, New
York, USA.Running title: GLO-I overexpression in diabetic rats
Corresponding author:Casper G. Schalkwijk
Department of Internal MedicineUniversity Hospital Maastricht
P. Debyelaan 25, P.O. Box 5800, 6202 AZ Maastricht,The Netherlands.
Telephone: +31 43 3882186Fax: +31 43 3875006
Email: [email protected]
The reactive advanced glycation endproduct(AGE) precursor methylglyoxal (MGO) andMGO-derived AGEs are associated withdiabetic vascular complications and also withan increase in oxidative stress. Glyoxalase-I(GLO-I) transgenic rats were used to explorewhether overexpression of this MGOdetoxifying enzyme reduces levels of AGEs andoxidative stress in a rat model of diabetes.Rats were made diabetic with streptozotocinand after 12 weeks, plasma and multiple tissueswere isolated for analysis of AGEs, carbonylstress and oxidative stress. GLO-I activity wassignificantly elevated in multiple tissues of alltransgenic rats compared with wild type (WT)littermates. Streptozotocin treatment resultedin a fivefold increase in blood glucoseconcentrations irrespective of GLO-Ioverexpression. Levels of MGO, glyoxal (GO),3-deoxyglucosone, AGEs and oxidative stressmarkers nitrotyrosine, malondialdehyde andF2-isoprostane were elevated in the diabeticWT rats. In diabetic GLO-I rats, GO and MGOcomposite scores were significantly decreasedby 81%, and plasma AGEs and oxidative stressmarkers scores by approximately 50%.
Hyperglycemia induced a decrease in proteinlevels of the mitochondrial oxidativephosphorylation complex in the gastrocnemiusmuscle, which was accompanied by an increasein the lipid peroxidation product 4-hydroxy-2-nonenal, and this was counteracted by GLO-Ioverexpression.This study shows for the first time, in an in vivomodel of diabetes, that GLO-I overexpressionreduces hyperglycemia-induced levels ofcarbonyl stress, AGEs and oxidative stress. Thereduction of oxidative stress by GLO-Ioverexpression directly demonstrates the linkbetween glycation and oxidative stress.
Prolonged exposure to hyperglycemia hasdetrimental effects on various cellular functionsand is believed to be the most important factor inthe development of vascular complications indiabetes. One of the hypotheses about howhyperglycemia leads to complications is theformation of advanced glycation endproducts(AGEs) (1). In addition to the formation of AGEsby the classical Maillard reaction (2,3),dicarbonyls such as methylglyoxal (MGO),glyoxal (GO) and 3-deoxyglucocone (3-DG) are
http://www.jbc.org/cgi/doi/10.1074/jbc.M110.144097The latest version is at JBC Papers in Press. Published on November 5, 2010 as Manuscript M110.144097
Copyright 2010 by The American Society for Biochemistry and Molecular Biology, Inc.
by guest on August 28, 2019
http://ww
w.jbc.org/
Dow
nloaded from

2
also known to form AGEs. MGO is probably themost important precursor in this formation ofAGEs (4). This highly reactive oxo-aldehyde isformed mainly by the non-enzymatic andenzymatic fragmentation of the triose phosphatesglyceraldehyde-3-phosphate and di-hydroxy-acetone-phosphate. MGO reacts primarily witharginine residues to form the major AGEs,hydroimidazolone (MG-H1), argpyrimidine (AP)and tetrahydropyrimidine (THP), and with lysineresidues to minor AGEs such as N -(1-carboxyethyl)lysine (CEL). MGO is efficientlydetoxified by the glyoxalase system. In thispathway MGO reacts with reduced glutathione(GSH) to a hemithioacetal adduct, and then to S-d-lactoyl-gluthathione which is catalysed byglyoxalase-I (GLO-I). This product is convertedinto D-lactate by glyoxalase-II, thereby reformingthe consumed GSH. A similar reaction withglyoxal can take place via the intermediate S-glycolylglutathione (5). Overexpression of GLO-Iprevents the accumulation of MGO and AGEs inendothelial cells exposed to high glucoseconcentration in vitro, indicating that GLO-I playsan important role in the suppression of AGEformation under hyperglycemic condition (6).
Among other adverse effects, MGOinduces dysfunction of mitochondrial respiration(7) and increases the production of reactiveoxygen species (ROS) (8,9). Also the decrease ofGLO-I activity by an inhibitor results in alteredcellular function (10-12). Recently Schlotterer etal. showed that GLO-I overexpression in C.elegans decreased hyperglycemia-inducedaccumulation of AGEs and oxidative stress andenhanced lifespan (13).
Nevertheless, in higher organisms the invivo effect of GLO-I overexpression onhyperglycemia induced AGE formation and ROSproduction has not yet been studied. Therefore inthis study we investigated the phenotype ofdiabetic transgenic rats with a GLO-Ioverexpression. We hypothesized that these ratswill have less MGO and MGO-derived adducts incomparison with their wild-type diabeticlittermates, and that this would have beneficialeffects on the formation of hyperglycemia-inducedROS production.
EXPERIMENTAL PROCEDURES
Glyoxalase-I transgenic rats To generatethe human GLO-I transgene construct, the entirecoding sequence of human GLO-I cDNA wascloned into the EcoR I site of the pBsCAG-2. TheGLO-I transgene, isolated by digestion ofpBsCAG-2 containing GLO I-cDNA with Kpn Iand Sac I, was microinjected into one pronucleusof fertilized Wistar eggs, followed by transfer intothe oviducts of pseudopregnant rats. Theprocedure used was comparable with thegeneration of glyoxalase-I overexpressing mice(14). Rat genomic DNA extracted from tail tissuewas used to detect the transgene by polymerasechain reaction (PCR) using specific primers forGLO-I or pBsCAG-2 vector. Primers forcytomegalovirus enhancer sense (5'-GTC GACATT GAT TAT TGA CTA G-3') and antisense(5'-CCA TAA GGT CAT GTA CTG-3') amplifieda 350 bp fragment. Primers for the fragmentcontaining human GLO I gene and 3' junction ofvector, sense (5'-GTA GTG TGG GTG ACT CCTCCG TTC CTT GGG-3') and antisense (5'-TCGAGG GAT CTT CAT AAG AGA AGA G-3'),amplified a 1200 bp fragment. PCR amplificationwas carried out with an initial denaturation at 94°Cfor two minutes, followed by 35 cycles of 95°C for30 seconds, 55°C or 58°C for 30 seconds, and72°C for 30 or 75 seconds.
Induction of diabetes with streptozotocinAll animal studies were carried out in accordancewith the Guide for the Care and Use of LaboratoryAnimals of the National Institutes of Health. Allexperiments involving rats were reviewed andapproved by the ethics committee for animal careand use of the Maastricht University, theNetherlands.Wild-type rats (WtD, n=9) and transgenic GLO-Irats (TgD, n=8) were made diabetic byintravenous injection of streptozotocin (STZ,65 mg/kg body weight). Weight- and age-matchedcontrol rats (WtC, n=9) and transgenic GLO-I rats(TgC, n=8) were not injected. Blood glucose levelswere monitored at baseline and after 1 and 12weeks. Only STZ-injected rats with a fasting bloodglucose level above 15mM after 1 and 12 weekswere included in the study as diabetic. Bodyweight, food and fluid intake, urine production,and urinary creatinine levels were measured atbaseline and after 12 weeks. Three months afterthe induction of diabetes, rats were sacrificed andmultiple tissues were processed for analysis.
by guest on August 28, 2019
http://ww
w.jbc.org/
Dow
nloaded from

3
Samples from various organs were fixed in 4%neutral buffered formaldehyde, embedded inparaffin, and sectioned at 4 µm thickness. Bloodsamples were collected at the time of sacrifice forhematological and biochemical analyses. Tissues(50 mg) from wild-type or GLO-I transgenic ratswere homogenized in 1 mL of 0.1M sodiumphosphate buffer, pH 7.0, containing 0.02%TritonX-100 and centrifuged at 20,000 xg for 20minutes at 4°C. The supernatant was used as atissue lysate to assess GLO-I protein expressionwith Western blotting and GLO-I activity.
Glyoxalase-I activity measurement GLO-Iactivity was assayed by spectrophotometry bymonitoring the increase in absorbance at 240 nmdue to the formation of S-D-lactoylglutathione forten minutes at 37°C according to the method byMcLellan and Thornalley (15).
Preparation of anti-MGO antibodiesMGO-keyhole limpet hemocyanin (KLH) wasprepared by the reaction of MGO (10 mM) withKLH for 7 days at 37°C and was used as antigenfor the immunization of mice. MGO-KLH wasemulsified in an equal volume of Freund’scomplete adjuvant and three mice were intrader-mally injected at multiple sites. The mice wereboosted with the same amount of MGO-KLHemulsified in Freund’s incomplete adjuvant 21days later and antisera obtained 14 days after thebooster were tested. The booster was repeatedtwice. Ten days after the final booster, antiserawere tested with MGO-albumin and the mousewith the highest titer was used for fusion. Weobtained 40 positive clones as tested with MGO-albumin and one of them was furthercharacterized. This monoclonal antibody was fromthe IgG1 subclass, and has an at least 1000-foldpreference for tetrahydropyrimidine as comparedto argpyrimidine or 5-hydro-5-methyl-4-imidazolone.
Preparation of MGO-albumin Humanserum albumin (6.8 mg) was dialyzed againstphosphate buffer (0.1 M) and filtrated through a0.45 µm filter followed by incubation in aphosphate buffer(0.2 M), pH 7.8, with differentconcentrations of MGO (0.5-10 mM).MGO-albumin Elisa In a competitive Elisa,
performed at room temperature, each well wascoated with 100 µl of 0.1 mg/ml MGO-albumin, asprepared by the incubation of albumin with 0.5mMMGO for 2 days, in PBS for 1 hour at room
temperature or overnight at 4oC. This MGO-albumin preparation was also used as standard inthe competitive Elisa. To each well were added 50µl of the antibody (anti-THP (1:2000) or anti MG-H1 (1:100.000), and 50 µl of standard or plasmasample to be tested. After incubation for 1 hourand three washes with PBS-Tween, the wells wereincubated with 100 µl peroxidase-labeled goat-anti-mouse (1:5000, Dako, Glostrup, Denmark) for1 hour. Finally, the wells were washed five timeswith PBS-Tween and the substrate was developedwith 100 µl of tetramethylbenzidine. The reactionwas stopped with 100 µl 0.5M H2SO4. Theextinction at 450 nm was measured with amultichannel spectrophotometer (SLT Microplatereader, Wilten Bioteknika, Etten-Leur, the Nether-lands). Plasma levels were expressed as arbitraryunits, and one unit was defined as the antibody-reactive material equivalent to 1 µg of the MGO-albumin standard.
Measurement of oxo-aldehydes and AGEsBlood samples were collected in 1.5M perchloricacid (PCA) and concentrations of the dicarbonylsMGO and GO were determined by reversed-phasehigh-performance liquid chromatography (HPLC)with fluorescence detection after derivatization totheir respective dimethoxyquinoxaline derivatives(16). Concentrations of the dicarbonyl 3-DG weremeasured with HPLC tandem mass spectrometryafter derivatization with dinitrophenylhydrazine(17).In addition, protein-bound CML and CEL weremeasured in plasma by HPLC tandem massspectrometry (18). Protein-bound Argpyrimidinewas measured by HPLC with fluorescent detectionwith the same sample preparation as described byScheijen et al. (19) for pentosidine.
Measurement of D-lactate and markers ofoxidative stress D-lactate was measured in bloodand urine by an enzymatic assay withspectrophotometric quantification (20).8-Isoprostane (21) and malondialdehyde (MDA)(22) levels were measured in rat urine by HPLCwith MS-MS or fluorescence detection,respectively.
Western blot analysis of mitochondrialproteins and oxidative stress markers Western blotanalyses were performed in muscle homogenatesof the gastrocnemius muscle using an antibodycocktail (MS601; MitoSciences, Eugene, OR)against structural components of four of the five
by guest on August 28, 2019
http://ww
w.jbc.org/
Dow
nloaded from

4
oxidative phosphorylation complexes (i.e., to theND6 subunit of complex I, the 30 kDa Ip subunitof complex II, the 47 kDa core protein 2 ofcomplex III, and the -subunit of the F1F0 ATPsynthase of complex V).In the whole muscle homogenates, we alsoanalyzed uncoupling protein-3 (UCP-3), adeninenucleotide translocase 1 (ANT-1) (MSA02;MitoSciences) and 4-hydroxy-2-nonenal (4-HNE)(JAICA; Fukuroi, Japan) protein content bywestern blotting according to Hoeks et al. (23).The nitric oxide oxidation product, peroxynitrite(polyclonal nitrotyrosine antibody from,Calbiochem, San Diego, USA), was detected inkidney lysates. In brief, upon homogenization inlysis buffer, containing 1% NP40, 0.5% sodiumdodecyl sulfate, 1 mmol/l phenylmethylsulfonylfluoride, and 4% complete inhibitor cocktail,lysates were processed for western blotting. Afterincubation with the appropriate secondaryantibodies, protein-specific bands were detectedand quantified with the Odyssey Infrared Imager(LI-COR; Westburg, Leusden, the Netherlands) orthe Chemidoc Imager (Biorad; Veenendaal, theNetherlands) and expressed as fold change to thewild-type control group.
Statistical analysis Differences betweengroups in levels of each marker examined weretested using one-way ANOVA. Post-hocBonferroni correction was used for the comparisonof the three groups of interest (WtC versus WtD,WtD versus TgD and WtC versus TgD). We alsocalculated, and compared between groups, acomposite score of GLO-I sensitive oxo-aldehydes(CO and MGO), GO and MGO derived AGEs(CML, CEL, MH-H1, THP and AP) and ROS(MDA, 8-isoprostane and nitrotyrosine) byaveraging the z-scores of each of the respectivemarkers. Each z-score represents the distancebetween the raw score from the total mean in unitsof the standard deviation (assuming negativevalues when the raw score is below the mean, andpositive when above), thus enabling thecombination of several markers originallyexpressed as different units. The three compositescores thus obtained represent a good integralmeasure of the processes/mechanisms theyrepresent and have the advantage of reducing theinfluence of the biological variability when each oftheir constituent markers are tested separately. Toenable a meaningful interpretation of the
magnitude of the differences in these compositescores, comparisons between the TG diabeticgroup and the referent group (WT) were alsoexpressed relative to the levels in this group (i.e. aspercentage). A p-value of less than 0.05 wasconsidered statistically significant. Data areexpressed as the mean ± SEM.
RESULTS
Glyoxalase-I overexpression in thetransgenic GLO-I ratsGLO-I activity was significantly elevated inmultiple tissues of the GLO-I transgenic ratsincluding heart, kidney, eye, brain, aorta andgastrocnemius muscle as compared with their wildtype (WT) littermates (figure 1A). In these tissues,human GLO-I protein expression was confirmedby immunoblotting and by immunohistochemicalstaining as shown for the heart and kidney (figure1B-C). These data demonstrated a functionallyactive overexpression of GLO-I in the GLO-Itransgenic rats.
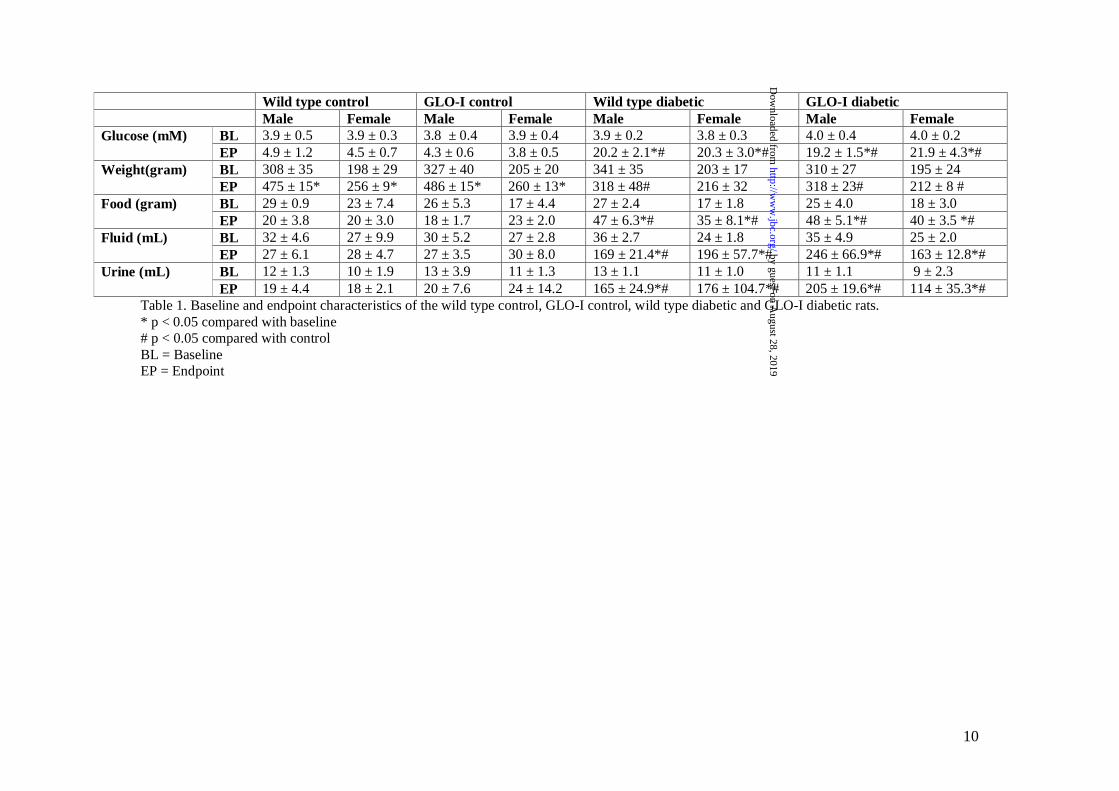
Baseline and endpoint characteristicsTable 1 presents biochemical data andcharacteristics of both the non-diabetic anddiabetic WT and GLO-I transgenic rats. Diabetesin both WT and GLO-I transgenic rats, as inducedby STZ, resulted in an approximately five-foldincrease in blood glucose levels, decreased weightgain and, increased food and fluid intake and urineproduction without a difference between the WTand the GLO-I transgenic rats.
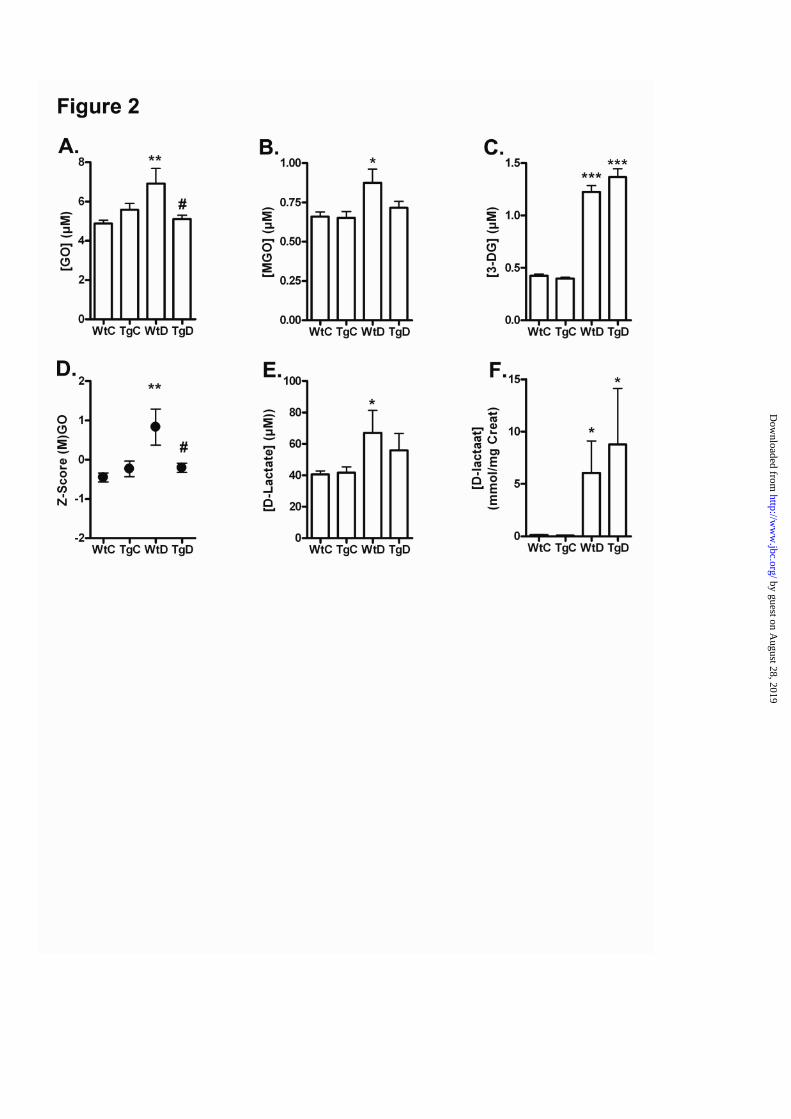
GLO-1 overexpression reduces elevatedlevels of MGO and GO in diabetic ratsThe AGE precursors, MGO, GO and 3-DG, weresignificantly elevated in the diabetic WT rats ascompared with non-diabetic WT rats (figure 2 A-C). Levels of the GLO-I- sensitive GO and MGOwere normalized in the GLO-I transgenic diabeticrats compared with the WT rats, while 3-DG levelswere not influenced by the GLO-I overexpression.The composite score of MGO and GO differedbetween the WT diabetic and transgenic diabeticgroup by 1.04. This difference corresponds to asignificant 81% decrease in the composite score ofGO and MGO in the GLO-I transgenic diabeticrats compared with the WT diabetic rats ((p<0.05);figure 2D).In addition, the endproduct of the GLO system, i.eD-lactate, was determined. The plasma levels of
by guest on August 28, 2019
http://ww
w.jbc.org/
Dow
nloaded from
5
D-lactate were elevated in the diabetic ratscompared with the non-diabetic rats (figure 2 E).Also the urine samples showed an increase of D-lactate in the diabetic rats, with a higherconcentration of D-lactate in the diabetic GLO-Itransgenic rats, indicating a high flux of MGOthrough the GLO-I pathway (figure 2F).
GLO-1 overexpression reduces elevatedlevels of AGEs in diabetic ratsNext, we evaluated if the overexpression of GLO-Ialso led to a decreased formation of AGEs. Wemeasured protein-bound levels of CML, CEL,MG-H1, THP and AP in the plasma of the fourgroups. All AGE adducts were elevated in theplasma of diabetic WT rats compared with non-diabetic WT rats, and this was statisticallysignificant for CML, MG-H1 and AP. There was atrend that the diabetes-induced increase of allAGEs was partially reduced in the diabetic GLO-Itransgenic rats as compared with the diabetic WTrats (figure 3A-E), although the reduction of theindividual AGEs did not reach statisticalsignificance. The absolute difference in the overallcomposite protein bound AGEs score in theplasma of WT diabetic rats vs. the transgenicdiabetic rats was 0.73 and this corresponds to asignificant 54 % reduction in the composite scoreof plasma AGEs in diabetic GLO-I transgenic ratscompared with the diabetic WT rats ((p<0.05);figure 3F).
GLO-1 overexpression reduces elevatedoxidative stress markers in urine and tissue indiabetic ratsFurthermore we examined the effect of GLO-Ioverexpression on oxidative stress. The urinaryexcretion of MDA and 8-isoprostane weresignificantly increased in the diabetic WT ratsafter 12 weeks of diabetes (figure 4A-B). Thisincrease in estimates of oxidative stress waspartially prevented in the diabetic GLO-Itransgenic rats, although it did not reachstatistically significance. In addition, kidney tissuelevels of the peroxynitrite marker nitrotyrosinewere elevated in the diabetic WT rats, andsignificantly (p<0.05) attenuated in the diabeticGLO-I transgenic rats (figure 4C). Difference inthe composite score of these oxidative stressmarkers between the WT diabetic rats and thetransgenic diabetic rats was 0.84, whichcorresponds to a significant 51% decrease in the
composite ROS score in the diabetic GLO-Itransgenic rats as compared with the diabeticcontrol rats ((p<0.05; figure 4D).
Protein levels of mitochondrial oxidativephosphorylation complexesTo gain more information about the source of theoxidative stress we measured the levels of 4structural proteins of the complexes of themitochondrial respiration chain. Complex I, II, IIIand V of the mitochondrial respiration chain ingastrocnemius muscle lysates were allsignificantly decreased in the wild type diabeticrats. In the transgenic diabetic rats this decreasewas partially counteracted by the GLO-Ioverexpression. The mitochondrial proteinsadenine nucleotide translocator-1 (ANT-1) anduncoupling protein-3 (UCP-3) were not altered bydiabetes or GLO-I overexpression, indicating aspecific effect on the oxidative phosphorylationcomplexes (see figure 5A-F). The decrease inphosphorylation complexes was accompanied byan increase in the lipid oxidation marker 4-HNE inthe muscle from the wild type diabetic rats (figure5G), which was normalized by GLO-Ioverexpression.
DISCUSSION
We report here that GLO-I overexpression indiabetic rats prevents the hyperglycemia-inducedformation of MGO, GO and AGEs, as well asoxidative stress in diabetes.
To demonstrate the importance of GLO-Iin the formation of AGEs, transgenic GLO-I ratswere generated and increased GLO-I protein levelsand activity was confirmed by Western blotting,immunohistochemistry and enzyme activitymeasurements, respectively. The GLO-I activitywas at least ten- to fifty-fold higher in GLO-Itransgenic rats compared with WT rats in severalhighly vascularised tissues i.e. heart, kidney, eye,brain, aorta and gastrocnemius muscle.
Our findings are consistent with previousreports. Shinohara et al. transfected endothelialcells with GLO-I, and the hyperglycemia-inducedformation of MGO could be completelynormalized by the overexpression of GLO-I,resulting in lower intracellular MGO-derived AGEformation, but not of CML and CEL (6).Consistently, Miyata et al. demonstrated that a
by guest on August 28, 2019
http://ww
w.jbc.org/
Dow
nloaded from
6
deficiency of GLO-I is associated with increasedlevels of AGEs, further underlining the importanceof glyoxalase detoxification system, in particularGLO-I, for the actual level of AGEs (24).
In our study diabetes, as induced by STZtreatment, resulted in increased MGO, GO and 3-DG levels. The fact that in our study only theGLO-I substrates MGO and GO are reduced byGLO-I and not 3-DG, which cannot be degradedby GLO-I, underlines the specificity of the GLO-Itransgenic model. In addition to a decrease ofMGO and GO, we found that the MGO- and/orGO-derived AGEs, MG-H1, THP, AP, CML andCEL were decreased in the plasma of the diabeticGLO-I overexpressing model as compared withWT diabetic rats. Despite the trend towardsreduction in all markers, this decrease was onlystatistically significant when all these markerswere comprised into a more robust overall score ofAGEs. Therefore interpretations about the effect ofGLO-I overexpression on each of the separateAGE adducts should be taken with care.Furthermore, the composite score decrease in totalAGE levels was on average only 54%, despite the81% reduction of GO and MGO. This only partialreduction in the formation of AGEs in the diabetictransgenic rats might be due to alternativepathways in the formation of AGEs, independentof the precursors MGO and GO and independentof GLO-I expression. Since the glucose levelswere elevated fivefold in the diabetic ratscompared with controls, with no effect of GLO-Ioverexpression, it might be that a significant partof the formation of AGEs is formed via theclassical Maillard reaction. In addition, someAGEs, such as CML, can also be formed directlyby lipid oxidation and via the myeoloperoxidasereaction, which can explain the GLO-Iindependent formation of AGEs in diabetes (25).
In addition to the effect on carbonyl stressand AGEs, GLO-I overexpressing also reducedhyperglycemia-evoked ROS generation, asestimated by three markers of oxidative stress i.e.8-isoprostane, MDA and nitrotyrosine. 8-Isoprostane is a prostaglandin-like compoundgenerated in vivo by the free-radical-catalyzedperoxidation of arachidonic acid (26). MDA is abioactive aldehyde generated by extensiveoxidation of polyunsaturated fatty acids (27), andnitrotyrosine is formed when the oxidant productof nitric oxide, peroxynitrite, nitrosates tyrosine.
Our study shows that these markers of oxidativestress are increased in diabetes and that GLO-Ioverexpression is capable of lowering these threemarkers of oxidative stress. These data stronglyindicate that MGO plays a relevant role inmodulating diabetes-induced ROS production,which is in agreement with earlier studies withaminoguanidine and aldose reductase inhibitors(28-30).
Oxidative stress contributes significantlyto the development and progression of diabetesand related vascular complications (31). The mainsource of ROS in diabetes is most probably due toaltered mitochondrial metabolism, which results inoverproduction of superoxide by the electron-transport chain (32). Rosca and co-workersdescribed that several mitochondrial proteins aresusceptible to MGO-dependent glycation, andconsequently excessive superoxide is produceddue to a decreased electron-transport chain activity(9). In accordance with this study, hyperglycemiaalso leads to mitochondrial glycation in C. elegans(13), which was decreased by overexpression ofGLO-I, indicating the importance of glyoxalasesensitive oxo-aldehydes in the formation ofoxidative stress. To further explore the potentialsource of the oxidative stress in our model, wedetermined the protein levels of four structuralproteins of the mitochondrial electron transportchain complexes. All these complexes weredecreased in the diabetic rats, and increased byGLO-1 overexpression. This decrease in electrontransport chain proteins could lead to deficientmitochondrial function and structure and maycontribute to the abnormality of energymetabolism. A consequence of defectivemitochondrial function is the increased generationof free radicals which are normally produced asby-products of oxidative metabolism (33). Thesefree radicals are able to oxidize lipids, proteins,nucleic acids, and other molecules, altering theirstructure and function (34). Indeed, lipidperoxidation was also measured in the muscle ofour diabetic rats, by the elevation of the oxidativestress marker 4-HNE. In the GLO-1overexpression diabetic rats lipid peroxidation wascompletely prevented, paralleled by an increase inmarkers of mitochondrial function, suggesting thatMGO may affect mitochondrial ROS productionvia an effect on mitochondrial function.
by guest on August 28, 2019
http://ww
w.jbc.org/
Dow
nloaded from
7
Pharmaceutical quenching of MGO in vivois frequently used in the prevention of diabeticcomplications in animal models. MGO can betrapped by guanidine compounds such asaminoguanidine and metformin, and by vitamin Banalogs like pyridoxamine, and can be reduced bythe activation of transketolase by thiamine andbenfothiamine. Indeed, these compounds lowerMGO levels (35). However, since these guanidinecompounds are far from specific, the precisecontribution of MGO and GO in diabeticcomplications is still largely unknown. Thereforethis new transgenic rat model, which specificallydecreases GLO-I sensitive aldehydes such asMGO and GO and their derived AGEs, canprovide important knowledge about thecontribution of GO, MGO and (M)GO-derivedAGEs in the development of diabetic (vascular)complications. Indeed, we recently demonstratedin this model that hyperglycemia-inducedimpairment of endothelium-dependentvasorelaxation in mesenteric arteries is mediatedby intracellular MGO levels (36), demonstratingthe usefulness of this model.
In conclusion, our study shows for the firsttime that GLO-I overexpression decreased GO,MGO, AGEs and ROS levels under in vivohyperglycemic conditions. These data areconsistent with the link between glycation andoxidative stress. Excessive formation of AGEs andoxidative stress has been implicated in thedevelopment of vascular complications in diabetes,and therefore activation of the GLO-I pathwaycould be an important target in the prevention ofdiabetes-induced vascular damage.
ACKNOWLEDGMENTS
This study was partially supported by the DutchDiabetes Foundation (Grant number 2005.11.013).Dr. I Ferreira is supported by a post-doctoralresearch grant (#2006T050) from the NetherlandsHeart Foundation. Furthermore the authors want tothank Rob Barto (Department of ClinicalChemistry, VU University Medical Center,Amsterdam, the Netherlands), Jean Scheijen andMarjo van de Waarenburg (Department of InternalMedicine, Division of General Internal Medicine,Laboratory for Metabolism and VascularMedicine, Maastricht University, Maastricht, the
Netherlands) for their excellent technicalassistance.
by guest on August 28, 2019
http://ww
w.jbc.org/
Dow
nloaded from

8
REFERENCES1. Brownlee, M. (2001) Nature 414, 813-8202. Monnier, V. M., and Cerami, A. (1981) Science 211, 491-4933. Yaylayan, V. A., and Huyghues-Despointes, A. (1994) Crit Rev Food Sci Nutr 34, 321-
3694. Beisswenger, P. J., Howell, S. K., Nelson, R. G., Mauer, M., and Szwergold, B. S. (2003)
Biochem Soc Trans 31, 1358-13635. Thornalley, P. J. (2003) Biochem Soc Trans 31, 1343-13486. Shinohara, M., Thornalley, P. J., Giardino, I., Beisswenger, P., Thorpe, S. R., Onorato, J.,
and Brownlee, M. (1998) J Clin Invest 101, 1142-11477. Biswas, S., Ray, M., Misra, S., Dutta, D. P., and Ray, S. (1997) Biochem J 323 ( Pt 2),
343-3488. Chang, T., Wang, R., and Wu, L. (2005) Free Radic Biol Med 38, 286-2939. Rosca, M. G., Mustata, T. G., Kinter, M. T., Ozdemir, A. M., Kern, T. S., Szweda, L. I.,
Brownlee, M., Monnier, V. M., and Weiss, M. F. (2005) Am J Physiol Renal Physiol 289,F420-430
10. Miller, A. G., Smith, D. G., Bhat, M., and Nagaraj, R. H. (2006) J Biol Chem 281, 11864-11871
11. Sakamoto, H., Mashima, T., Kizaki, A., Dan, S., Hashimoto, Y., Naito, M., and Tsuruo,T. (2000) Blood 95, 3214-3218
12. Thornalley, P. J., Edwards, L. G., Kang, Y., Wyatt, C., Davies, N., Ladan, M. J., andDouble, J. (1996) Biochem Pharmacol 51, 1365-1372
13. Schlotterer, A., Kukudov, G., Bozorgmehr, F., Hutter, H., Du, X., Oikonomou, D.,Ibrahim, Y., Pfisterer, F., Rabbani, N., Thornalley, P., Sayed, A., Fleming, T., Humpert,P., Schwenger, V., Zeier, M., Hamann, A., Stern, D., Brownlee, M., Bierhaus, A.,Nawroth, P., and Morcos, M. (2009) Diabetes
14. Inagi, R., Miyata, T., Ueda, Y., Yoshino, A., Nangaku, M., van Ypersele de Strihou, C.,and Kurokawa, K. (2002) Kidney Int 62, 679-687
15. McLellan, A. C., Phillips, S. A., and Thornalley, P. J. (1993) Anal Biochem 211, 37-4316. Schalkwijk, C. G., Posthuma, N., ten Brink, H. J., ter Wee, P. M., and Teerlink, T. (1999)
Perit Dial Int 19, 325-33317. Schindhelm, R. K., Alssema, M., Scheffer, P. G., Diamant, M., Dekker, J. M., Barto, R.,
Nijpels, G., Kostense, P. J., Heine, R. J., Schalkwijk, C. G., and Teerlink, T. (2007)Diabetes Care 30, 1789-1794
18. Teerlink, T., Barto, R., Ten Brink, H. J., and Schalkwijk, C. G. (2004) Clin Chem 50,1222-1228
19. Scheijen, J. L., van de Waarenburg, M. P., Stehouwer, C. D., and Schalkwijk, C. G.(2009) J Chromatogr B Analyt Technol Biomed Life Sci 877, 610-614
20. Marti, R., Varela, E., Segura, R. M., Alegre, J., Surinach, J. M., and Pascual, C. (1997)Clin Chem 43, 1010-1015
21. Roest, M., Voorbij HA, Van der Schouw YT, Peeters PH, Teerlink T, and PG., S. (2008)J Clin Lipidol 2, 298-303
22. van de Kerkhof, J., Schalkwijk, C. G., Konings, C. J., Cheriex, E. C., van der Sande, F.M., Scheffer, P. G., ter Wee, P. M., Leunissen, K. M., and Kooman, J. P. (2004) NephrolDial Transplant 19, 910-916
23. Hoeks, J., Briede, J. J., de Vogel, J., Schaart, G., Nabben, M., Moonen-Kornips, E.,Hesselink, M. K., and Schrauwen, P. (2008) FEBS Lett 582, 510-516
by guest on August 28, 2019
http://ww
w.jbc.org/
Dow
nloaded from

9
24. Miyata, T., van Ypersele de Strihou, C., Imasawa, T., Yoshino, A., Ueda, Y., Ogura, H.,Kominami, K., Onogi, H., Inagi, R., Nangaku, M., and Kurokawa, K. (2001) Kidney Int60, 2351-2359
25. Fu, M. X., Requena, J. R., Jenkins, A. J., Lyons, T. J., Baynes, J. W., and Thorpe, S. R.(1996) J Biol Chem 271, 9982-9986
26. Morrow, J. D., Hill, K. E., Burk, R. F., Nammour, T. M., Badr, K. F., and Roberts, L. J.,2nd. (1990) Proc Natl Acad Sci U S A 87, 9383-9387
27. Requena, J. R., Fu, M. X., Ahmed, M. U., Jenkins, A. J., Lyons, T. J., and Thorpe, S. R.(1996) Nephrol Dial Transplant 11 Suppl 5, 48-53
28. Ihm, S. H., Yoo, H. J., Park, S. W., and Ihm, J. (1999) Metabolism 48, 1141-114529. Kedziora-Kornatowska, K., and Luciak, M. (1998) Biochem Mol Biol Int 46, 577-58330. Drel, V. R., Pacher, P., Stevens, M. J., and Obrosova, I. G. (2006) Free Radic Biol Med
40, 1454-146531. Ceriello, A. (2006) Curr Opin Lipidol 17, 510-51832. Nishikawa, T., Edelstein, D., Du, X. L., Yamagishi, S., Matsumura, T., Kaneda, Y.,
Yorek, M. A., Beebe, D., Oates, P. J., Hammes, H. P., Giardino, I., and Brownlee, M.(2000) Nature 404, 787-790
33. Rabbani, N., and Thornalley, P. J. (2008) Biochem Soc Trans 36, 1045-105034. Kakkar, P., and Singh, B. K. (2007) Mol Cell Biochem 305, 235-25335. Reddy, V. P., and Beyaz, A. (2006) Drug Discov Today 11, 646-65436. Brouwers, O., Niessen, P. M., Haenen, G., Miyata, T., Brownlee, M., Stehouwer, C. D.,
De Mey, J. G., and Schalkwijk, C. G. (2010) Diabetologia 53, 989-1000
by guest on August 28, 2019
http://ww
w.jbc.org/
Dow
nloaded from
10
Wild type control GLO-I control Wild type diabetic GLO-I diabeticMale Female Male Female Male Female Male Female
BL 3.9 ± 0.5 3.9 ± 0.3 3.8 ± 0.4 3.9 ± 0.4 3.9 ± 0.2 3.8 ± 0.3 4.0 ± 0.4 4.0 ± 0.2Glucose (mM)EP 4.9 ± 1.2 4.5 ± 0.7 4.3 ± 0.6 3.8 ± 0.5 20.2 ± 2.1*# 20.3 ± 3.0*# 19.2 ± 1.5*# 21.9 ± 4.3*#BL 308 ± 35 198 ± 29 327 ± 40 205 ± 20 341 ± 35 203 ± 17 310 ± 27 195 ± 24Weight(gram)EP 475 ± 15* 256 ± 9* 486 ± 15* 260 ± 13* 318 ± 48# 216 ± 32 318 ± 23# 212 ± 8 #BL 29 ± 0.9 23 ± 7.4 26 ± 5.3 17 ± 4.4 27 ± 2.4 17 ± 1.8 25 ± 4.0 18 ± 3.0Food (gram)EP 20 ± 3.8 20 ± 3.0 18 ± 1.7 23 ± 2.0 47 ± 6.3*# 35 ± 8.1*# 48 ± 5.1*# 40 ± 3.5 *#BL 32 ± 4.6 27 ± 9.9 30 ± 5.2 27 ± 2.8 36 ± 2.7 24 ± 1.8 35 ± 4.9 25 ± 2.0Fluid (mL)EP 27 ± 6.1 28 ± 4.7 27 ± 3.5 30 ± 8.0 169 ± 21.4*# 196 ± 57.7*# 246 ± 66.9*# 163 ± 12.8*#BL 12 ± 1.3 10 ± 1.9 13 ± 3.9 11 ± 1.3 13 ± 1.1 11 ± 1.0 11 ± 1.1 9 ± 2.3Urine (mL)EP 19 ± 4.4 18 ± 2.1 20 ± 7.6 24 ± 14.2 165 ± 24.9*# 176 ± 104.7*# 205 ± 19.6*# 114 ± 35.3*#
Table 1. Baseline and endpoint characteristics of the wild type control, GLO-I control, wild type diabetic and GLO-I diabetic rats.* p < 0.05 compared with baseline# p < 0.05 compared with controlBL = BaselineEP = Endpoint
by guest on August 28, 2019
http://ww
w.jbc.org/
Dow
nloaded from
11
LEGEND TO THE FIGURES
Figure 1. GLO-I activity and human protein expression in tissue of wild-type and transgenic GLO-I rats.A. GLO-I enzyme activity in lysates of heart, kidney, eye, brain, aorta and gastrocnemius muscle tissue ofwild-type control (WtC), transgenic control (TgC), wild-type diabetic (WtD) and transgenic diabetic(TgD) rats.B. Western blot of human GLO-I protein overexpression in transgenic heart and kidney compared withwild-type heart and kidney lysates.C. Immunohistochemistry of GLO-I protein overexpression in transgenic heart (C2) and kidney (C4)compared with wild-type (C1, C3).** p < 0.01 compared with control, *** p < 0.001 compared with control
Figure 2. Oxo-aldehydes formation and detoxification of (M)GO in the blood of wild-type andtransgenic GLO-I rats.Glyoxal (A), MGO (B) and 3DG (C) levels in the blood of wild-type control (WtC), transgenic control(TgC), wild-type diabetic (WtD) and transgenic diabetic (TgD) rats. A composite score was calculatedfor the GLO-I sensitive oxo-aldehydes GO and MGO (D). D-lactate levels in the plasma (E) and urine (F)of the wild-type control (WtC), transgenic control (TgC), wild-type diabetic (WtD) and transgenicdiabetic (TgD) rats.* p < 0.05 compared with control, ** p < 0.01 compared with control, *** p < 0.001 compared withcontrol, # p < 0.05 compared with wild-type diabetic
Figure 3. Formation of AGEs measured in plasma from wild-type and transgenic GLO-I rats.CML (A), CEL (B), MG-H1 (C), THP (D) and AP (E) levels were measured with HPLC-MSMS andcompetitive ELISA in the plasma of the wild-type control (WtC), transgenic control (TgC), wild-typediabetic (WtD) and transgenic diabetic (TgD) rats and in addition a composite score was calculated forthe five AGEs (F).* p < 0.05 compared with control, *** p < 0.001 compared with control, # p < 0.05 compared with wild-type diabetic
Figure 4. Formation of ROS markers in urine and tissue from wild-type and transgenic GLO-Irats.MDA (A), 8-isoprostane (B) and kidney nitrotyrosine (C) levels in wild-type control (WtC), transgeniccontrol (TgC), wild-type diabetic (WtD) and transgenic diabetic (TgD) rats, were measured with HPLCand western-blotting and a composite score was calculated for the three ROS markers (D).* p < 0.05 compared with control, ** p < 0.01 compared with control, *** p < 0.001 compared withcontrol, # p < 0.05 compared with wild-type diabetic
Figure 5. Protein levels of mitochondrial proteins and formation of 4-HNE in the muscle of wildtype and transgenic GLO-I rats.The mitochondrial proteins Complex I (A), II (B), III (C), V (D), ANT (E), UCP-3 (F) and lipid oxidationmarker 4-HNE (G) were measured by Western blotting in gastrocnemius muscle lysates of the wild-typecontrol (WtC), transgenic control (TgC), wild-type diabetic (WtD) and transgenic diabetic (TgD) rats.* p < 0.05 compared with control, ** p < 0.01 compared with control, ## p < 0.01 compared with wild-type diabetic
by guest on August 28, 2019
http://ww
w.jbc.org/
Dow
nloaded from


G. SchalkwijkTom Teerlink, Patrick Schrauwen, Michael Brownlee, Coen D. Stehouwer and Casper Olaf Brouwers, Petra M. Niessen, Isabel Ferreira, Toshio Miyata, Peter G. Scheffer,
glycation endproducts and oxidative stress in diabetic ratsOverexpression of glyoxalase-I reduces hyperglycemia-induced levels of advanced
published online November 5, 2010J. Biol. Chem.
10.1074/jbc.M110.144097Access the most updated version of this article at doi:
Alerts:
When a correction for this article is posted•
When this article is cited•
to choose from all of JBC's e-mail alertsClick here
by guest on August 28, 2019
http://ww
w.jbc.org/
Dow
nloaded from