overconfidence in currency arkets - berkeley …faculty.haas.berkeley.edu/lyons/osler overconfidence...
TRANSCRIPT

OVERCONFIDENCE IN CURRENCY MARKETS
Thomas Oberlechner
Psychology Department University of Vienna
Carol L. Osler International Business School
Brandeis University
Abstract
This paper documents two forms of overconfidence among currency market professionals: a tendency to overestimate one's professional success, and a tendency to overestimate forecast precision. The evidence is based on a 2002 survey of 416 currency market professionals in North America. Over-confidence, which is central to current debates about equity pricing, may also be related to many issues in international economics, including: the forward premium puzzle, volatility in international capital flows, and high exchange-rate volatility with its associated fear of floating. Our evidence suggests that overconfidence does not affect profitability. This is consistent with economic theory, given the tiny transactions costs in currency markets and the ambiguous relationship between currency risk and return. Nonetheless, we find that overconfidence promotes overall professional success, measured as individuals' rank and trading experience. This is consistent with psychology research, which shows that overconfidence enhances qualities such as mental facility and perseverance. We infer that overconfidence may be self-sustaining in currency markets, and its consequences for exchange-rate dynamics, if any, may be permanent.
First draft: February, 2004
The authors gratefully acknowledge helpful discussion with Paroma Sanyal and Blake LeBaron, and seminar participants at the University of Hannover, Queens University Belfast, and the LIEP group at Harvard. Also, we acknowledge with gratitude each foreign exchange professional who took the time to fill out and return the survey, despite their pressing professional responsibilities. We take full responsibility for any errors. Please address correspondence to Carol Osler at [email protected].

OVERCONFIDENCE IN CURRENCY MARKETS
Overconfidence is central to current debates about equity pricing (Barberis and Thaler
2002). The academic literature typically defines overconfidence as unrealistically high
estimates of the precision of one’s information. The standard conclusion is that such
"miscalibration" should cause excess trading, since individuals will overestimate risk-
adjusted profits.1 In addition, opportunities to trade may multiply as overconfident
individuals with heterogeneous information generate more diverse price forecasts (Varian
1985, 1989; Harris and Raviv 1993; Kandel and Person 1995). Excess trading, in turn, could
explain excess volatility in stock prices relative to dividends (Shiller 1981; Campbell and
Shiller 1988). Overconfidence could also be related to other stock market anomalies, such as
momentum effects in the cross-section of average returns (Jagadeesh and Titman 1993, 2001;
Daniel Hirshleifer and Subrahmanyam 1998, 2001), and the long-run reversal of momentum
profits (De Bondt and Thaler 1985; Skinner and Sloan 2000).
Though overconfidence is often assumed in finance research, we have only indirect
evidence that it is actually present in financial markets (Odean 1999; Barber and Odean 2000,
2001, 2002). Instead, the assumption of overconfidence is based on direct evidence from
individuals many other settings, compiled by psychologists over recent decades.2 This
psychological research shows that people are usually overconfident when answering “general
knowledge” questions, such as, “How many miles is it from Paris to Tokyo?” (Lichtenstein,
Fischhoff and Phillips 1982). Of greater relevance to finance, it has also been found that such
overconfidence often affects forecasts (Fischhoff and MacGregor 1982).3 The tendency to
1 This definition is used in De Long et al. (1991), Kyle and Wang (1997), Benos (1998), Odean (1998), and Daniel, Hirshleifer, and Subramanyam (2001), inter alia. 2 Odean (1998) provides a good overview of the literature on overconfidence. 3 A useful early survey of this work is included in Fischhoff and MacGregor (1982).

overestimate forecast precision is not universal, however. Professional weather forecasters,
for example, do not exhibit miscalibration (Murphy and Winkler 1984); nor do customers of
a German online stock brokerage (Glaser and Weber 2003).4 Thus, it seems worthwhile to
look for direct evidence of overconfidence in financial markets. The value of such an exercise
is underscored by Barberis and Thaler’s (2002) call for "direct tests of the assumptions of
economic models."
This paper provides direct evidence of overconfidence among currency market
professionals, based on responses to a 2002 survey of North American foreign exchange
dealing banks. Currency market professionals, like professional weather forecasters, have
strong incentives to overcome perception biases, since their performance is objectively and
frequently measured by profits, and their profits heavily influence their bonuses. In addition,
our survey participants have had twelve years trading experience, on average, and thus much
time to learn about the markets. Nonetheless, we find that currency professionals do tend to
overestimate the precision of their information, as assumed in behavioral finance. They also
have an apparent tendency to overestimate their professional success, a phenomenon we label
“hubris.”5,6
In addition to documenting two forms of overconfidence in currency markets, we also
identify some sources and consequences of overconfidence. Our statistical technology for this
analysis is two-stage least squares, in which various measures of professional success—
including profitability, rank, and trading experience—are treated as endogenous. With regard
to sources of overconfidence, we find that miscalibration rises with task difficulty, is reduced
4 Though there is often no payoff to accuracy in these studies, the tendency towards overconfidence has been documented when subjects have a financial stake in their accuracy (Fischoff, Slovic and Lichtenstein 1977). 5 It is important to examine overconfidence in multiple settings because the bias toward overconfidence varies greatly with the judgment type (Klayman, Soll et al. 1999, West and Stanovich 1997). 6 Psychologists have documented two other ways in which people tend to be overconfident: the "illusion of control" leads people to imagine they have more control over events than they do; "unrealistic optimism" is self-explanatory. We do not test these facets of overconfidence.
2

by task-relevant feedback, and is stronger among women. "Hubris" appears to be strongest
among interbank and proprietary traders, is enhanced by public signals of professional
success, and is stronger among men. In addition to having distinct sources, our two forms of
overconfidence are uncorrelated across individuals.
Our examination of the consequences of overconfidence focuses on three dimensions
of professional success: profits, rank within the bank, and trading experience. In theory,
overconfidence could either enhance or undermine profitability in financial markets.
Transactions costs could rise along with excess trading, reducing profits (Barber and Odean
2000, 2001), while any associated increase in risk-bearing could raise profits (Biais et al.
2001, DeLong et al. 1991). For currency dealers, however, the negative and positive effects
of overtrading on profits could both be relatively unimportant, since their transactions costs
are negligible, and economists have yet to identify a reliable connection between currency
risk and return (Hodrick 1987, Froot and Thaler 1990, Lewis 1995, and Engel 1996).
Consistent with this analysis, we find no influence of overconfidence on profitability.
We do find, however, that overconfidence enhances participants’ rank and trading
experience. Though this would not be predicted by existing economic analysis, given the
apparent absence of any effect of overconfidence on profitability, it is consistent with
evidence from psychology (Taylor and Brown 1988). Overconfidence has been found to
enhance persistence and determination (Felson 1984), mental facility (Greenwald 1980), and
risk tolerance (Larwood and Whittaker 1977), all of which promote professional success.
Psychologists also note that having greater confidence about oneself may increase other’s
perception of one’s abilities (Trivers 1985), which in turn could lead to faster promotion and
greater professional longevity.
The apparently positive influence of overconfidence on currency traders’ rank and
trading experience suggests that overconfidence may be self-perpetuating in currency
3

markets, and that its effects on international markets may be permanent. These results are
consistent in spirit with theoretical research concluding that imperfectly rational traders need
not be driven out of financial markets (De Long et al. 1991, Kyle and Wang 1997, Benos
1998). The results contrast sharply, however, with Friedman's (1953) claim that irrational
traders are ultimately irrelevant because trading losses will force them out of the markets.
Imperfect Rationality and International Economics
The possibility of imperfect rationality in currency markets was first highlighted by a
series of papers showing that practitioners’ currency forecasts are biased and inefficient
(Goodman 1979; Frankel and Froot 1987; Froot and Frankel 1989; MacDonald (2002)
provides a recent survey). The authors of this research have been careful not to conclude that
practitioners are imperfectly rational: “It is important to note that [these] results … do not
necessarily imply irrational information processing (although, of course, they may)”
(MacDonald 2002, p. 77). Nonetheless, the research certainly suggests the possibility of
imperfect rationality in currency markets, and our paper investigates that possibility.
Overconfidence may be one source of the forecast inefficiency documented in this
literature. Specifically, the fact that overconfident agents do not learn well from their
mistakes could help explain why practitioner forecasts could easily be improved by
considering past forecast errors. In this way, overconfidence may contribute to “forward
bias,” the tendency of currencies with higher short-term interest rates to appreciate over short
horizons. This relationship has characterized major exchange rates vs. the U.S. dollar since
the advent of floating rates in the early 1970s, even though it is inconsistent with major
exchange-rate models (Hodrick 1987, Froot and Thaler 1990, Lewis 1995, and Engel 1996).
Forward bias may be related to the imperfect rationality of exchange-rate forecasts.
The list of potential consequences of overconfidence for international markets extends
well beyond inefficient exchange-rate expectations. The list also includes: excess currency
4

trading, excess exchange-rate volatility, volatility in international capital flows, the
profitability of trend-chasing technical trading strategies, possible exchange-rate bubbles, and
high kurtosis in currency returns. We consider each of these briefly.
Excess Currency Trading: Financial economists have shown that overconfidence can
stimulate excess trading. Thus, overconfidence among currency market professionals may
help explain why interbank trading accounts for 59 percent of total currency trading, or an
impressive $700 billion per day (BIS 2002). Some of this is “hot potato trading” (Lyons
1996), whereby one dealer, after acquiring inventory through a customer trade, unloads it
quickly to another dealer. However, interbank trading is so vast relative to any natural
benchmark that there is plenty of room for additional determinants.
Excess Exchange-Rate Volatility: Flood and Rose (1995) show that exchange-rate
volatility has been much higher since the shift to floating rates in the 1970s, even though the
volatility of fundamentals has not changed dramatically. Overconfident agents will bid prices
too high in response to good news, and drive them too low in response to bad news, through
which mechanism overconfidence could contribute to excess volatility in stock markets
(Shiller 1981; Campbell and Shiller 1988; Barberis and Thaler 2002). In currency markets,
excess volatility due to overconfidence could contribute to the widespread “fear of floating”
among emerging market governments (Calvo and Reinhart 2002).
Profitability of Trend-Chasing Technical Trading Strategies (e.g., Levich and Thomas
1993): Overconfidence may be related to this phenomenon just as it may be related to
momentum and reversals in stock markets (Jegadeesh and Titman 1993). Daniel et al. (1998)
propose that investors attribute profitable trades to skill and losing trades to bad luck, and
become overconfident. As a result, they overbuy their past winners and oversell their past
losers, generating short-run momentum and unrealistic pricing. Ultimately there is a long-run
reversal when mistakes become apparent and prices revert to fundamentals.
5

Volatility of International Capital Flows: If we turn from prices to the capital flows
that drive them, it appears that overconfidence may also contribute to the volatility of
international capital flows, including sudden surges in lending to particular markets (e.g.,
China at present) and the “sudden stops” that tend to follow. As documented here and
elsewhere, the tendency to overestimate the precision of information rises with the difficulty
of the estimation task. Since markets are very difficult to forecast, overconfidence may affect
investors who will, consequently, over-lend when positive excess returns are expected.
Ultimately, when they discover their mistake, these flows will be reversed, and the reversal
process could be quite abrupt. Consistent with this, Skinner and Sloan (1999) find that most
of the long-run low return to growth stocks “is explained by large and asymmetric responses
to negative earnings surprises.”
Bubbles in Currency Markets: Many observers believe that major dollar exchange
rates went through a speculative bubble during 1984-1985. Overconfidence would seem to be
a reasonable candidate explanation for such bubbles, especially given the overconfidence
documented during the bubble that engulfed major stock markets during the late 1990s
(Shiller 2000).
High Kurtosis in Currency Returns: The hedging of barrier options is viewed by the
market as an important source of large, abrupt exchange-rate changes, as indicated by the
frequency with which market commentary assesses the location and size of major barrier
options (see also Osler 2002, Osler and Savaser 2004). The more hedgers overestimate the
precision of their exchange-rate forecasts, the closer they will set the barriers to current rates.
Overconfidence thus raises the likelihood that barriers are actually triggered and that rates
move abruptly.
Some economists will wonder whether our survey-based results accurately reflect
traders’ beliefs, since traders may not respond accurately if they have no strong incentive to
6

tell the truth. We note that the survey also provided no incentive to distort the truth, however,
and people generally prefer to be helpful. Economists may also note that survey responses
sometimes gain accuracy as the payoff to accuracy increases (e.g., Laury and Holt 2000). To
this objection we can only respond that our survey probably achieves the maximum feasible
accuracy with this class of agents. Most established currency traders earn over $200,000 per
annum in current dollars (base plus bonus). It is difficult to imagine a research budget large
enough to provide payoffs that matter to people at this income level.
The remainder of this paper has four substantive sections and a conclusion. Section I
describes the survey. Section II presents our evidence for hubris, the tendency to overestimate
professional success, among our survey participants. Section III presents our evidence for
miscalibration, the tendency to overestimate the precision of exchange-rate forecasts. Section
IV identifies sources of overconfidence and evaluates the consequences of overconfidence for
individuals’ profitability, rank, and trading experience. Section V concludes.
I. THE SURVEY
The survey was sent on June 25, 2002 to all foreign exchange (FX) dealing banks in
North America. The survey had two parts: Part I was directed at anyone closely involved with
FX trading. Part II was directed at chief dealers/head traders.
Of the 1,080 questionnaires sent out, 416 were completed. The overall return rate of
38.5 percent compares favorably with return rates of other surveys of foreign exchange
professionals.7 We divide the banks surveyed into two groups: (A) "Top Tier" FX dealing
7 Response rates of 8% and 6% were reported for recent mail surveys conducted with foreign exchange traders in the U.S. (Cheung & Chinn, 2001) and in the UK (Cheung, Chinn & Marsh, 1999). A response rate of 41% was reported for questionnaires distributed to German foreign exchange professionals (Menkhoff, 2001), and an early questionnaire survey conducted among traders in London (Taylor & Allen, 1992) obtained a response rate of 60%. A precursor of the present survey conducted among foreign exchange traders in Europe (Oberlechner & Hocking, 1997) obtained a return rate of 54%.
7

banks, meaning those noted for excellence by some market source; (B) other banks. The
Appendix describes these groups in detail.
The self-developed survey began by assessing a number of personal and professional
attributes, from which we draw the following portrait of our survey participants. About half
(53%) work in New York City, one third work in the U.S. outside New York City, and one
seventh (14%) work in Canada. Three quarters of our participants (73%) work mainly in the
spot market, one third (33%) work in the forward market, one quarter (23%) work with
foreign exchange derivatives, and 6% work in the money market. (These percentages sum to
more than 100% because some traders indicated more than one primary role.) About 6 of 10
participants (59%) are active in the interbank market; 3 of 10 traders (32%) work in foreign
exchange sales; 2 in 10 (20%) are proprietary traders.8
The survey participants tend to be fairly experienced and high-ranking. Their average
work experience in the foreign exchange market is 12 years. Most survey participants are
senior traders (75%); there are smaller groups of junior traders (12%) and treasurers or
foreign exchange managers (12%), and a tiny group of trainees (1%). The largest group of
survey participants is over 41 years old (30%), followed by equally large groups of traders
between 36-40 years of age (27%) and between 31-35 years of age (27%). Smaller groups of
traders were between 26-30 years of age (13%) and less than 25 years old (3%). About 9 of
every 10 respondents are male (88%).
Most participants mainly trade EUR/USD (61%), followed by USD/JPY (42%),
USD/CAD (39%), GBP/USD (30%), and USD/CHF (20%). Three of every ten traders (30%)
report that they mainly trade USD vs. other currencies. Smaller groups of traders focus on
8Salespeople interface with customers, providing them with two-way quotes from interbank traders and taking their orders. Interbank traders only trade with other interbank traders. Their job is to make the spot market by providing two-way quotes, and to speculate at high frequencies. They typically specialize in one major currency pair or a few minor ones. Proprietary traders use the bank’s funds to speculate over relatively long horizons (a few weeks, a few months) in a wide variety of markets.
8

cross-rates not involving the USD: EUR/JPY and EUR/GBP are mainly traded by 11% of
traders each, followed by EUR/CHF (8%). Ten percent of traders mainly trade EUR vs. other
currencies, and five percent mainly trade other currencies than USD or EUR.
II. HUBRIS
This section presents evidence that foreign exchange market participants tend to be
overconfident about their professional success. In psychology, this general phenomenon is
called the “better-than-average effect”; we call it “hubris,” for brevity. The survey asked,
“How successful do you see yourself as an FX trader?” The top rank of 7 was assigned to
“Much more successful than other FX traders;” the bottom rank of 1 was assigned to “Much
less successful than other FX traders.”
Participants’ immediate superiors (i.e., head traders or chief dealers) also ranked the
participants on a seven-point scale. The superiors were asked to consider three separate
measures of performance: “trading potential,” “trading profits,” and “overall contribution to
the organization.” “Trading potential” was defined as the degree to which traders have the
personal making of successful traders in their trading area; head traders were specifically
instructed to separate trading potential from realized profits. “Trading profits” is self-
explanatory. Traders’ overall contributions to the organization were comprehensively defined
to include trading profits and broader factors such as the support of other traders and the
completion of tasks for the whole group (Borman and Motowidlo 1993). These three rating
dimensions were briefly defined and all categories of seven-step rating scales were
individually labeled.
9
We conduct two tests of overconfidence using these evaluations.9 The first test notes
the high fraction of individuals that view themselves as "above average." The second test
focuses on the relation (or lack thereof) between the superiors' ratings and corresponding self-
ratings.
A. Self-Assessments
Our currency market professionals give themselves an average rank of 5.06, or “better
than average,” with standard error of 0.05. This certainly suggests overconfidence, and other
measures provide a consistent picture. Almost three quarters of traders (73.6 percent)
perceive themselves as more successful than other currency traders (Figure 1). Indeed, the
ratio of those perceiving themselves above average (levels 5, 6, and 7) to those perceiving
themselves below average (levels 1, 2, and 3) is an impressive 13.6.
These results are consistent with those for other populations. Svenson (1981), for
example, finds that 93 percent of participating U.S. college students consider themselves to
have better-than-average skill as a driver; the corresponding fraction for Swedish psychology
students was 69 percent. Indeed, “[t]he tendency to view oneself more favorably than the
average person is a staple finding in social psychology” (Alicke et al. 2001, pp. 15-16).
Though these numbers are striking, it remains possible that these self-ratings are not
biased. Most of the traders work at top tier institutions where, presumably, trading skill tends
to be above average. If this explains our result, then traders at lower tier institutions should
generally rate themselves below average. However, the traders at lower tier also exhibit a
heavy preponderance of better-than-average self-ratings (Table 1).
Without statistical significance tests, of course, it is at least conceivable that the high
fraction of above-average ratings could have been generated by chance in a population of
9 Multiple tests are appropriate because more pronounced overconfidence has been found with subjective confidence intervals (Klayman, Soll et al. 1999). West and Stanovich (1997) find both substantial domain specificity in confidence judgments and general overconfidence mechanisms.
10
rational individuals. To address this possibility we do a bootstrap test of the null hypothesis
of no hubris. We first note that there are 246 survey participants with a complete set of
ratings (one from themselves, three from their superior). We assume that the superiors’
ratings conform to the true distribution of ratings.10 We then create 1,000 sets of 246 ratings,
where each rating is drawn at random (with replacement) from the sample of superiors’
ratings. For each set of 246 ratings we calculate the fraction above four and the fraction
below four. Finally, we compare the distribution of each fraction with the corresponding
observed fraction from our 246 survey participants. If an observed fraction is more extreme
than 95% of the 1,000 corresponding fractions in the simulated data, we reject the null
hypothesis of no overconfidence.
Note that these tests are biased towards accepting the null, because the supervisors
themselves tended to rate their subordinates better than average. Average supervisors' ratings
(standard errors) are 4.9 (0.08), 4.5 (0.09), and 4.6 (0.09) for the trading potential, profits, and
overall contribution dimensions, respectively.
Despite this bias, the tests clearly reject the null hypothesis of no overconfidence.
With regard to “trading potential,” not one of the 1,000 sets of simulated ratings had a share
of “above-average” individuals as high as 74.4, the observed fraction for these 246
individualsindeed, the highest observed share was only 70.9 (Table 2). Similarly, not one
of the sets of simulated ratings had a share of “below-average” individuals as low as the
observed fraction of 4.5; the lowest observed share was 23.0. Our conclusions are not
changed if the superiors' ratings for “trading profitability” or “overall contribution” replace
their ratings for “trading potential.” In fact, this consistency is not surprising, given the fairly
high correlations among the three performance ratings. The correlation between trading
10 Note: The test does not assume that superiors correctly rated individual traders. It makes the less restrictive assumption that the distribution of ratings by superiors accurately portrays the distribution of true ratings.
11

potential and trading profits is 0.72; between trading potential and overall contribution is
0.62; between trading profits and overall contribution is 0.58.
B. Self-Assessments versus Superiors’ Assessments
A strong tendency towards hubris is also suggested by differences between traders’
self-assessments and their superiors’ assessments. We first calculate the number of
respondents whose perception of success exceeds that of his superior’s, and the number
whose self-perception falls short of his superior’s. The ratio of the former to the latter1.34
for “trading potential,” 2.2 for “trading profits,” and 1.8 for “overall contribution” is well
above unity.11
These results deserve closer scrutiny before one concludes that they reflect hubris.
Information imperfections would cause some natural dispersion between the performance
ratings of traders and their superiors, even if the respondents did not tend towards hubris. Of
course, this dispersion would tend to be symmetric in the absence of hubris, and our results
show a strong preponderance of over-estimates.
Nonetheless, as a crude statistical test of hubris, we run an ordered probit regression
of traders’ self-evaluations against their superiors' evaluations:
Selfi = α + βProfSupiPot + βPotSupi
Prof + βContSupiCont + εi
Selfi refers to trader i’s self-assessment and SupiX indicates one of the superior’s three
evaluations for trader i, X ∈{trading potential, trading profits, overall contribution}. With
perfect rationality, the true intercept α is zero and the true coefficients sum to unity (βPot +
βProf +βCont = 1).
11The existence of individuals who rate themselves below their superior’s rating could indicate the presence of underconfidence. For a discussion of underconfidence, see Ayton and McClelland (1997), or Kirchler and Maciejovsky (2002), who find simultaneous over- and underconfidence in an experimental asset market.
12

The results from this regression are not appealing to the hypothesis of rationality. The
three coefficients sum to 0.142 rather than unity, and two of the three coefficients are
statistically insignificant (standard errors in parentheses):
Selfi = 1.972 + 0.153 SupiPot + 0.035 Supi
Prof – 0.046SupiCont + εi . (1)
(0.429) (0.079) (0.068) (0.063) Given these results, we were not surprised to find that the actual correlations between
subordinates’ and superiors’ ratings range only from 0.06 (overall contribution) to 0.17
(trading potential).
Why Such Lack of Agreement? The lack of agreement between superiors and
subordinates is impressive. In currency markets, objective performance measures would seem
to be readily available: individuals are given explicit profitability targets, over which they
have significant control. Each individual's realized profit is calculated monthly, and must be
signed by the trader and his superior. In addition, each trader gets an annual performance
review and, separately, an annual bonus with explanation. If individuals are fully rational, the
room for disagreement between superiors and subordinates with regard to profits, at least,
should be fairly small. If the source of disagreement is that traders view "success" as
involving more than just profits, then one would expect their self-ratings to be strongly
correlated with the broader criteria evaluated by their superiorstrading potential or overall
contribution. They are not.
This suggests that there is room for people to interpret the same factual performance
information differently. One source of differences of opinion could be attribution biases, such
as the common tendency to assume that one's own poor performance is due to situational
factors such as bad luck, and that others’ poor performance is due to personal factors such as
low skill (Jones and Nisbett 1972; Zuckerman 1979).12 Blanton, Pelham et al. (2001)
12 Attribution biases are reviewed in Ross and Fletcher (1985).
13
hypothesize that such tendencies might be a product of dissonance reduction, based on the
wish to see oneself as knowledgeable and competent. Indeed, some psychologists believe the
normal human tendency towards attribution bias has been fostered by natural selection, since
such self-deception promotes self confidence which, in turn, contributes to personal and
professional success (Taylor and Brown 1988): "[R]esearch evidence indicates that [hubris],
exaggerated beliefs in control, and unrealistic optimism can be associated with higher
motivation, greater persistence, more effective performance, and ultimately, greater success."
We return to this point in Section IV.
Who is overconfident? The possibility that attribution errors contribute to the apparent
hubris of currency-market professionals gains support from a plot of self-evaluations against
superiors’ evaluation (Figure 2). This looks evenly scatteredexcept for the southwest
quadrant, which is all but empty. That is, the individuals whom the superiors rated below-
average almost never agree that they are below average. The figure would be qualitatively
unchanged if superiors’ ratings for trading potential or overall contribution were used instead
of their ratings for trading profitability.
This tendency for overconfidence to be most pronounced among below-average
traders is supported by a more rigorous analysis (Table 3). (For convenience, we label traders
by their superiors’ rating.) This table confirms that most of the below-average traders
consider themselves above-average; for one performance measure, the fraction of below-
average traders considering themselves above-average actually exceeds the corresponding
fraction for above-average traders. The table highlights two additional observations: First, the
average self-evaluation of below-average traders is only slightly below that of the above-
average traders, and the difference is not significant. Second, the gap between self-ratings and
superiors’ ratings is much wider for below-average traders than for above-average traders.
14

These observations are consistent with the hypothesis that hubris is fostered by
attribution biases: traders with the lowest profits could attribute their bad outcomes to bad
luck; while their superiors attribute their bad outcomes to poor skill. It is even possible that
overconfidence and poor performance both reflect the same low skill set, as suggested by
Kruger and Dunning (1999). They note that, “People tend to hold overly favorable views of
their abilities, in part, because people who are unskilled … suffer a dual burden: Not only do
these people reach erroneous conclusions and make unfortunate choices, but their
incompetence robs them of the metacognitive ability to realize it” (p. 1121).
III. MISCALIBRATION
The survey asked each trader to “enter today’s exchange rates of the Euro, the
Japanese Yen, the British Pound, the Swiss Franc, and the Canadian Dollar against the U.S.
Dollar. Then give your personal forecasts of these exchange rates on December 1, 2002 and
on June 1, 2003. For each currency, give your actual FORECAST and the lower and the
upper LIMIT of a range within which you expect these rates to be with a certainty of 90%.”
This section documents that currency market professionals tend to overestimate the
precision of their exchange-rate forecasts, a form of overconfidence we call "miscalibration,"
following Glaser and Weber (2003). First we provide general evidence of forecast inaccuracy
consistent with this form of overconfidence. Then we show that survey participants'
confidence intervals tended to be narrower than objective benchmarks.
A. Forecast Inaccuracy
Survey participants’ point forecasts and confidence intervals both display inaccuracies
that point towards overconfidence.
1. Inaccuracy in Point Forecasts
15
Extensive econometric evidence shows that, over short horizons, major dollar exchange
rates are well approximated as a random walk process with zero drift.13 Though this suggests
that rational market participants should use the current rate as their point forecast, our survey
respondents rarely did so. Less than four percent of their point forecasts were close to the
prevailing exchange rate (where “close” is defined as within one daily mean absolute basis-
point change, using data from the period January through June 2002). The share close to the
current rate is higher for the December forecasts (5.9 percent) than the June forecasts (1.5
percent), consistent with psychologists' consistent finding that overconfidence rises with task
difficulty (e.g., Langer 1975; Soll 1996; Pulford and Colman 1997).
If traders are rationally choosing point estimates different from the current rate, their
forecasts should be more accurate than the current rate. However, the opposite is true.
Calculating forecast errors as the log difference between the forecast and realized exchange
rates, we find that the currency professionals’ forecasts are less accurate than the no-change
forecast in all but one of the ten separate forecast exercises (five currencies, two horizons),
and the differences are all statistically significant (Table 4). Indeed, on average the traders'
root mean squared forecast error is over twice as large as that of the no-change forecast.
These tests of traders’ point forecasts, while striking, cannot persuasively demonstrate
overconfidence, for two reasons. First, traders’ point forecasts are not independent: traders
frequently discuss likely future currency movements, and the literature that crosses their desk
frequently includes others’ forecasts. Second, traders may feel that using the current rate as
their forecast would be admitting professional inadequacy. For this reason, we turn our
attention to traders' ninety-percent confidence intervals.
2. Confidence Interval Accuracy
13 Economists’ own structural models have been unable to outperform the random walk hypothesis at short- to medium horizons (Meese and Rogoff 1983).
16

Traders' confidence intervals also suggest overconfidence. If traders are rational and if
they generate their confidence intervals independently, roughly one out of every ten
confidence intervals should exclude the realized exchange rate. Instead, 58 percent of the
confidence intervals excluded the realized rates. Consistent with the hypothesis that
overconfidence rises with task difficulty, this figure is 39 percent for the December 1
forecasts and 76 percent for the June 1 forecasts (Table 5). These figures, though striking,
still do not rigorously document overconfidence, because the bounds of each confidence
interval are partly determined by the trader’s point forecasts which, as noted above, are not
independent.
B. Miscalibration
To test overconfidence rigorously we focus on the confidence interval widths. These may
plausibly be interpreted as independent because they are rarely, if ever, discussed by market
participants. It is also useful to focus on confidence interval widths because they relate most
directly to miscalibration, the most familiar form of overconfidence in finance research (e.g.,
De Long et al. 1991; Benos 1997;Odean 1998; Daniel, Hirschleifer and Subramanyam 2001).
We evaluate confidence interval widths of in two ways. First, we examine the share of
confidence intervals that include realized exchange rates, abstracting from the traders’ point
forecasts. Second, we compare the width of participants’ confidence intervals with
objectively accurate widths.
1. Are Confidence Intervals Too Narrow? First Tests
We first re-center each trader’s confidence interval on the market rate at the time the
trader completes the survey, maintaining the log difference between upper and lower bounds.
These alternative confidence intervals are not affected by the inter-trader dependence
associated with point forecasts, but they still capture the ”confidence” with which each trader
17

viewed his/her forecast. We next calculate the share of these new confidence intervals that
exclude the realized exchange rates. Since current market rates would have been better
forecasts, on average, than the traders’ point forecasts, this adjustment should prove favorable
to the rationality hypothesis, and indeed, the overall fraction of confidence intervals
excluding the realized rate does fall. Nonetheless, the results still suggest substantial
overconfidence (Table 5, Panel A), since the fraction falls only from 58 percent to 49 percent.
As a further test, we generate confidence intervals with endpoints that have the same
relation to the current market rate as the original end points had to the original point
forecasts.14 If traders correctly anticipate skewness in the distribution of possible exchange
rates, this adjustment could be yet more favorable to the rationality hypothesis. However, this
adjustment makes very little difference to the results (Table 5, Panel A). The overall share of
confidence intervals excluding realized rates, the “excluded share,” falls only to 46 percent.
Even if all our survey participants were rational, it would still be possible for the
excluded share to differ from ten percent, due to sheer randomness. Thus, we next evaluate
the statistical significance of these results via Monte Carlo simulations.15 For a sample size of
n forecasts, we generate 1,000 samples of n random variables distributed uniformly on the
unit interval. Any individual observation has a ten percent chance of exceeding 0.90: this
corresponds directly to the likelihood that the realized exchange rate is excluded from a given
ninety-percent confidence interval under the null hypothesis of rationality.16 For each of the
1,000 samples we calculate the proportion of these n random variables that exceeds 0.90. The
distribution of these proportions corresponds to the distribution of excluded shares under the
null hypothesis of rationality and independence across traders.
14For example, if the point forecast is 2/3 of the way up from the original lower bound, we set the current exchange rate 2/3 of the way up from the lower bound of the new confidence interval. 15 We could also have evaluated statistical significance parametrically, using the binomial distribution with p = 0.9 and n = number of forecasts. This proved less computationally convenient than Monte Carlo. 16 For example, n = 355 for the December 1 Euro forecast, where 355 is the number of individuals providing point forecasts, confidence intervals, and prevailing exchange rates.
18
This exercise shows that our test results are highly statistically significant. All the
excluded shares associated with the re-aligned confidence intervals differ significantly from
ten percent. Indeed, the highest “excluded share” in all the Monte Carlo tests, 17.6 percent,
falls short of all but one of the reported shares.
2. Are Confidence Intervals Too Narrow? Comparison With Objective Benchmarks
We next compare our participants' confidence interval widths with two objective
benchmarks, one representing the unconditional distribution of exchange-rate returns and one
representing the conditional distribution of returns on each survey’s completion date.
Unconditional Distribution of Returns: To approximate the unconditional distribution
we calculate historical, non-overlapping exchange-rate returns using monthly exchange-rate
data, taken from Datastream, beginning in 1970 for EUR, GBP, and CHF, and in 1978 for
JPY and CAD. We calculate returns for each of eight forecasting horizons. For individuals
completing the survey in July, we take the forecast horizon to be four months for the
December 1, 2002 forecast, and ten months for the June 1, 2003 forecast. For those
completing the survey in August, we take the forecast horizons to be three and nine months;
etc. In total, we examine four horizons for the December forecasts (4-, 3-, 2-, and 1-months),
and four forecast horizons for the June forecasts (10-, 9-, 8- and 7-months). Each sample of
returns ends on the associated survey-completion month (for example, the four- and ten-
month return samples each ended in July of 2002).
From our return samples we find the unconditional ninety-percent confidence
intervals that might have been perceived by our participants as they completed the survey.17
We then find the share of confidence intervals that fall short of these associated objective
17 That is, we find the share of confidence intervals provided in October that fall short of the objective confidence interval associated with 1-month exchange-rate changes; the share of intervals provided in September that fall short of the objective confidence interval associated with 2-month exchange-rate changes, etc.
19
confidence intervals. Note that this test is favorable to the hypothesis of rationality, since the
true forecast horizons generally exceed the forecast horizons from which we calculate
objective confidence intervals. Thus our estimated “objective” confidence intervals should
actually be slightly narrow, making it harder to conclude that the subjective confidence
intervals are too narrow.
Nonetheless, our test results strongly suggest overconfidence. For the December
forecasts, three quarters of the confidence intervals were too narrow; for the June forecasts,
96 percent were too narrow (Table 5, Panel B). These results, which are consistent across
currencies, continue to suggest that overconfidence rises with task difficulty.
Conditional Returns: Since the variance of exchange-rate returns changes over time,
survey participants might have rationally anticipated unusually small exchange-rate variances
when they completed the forecasts in the second half of 2002. To evaluate this possibility we
use GARCH models to estimate the conditional variance of exchange-rate returns at our eight
horizons (1-, 2-, 3-, 4-, 7-, 8-, 9-, and 10-months).18 As noted earlier, each sample of non-
overlapping returns ends in the associated survey completion-month (e.g., July 2002 for 4-
month returns), so we take end-of-sample conditional variance estimates as our “objective”
conditional variances. From these we calculate the associated ninety-percent confidence
intervals, with which we compare the reported confidence intervals.19 The results are quite
similar to those from the previous test and thus strongly suggest overconfidence (Table 5,
Panel B).
Our tests so far assume that each survey participant decides the width of his
confidence intervals completely independently from other participants. We have argued that
this is reasonable because market participants rarely, if ever, discuss confidence intervals. 18 In every case we first tried a GARCH(1,1) model. This converged (in Stata) in 32 of 40 cases. If this failed, we tried a GARCH(2,2) model (converged in five cases), a GARCH(3,3) model (converged in two cases), and finally an ARCH(1) model. 19 The ninety-percent confidence interval for a normal distribution equals 3.29 times the standard deviation.
20

Nonetheless, market participants sometimes do communicate, in vague ways, the amount of
confidence they have in their forecasts, information that is somewhat related to confidence
interval width. If so, rational traders might, in a coordinated fashion, erroneously
underestimate market volatility during some periods and overestimate it during others, with
no overriding tendency towards one or the other.
While we think this possibility is fairly remote, it is still appropriate to examine it
carefully. Thus we next investigate whether, if traders were indeed rational on average, we
would be likely to find so many excessively narrow confidence intervals in any one period.
The test is best illustrated by example. Suppose we are testing confidence intervals for the
December 1 euro forecasts, specifically those provided in July (with a four-month return
horizon). To approximate the distribution across traders of estimated confidence interval
widths, we calculate the difference between each confidence interval width and the mean
width for July-dated surveys, di = widthi-meanwidth. To approximate the distribution of
rational confidence interval widths, we assume that the true distribution of return variances is
well approximated by the historical estimated variance series from our GARCH regressions
for four-month returns. Each variance provides an associated 90 percent confidence interval.
We create simulated 1,000-period histories of true and estimated confidence intervals.
For each period t we first sample the GARCH variances (with replacement) to create a “true”
variance, VtT, and create an associated “true” ninety-percent confidence interval width, CIt
T =
TtV29.3 . We also construct n “estimated” confidence interval widths, where n equals the
number of survey responses in a given month (e.g., n = 262 for December 1 forecasts for the
euro submitted in July). We assume that people know the true distribution of variances and
that their variance estimates are unbiased but uncorrelated with the true variance.
21

We generate a market-average estimate of the true conditional variance, VtM, by
sampling (with replacement) from the GARCH historical variances. This provides an
associated market-average estimated ninety-percent confidence interval width, CItM =
MtV29.3 . Finally, we generate a set of n individual estimated confidence interval widths,
CIetj, j = 1, … n, by sampling (with replacement) one of the width-deviations, jd~ , and adding
it to the market-average width: CIetj = j
Mt dCI ~
+ .
For each of the 1,000 periods in a given history, we calculate the share of individual
confidence interval widths that falls short of the “true” width, CItT. The distribution of these
shares should represent the true distribution of shares under the joint null hypothesis that
individuals’ estimated confidence interval widths are unbiased and uncorrelated with the true
confidence interval widths.
We only carry out this test for surveys completed in July and September, since very
few were completed in August and October. We do the test separately by currency and by
forecast date (December, June), since any combined test would also involve arbitrary
assumptions. Note that the test should be favorable to the hypothesis of no overconfidence,
because we assume zero correlation between true and average-estimated variances. Since
volatility is fairly predictable, it would be more accurate to assume that market-average
estimates are positively correlated with true variances. However, implementing such a model
would necessarily involve arbitrary assumptions, making it more difficult to interpret the
results of the test.
The tests indicate that our survey participants tended to be significantly overconfident
in their December forecasts (Table 6); for this forecast date we can reject the joint null
hypothesis at the five percent level or better for eight of the ten tests, and we can reject it at
the ten percent level in one more test. Results for the June forecasts are muddy. We can reject
22
the null at standard significance levels in only four of the ten cases, but our failure to reject in
the other cases often appears to be due to low power. For example, we cannot reject the joint
null for Euro confidence intervals for June submitted in September, even though 100 percent
of those confidence intervals were too narrow according to the GARCH measure.
IV. SOURCES AND CONSEQUENCES OF OVERCONFIDENCE
We have so far documented that two forms of overconfidence seem pervasive among
currency market participants: hubris, a tendency to overestimate one's professional success,
and miscalibration, a tendency to overestimate the precision of one's forecasts. We next
examine possible sources and consequences of overconfidence.
The analysis is based on two stage least squares regressions among measures of
individual overconfidence and various individual descriptors from the survey. The thirteen
factors we take to be exogenous are: age, gender, responsibility for sales, responsibility for
interbank trading, responsibility for proprietary trading, whether the bank is based in a major
developed country, whether the individual trades in the spot market, whether the individual
trades in New York City, whether the individual primarily trades currency pairs involving the
U.S. dollar, number of trades per day, number of seconds between trades on a busy day, and
number of seconds between trades on a quiet day. The six factors we take to be endogenous
are: hubris, miscalibration, institutional rank, trading profits as rated by superiors, years of
trading experience, and position limit.20
An individual’s hubris is measured as the difference between his self-rating and a
composite measure of his performance based on the three ratings assigned by his superior.21
20 Ordered probit regressions were used for Rank and Position Limit, which are ordinal variables. A tobit regression was used for Trading Experience, which is censored below 0. 21 This measure effectively assumes that superior’s ratings are more objectively accurate than those of their subordinates. Indeed, since the ratings of superiors and their subordinates are so little correlated, at most one of them can reasonably be assumed to be correlated with “objective truth.” We choose superiors’ ratings for this role since their average rating is closer to the theoretical mean of 4.0. Though this seems the best available
23
Our composite measure is the predicted value from the ordered probit regression
incorporating all three performance measures (equation (1)). If we label the individual's
performance evaluation "P" and the predicted performance measure PT (for true
performance), then hubris, H, is simply the difference: H = P - PT.
An individual’s miscalibration is measured as the average of his ten di’s. To review,
each di represents the differences between one of his ten confidence interval widthsfive
currencies, December and June forecast datesand the average confidence interval width for
the same currency-horizon pair, with that average taken over everyone who completed the
survey the same month.22
Perhaps surprisingly, hubris and miscalibration appear to be unrelated. The correlation
between these two confidence measures, at –0.03, is statistically and economically
insignificant. Likewise, neither measure surfaces as a significant explanatory variable for the
other in the two-stage least squares analysis reported below. This is consistent with evidence
in Glaser and Weber (2003), who also find little relationship between hubris and
miscalibration.23
A. Determinants of Overconfidence
Hubris: According to our analysis, the factors most closely related to hubris are
gender, professional responsibilities, and position limit (Table 7). Men appear to be more
confident about their professional success than women, other things equal. Indeed, their
measure of overconfidence, we are aware that superiors will never be perfectly accurate in assessing their subordinates, given well-documented tendencies such as attribution bias. 22 The self-selection process through which individuals decide to become traders could induce some bias in our estimates, to identify which we would ideally estimate a Heckman selection model (Greene 1997). However, this is not feasible since individual data do not exist for the relevant criteria, which include a high risk tolerance, high competitiveness, and facility with numbers. 23 It is worth noting, however, that Glaser and Weber's (2003) measure of hubris does not have objective benchmarks for performance. They compare a person's self-rating with the average rating.
24

overconfidence is 1.67 standard deviations higher, on average, than that of women. This is
consistent with much research on overconfidence (Lenney 1977).
Our results suggest that position limits have a strong influence on hubris. At the mean
of all variables, a one-standard-deviation rise in position limit appears to raise hubris by 80
percent of a standard deviation. Position limits may affect hubris through the way people tend
to assume that their good outcomes reflect skill and their bad outcomes reflect misfortune ,
another aspect of attribution bias (Ross and Fletcher 1985). Since position limits are common
knowledge on trading floors, we infer that hubris is influenced by external marks of success.
We also find that hubris is lower, on average, among sales-people than among
interbank traders and proprietary traders. It might be remarked that this is consistent with the
common opinion of traders in the market (though outsiders might be more likely to associate
hubris with salespeople). However, it is more relevant to note the importance of hubris to
currency trading. Every day, every hour, traders lose money (of course, they also frequently
make money). It takes a strong emotional constitution just to survive, even more to thrive,
when meaningful setbacks occur so frequently.
The traders’ own comments confirm that hubris is key to successful trading. The
trading manager of one of the world’s leading foreign exchange institutions stated; “if you are
not that self-confident, you are not going to be a good trader.” In the words of other trading
experts, “one thing that all good traders are is they are confident in their own ability that they
are making the right decisions”; “it’s a confidence, … a certain amount of ego.”
Hubris is key because it permits traders to operate with conviction. “[T]he ability to
gather conviction, to be decisive about something that most other people would not [….] and
the willingness to take the risk when others, when it’s not conventional wisdom” are critical
to success, according to one senior foreign exchange manager interviewed for this research.
As another senior trading expert stressed, traders need “strong confidence in themselves even
25
though the market goes against them, [and to] have their own strong belief in their own
scenarios.”
By allowing traders to establish and maintain this kind of self-confidence, hubris may
help traders to cope with the potentially negative psychological impact of losses. Only
optimistic and self-confident traders can survive in a decision-making environment that
confronts them with discouraging and stressful situations every day. As another senior
trading expert remarked, “When you are in the trough, you have to come out of it very
quickly because if you get caught it in, it’s going to affect you.” As noted earlier, hubris
fosters determination and perseverance.
Miscalibration: Among the variables considered here, miscalibration appears to be
most strongly related to the nature of one’s professional responsibilities and to gender (Table
7). Proprietary traders are least prone to miscalibration, interbank traders are more prone, and
salespeople are the most prone. This result is economically significant: it implies that
proprietary traders' confidence intervals are over three percentage points wider, on average,
than those of salespeople, a difference that represents a substantial fraction of the average 5
percentage point gap between average and objectively-accurate conditional confidence
intervals. Note that, despite their relative accuracy, proprietary traders do not achieve
absolute accuracy (Table 8).24
The significance of professional responsibilities points to the importance of task-
relevant feedback: the hierarchy of accuracy reflects the relative amounts of task-relevant
feedback available to each group, and feedback has been shown to reduce overconfidence
(e.g., Arkes, Christensen et al. 1987). Proprietary traders regularly take positions for weeks or
months, so they get a substantial amount of direct, meaningful feedback on their success at
24 Indeed, the average ratio of proprietary traders' RMS forecast errors to the errors associated with the no-change forecast is the same number, 2.4, as the ratio for all survey participants.
26
multi-month forecasting (did I make money on this trade?). Interbank traders rarely hold
positions for more than one night; thus, they get feedback on forecasts, but those forecasts are
typically for much shorter horizons than those requested by the survey. Salespeople generally
do not take positions, and need not make forecasts at all; thus, salespeople need not get
meaningful feedback on exchange-rate forecasts at any horizon.
Our finding that men have a weaker tendency than women towards miscalibration
might seem surprising, since we have already noted that men have a stronger tendency
towards hubris, and it is generally noted that men are more overconfident than women. Since
our regression already controls for professional responsibilities, it cannot be argued that
men’s apparently lower miscalibration simply reflects the low share of women among
proprietary and interbank traders. Nonetheless, our finding is consistent with existing
research showing that gender differences in overconfidence are strongly task-dependent (e.g.,
Lundeberg, Fox, and Puncochar 1994). Lenney (1977) finds that if feedback is “unequivocal
and immediately available, women do not make lower ability estimates than men.” Feedback
about the currency forecasts of our survey participants is relatively clear—either your trades
make money, or they don’t—and frequent, since their positions rarely last more than a few
hours or days.25
Our findings regarding gender and overconfidence suggest that hubris, and not
miscalibration, may explain why excess retail stock trading is higher among men than women
(Barber and Odean 2001). The same conclusion is indicated by Glaser and Weber (2003),
who surveyed investors using an online brokerage service in Germany. They find that trading
volume is not correlated with miscalibration, despite the predictions of standard models that
25 Some existing research might be misinterpreted to suggest that men should be more overconfident in currency forecasting: Prince (1993), for example, finds that men are more overconfident in general financial matters. However, while this finding could explain why women are less likely than men to enter the world of finance, it could well be irrelevant among those that self-select to join that world.
27

miscalibration should lead to higher trading (Odean 1998). Instead, they find that trading
volume is positively correlated with their measure of hubris.
Why would hubris bring higher trading volume? One possible connection works
through the known positive connection between hubris and risk tolerance (Larwood and
Whittaker 1977). As noted by Taylor and Brown (1988): "A chief value of these illusions [of
personal skill] may be that they can create self-fulfilling prophecies. They may help people
try harder in situations with objectively poor probabilities of success. … [A]lthough some
failure is inevitable, ultimately these illusions will pay off more often than will lack of
persistence." Our interpretation of Barber and Odean's research suggests that, though the
extra risk tolerance from hubris may be useful if individuals direct their extra trading towards
sources of true risk-adjusted excess returns, it is costly otherwise.
Hubris might affect trading volume in more than one way. Another possible
connection between hubris and trading volume, suggested by Glaser and Weber (2003),
works through differences of opinion. As noted by Shiller (1999), people who think more
highly of themselves may be more inclined to hold independent opinions. "Apparently, many
investors do feel that they do have speculative reasons to trade often, and apparently this must
have to do with some tendency for each individual to have beliefs that he or she perceives as
better than others' beliefs. It is as if most people think they are above average" (p. 1322-
1323). The fact that differences of opinion can generate high trading volume has been the
focus of research by Varian (1985, 1989), Harris and Raviv (1993), and Kandel and Person
(1995). Note, however, that this logic would seem to predict a connection between average
hubris and average trading volume, rather than between an individual's own hubris and
trading volume, as suggested by Glaser and Weber.
28

B. Overconfidence and Professional Success
We next examine how overconfidence influences professional success. As noted
earlier, this analysis is based on second-stage regressions in which individuals' trading
profits, rank, and trading experience are regressed on exogenous variables plus first-stage
instruments for the two overconfidence measures.26
The economics literature suggests at least three channels through which
overconfidence could affect professional success, all of which would work through profits.
First, overconfidence-induced excess trading could reduce profits by raising transaction costs
(Barber and Odean 2000, 2001). For professional currency dealers, this effect is likely to be
small since transactions costs are negligible. Interdealer spreads in the major liquid currency
markets average only a few points, on the order of 0.03 percent (Hau, Killeen, and Moore
2002); by contrast, Barber and Odean’s retail stock traders (2000) paid an average of three
percent in commissions plus one percent in spreads for round-trip trades.
Second, excess trading could increase profits by increasing risk-bearing (DeLong et
al. 1991). This effect could also be small for professional currency dealers, since empirical
research on liquid currency markets has been unable to identify a strong, consistent return to
risk bearing. Even in stock markets, where a consistent risk-return relationship may exist,
higher trading has not been found to bring greater returns before transactions costs (Barber
and Odean 2000). Thus, this second effect may not be substantial for our survey participants.
Third, overconfident traders could gain advantage strategic advantages from their aggressive
trading style (Kyle and Wang 1997, Benos 1998). Given the highly competitive nature of
currency markets, it seems unlikely that there are substantial potential gains from
aggressiveness. 26 The interconnections among these variables are sufficiently complex that it would be appropriate to solve the model as a full simultaneous system. However, given the discrete nature of some of the endogenous variables, no rigorous solution exists for this estimation problem.
29

Psychology research suggests that overconfidence may positively affect professional
success through at least two channels. First, overconfidence may enhance self-esteem, which
in turn is associated with many successful qualities:
"Considerable research evidence suggests that overly positive self-evaluations ... are characteristic of normal human thought. Moreover, these illusions appear to promote ... the ability to engage in productive and creative work. ... Positive illusions may ... facilitate some aspects of intellectual functioning by means of positive mood ... Positive affect can facilitate the use of efficient, rapid problem-solving strategies; ... positive affect appears to facilitate the association of multiple cues with encoded information, thus creating a more cognitively complex mental environment for making judgments and decisions ... Positive affect facilitates unusual and diverse associations that may produce more creative problem solving ... Positive conceptions of the self are associated with working harder and longer on tasks ... ; perseverance, in turn, produces more effective performance and a greater likelihood of goal attainment ..." (Taylor and Brown 1988).
Second, overconfidence may generate more positive opinions about oneself in others (Trivers
1985). When those others are one's superiors, this can spur professional advancement.
Neither of these psychological channels requires overconfidence to affect profitability.
Overconfidence could also affect professional success through its influence on other
dimensions of performance, such as one’s ability to support a team effort, to organize things,
or to motivate others.
Profitability: Our results suggest that profitability is independent of overconfidence
(Table 9A). As discussed above, this is plausible for currency market professionals, though it
may not generalize to other markets. Profitability does seem determined by gender and
competitive forces. Men appear to be less profitable than women, on average: other things
equal, the likelihood that a man is in the top three profitability levels (out of seven such
levels) is 14 percentage points below the corresponding likelihood for a woman. In addition,
profitability seems to be lower for traders located in New York City and for spot traders. This
may reflect the relatively high level of competition in both settings. Note, however, the
fragility of the statistical significance of gender and location.
30

Rank: Rank appears to be promoted by both types of overconfidence, and also rises
with age (Table 9B). At the mean of all variables, raising one’s hubris by one standard
deviation (roughly one point) raises one’s chance of being senior trader or chief dealer by 3
percentage points, and reduces one’s chance of being a junior trader by 5 percentage points.
Raising one’s miscalibration by one standard deviation raises one’s likelihood of being either
a senior trader or chief dealer by 11 percentage points, and reduces one’s likelihood of being
a junior trader by 13 percentage points. Being five years older raises the likelihood that one is
a senior trader or chief dealer by 11 percentage points, and reduces the likelihood that one is a
junior trader by 11 percentage points.
Trading Experience: Miscalibration and age also appear to have a positive influence
on trading experience (Table 9B). At the mean of all variables, a one standard deviation rise
in miscalibration would be associated with 3.3 more years of trading experience; being five
years older would be associated with 4.3 more years of trading experience.27
The positive influence of overconfidence on rank and trading experience is consistent
with the predictions of psychology. As noted earlier, overconfidence may enhance the
personal qualities necessary for professional success and it may raise the opinions of people
with power over promotion and survival. There may also be self-selection for overconfidence
in currency markets, a kind of "sleep-well-at-night" effect. Those with less confidence may
find the frequent setbacks and tumultuous nature of currency trading so emotionally
unpalatable that they leave the business altogether.
Whatever its source, the positive association between overconfidence and overall
professional success suggests that overconfidence will not naturally disappear from currency
markets. To the contrary, it suggests that the most rational/realistic people—those with least 27 Could the coefficients of overconfidence in the rank and trading experience regressions be biased by the exclusion of people forced to leave the business because of outright failure? Probably not. If overconfidence generates this type of survivorship bias, one would expect it to be negatively related to profitability; however, we find no relationship between overconfidence and profits.
31

overconfidence—tend to leave the market, whether through outright failure or personal
preference. This contrasts sharply with Friedman’s well-known prediction (1953) that the
least rational traders will eventually be weeded out of the market by their lack of profitability.
It also indicates that any consequences of overconfidence for exchange rate dynamics may be
permanent.
V. CONCLUSION
Overconfidence may be related to at least seven features of international markets: 1.
forward bias; 2. the high volatility of floating exchange rates and “fear of floating; 3. the
short-term predictability of exchange-rate trends; 4. surges and sudden stops in international
capital flows; 5. apparent speculative bubbles in exchange rates; 6. high levels of interbank
trading; 7. high kurtosis of exchange-rate returns. This paper provides evidence that two
types of overconfidence are prevalent in currency markets, and that overconfidence may be a
self-sustaining feature of such markets. The analysis is based on a survey of 416 North
American currency market professionals completed in 2002.
The first type of overconfidence is hubris, a tendency to overestimate one's
professional success. Three quarters of our survey participants rate themselves “above
average”; bootstrap tests permit us to reject the hypothesis that this is consistent with
rationality. In addition, we document that traders’ self-evaluations typically exceed
corresponding evaluations by their superiors, and that this “overconfidence” is concentrated
among the traders rated “below average” by their superiors.
We also document a strong tendency towards overestimating the precision of currency
forecasts. Our first measure is a heuristic one: the rarity with which currency professionals
chose to use the current rate as their point forecast. More rigorous tests are based on the
ninety-percent confidence bands which the survey participants provided for five currencies at
32

two future dates. We find that most participants' confidence bands were too narrow relative to
objective measures.
We also examine sources of overconfidence. Miscalibration is stronger for more
difficult tasks and can be mitigated by task-relevant feedback. Hubris rises with overt signals
of professional success, and is higher for interbank and proprietary traders than for currency
salespeople. Finally, we find that men appear to have more hubris than women, but are less
prone to underestimating uncertainty. Hubris tends to be associated with greater risk
tolerance, so these results raise the possibility that hubris and high risk tolerance, rather than
miscalibration and misperceived risk, may be the source of men's stronger tendency towards
excess equity trading (Barber and Odean 2001).
Finally, we analyze the consequences of overconfidence for professional success
among currency market professionals. We find that overconfidence does not affect their
profitability. This result may initially seem inconsistent with existing research, which
suggests that overconfidence could reduce profits by inducing excess trading costs (Odean
1998) or raise profits by inducing excess risk-bearing (De Long et al. 1991). However, there
is no inconsistency since the result applies to currency markets, where professionals’
transactions costs are negligible and risk is not clearly related to return.
We also find that overconfidence tends to enhance broader measures of professional
success, specifically rank and trading experience. This result is consistent with psychology
research, which shows that confidence enhances many qualities useful for professional
success, including mental facility and perseverance. We conclude that overconfidence may be
self-sustaining in currency markets, and its consequences for exchange rate dynamics—if
any—may be permanent.
33

REFERENCES
Alicke, Mark D., Debbie S. Vredenburg, Matthew Hiatt, and Olesya Govorun (2001), “The ‘Better Than Myself Effect,’” Motivation and Emotion 25: 7-22.
Alpert, M., and H. Raiffa (1959), “A Progress Report on the Training of Probability Assessors,” Reprinted in D. Kahneman, P. Slovic, and A. Tversky (eds.), Judgment Under Uncertainty: Heuristics and Biases (Cambridge University Press 1982).
Arkes, H. R., C. Christensen, et al. (1987). "Two methods of reducing overconfidence." Organizational Behavior & Human Decision Processes 39(1): 133-144.
Ayton, P. and A. G. R. McClelland (1997). "How real is overconfidence?" Journal of Behavioral Decision Making 10(3): 279-285.
Bank for International Settlements (2002), Triennial Central Bank Survey of Foreign Exchange and Derivatives Market Activity in 2001 (Basle).
Barber, B. M. and T. Odean (2000). "Trading Is Hazardous to Your Wealth: The Common Stock Investment Performance of Individual Investors." Journal of Finance 55(2): 773-806.
Barber, B. M. and T. Odean (2001). "Boys will be boys: Gender, overconfidence, and common stock investment." The Quarterly Journal of Economics 116(1): 261-292.
Barber, B.M., and T. Odean (2002), “Online Investors: Do the Slow Die First?” Review of Financial Studies 15: 455-87.
Barberis, Nicholas, and Richard Thaler (2002), “A Survey of Behavioral Finance,” NBER Working Paper No. 9222.
Bar-Tal, Y., A. Sarid, et al. (2001). "A Test of the Overconfidence Phenomenon Using Audio Signals." Journal of General Psychology 128(1): 76-80.
Baumann, A. O., R. B. Deber, et al. (1991). "Overconfidence Among Physicians and Nurses: The 'Micro-Certainty, Macro-Uncertainty' Phenomenon." Social Science & Medicine 32(2): 167-174.
Benos, Alexandros V., “Overconfident Speculators in Call Markets: Trade Patterns and Survival,” Journal of Financial Markets 1: 353-83.
Biais, Bruno, Denis Hilton, Karine Mazurier and Sebastien Pouget, “Psychological Traits and Trading Strategies,” Mimeo, Toulouse University. Presentation.
Blanton, H., B. W. Pelham, et al. (2001). "Overconfidence as dissonance reduction." Journal of Experimental Social Psychology 37(5): 373-385.
Borman, W. C. and S. J. Motowidlo (1993). Expanding the Criterion Domain to Include Elements of Contextual Performance. Personnel selection in organizations. N. Schmidt and W. C. Borman. San Francisco, Jossey-Bass: 71-98.
Bradley, J. V. (1981). "Overconfidence in Ignorant Experts." Bulletin of the Psychonomic Society 17(2).
Calvo, Guillermo A., and Carmen M. Reinhart (2002), “Fear of Floating,” Quarterly Journal of Economics 117: 379-408.
34

Campbell, John Y., and Robert J. Shiller (1988), “Stock Prices, Earnings, and Expected Dividends,” Journal of Finance 43: 661-676.
Cavaglia, Stefano M.F.G, Willem F.C. Verschoor, and Christian C.P. Woolf (1994), “On the Biasedness of Forward Foreign Exchange Rates: Irrationality or Risk Premia?” Journal of Business, 67: 321-343.
Cheung, Yin-Wong, and Menzie David Chinn (2001), “Currency Traders and Exchange-Rate Dynamics: A Survey of the U.S. Market,“ Journal of International Money and Finance 20: 439-471.
Cheung, Yin-Wong, Menzie D. Chinn, Ian W. Marsh (2000), “How Do UK-Based Foreign Exchange Dealers Think Their Market Operates?“ NBER Working Paper 7524.
Daniel, K., D. Hirshleifer, et al. (1998). "Investor Psychology and Security Market Under- and Overreactions," Journal of Finance 53: 1839-85.
Daniel, Kent D., David Hirshleifer, and Avanidhar Subrahmanyam (2001), “Overconfidence, Arbitrage, and Equilibrium Asset Pricing,” Journal of Finance 56: 921-965.
De Bondt, W., and R. Thaler, (1985), “Does the Stock Market Overreact?” Journal of Finance 40: 793-808.
DeLong, J. Bradford, Andrei Shleifer, Lawrence H. Summers, Robert J. Waldmann (1991), “The Survival of Noise Traders in Financial Markets,” Journal of Business 64: 1-19.
Dunning, D., D. W. Griffin, et al. (1990). "The Overconfidence Effect in Social Prediction." Journal of Personality & Social Psychology 58(4): 568-581.
Dunning, D. and A. L. Story (1991). "Depression, Realism, and the Overconfidence Effect: Are the Sadder Wiser When Predicting Future Actions and Events?" Journal of Personality & Social Psychology 61(4): 521-532.
Engel, Charles (1996), “The Forward Discount Anomaly and the Risk Premium: A Survey of Recent Evidence,” Journal of Empirical Finance 3: 123-192.
Evans, George (1984), “A Test for Speculative Bubbles in the Sterling-dollar Exchange Rate: 1981-84,” American Economic Review 76: 621-636.
Felson, R.B. (1984), “The Effect of Self-Appraisals of Ability on Academic Performance,” Journal of Personality and Social Psychology 47: 944-952.
Flood, Robert P., and Andrew K. Rose (1995), “Fixing Exchange Rates: A Virtual Quest for Fundamentals,” Journal of Monetary Economics 36: 3-37.
Frankel, Jeffrey A., and Kenneth A. Froot (1987), “Using Survey Data to Test Standard Propositions Regarding Exchange Rate Expectations,” American Economic Review 77: 133-153.
Friedman, Milton (1953), Essays in Positive Economics (University of Chicago Press, Chicago).
Froot, Kenneth A. and Jeffrey A. Frankel (1989), "Forward Discount Bias: Is It an Exchange Risk Premium?" Quarterly Journal of Economics: 139-161.
Froot, Kenneth A. and Thaler, Richard H (1990), "Anomalies: Foreign Exchange," Journal of Economic Perspectives 4: 179-192.
Glaser, Markus, and Martin Weber (2003), "Overconfidence and Trading Volume," Universitat Mannheim Working Paper.
35

Golec, J. T., Maurry (1995). "Do Bettors Prefer Long Shots because They Are Risk-Lovers, or Are They Just Overconfident?" Journal of Risk & Uncertainty 11(1): 51-64.
Goodman, Stephen H. (1979), “Foreign Exchange Rate Forecasting Techniques: Implications for Business and Policy,” Journal of Finance 34: 415-427.
Greenwald, A.G. (1980), “The Totalitarian Ego: Fabrication and Revision of Personal History,” American Psychologist 35: 603-618.
Harris, Milton, and Artur Raviv (1993), "Differences of Opinion Make a Horse Race," Review of Financial Studies, 6: 473-506.
Hau, Harald, William Killeen, and Michael Moore, (2002), “Euro’s Forex Role: How has the Euro Changed the Foreign Exchange Market?” Economic Policy (April): 150-177.
Hodrick, Robert J (1987) The Empirical Evidence on the Efficiency of Forward and Futures Foreign Exchange Markets. (Chur, Switzerland: Harwood Academic Publishers).
Jegadeesh, Narasimhan, and Sheridan Titman (1993), "Returns to Buyuing Winners and Selling Losers: Implications for Stock Market Efficiency,” Journal of Finance 48: 65-91.
Jegadeesh, Narasimhan, and Sheridan Titman (2001), "Profitability of Momentum Strategies: An Evaluation of Alternative Explanations," Journal of Finance 56: 600-720.
Jones, E.E., and R.E. Nisbett (1972), "The Actor and the Observer: Divergent Perceptions of the Causes of Behavior," in E.E. Jones, D.E. Kanouse, H.H.Kelley, R.E. Nisbett, S. Valins, and B. Weiner (Eds.), Attribution: Perceiving the Causes of Behavior (Morristown, NJ: General Learning Press).
Kandel, Eugene, and Neil D. Pearson (1995), "Differential Interpretation of Public Signals and Trade in Speculative Markets," Journal of Political Economy, 103: 831-872.
Klayman, J., J. B. Soll, et al. (1999). "Overconfidence: It Depends on How, What, and Whom You Ask." Organizational Behavior & Human Decision Processes 79(3): 216-247.
Kruger, Justin, and David Dunning (1999), “Unskilled and Unaware of It: How Difficulties in Recognizing One’s Own Incompetence Lead to Inflated Self-Assessments,” Journal of Personality and Social Psychology, 77: 1121-1134.
Kyle, Albert S., and F. Albert Wang, “Speculation Duopoly with Agreement to Disagree: Can Overconfidence Survive the Market Test?” Journal of Finance 52: 2073-2090.
Langer, E.J. (1975), “The Illusion of Control,” Journal of Personality and Social Psychology 32: 311-328.
Larwood, L., and W. Whittaker (1977), “Managerial Myopia: Self-Serving Biases in Organizational Planning,” Journal of Applied Psychology 62: 194-198.
Laury, Susan K., and Charles A. Holt (2000), “Further Reflections on Prospect Theory,” Mimeo, University of Virginia.
Lenney, Ellen (1977), “Women’s Self-Confidence in Achievement Settings,” Psychological Bulletin 84: 1-13.
Lewinsohn, P.M., W. Mischel, W. Chaplin, and R. Barton (1980), "social Competence and Depression: The Role of Illusory Self-Perceptions," Journal of Abnormal Psychology 89: 203-212.
36
Lewis, Karen K (1995), “Puzzles in International Financial Markets,” in G. Grossman and K. Rogoff (eds.), Handbook of International Economics, Vol. III (Elsevier Science): 1913-1971.
Levich, R, and Thomas, L. (1993), “The significance of Technical Trading Profits in the Foreign Exchange Market: A Bootstrap Approach,” Journal of International Money and Finance 12: 451-474.
Lundeberg, Mary A., Paul W. Fox, Judith Puncochar (1994), “Highly Confident but Wrong: Gender Differences and Similarities in Confidence Judgments,” Journal of Educational Psychology 86: 114-121.
Lyons, Richard K. (1995), “Tests of Microstructural Hypotheses in the Foreign Exchange Market,” Journal of Financial Economics 39: 321-351.
Lyons, Richard K. (1996), “Foreign Exchange Volume: Sound and Fury Signifying Nothing?” in Jeffrey A. Frankel, Giampaolo Galli, and Alberto Giovannini (eds.), The Microstructure of Foreign Exchange Markets (University of Chicago Press): 183-201.
MacDonald, Ronald (2000), "Expectations Formation an;d Risk in Three Financial Markets: Surveying What the Surveys Say," Journal of Economic Surveys 14: 69-100.
Menkhoff, Lukas (2001), “Short-Term Horizons in Foreign Exchange? Survey Evidence from Dealers and Fund Managers,” Kyklos 54: 27-48.
Murphy, Allan H., and robert L. Winkler (1984), "Probability Forecasting in Meteorology," Journal of the American Statistical Association 79: 489-500.
Nicolson, A., Ed. (2002), Société Générale Dealers Directory 2002 (London, Société Générale).
Odean, T. (1998). "Volume, Volatility, Price, and Profit: When All Traders Are Above Average," Journal of Finance 6(53): 1887-1934.
Oskamp, S. (1965). "Overconfidence in Case-Study Judgments." Journal of Consulting Psychology 29(3): 261-265.
Osler, Carol L. (2002), “Currency Orders and Exchange-Rate Dynamics: Explaining the Success of Technical Analysis," Journal of Finance 58: 1791-1819.
Osler, Carol L., and Tanseli Savaser (2004), “Currency Orders and Exchange-Rate Kurtosis,” Mimeo, Brandeis International Business School.
Pulford, B. D. and A. M. Colman (1997). "Overconfidence: Feedback and Item Difficulty Effects." Personality & Individual Differences 23(1): 125-133.
Ross, Michael, and Garth J.O. Fletcher (1985), “Attribution and Social Perception,” In G. Lindzey and E. Aronson (Eds.), The Handbook of Social Psychology 3rd Edition (Reading, Massachusetts: Addison-Wesley).
Shiller, Robert (1999), "Human Behavior and the Efficiency of the Financial System," in J.B. Taylor and M. Woodford, ed.: Handbook of Macroeconomics (Elsevier Science): 1305-1340.
_________ (2000), Irrational Exuberance (Princeton University Press, Princeton NJ).
Skinner, D.J., and R.G. Sloan (1999), “Earnings Surprises, Growth Expectations, and Stock Returns, or Don’t Let an Earnings Torpedo Sink Your Portfolio,” University of Michigan Business School Working Paper.
37

Soll, J. B. (1996). "Determinants of Overconfidence and Miscalibration: The Roles of Random Error and Ecological Structure." Organizational Behavior & Human Decision Processes 65(2): 117-137.
Svenson, Ola (1981), "Are We All Less Risky and More Skillful Than Our Fellow Drivers?" Acta Psychologica 47: 143-148.
Taylor, Mark, and Helen Allen (1992), “The Use of Technical Analysis in the Foreign Exchange Market,” Journal of International Money and Finance 11: 304-314.
Taylor, Shelley E., and Jonathon D. Brown (1988), "Illusion and Well-Being: A Social Psychological Perspective on Mental Health," Psychological Bulletin 103: 193-210.
Trivers, R. (1985), Social Evolution (Benjamin/Cummings, Menlo Park).
Varian, Hal R. (1985), "Divergence of Opinion in Complete Markets: A Note," Journal of Finance 40: 309-317.
__________ (1989), "differences of Opinion in Financial Markets," in Courtenay C. Stone, ed.: Financial Risk: Theory, Evidence, and Implications (Kluwer): 3-37.
West, R. F. and K. E. Stanovich (1997). "The domain specificity and generality of overconfidence: Individual differences in performance estimation bias." Psychonomic Bulletin & Review 4(3): 387-392.
Yates, L. Frank, Judgment and Decision Making (1990, Prentice Hall: Englewood Cliffs, New Jersey).
Zuckerman, M (1979), "Attribution of Success and Failure Revisited, or: The Motivational Bias is Alive and Well in Attribution Theory," Journal of Personality 47: 245-287
38

APPENDIX: "Top" and "Lower" Tier Foreign Exchange Dealing Banks
Top Tier: Leading North American foreign exchange dealing banks. The 26 banks in
this category were defined as institutions included at least one of the following lists: (i)
membership in on the New York Foreign Exchange Committee in 2001 and/or 2002; (ii) the
top 10 institutions of the Best Provider of FX Services Overall annual ranking published by
Global Investor Magazine in March 2001 and/or March 2002; (iii) the top 10 institutions of
the Global Top 50 Foreign Exchange Market Companies by Estimated Market Share annual
ranking published by Euromoney Magazine in May 2001; (iv) the top 10 institutions of the
annual Best Bank Overall for FX Dealing ranking published by FX Week in December 2001;
(v) the top 10 institutions in the Annual Ranking of Banks’ FX Revenues 2001 published by
FX Week in December 2001.
North American trading floors of the resulting 26 institutions were contacted and
invited to participate in the study. Twenty-one of these trading floors agreed to participate
fully, resulting in an institutional participation rate of 81% of the leading market participants.
Of 551 questionnaires sent to these 21 trading floors, 326 were returned, an individual
questionnaire return rate of 60%.
Lower Tier: Other foreign exchange dealing banks in North America. These are
defined as all other foreign exchange banking institutions in the U.S. and in Canada listed in
Societe Generale's Dealer Directory (Nicolson 2002). Foreign exchange traders at these
institutions were sent questionnaires by mail. Of 529 questionnaires sent to banks in this
group, 90 were returned, resulting in a questionnaire return rate of 17% for this group.28
28 The participation rate among lower tier banks is below that of the top tier banks, but still higher than the 8% reported from a previous survey in the U.S. foreign exchange market (Cheung & Chinn, 2001) which used a comparable mail-out procedure.
39

Table 1: Trader Self-Evaluations Relative to Average Table shows that North American currency market professionals tend to rate themselves as "better than average." Self-assessments of personal success were submitted by 401 individuals as part of a survey distributed in June of 2002. Participants were asked to rate their own professional success on a scale of 1 = far below average to 7 = far above average, with 4 = average. "Top Tier" traders worked for "Top Tier" banks, meaning banks singled out for excellent by various market sources (see Appendix for further details). All Traders Top Tier Banks Other Banks
Average Self-Rating (Standard Error)
5.06 (0.05)
5.02 (0.06)
4.86 (0.11)
Share Above Average (5, 6, 7) 73.6 74.9 68.9
Share Below Average (1, 2, 3) 5.4 4.5 8.9
Number of Participants 401 312 90
40
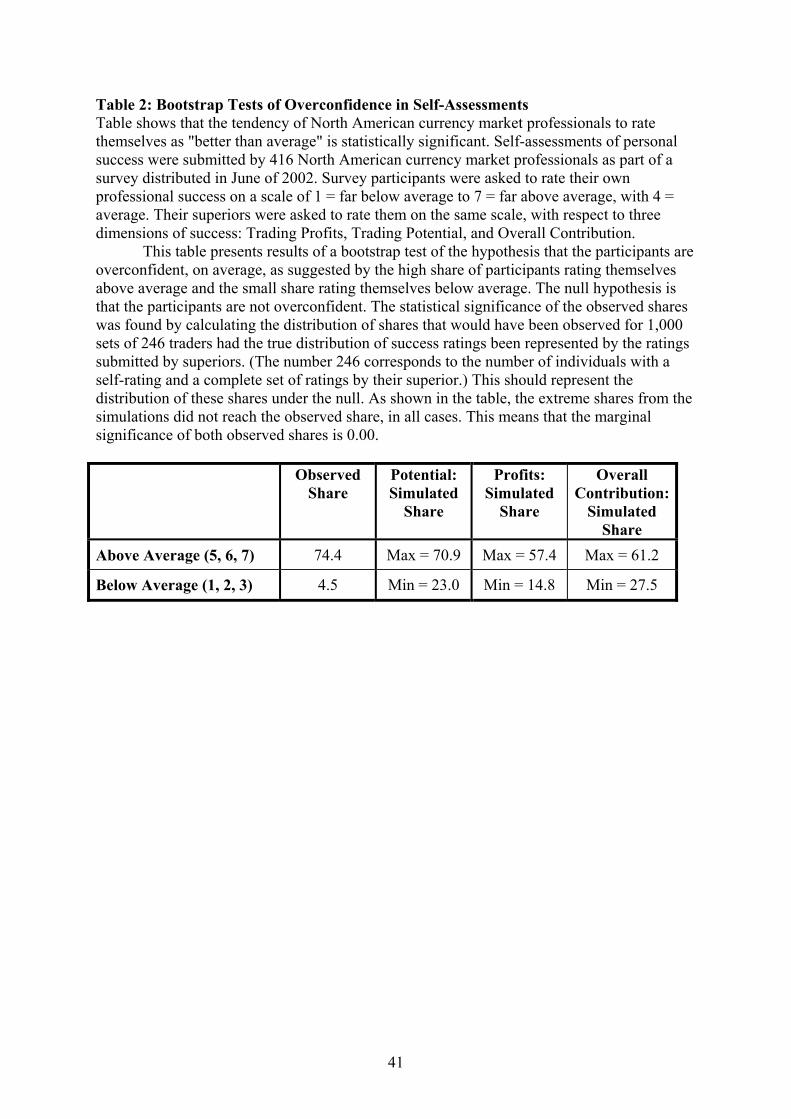
Table 2: Bootstrap Tests of Overconfidence in Self-Assessments Table shows that the tendency of North American currency market professionals to rate themselves as "better than average" is statistically significant. Self-assessments of personal success were submitted by 416 North American currency market professionals as part of a survey distributed in June of 2002. Survey participants were asked to rate their own professional success on a scale of 1 = far below average to 7 = far above average, with 4 = average. Their superiors were asked to rate them on the same scale, with respect to three dimensions of success: Trading Profits, Trading Potential, and Overall Contribution.
This table presents results of a bootstrap test of the hypothesis that the participants are overconfident, on average, as suggested by the high share of participants rating themselves above average and the small share rating themselves below average. The null hypothesis is that the participants are not overconfident. The statistical significance of the observed shares was found by calculating the distribution of shares that would have been observed for 1,000 sets of 246 traders had the true distribution of success ratings been represented by the ratings submitted by superiors. (The number 246 corresponds to the number of individuals with a self-rating and a complete set of ratings by their superior.) This should represent the distribution of these shares under the null. As shown in the table, the extreme shares from the simulations did not reach the observed share, in all cases. This means that the marginal significance of both observed shares is 0.00. Observed
Share Potential: Simulated
Share
Profits: Simulated
Share
Overall Contribution:
Simulated Share
Above Average (5, 6, 7) 74.4 Max = 70.9 Max = 57.4 Max = 61.2
Below Average (1, 2, 3) 4.5 Min = 23.0 Min = 14.8 Min = 27.5
41

Table 3: Overconfidence Especially Strong Among "Below Average" Participants The professional success of 246 North American currency market professionals was rated by themselves and their superiors as part of a survey distributed in June of 2002. Success was rated on a scale of 1 = far below average to 7 = far above average, with 4 = average. Superiors were asked to rate traders on three dimensions: Trading Profits, Trading Potential, and Overall Contribution.
Each pair of columns examines traders evaluated "Below Average" (<4) and "Above Average" (>4) by their superiors on the performance dimension highlighted in the top row. The first row provides the average self-rating for each group, and the standard error of those ratings. The second row provides t-statistics for the difference between the two self-ratings. The third row shows the average superior rank for each group. The fourth row shows that the difference between superiors and subordinates is more pronounced for below-average individuals than above-average individuals. The fifth and sixth rows show the share of self-ratings in each group that falls above or below average. Trading
Potential Trading Profits
Overall Contribution
Below Avg.
Above Avg.
Below Avg.
Above Avg.
Below Avg.
Above Avg.
Self Rating (Standard Error)
4.97 (0.16)
5.29 (0.09)
5.05 (0.12)
5.29 (0.10)
5.13 (0.13)
5.19 (0.10)
Below vs Above, t-Statistic 1.72 1.50 0.34
Superior’s Rating 2.82 5.80 2.47 5.72 2.59 5.75 Superior vs. Self, Below vs Above, t-Statistic
12.69 14.97 15.44
Self Rating Above Average, % 61.5 81.4 70.9 81.7 77.8 77.2
Self-Rating Below Average, % 2.6 4.1 1.8 5.0 2.2 4.7
42
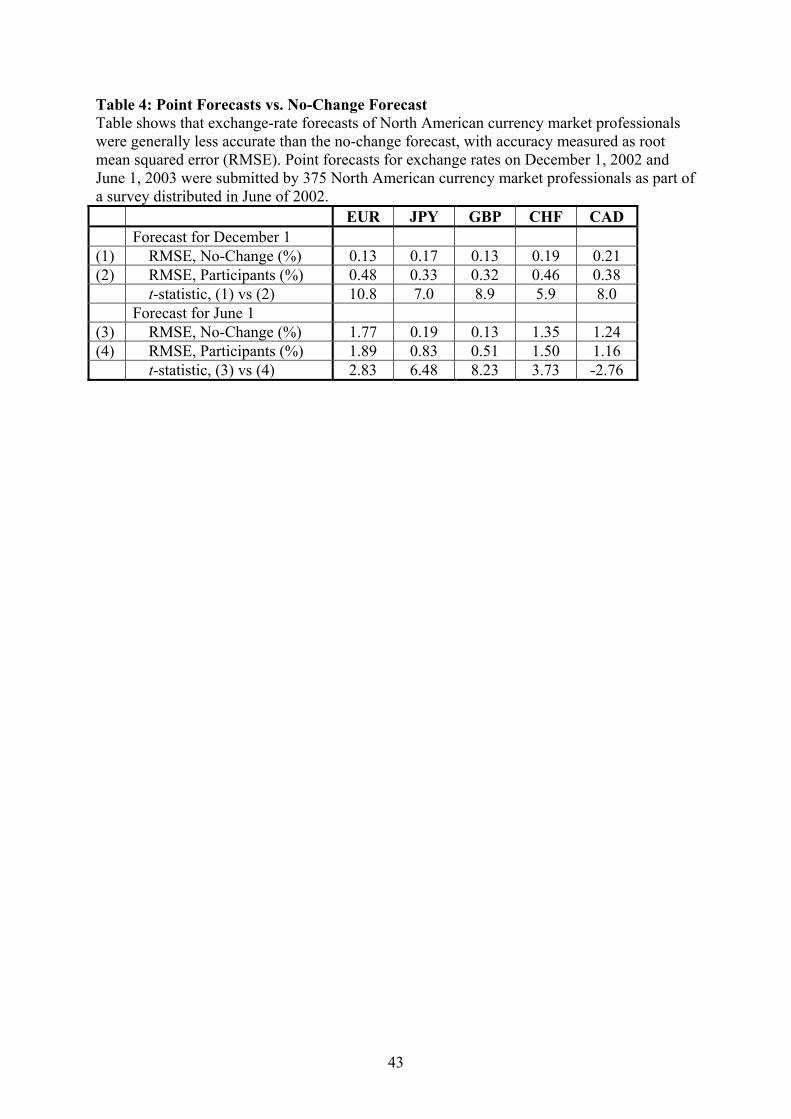
Table 4: Point Forecasts vs. No-Change Forecast Table shows that exchange-rate forecasts of North American currency market professionals were generally less accurate than the no-change forecast, with accuracy measured as root mean squared error (RMSE). Point forecasts for exchange rates on December 1, 2002 and June 1, 2003 were submitted by 375 North American currency market professionals as part of a survey distributed in June of 2002. EUR JPY GBP CHF CAD Forecast for December 1 (1) RMSE, No-Change (%) 0.13 0.17 0.13 0.19 0.21 (2) RMSE, Participants (%) 0.48 0.33 0.32 0.46 0.38 t-statistic, (1) vs (2) 10.8 7.0 8.9 5.9 8.0 Forecast for June 1 (3) RMSE, No-Change (%) 1.77 0.19 0.13 1.35 1.24 (4) RMSE, Participants (%) 1.89 0.83 0.51 1.50 1.16 t-statistic, (3) vs (4) 2.83 6.48 8.23 3.73 -2.76
43
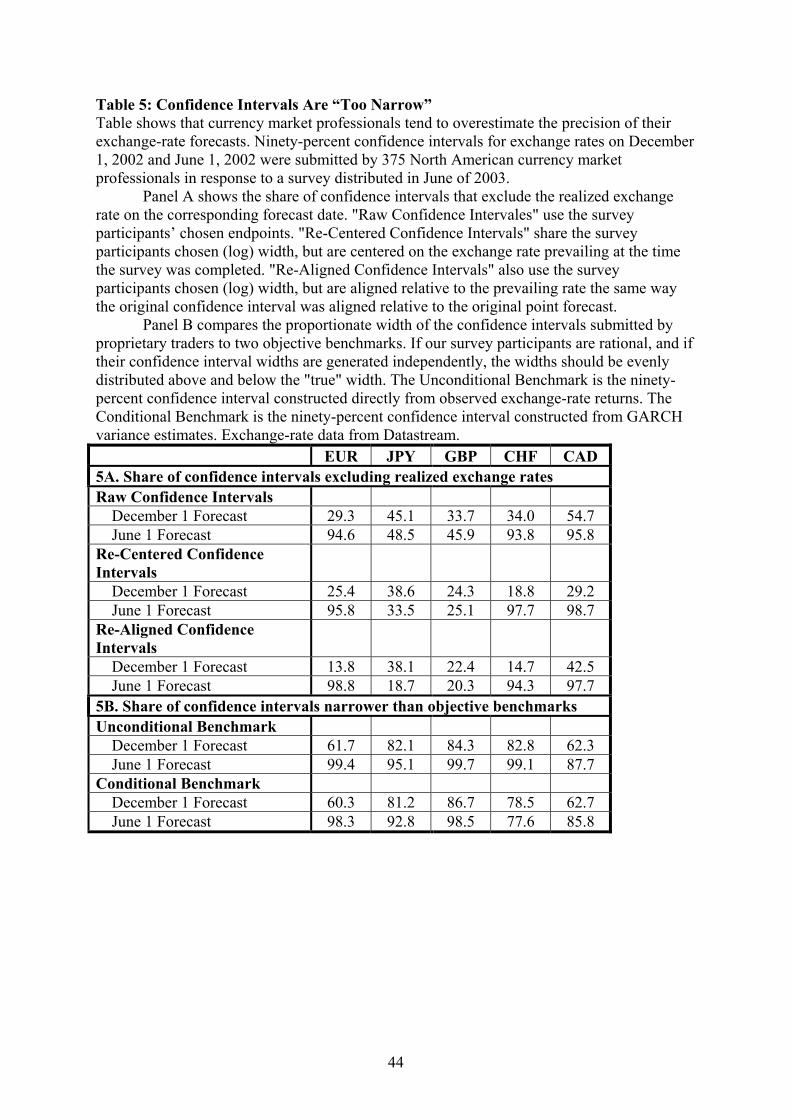
Table 5: Confidence Intervals Are “Too Narrow” Table shows that currency market professionals tend to overestimate the precision of their exchange-rate forecasts. Ninety-percent confidence intervals for exchange rates on December 1, 2002 and June 1, 2002 were submitted by 375 North American currency market professionals in response to a survey distributed in June of 2003.
Panel A shows the share of confidence intervals that exclude the realized exchange rate on the corresponding forecast date. "Raw Confidence Intervales" use the survey participants’ chosen endpoints. "Re-Centered Confidence Intervals" share the survey participants chosen (log) width, but are centered on the exchange rate prevailing at the time the survey was completed. "Re-Aligned Confidence Intervals" also use the survey participants chosen (log) width, but are aligned relative to the prevailing rate the same way the original confidence interval was aligned relative to the original point forecast.
Panel B compares the proportionate width of the confidence intervals submitted by proprietary traders to two objective benchmarks. If our survey participants are rational, and if their confidence interval widths are generated independently, the widths should be evenly distributed above and below the "true" width. The Unconditional Benchmark is the ninety-percent confidence interval constructed directly from observed exchange-rate returns. The Conditional Benchmark is the ninety-percent confidence interval constructed from GARCH variance estimates. Exchange-rate data from Datastream. EUR JPY GBP CHF CAD 5A. Share of confidence intervals excluding realized exchange rates Raw Confidence Intervals December 1 Forecast 29.3 45.1 33.7 34.0 54.7 June 1 Forecast 94.6 48.5 45.9 93.8 95.8 Re-Centered Confidence Intervals
December 1 Forecast 25.4 38.6 24.3 18.8 29.2 June 1 Forecast 95.8 33.5 25.1 97.7 98.7 Re-Aligned Confidence Intervals
December 1 Forecast 13.8 38.1 22.4 14.7 42.5 June 1 Forecast 98.8 18.7 20.3 94.3 97.7 5B. Share of confidence intervals narrower than objective benchmarks Unconditional Benchmark December 1 Forecast 61.7 82.1 84.3 82.8 62.3 June 1 Forecast 99.4 95.1 99.7 99.1 87.7 Conditional Benchmark December 1 Forecast 60.3 81.2 86.7 78.5 62.7 June 1 Forecast 98.3 92.8 98.5 77.6 85.8
44

Table 6: Bootstrap Tests of Miscalibration Table shows that the tendency for currency market professionals to overestimate the precision of their exchange-rate forecasts is statistically significant. Ninety-percent confidence intervals for exchange rates on December 1, 2002 and June 1, 2003 were submitted by 375 North American currency market professionals in response to a survey distributed in June of 2002. The first row of the table shows the share of confidence intervals submitted in July 2002 that fall short of a GARCH-estimated true confidence interval, and the marginal significance of that share. The marginal significance comes from a bootstrap test of the joint null hypothesis that (1) participants' confidence interval estimates are unbiased and (2) they are uncorrelated with the true confidence interval. EUR JPY GBP CHF CAD December 1 Forecast Completed in July 99.7
(0.002) 99.7
(0.000) 91.7
(0.199) 90.9
(0.093) 91.7
(0.010) Completed in September 99.4
(0.013) 99.7
(0.037) 100.0
(0.016) 100.0
(0.002) 99.1
(0.000) June 1 Forecast Completed in July 75.0
(0.131) 100.0
(0.304) 100.0
(0.000) 90.9
(0.000) 90.9
(0.156) Completed in September 100.0
(0.304) 100.0
(0.033) 100.0
(0.029) 90.0
(0.295) 60.0
(0.471)
45

Table 7: Determinants of Overconfidence The table analyzes the determinants of two measures of overconfidence, hubris and miscalibration, among North American currency market professionals. Analysis is based on a June 2002 survey in which the professional success of 246 participants was rated by themselves and their superiors. In addition, participants provided ninety-percent confidence intervals for exchange rates on December 1, 2002 and June 1, 2003.
Hubris is measured as the difference between a participant’s self-rating and a composite measure of the superior’s three ratings (details in the text). Miscalibration is measured as the difference between a participant's average proportionate confidence interval width and the average proportionate confidence interval width of all participants submitting forecasts the same month. Gender is 0 for women, 1 for men. Sales and Proprietary Trading are 1 if the individual has the relevant responsibilities and 0 otherwise. Position Limit is an index for the maximum open position a trader can have during daytime trading, where 1 is 0-$10 million, 2 is $11-20 million, 3 is $21 to $50 million, and 4 is any limit above $50 million. Two-stage least squares estimates control for potential simultaneous determination of Position Limit. Bootstrapped 95 percent confidence intervals in parentheses. Superscript a indicates significance at the five percent level; superscript b indicates significance at the ten percent level. Marginal effects discussed in the text. Hubris Miscalibration Position Limit (/1000)
0.169b (-0.023/0.360)
Gender 0.528a (0.098/1.023)
-0.020a (-0.032/-0.008)
Sales -0.239b (-0.532/0.078)
0.011a (0.000/0.021)
Proprietary Trading
-0.020a (-0.032/-0.008)
Adjusted R2 0.046 0.061
46

Table 8: Proprietary Traders Point forecasts and ninety-percent confidence intervals for exchange rates on
December 1, 2002 and June 1, 2002 were submitted by 416 North American currency market professionals in response to a survey distributed in June of 2003. The table focuses on point forecasts provided by 79 traders that have some responsibility for proprietary trading. Panel A shows that the point forecasts were generally less accurate than the no-change forecast, where accuracy is measured as mean squared forecast error. Panel B shows that the most of the confidence intervals were narrower than objective benchmarks. If our survey participants were fully rational, and if their confidence interval widths are generated independently, the widths would have been evenly distributed above and below the objective benchmarks. The Unconditional Benchmark is a ninety-percent confidence interval constructed directly from observed exchange-rate returns. The Conditional Benchmark is a ninety-percent confidence interval constructed from GARCH variance estimates. EUR JPY GBP CHF CAD 8A Accuracy of Point Forecasts and No-Change Forecasts Forecast for December 1 (1) RMSE, No-Change (%) 0.12 0.32 0.14 0.11 0.21 (2) RMSE, Participants (%) 0.58 0.55 0.29 0.40 0.41 t-statistic, (1) vs (2) 6.33 3.09 3.65 4.78 5.44 Forecast for June 1 (3) RMSE, No-Change (%) 1.76 0.18 0.14 1.36 1.21 (4) RMSE, Participants (%) 1.70 0.68 0.41 1.48 1.15 t-statistic, (3) vs (4) -0.54 4.49 4.41 1.99 -0.56 8B Share of Confidence Intervals Narrower Than Objective Benchmarks Unconditional Benchmark December 1 Forecast 51.6 85.3 92.5 89.4 39.0 June 1 Forecast 96.7 97.0 100.0 100.0 75.4 Conditional Benchmark December 1 Forecast 50.0 83.8 94.0 89.4 39.0 June 1 Forecast 96.7 97.0 100.0 91.9 70.2
47

Table 9: Consequences of Overconfidence The table evaluates the determinants of professional success measured as profitability, rank, and trading experience. Analysis is based on a June 2002 survey in which the professional success of 246 North American currency market professionals was rated by themselves and their superiors. In addition, participants provided ninety-percent confidence intervals for exchange rates on December 1, 2002 and June 1, 2002.
Profitability is the supervisor’s rank of an individual’s trading profits relative to his/her peers. Rank is 1 for Trainee, 2 for Junior Staff, 3 for Senior Staff, and 4 for Treasurer/Manager. Trading Experience is measured in years. Miscalibration is measured as the difference between a participant's average confidence interval width (ln(upper limit)-ln(lower limit)) and the average confidence interval width of all participants submitting forecasts the same month. Hubris is measured as the difference between a participant’s self-rating and a composite measure of the superior’s three ratings (details in the text). New York (Spot) equals one when the trader is located in New York (trades in the spot market) and zero otherwise. Gender is 0 for women, 1 for men. Age ranges from 1 to 5 as a person's age rises in five-year increments from 20-25 to 45+. Two-stage least squares estimates control for potential simultaneous determination of all dependent variables and overconfidence. Ordered probit regressions for Profitability, Rank, and Position Limit; tobit regression for Trading Experience, with the dependent variable censored below 0. Bootstrapped 95 percent confidence intervals in parentheses. Superscript a indicates significance at the five percent level; superscript b indicates significance at the ten percent level. Marginal effects discussed in the text.
9A: Profitability Profitability Profitability Profitability Miscalibration 0.634
(-14.70/15.90)
Hubris -0.114 (-0.590/0.358)
New York -0.282a (-0.539/-0.029)
-0.171 (-0.480/0.141)
-0.161 (-0.530/0.134)
Spot -0.214b (-0.456/0.084)
-0.342a (-0.645/-0.009)
-0.332b (-0.640/0.002)
Gender -0.371a (-0.678/-0.076)
-0.416 (-0.961/0.064)
-0.362 (-0.853/0.124)
Pseudo- R2 0.010 0.010 0.010
9B: Professional Success
Rank Trading Experience
Miscalibration 18.916a (4.194/33.054)
69.158a (35.30/104.6)
Hubris 0.316a (0.138/0.535)
Age 0.725 a (0.523/0.982)
4.342a (3.831/4.785)
Pseudo- R2 0.266 0.127
48

Figure 1: Self-assessments of personal success were submitted by 416 North American currency market professionals as part of a survey distributed in June of 2002. Survey participants were asked to rate their own professional success on a scale of 1 = far below average to 7 = far above average, with 4 = average. The figure shows a histogram of self ratings.
Self-Perceived Trading Success
0.2 1.7 3.5
20.9
38.4
30.2
5.0
0
10
20
30
40
50
1=Much lesssuccessful
than other FXtraders
2 3 4=Equallysuccessfulas other FX
traders
5 6 7=Much moresuccessful
than other FXtraders
Per
cent
age
of tr
ader
s
49

Figure 2: Self Ratings vs. Superior’s Ratings The professional success of 246 North American currency market professionals was rated by themselves and their superiors as part of a
survey distributed in June of 2002. Success was rated on a scale of 1 = “Much less successful than other FX traders” to 7 = “Much more successful than other FX traders,” with 4 = average. Superiors were asked to rate traders on three dimensions: trading profits, trading potential, and overall contribution to the trading floor. The figure plots an individual’s self-rating against his superior’s profitability rating. (Fewer than 246 points appear because some points represent multiple observations.)
0
1
2
3
4
5
6
7
8
0 1 2 3 4 5 6 7 8
Superior's Rating: Profit
Self
Rat
ing
50
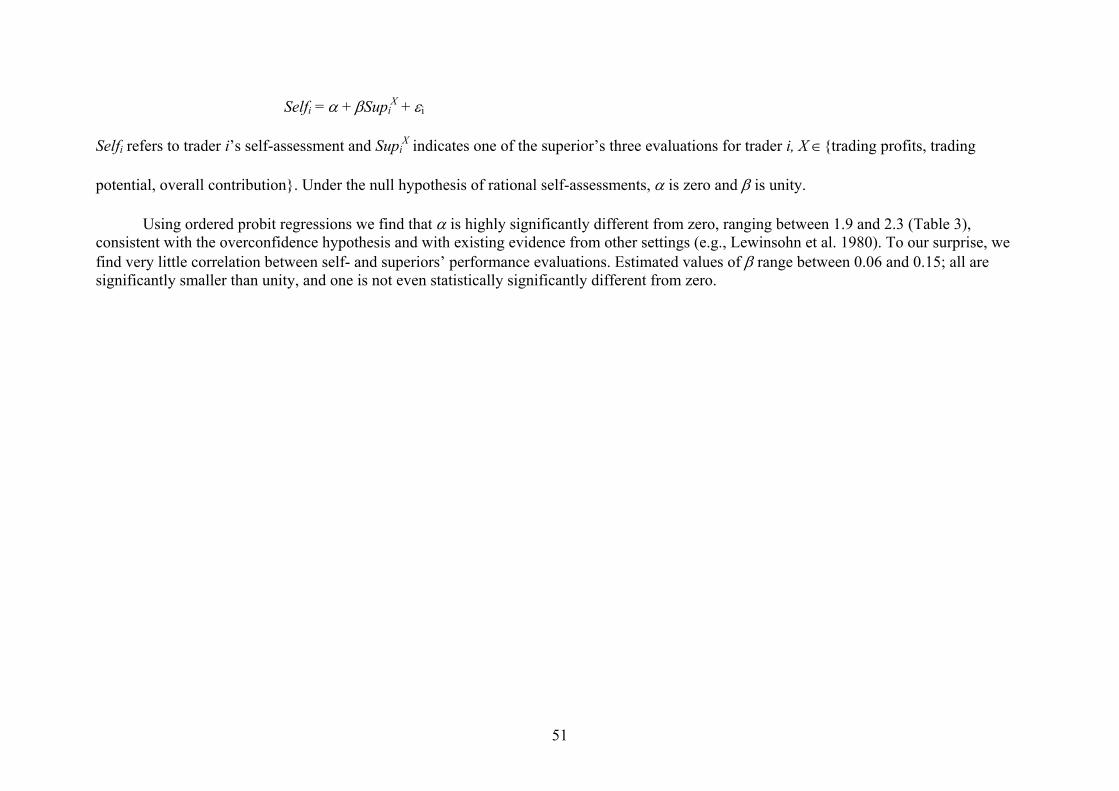
Selfi = α + βSupiX + εi
Selfi refers to trader i’s self-assessment and SupiX indicates one of the superior’s three evaluations for trader i, X ∈{trading profits, trading
potential, overall contribution}. Under the null hypothesis of rational self-assessments, α is zero and β is unity.
Using ordered probit regressions we find that α is highly significantly different from zero, ranging between 1.9 and 2.3 (Table 3), consistent with the overconfidence hypothesis and with existing evidence from other settings (e.g., Lewinsohn et al. 1980). To our surprise, we find very little correlation between self- and superiors’ performance evaluations. Estimated values of β range between 0.06 and 0.15; all are significantly smaller than unity, and one is not even statistically significantly different from zero.
51