overcome your fear of flying - garantİ yatirim · 3 research pegasus airlines recommendation:...
TRANSCRIPT

1
RESEARCH
June 18, 2015
Overcome your fear of flying
Turkey - Sector - Airlines
Baris Ince +90 (212) 384 1141 [email protected]
Sales Contact: +90 (212) 384 1155 [email protected]
Please see the last page of this report for important disclosures.
Passenger trends: Turkish passenger numbers grew by 8% YoY in 5M15 with the growth of 11% in domestic passenger numbers vs.
4% in international passengers. The growth was 7% at Istanbul Ataturk Airport (IAA) vs. 18% at Sabiha Gokcen Airport (SAW). I n 5M15,
Turkish Airlines (THY) increased its total pax figure by 9% on annual basis while that of Pegasus Airlines (Pegasus) was 11% in 1Q15.
We assume a 10% pax growth for THY vs. 12% for Pegasus in 2015. We maintain our projection of 10% passenger growth for the f ull
year of 2015 in Turkey. We assume a 9% CAGR in Turkish air passenger traffic between 2014 -17E. Despite benefiting from Turkey’s
geographical position and the government’s supportive approach to the sector, we believe sector growth may come under pressur e in
2016 rather than in 2015, as IAA and SAW (together covering 47% of total pax in Turkey) are close to reaching their full capacity. Work
on an expansion of IAA started in late 2014, with a scheduled completion of 1H16, which is expected to boost capacity at the airport by
10mn. Meanwhile, the contract of the second runaway construction at SAW, which doubles capacity, is expected to be signed this year.
Unit revenues and costs: From 2H13 to 1H14, we had seen a stiff competition in the sector, with the increased presence of THY at
SAW, Pegasus’ hub, following the capacity constraints at IAA. Both airlines targeted to benefit from strong demand in domesti c market by
offering lower prices. In addition, there was an increased competition from major Gulf and European carriers on international side as they
introduced new capacities. There were other reasons behind the weakness in revenue yields such as the political tensions in Russia and
Ukraine and depreciation in some local currencies worldwide. Accordingly, we observed a decline of 4% in the RASK (Total Rev enue/
ASK) for THY (USD) and 7% for Pegasus (EUR) in 2014. On the cost front, THY’s CASK (Total Costs/ASK) declined by 3% (USD) an d
Pegasus’s CASK was down by 4% (EUR) in 2014. For 2015, we forecast the RASK to fall by 13% for THY (down by 12% in 1Q15) and
by 1% (up by 7% in 1Q15) for Pegasus, respectively, while forecasting a 11% decline (down by 13% in 1Q15) in THY’s CASK on lo wer
fuel costs; yet a 3% increase (up by 1% in 1Q15) for Pegasus due to the exchange rate impact, changes in the fleet mix and r amp
handling investments.
Guidance: THY management targets US$12bn in revenues (GS forecast: US$11.2bn), carrying 63mn passengers (GS forecast:
60m) while guiding for an increase in its ASK to 157bn (GS forecast:157bn) with an 80.3% load factor (GS forecast: 77.9%). Pegas us
foresees 17-19% growth in ASK and 15-17% growth in pax figures with the load factor expected to remain stable with flat yields. Our
forecasts appear broadly inline with the management guidance except our lower 12% pax growth assumption. Pegasus management
guides for a 3-4% increase in CASK in 2015 with our forecast of a 3% increase in CASK. We conservatively assume Pegasus’s
EBITDAR margin to be 18.5% in 2015 vs. the guidance of 19-21%.
Themes in 2015: We currently identify two main themes surrounding airline stocks; oil prices and the EUR/USD rate. We believe that the
market has overlooked the potential benefits of falling oil prices, and remaining overly skittish about the sliding EUR. Considering the
c.60% hedging level for European carriers and near zero level for Gulf carriers, we believe Turkish air carriers with c.45% h edge ratio are
well positioned to benefit from the demand in the sector given Istanbul’s geographically advantageous position. Based on our
assumptions, each $5/bbl change in Brent crude prices would have an impact of 10% on THY’s 2015E EBITDA and a 12% impact on
Pegasus’s EBITDA while each 1% change in the EUR/USD rate would have a 5% impact on the 2015E EBITDA for THY and a 3%
impact on Pegasus. Both Pegasus and THY have recently converted international ticket sales originating in Turkey to USD from EUR,
those sales account for c13% and c15% of their annual revenue, respectively. THY has added an average of 30 aircrafts to its fleet each
year since 2012, and plans to add 42 planes in 2015 (most of them in 1H15). That means related employees would be recruited f or the
training purposes couple months ahead of the aircraft being delivered, which may put margins under pressure in 2015. Yet, we did not
observed such a cost overruns in 1Q15 for THY (in fact, there was a 5.3% YoY decline in personnel costs in terms of ASK, see page 12).
In addition, given the capacity constraints at IAA, THY will transfer 28 of its aircraft to SAW, and plans to increase its market share at
Istanbul’s 2nd airport to 25% in 2015 from 20% in 2014, adding to the already stiff competition there. We prefer THY over Pegasus on
the back of i) potential competition from THY at Pegasus’s main hub, iii) Pegasus’s limited visibility on international expan sion
and iii) the short term headwinds on cost side for Pegasus. THY looks cheap compared to peers on 2015 and 2016 P/E and EV/
EBITDA while Pegasus does not for 2015.
Valuation: Given 1Q15 results and YTD traffic trends, we have revisited our forecasts with new assumptions for the macro -economy, oil
prices (USD61/bbl vs. USD68/bbl previously) and exchange rates (2015 average EUR/USD now assumed as 1.11, vs. 1.20 previously),
we have cut our 2015 EBITDA margin forecasts by 0.6 pps for THY and 2.4 pps for Pegasus. Our valuation for airlines is based on a
target 2015 EV/EBITDAR multiple (7.0x for THY and 7.8x for Pegasus). Accordingly, we decreased our 12 month forward target sh are
prices for THY by 5% to TL11.25, and by 20% to TL31.65 for Pegasus. We maintain our Outperform recommendation for the both stock.
Risks: A slowdown in passenger growth momentum, weaker than expected unit revenues or a deteriorating cost base are the key risks
for airlines. A potential sale by shareholders would lead to share price weakness for the carriers.
Company Ticker Mcap
3M Avg
Volume Upside
Old New (TLmn) (TLmn) Old New (%) 2015E 2016E 2015E 2016E 1M 3M YTD
Pegasus Airlines PGSUS Outperform Outperform 2,567 45 39.80 31.65 26% 7.3 6.4 13.5 9.2 3% 3% -20%
Turkish Airlines THYAO Outperform Outperform 12,213 216 11.90 11.25 27% 6.7 6.1 6.8 7.4 -1% 1% -2%
Source: Garanti Securities
Target Price
(TL)Recommendation EV/EBITDAR P/E
BIST-100 Relative
Performances

2
RESEARCH
RECOMMENDATIONS & VALUATIONS THY Recommendation: OUTPERFORM. THY has differentiated itself on the basis of service quality and competitiveness in recent years. Istanbul’s geographical advantage and the airline’s relatively low
labour costs (especially when compared to European carriers) enhance THY’s competitiveness. As
an emerging international travel hub, Istanbul is in the position of enabling the airline to boost its transit passenger numbers and better utilize the fleet (especially its narrow body aircraft) and seat
capacity. With a young fleet (7 years on average), improved brand awareness and increased
capacity, THY is in a position to capture market share from EU carriers, which struggle to offer high quality service and capacity additions with their relatively old fleets. THY shares have
underperformed the index by 2% YTD and now trade at a 36% and 22% discount to its peer group
on the basis of its 2015E P/E and 2015 EV/EBITDA.
Risks. A decline in the economic activity, rising oil prices, Euro weakness against the Dollar and the Privatization Administration’s sale of its stake in THY pose risks. Geopolitical tensions could also
emerge as a risk.
New 12 month forward target price of TL11.25/share vs. TL11.90/share previously. Our 12
month forward target share price of TL11.25 derived f rom our target EV/EBITDAR multiple offers 27% upside potential for THY. Our valuation for THY is based on the 2015E target EV/EBITDAR
multiple. To reach our target Mcap, we adjusted net debt to 7x aircraft related rental expenses and
current PDP receivables. We employed a 7.0x target multiple for THY, which is the historical average EV/EBITDAR multiple.
Target EV/EBITDAR mutiple (x) 6.0 6.5 7.0 7.5 8.0
GS 2015E EBITDAR(TLmn) 4,984 4,984 4,984 4,984 4,984
Target EV (TLmn) 30,097 32,589 35,081 37,573 40,065
Adj. Net debt (TLmn) 19,560 19,560 19,560 19,560 19,560
Target Mcap (TLmn) 10,537 13,029 15,521 18,013 20,506
Outstanding number of shares (mn) 1,380 1,380 1,380 1,380 1,380
Target share price (TL) 7.64 9.44 11.25 13.05 14.86
Current share price (TL) 8.85 8.85 8.85 8.85 8.85
Upside potential -14% 7% 27% 47% 68%
Source: Garanti Securities
THY Valuation Summary
3
RESEARCH
Pegasus Airlines Recommendation: OUTPERFORM. Given its proven track record on growth, we believe that Pegasus stands out as a preferred play in an underpenetrated sector coupled with its ambitious
expansion plans and effective cost management. As the number one LCC and second largest carrier in Turkey, Pegasus will be one of the key beneficiaries of increasing GDP and attractive
demographics, which bodes well for discount carriers. Using Istanbul Sabiha Gokcen Airport (SAW)
as its main hub, Pegasus differentiates itself f rom an ordinary LCC whose business models are based on only point to point travel; Pegasus operates like both a network and point to point carrier,
thanks to Istanbul’s geographical advantage connecting 50 countries within a 3 hour flight.
Furthermore, we think Pegasus’ low cost management enables the airline to boast one of the lowest CASK levels on the back of its young fleet and low labour costs. Despite our conservative
assumptions given the likely increased competition and cost pressures f rom exchange rates, the
changes in the fleet and ramp handling investments, we believe the current levels offer a good entry point to accumulate the stock for the long-term investors. We maintain our recommendation for
Pegasus as Outperform.
Risks. The key risks would be an increase in oil prices, unrest in Turkey and neighbouring countries,
stiff competition, limited international expansion and EUR weakness against the USD. About 14.5%
of Pegasus shares were registered to the Central Securities Depository in mid-February 2015 with no intention for immediate sale, yet a potential stake sale could result in an overhang for the shares.
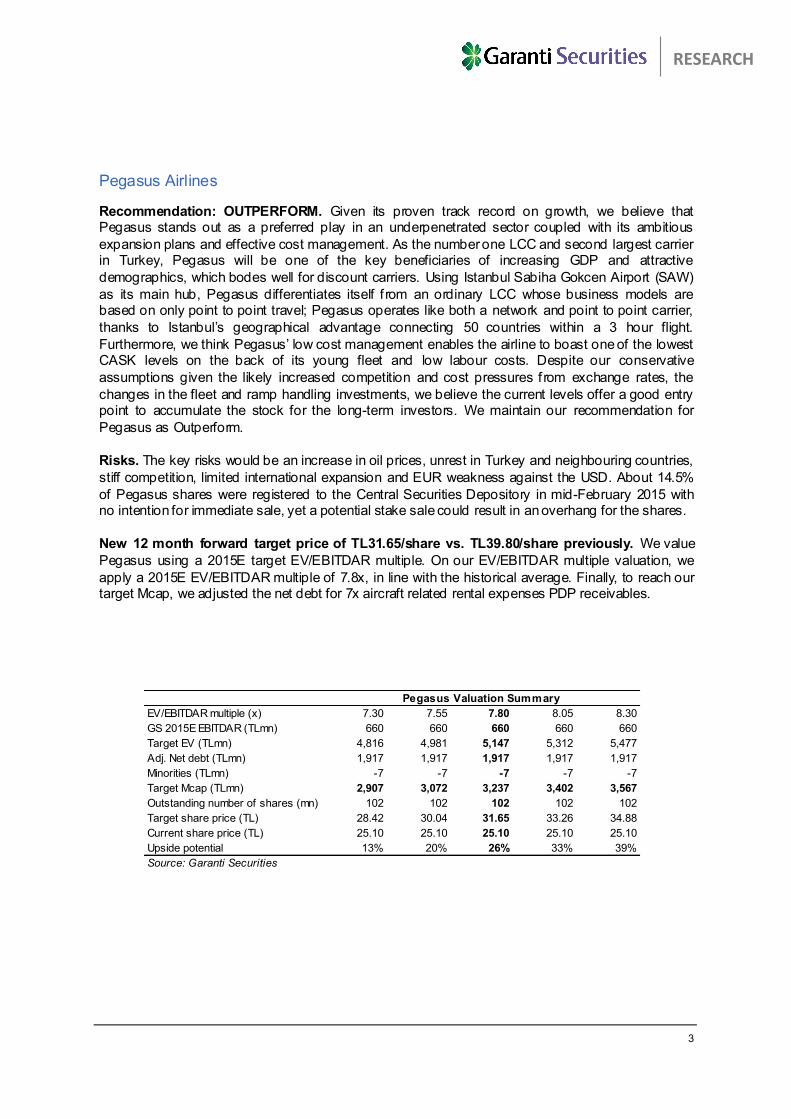
New 12 month forward target price of TL31.65/share vs. TL39.80/share previously. We value
Pegasus using a 2015E target EV/EBITDAR multiple. On our EV/EBITDAR multiple valuation, we
apply a 2015E EV/EBITDAR multiple of 7.8x, in line with the historical average. Finally, to reach our target Mcap, we adjusted the net debt for 7x aircraft related rental expenses PDP receivables.
EV/EBITDAR multiple (x) 7.30 7.55 7.80 8.05 8.30
GS 2015E EBITDAR (TLmn) 660 660 660 660 660
Target EV (TLmn) 4,816 4,981 5,147 5,312 5,477
Adj. Net debt (TLmn) 1,917 1,917 1,917 1,917 1,917
Minorities (TLmn) -7 -7 -7 -7 -7
Target Mcap (TLmn) 2,907 3,072 3,237 3,402 3,567
Outstanding number of shares (mn) 102 102 102 102 102
Target share price (TL) 28.42 30.04 31.65 33.26 34.88
Current share price (TL) 25.10 25.10 25.10 25.10 25.10
Upside potential 13% 20% 26% 33% 39%
Source: Garanti Securities
Pegasus Valuation Summary
4
RESEARCH
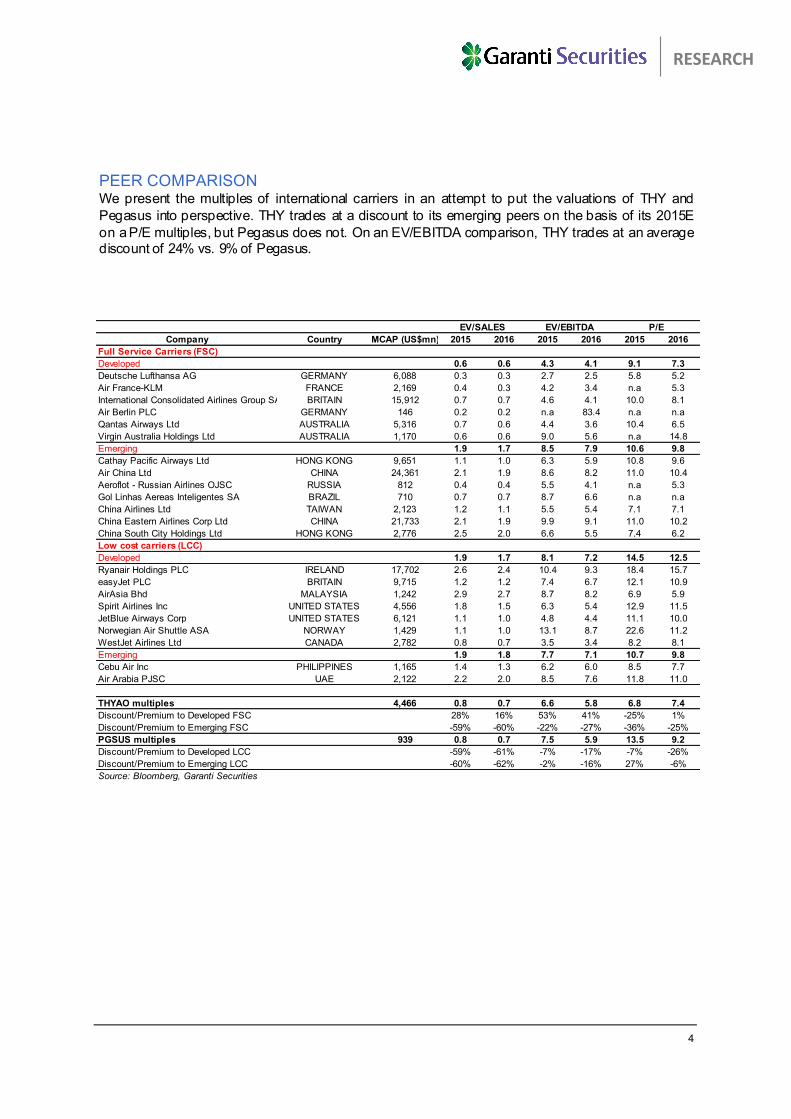
PEER COMPARISON We present the multiples of international carriers in an attempt to put the valuations of THY and
Pegasus into perspective. THY trades at a discount to its emerging peers on the basis of its 2015E
on a P/E multiples, but Pegasus does not. On an EV/EBITDA comparison, THY trades at an average discount of 24% vs. 9% of Pegasus.
Company Country MCAP (US$mn) 2015 2016 2015 2016 2015 2016
Full Service Carriers (FSC)
Developed 0.6 0.6 4.3 4.1 9.1 7.3
Deutsche Lufthansa AG GERMANY 6,088 0.3 0.3 2.7 2.5 5.8 5.2
Air France-KLM FRANCE 2,169 0.4 0.3 4.2 3.4 n.a 5.3
International Consolidated Airlines Group SA BRITAIN 15,912 0.7 0.7 4.6 4.1 10.0 8.1
Air Berlin PLC GERMANY 146 0.2 0.2 n.a 83.4 n.a n.a
Qantas Airways Ltd AUSTRALIA 5,316 0.7 0.6 4.4 3.6 10.4 6.5
Virgin Australia Holdings Ltd AUSTRALIA 1,170 0.6 0.6 9.0 5.6 n.a 14.8
Emerging 1.9 1.7 8.5 7.9 10.6 9.8
Cathay Pacific Airways Ltd HONG KONG 9,651 1.1 1.0 6.3 5.9 10.8 9.6
Air China Ltd CHINA 24,361 2.1 1.9 8.6 8.2 11.0 10.4
Aeroflot - Russian Airlines OJSC RUSSIA 812 0.4 0.4 5.5 4.1 n.a 5.3
Gol Linhas Aereas Inteligentes SA BRAZIL 710 0.7 0.7 8.7 6.6 n.a n.a
China Airlines Ltd TAIWAN 2,123 1.2 1.1 5.5 5.4 7.1 7.1
China Eastern Airlines Corp Ltd CHINA 21,733 2.1 1.9 9.9 9.1 11.0 10.2
China South City Holdings Ltd HONG KONG 2,776 2.5 2.0 6.6 5.5 7.4 6.2
Low cost carriers (LCC)
Developed 1.9 1.7 8.1 7.2 14.5 12.5
Ryanair Holdings PLC IRELAND 17,702 2.6 2.4 10.4 9.3 18.4 15.7
easyJet PLC BRITAIN 9,715 1.2 1.2 7.4 6.7 12.1 10.9
AirAsia Bhd MALAYSIA 1,242 2.9 2.7 8.7 8.2 6.9 5.9
Spirit Airlines Inc UNITED STATES 4,556 1.8 1.5 6.3 5.4 12.9 11.5
JetBlue Airways Corp UNITED STATES 6,121 1.1 1.0 4.8 4.4 11.1 10.0
Norwegian Air Shuttle ASA NORWAY 1,429 1.1 1.0 13.1 8.7 22.6 11.2
WestJet Airlines Ltd CANADA 2,782 0.8 0.7 3.5 3.4 8.2 8.1
Emerging 1.9 1.8 7.7 7.1 10.7 9.8
Cebu Air Inc PHILIPPINES 1,165 1.4 1.3 6.2 6.0 8.5 7.7
Air Arabia PJSC UAE 2,122 2.2 2.0 8.5 7.6 11.8 11.0
THYAO multiples 4,466 0.8 0.7 6.6 5.8 6.8 7.4
Discount/Premium to Developed FSC 28% 16% 53% 41% -25% 1%
Discount/Premium to Emerging FSC -59% -60% -22% -27% -36% -25%
PGSUS multiples 939 0.8 0.7 7.5 5.9 13.5 9.2
Discount/Premium to Developed LCC -59% -61% -7% -17% -7% -26%
Discount/Premium to Emerging LCC -60% -62% -2% -16% 27% -6%
Source: Bloomberg, Garanti Securities
EV/SALES EV/EBITDA P/E
5
RESEARCH
The impact of lower oil prices and EUR/USD rate for Turkish air carriers in brief
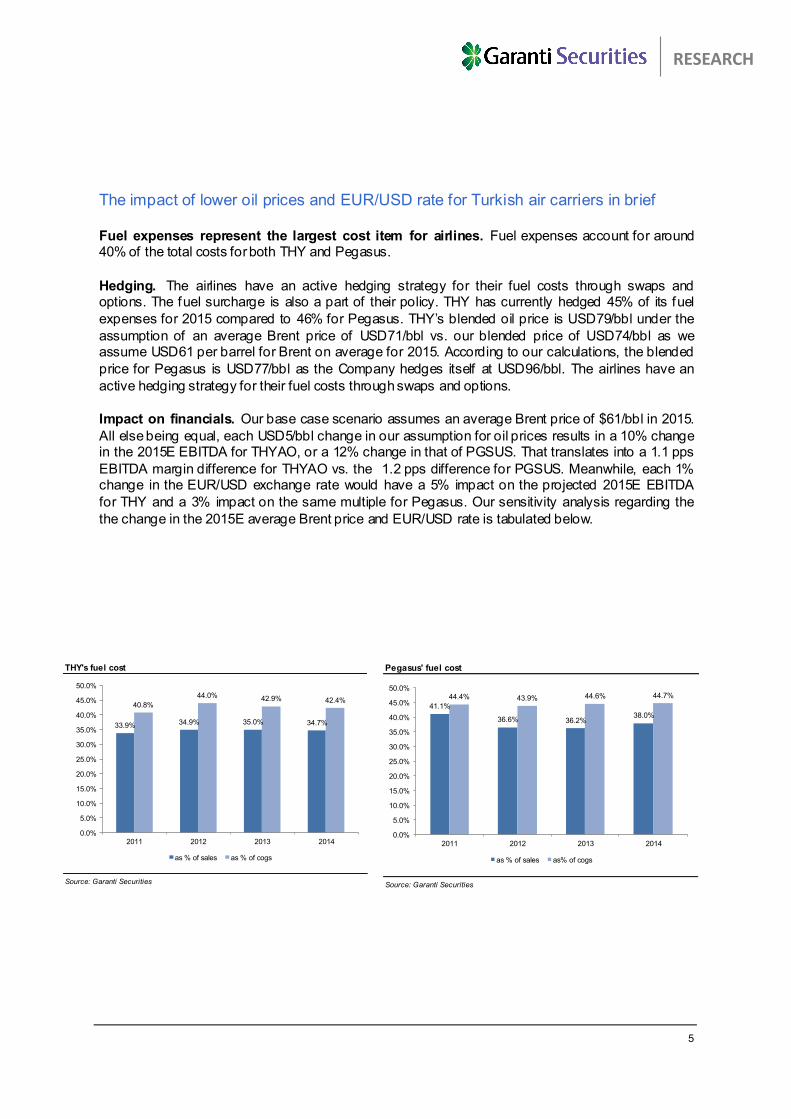
Fuel expenses represent the largest cost item for airlines. Fuel expenses account for around 40% of the total costs for both THY and Pegasus.
Hedging. The airlines have an active hedging strategy for their fuel costs through swaps and options. The fuel surcharge is also a part of their policy. THY has currently hedged 45% of its fuel
expenses for 2015 compared to 46% for Pegasus. THY’s blended oil price is USD79/bbl under the
assumption of an average Brent price of USD71/bbl vs. our blended price of USD74/bbl as we assume USD61 per barrel for Brent on average for 2015. According to our calculations, the blended
price for Pegasus is USD77/bbl as the Company hedges itself at USD96/bbl. The airlines have an
active hedging strategy for their fuel costs through swaps and options.
Impact on financials. Our base case scenario assumes an average Brent price of $61/bbl in 2015.
All else being equal, each USD5/bbl change in our assumption for oil prices results in a 10% change in the 2015E EBITDA for THYAO, or a 12% change in that of PGSUS. That translates into a 1.1 pps
EBITDA margin difference for THYAO vs. the 1.2 pps difference for PGSUS. Meanwhile, each 1% change in the EUR/USD exchange rate would have a 5% impact on the projected 2015E EBITDA
for THY and a 3% impact on the same multiple for Pegasus. Our sensitivity analysis regarding the
the change in the 2015E average Brent price and EUR/USD rate is tabulated below.
Pegasus' fuel cost
Source: Garanti Securities
44.4% 43.9% 44.6% 44.7%
41.1%
36.6% 36.2%38.0%
0.0%
5.0%
10.0%
15.0%
20.0%
25.0%
30.0%
35.0%
40.0%
45.0%
50.0%
2011 2012 2013 2014
as % of sales as% of cogs
THY's fuel cost
Source: Garanti Securities
40.8%
44.0% 42.9% 42.4%
33.9% 34.9% 35.0% 34.7%
0.0%
5.0%
10.0%
15.0%
20.0%
25.0%
30.0%
35.0%
40.0%
45.0%
50.0%
2011 2012 2013 2014
as % of sales as % of cogs

6
RESEARCH
THY
%ch 2015 EBITDA 46 51 56 61 66 71
1.05 -1% -11% -21% -31% -40% -50%
1.06 4% -6% -16% -26% -35% -45%
1.07 9% -1% -11% -21% -30% -40%
1.08 14% 4% -6% -15% -25% -35%
1.09 19% 9% -1% -10% -20% -30%
1.10 24% 14% 5% -5% -15% -25%
1.11 29% 19% 10% 0% -10% -19%
1.13 34% 25% 15% 5% -5% -14%
1.14 40% 30% 20% 10% 1% -9%
1.15 45% 35% 26% 16% 6% -4%
1.16 50% 41% 31% 21% 11% 2%
THY
2015 EBITDA margin 46 51 56 61 66 71
1.05 11.4% 10.2% 9.1% 8.0% 6.9% 5.8%
1.06 11.9% 10.8% 9.7% 8.6% 7.5% 6.3%
1.07 12.5% 11.4% 10.3% 9.2% 8.0% 6.9%
1.08 13.1% 12.0% 10.9% 9.7% 8.6% 7.5%
1.09 13.7% 12.6% 11.4% 10.3% 9.2% 8.1%
1.10 14.3% 13.2% 12.0% 10.9% 9.8% 8.7%
1.11 14.9% 13.8% 12.6% 11.5% 10.4% 9.3%
1.13 15.5% 14.4% 13.2% 12.1% 11.0% 9.9%
1.14 16.1% 15.0% 13.8% 12.7% 11.6% 10.5%
1.15 16.7% 15.6% 14.5% 13.3% 12.2% 11.1%
1.16 17.3% 16.2% 15.1% 14.0% 12.8% 11.7%
Brent Price Assumptions (USD)
EU
R/U
SD
Assu
mp
tio
ns
EU
R/U
SD
Assu
mp
tio
ns
Brent Price Assumptions (USD)
Pegasus
%ch 2015 EBITDA 46 51 56 61 66 71
1.05 19% 6% -6% -18% -30% -42%
1.06 21% 9% -3% -15% -27% -39%
1.07 24% 12% 0% -12% -24% -36%
1.08 27% 15% 3% -9% -21% -33%
1.09 30% 18% 6% -6% -18% -30%
1.10 33% 21% 9% -3% -15% -27%
1.11 37% 24% 12% 0% -12% -24%
1.13 40% 27% 15% 3% -9% -21%
1.14 43% 31% 18% 6% -6% -18%
1.15 46% 34% 21% 9% -3% -15%
1.16 49% 37% 25% 12% 0% -12%
Pegasus
2015 EBITDA margin 46 51 56 61 66 71
1.05 12.1% 10.8% 9.6% 8.4% 7.1% 5.9%
1.06 12.4% 11.1% 9.9% 8.7% 7.4% 6.2%
1.07 12.7% 11.4% 10.2% 9.0% 7.7% 6.5%
1.08 13.0% 11.7% 10.5% 9.3% 8.0% 6.8%
1.09 13.3% 12.1% 10.8% 9.6% 8.3% 7.1%
1.10 13.6% 12.4% 11.1% 9.9% 8.6% 7.4%
1.11 13.9% 12.7% 11.4% 10.2% 8.9% 7.7%
1.13 14.2% 13.0% 11.7% 10.5% 9.3% 8.0%
1.14 14.5% 13.3% 12.1% 10.8% 9.6% 8.3%
1.15 14.9% 13.6% 12.4% 11.1% 9.9% 8.7%
1.16 15.2% 13.9% 12.7% 11.5% 10.2% 9.0%
Brent Price Assumptions (USD)
EU
R/U
SD
Assu
mp
tio
ns
Brent Price Assumptions (USD)
EU
R/U
SD
Assu
mp
tio
ns

7
June 18, 2015
Turkish Airlines Outperform (Maintained)
Current Price TL 8.85TL
12M Target Price TL 11.25TL
Potential Return TL 27%
Current Mcap (TLmn) 12,213
Current EV (TLmn) 31,773
4,466
Bloomberg/Reuters:
1 mth 3 mth 12mth
-1% 1% 28%
81.7
YTD TL Return: -8%
1,380
Free Float (%): 51
73%
Financials and Ratios 2013 2014 2015E 2016E
Net Sales (TLmn) 18,777 24,158 29,321 33,485
EBITDA (TLmn) 2,330 2,910 3,378 3,912 Research Analyst: Baris Ince
EBITDAR (TLmn) 3,192 4,095 4,984 5,690 +90 (212) 384 1141
Net Income (TLmn) 683 1,819 1,793 1,651 [email protected]
EBITDA Margin 12.4% 12.0% 11.5% 11.7%
EBITDAR Margin 17.0% 17.0% 17.0% 17.0% Sales Contact:
P/E (x) 17.9 6.7 6.8 7.4 +90 (212) 384 1155-58
EV/EBITDA (x) 9.1 7.9 6.6 5.8 [email protected]
EV/Sales (x) 1.13 0.95 0.76 0.67
EPS (TL) 0.49 1.32 1.30 1.20
DPS (TL) 0.13 0.00 0.00 0.00
Foreign Ow nership in Free Float :
Stock Market Data
THYAO.TI / THYAO.IS
Relative Performance:
52 Week Range (TL): 6.08 / 10.2
Average Daily Vol (US$mn) 3 mth:
Shares Outstanding (mn):
Current Mcap (US$mn)
Price Performance (TL)
5.00
6.20
7.40
8.60
9.80
11.00
12.1
3
02.1
4
04.1
4
06.1
4
08.1
4
10.1
4
12.1
4
02.1
5
04.1
5
THYAO BIST-100
Flying high
We maintain our Outperform recommendation for Turkish
Airlines with a 5% lower 12 month forward target share price of
TL11.25, indicating 27% upside.
There is almost no change to our EBITDA and net income forecasts for 2015.
The stock trades at a 22% and 36% discount to its emerging peers, based on its 2015E EV/EBITDA and P/E.
Weak pricing/traffic figures concerns to offset by solid cost discipline
Despite the weakness in revenue yields in 1Q15, we have seen a good
start to the year in terms of profitability thanks to not only lower oil prices
but also strong cost management (EBITDA margin up by 290 bps in
1Q15). Pax growth came in at 8.7% YoY in 5M15 with a load factor of
77.6% (down 1.0 pps YoY). We attribute part of this underperformance to
a high base and the harsh winter. The airline targets 15% pax growth (vs.
our 10% forecast) with a 80.3% load factor (vs. our forecast of 77.9%) in
2015. We assume the growth will gain some momentum on the back of
attractive fares and the addition of wide body aircraft to the fleet. The
guidance provided by the airline was based on a fleet of 293 aircraft at the
end of 2015; this has been revised up to a fleet of 303. Most of the new
aircraft will have joined the fleet in 1H15, raising the prospect of further
upside to our traffic assumptions. We believe that our projections are
already included any potential cost overruns in relation to personnel
expenses (given fleet additions, 16% increase in personnel number is
guided) and unfavourable exchange rate movements as we assume
flattish margins in 2015 although in 1Q15, we have seen a sharp decline
in all cost items in terms of ASK except G&A and depreciation. THY plans
to shift 28 of its aircraft to SAW in 2015 and increase its market share at
Istanbul’s second airport by 5 pps to 25%. We believe after the weakness
in yields, we will see better yields from 3Q14 on the high demand and
normalization of the base. We project 13% (12% in 1Q15) and 11% (13%
in 1Q15) decline in RASK and CASK in 2015. The Company hedges 45%
of its 2015 budgeted fuel consumption. Blended oil price is around
USD79. All else being equal, each USD5/bbl and 1% change in our
assumption for oil prices and EUR/USD result in a 10% and 5% change in
the 2015E EBITDA for THY (see page 6). The Company has recently
converted international ticket sales originating in Turkey to USD from
EUR. Such sales account for c15% of its revenue. This will reduce the
negative impacts of currency mismatch on operations. 40% and 16% of
revenues were in EUR and USD, respectively, in 2014 while those of
costs were 14% and 56%.
RESEARCH
Turkey - Equity - Airline
Company Update
Please see the last page of this report for important disclosures.

Please see the last page of this report for important disclosures.
8
RESEARCH
SUMMARY FINANCIALS (TL mn)
The Company in Brief
Turkish Airlines is Turkey’s flag carrier with a fleet of
277 aircraft as of May 2015. Following the SPO in
2006, the Government’s stake was reduced to
49.12%; thus THY is considered to be a private
company. THY became a full member of the Star
Alliance in 2008.
Shareholders
Privatization Administration 49.12%,
Free Float 51.88%
June 18, 2015
Airlines
Turkish Airlines
Income Statement 2013 2014 2015E 2016E 15E/14
Net Sales 18,777 24,158 29,321 33,485 21%
Operating Expenses -17,687 -22,874 -28,122 -32,135 23%
Operating Profit 1,090 1,284 1,199 1,350 -7%
Consolidated EBITDA 2,330 2,910 3,378 3,912 16%
Consolidated EBITDAR 3,192 4,095 4,984 5,690 22%
Net Other Income/ Expense 136 74 93 107 26%
Profit (Loss) from Subsidiaries 252 319 388 443 21%
Net financial Income/ Expense -513 583 561 165 -4%
Profit (Loss) before Tax 965 2,261 2,242 2,064 -1%
Tax -283 -442 -448 -413 1%
Net Income 683 1,819 1,793 1,651 -1%
Ratios
EBIT Margin 5.8% 5.3% 4.1% 4.0% -1.2 pp
EBITDA Margin 12.4% 12.0% 11.5% 11.7% -0.5 pp
EBITDAR Margin 17.0% 17.0% 17.0% 17.0% 0 pp
Net Income Margin 3.6% 7.5% 6.1% 4.9% -1.4 pp
Balance Sheet 2013 2014 2015E 2016E 15E/14
Current Assets 4,536 6,565 9,542 11,939 45%
Cash and Cash Equivalents 1,382 1,674 3,308 5,216 98%
Short-Term Trade Receivables 1,148 1,057 1,619 1,437 53%
Inventories 342 452 511 600 13%
Other Current Assets 1,663 3,381 4,103 4,686 21%
Long Term Assets 20,867 25,311 27,335 29,743 8%
Total Assets 25,402 31,876 36,876 41,682 16%
Short Term Liabilities 6,653 8,505 10,572 11,799 24%
Short-Term Financial Loans 34 44 84 110 89%
Short-Term Trade Payables 1,451 1,539 2,087 2,093 36%
Other Short-Term Liabilities 5,168 6,922 8,401 9,596 21%
Long Term Liabilities 11,787 14,216 15,357 17,283 8%
Long-Term Financial Loans 10,364 12,334 13,410 15,389 9%
Other Long-Term Liabilities 1,423 1,882 1,946 1,895 3%
Shareholders Equity 6,962 9,154 10,948 12,599 20%
T. Liabilities & S.h Equity 25,402 31,876 36,876 41,682 16%

Please see the last page of this report for important disclosures.
9
RESEARCH
June 18, 2015
Airlines
Turkish Airlines
REVISIONS TO FORECASTS As shown below, we have fine tuned our forecasts based on the our new macroeconomic and traffic assumptions.
2011 2012 2013 2014 2015E 2016E
# of total passengers (mn) - new 32.7 39.0 48.3 54.7 60.2 68.1
# of total passengers (mn) - old 32.7 39.0 48.3 54.8 62.3 72.5
Difference 0.0% 0.0% 0.0% -0.3% -3.4% -6.1%
YoY 12.2% 19.6% 23.6% 13.3% 10.0% 13.2%
Load factor - new 72.6% 77.7% 79.0% 78.9% 77.9% 78.4%
Load factor - old 72.6% 77.7% 79.0% 79.7% 79.9% 80.0%
Difference 0.0 pps 0.0 pps 0.0 pps -0.8 pps -2.0 pps -1.6 pps
YoY (pps) -1.1 pps 5.1 pps 1.3 pps -0.1 pps -1.0 pps 0.5 pps
ASK (mn) - new 81,167 96,131 116,399 135,330 156,838 182,554
ASK (mn) - old 81,167 96,131 116,399 135,764 153,858 179,989
Difference 0.0% 0.0% 0.0% -0.3% 1.9% 1.4%
YoY 24.7% 18.4% 21.1% 16.3% 15.9% 16.4%
RPK (mn) - new 58,918 74,705 91,962 106,826 122,163 143,107
RPK (mn) - old 58,918 74,705 91,962 108,202 122,858 144,000
Difference 0.0% 0.0% 0.0% -1.3% -0.6% -0.6%
YoY 22.8% 26.8% 23.1% 16.2% 14.4% 17.1%
RASK (US cents) - new 8.7 8.6 8.5 8.2 7.1 6.8
RASK (US cents) - old 8.7 8.6 8.5 8.4 8.3 8.2
Difference 0.0% 0.0% 0.0% -3.1% -14.2% -16.6%
YoY 1.0% -1.6% -1.1% -3.8% -12.5% -4.3%
CASK (US cents) - new 8.4 7.9 8.0 7.7 6.8 6.6
CASK (US cents) - old 8.4 7.9 8.0 7.9 7.8 7.8
Difference 0.0% 0.0% 0.0% -2.3% -12.2% -15.7%
YoY 3.6% -6.0% 0.6% -3.3% -11.4% -4.2%
CASK-ex fuel (US cents) - new 5.5 4.9 5.0 4.9 4.7 4.5
CASK-ex fuel (US cents) - old 5.5 4.9 5.0 5.1 5.3 5.2
Difference 0.0% 0.0% 0.0% -4.2% -11.6% -12.9%
YoY -7.4% -10.0% 1.5% -2.6% -4.0% -3.6%
ROAE - new 0.4% 23.3% 11.0% 22.6% 17.8% 14.0%
ROAE - old 0.4% 23.3% 11.0% 21.2% 19.8% 17.8%
Difference 0.0 pps 0.0 pps 0.0 pps 1.4 pps -1.9 pps -3.7 pps
YoY (pps) -7.5 pps 22.9 pps -12.3 pps 11.5 pps -4.7 pps -3.8 pps
Average Brent price (USD) - new 111 112 108 99 61 67
Average Brent price (USD) - old 111 112 108 103 68 80
Difference 0.0% 0.0% 0.0% -3.4% -10.6% -16.3%
YoY 38% 1% -3% -9% -39% 10%
Source: The Company, Garanti Securities
*Figures are based on our own calculations may differ from company's figures
*2014 old figures are our previous assumptions, new figures are actual
Revisions in model assumptions at a glance*
Please see the last page of this report for important disclosures.
10
RESEARCH
June 18, 2015
Airlines
Turkish Airlines
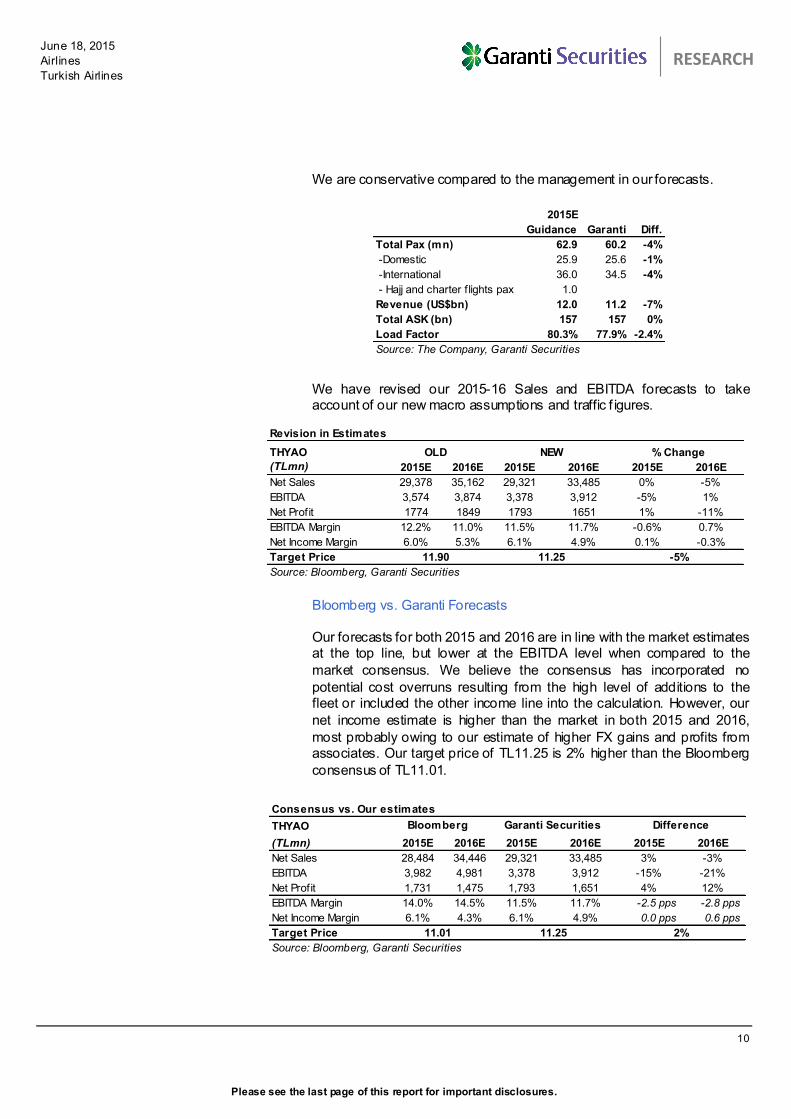
We are conservative compared to the management in our forecasts.
We have revised our 2015-16 Sales and EBITDA forecasts to take account of our new macro assumptions and traffic f igures.
Bloomberg vs. Garanti Forecasts
Our forecasts for both 2015 and 2016 are in line with the market estimates at the top line, but lower at the EBITDA level when compared to the
market consensus. We believe the consensus has incorporated no
potential cost overruns resulting from the high level of additions to the fleet or included the other income line into the calculation. However, our
net income estimate is higher than the market in both 2015 and 2016,
most probably owing to our estimate of higher FX gains and profits from associates. Our target price of TL11.25 is 2% higher than the Bloomberg
consensus of TL11.01.
2015E
Guidance Garanti Diff.
Total Pax (mn) 62.9 60.2 -4%
-Domestic 25.9 25.6 -1%
-International 36.0 34.5 -4%
- Hajj and charter f lights pax 1.0
Revenue (US$bn) 12.0 11.2 -7%
Total ASK (bn) 157 157 0%
Load Factor 80.3% 77.9% -2.4%
Source: The Company, Garanti Securities
Revision in Estimates
THYAO
(TLmn) 2015E 2016E 2015E 2016E 2015E 2016E
Net Sales 29,378 35,162 29,321 33,485 0% -5%
EBITDA 3,574 3,874 3,378 3,912 -5% 1%
Net Profit 1774 1849 1793 1651 1% -11%
EBITDA Margin 12.2% 11.0% 11.5% 11.7% -0.6% 0.7%
Net Income Margin 6.0% 5.3% 6.1% 4.9% 0.1% -0.3%
Target Price
Source: Bloomberg, Garanti Securities
OLD NEW % Change
11.90 11.25 -5%
Consensus vs. Our estimates
THYAO
(TLmn) 2015E 2016E 2015E 2016E 2015E 2016E
Net Sales 28,484 34,446 29,321 33,485 3% -3%
EBITDA 3,982 4,981 3,378 3,912 -15% -21%
Net Profit 1,731 1,475 1,793 1,651 4% 12%
EBITDA Margin 14.0% 14.5% 11.5% 11.7% -2.5 pps -2.8 pps
Net Income Margin 6.1% 4.3% 6.1% 4.9% 0.0 pps 0.6 pps
Target Price
Source: Bloomberg, Garanti Securities
Bloomberg Garanti Securities Difference
11.01 11.25 2%

Please see the last page of this report for important disclosures.
11
RESEARCH
June 18, 2015
Airlines
Turkish Airlines
Turkish Airlines 1Q15 Results Review Turkish Airlines reported a net prof it of TL373mn in 1Q15, better than the consensus estimate of a TL319mn net profit and in line with our estimate
of a TL380mn net prof it. The airline generated TL5,456mn of revenues in the quarter – in between the consensus and our expectation. 1Q15
EBITDA was broadly in line with our estimate while exceeded the
consensus by 23%. According to our calculations, the 1Q15 EBITDAR came in at TL594mn with a flattish margin YoY at 10.9%.
The Company recorded TL642mn of net financial income in the quarter compared to TL130mn expense a year ago, mainly due to FX gains.
Recall that, the airline’s functional currency is USD and the Company had
a TL9.3bn short FX position - mostly based in EUR and JPY - as of 1Q15.
In 1Q15, based on the Company’s calculations, unit revenues
decreased by 11% YoY (2% excluding currency impact) while CASK declined by 13% YoY thanks to lower oil prices. CASK (ex-fuel)
declined by 7% in 1Q15. According to the Company, on annual basis, 1Q operating profit was hit by US$89mn f rom currency and US$69mn
f rom unit revenue (ex-currency) weakness vs. positive impact of
favourable fuel prices at US$242mn.
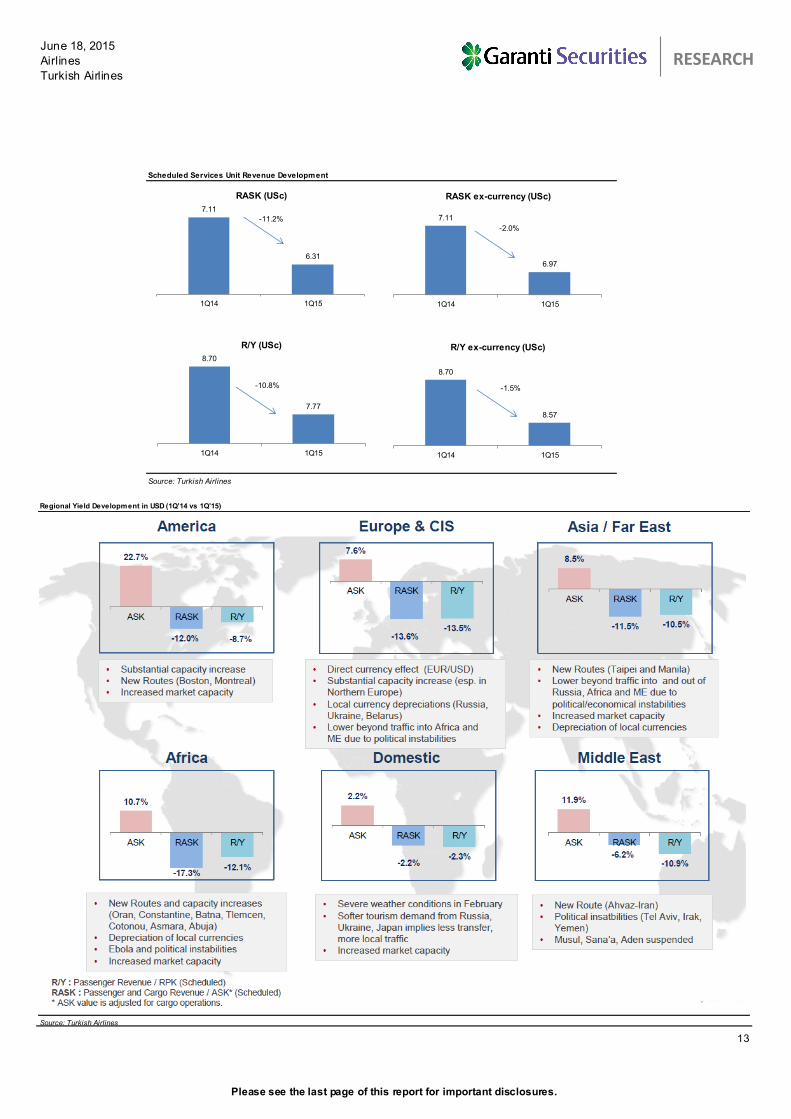
The Company shared some information regarding its regional yield
development in 1Q15 vs. 1Q14. Accordingly, all markets generated negative contribution to revenue. Africa was the worst performer with a
decline of 17% in RASK, followed by 14% in Europe&CIS, 12% in
America and Asia&Far East. The declines were 6% in Middle East and 2% in Turkey, respectively.
Turk Hava Yollari Summary Financials
(mn TL) 1Q14 2Q14 3Q14 4Q14 1Q15 1Q15/1Q14 1Q15/4Q14
Net Sales 5,128 6,139 7,171 5,721 5,456 6% -5%
Gross Profit 511 1,223 1,878 729 662 30% -9%
Operating Profit -226 438 1,157 -85 -176 n.m. n.m.
EBITDA 157 831 1,567 355 324 106% -9%
EBITDAR 570 999 1,919 607 594 4% -2%
Net Other Income/Expense 43 57 -3 -23 128 195% n.m.
Profit (Loss) from Subsidiaries -18 59 102 18 -33 n.m. n.m.
Financial Inc./ Exp. (net) -130 -127 478 362 642 n.m. 77%
PROFIT BEFORE TAX FROM CONTINUING OPERATIONS -303 455 1,762 348 592 n.m. 70%
Tax 77 -57 -388 -74 -219 n.m. n.m.
Net Income -226 398 1,373 274 373 n.m. 36%
Net Cash -10,927 -10,741 -11,449 -12,125 -13,978
Working Capital 415 322 172 -29 578
Shareholders Equity 6,909 7,155 9,221 9,154 10,924
Ratios
Gross Margin 10.0% 19.9% 26.2% 12.7% 12.1% 2.2 pp -0.6 pp
Operating Margin n.m. 7.1% 16.1% n.m. n.m. n.m. n.m.
EBITDA Margin 3.1% 13.5% 21.9% 6.2% 5.9% 2.9 pp -0.3 pp
EBITDAR Margin 11.1% 16.3% 26.8% 10.6% 10.9% -0.2 pp 0.3 pp
Net Profit Margin n.m. 6.5% 19.2% 4.8% 6.8% n.m. 2.1 pp
Change

Please see the last page of this report for important disclosures.
12
RESEARCH
June 18, 2015
Airlines
Turkish Airlines
Revenue Development (1Q14 vs 1Q15) (USDmn)
Source: Turkish Airlines
2,315
2,219
181
-15-62
-200
2,000
2,050
2,100
2,150
2,200
2,250
2,300
2,350
2,400
2,450
2,500
1Q14 Volume Decrease in Cargo andOther Rev.
Unit Revenue (R/Y) Currency 1Q15
Net Operating Profit Bridge (USDmn)
Source: Turkish Airlines
-103
-89
-69
-24 -14-13
242
-70
0
100
200
300
400
500
600
1Q14 Currency Unit Revenue(R/Y)
Utilization L/F Ex-fuel Unit Cost(ex-currency ex-
utilization)
Fuel 1Q15
CASK Breakdown (USc) 1Q14 1Q15 Change
Fuel 2.93 2.18 -25.8%
Personnel 1.32 1.25 -5.3%
Aircraft Ow nership 1.00 0.95 -4.9%
Airports & Air Navigation 0.72 0.61 -15.2%
Sales & Marketing 0.64 0.60 -5.2%
Ground Handling 0.48 0.44 -9.2%
Passenger Services & Catering 0.42 0.41 -0.6%
Maintenance 0.31 0.29 -6.6%
General Administration 0.06 0.07 21.9%
Other Cost of Sales 0.13 0.12 -1.3%
TOTAL 8.00 6.92 -13.4%
Source: Turkish Airlines
Please see the last page of this report for important disclosures.
13
RESEARCH
June 18, 2015
Airlines
Turkish Airlines
Scheduled Services Unit Revenue Development
Source: Turkish Airlines
7.11
6.31
1Q14 1Q15
RASK (USc)
7.11
6.97
1Q14 1Q15
RASK ex-currency (USc)
-2.0%
8.70
7.77
1Q14 1Q15
R/Y (USc)
-10.8%
8.70
8.57
1Q14 1Q15
R/Y ex-currency (USc)
-1.5%
-11.2%
Regional Yield Development in USD (1Q’14 vs 1Q’15)
Source: Turkish Airlines

Please see the last page of this report for important disclosures.
14
RESEARCH
June 18, 2015
Airlines
Turkish Airlines
Source: The Company, Garanti Securities
Quarterly Figures
7.7
8.7
9.3
8.48.1
8.69.0
8.07.7
8.59.1
7.4
6.7
0.0
1.0
2.0
3.0
4.0
5.0
6.0
7.0
8.0
9.0
10.0
1Q12 2Q12 3Q12 4Q12 1Q13 2Q13 3Q13 4Q13 1Q14 2Q14 3Q14 4Q14 1Q15
US
ce
nt
RASK
8.38.0
7.2
8.4 8.27.8 7.6
8.28.0 7.9
7.6 7.5
6.9
0.0
1.0
2.0
3.0
4.0
5.0
6.0
7.0
8.0
9.0
1Q12 2Q12 3Q12 4Q12 1Q13 2Q13 3Q13 4Q13 1Q14 2Q14 3Q14 4Q14 1Q15
US
ce
nt
CASK
-1.0
-0.5
0.0
0.5
1.0
1.5
2.0
2.5
0.0%
5.0%
10.0%
15.0%
20.0%
25.0%
30.0%
35.0%
1Q12 2Q12 3Q12 4Q12 1Q13 2Q13 3Q13 4Q13 1Q14 2Q14 3Q14 4Q14 1Q15
US
ce
nts
EBITDAR margin RASK-CASK (rhs)
5.3
4.8
4.4
5.4
5.2
4.9
4.7
5.2
5.15.0
4.7
4.9
4.7
4.0
4.2
4.4
4.6
4.8
5.0
5.2
5.4
5.6
1Q12 2Q12 3Q12 4Q12 1Q13 2Q13 3Q13 4Q13 1Q14 2Q14 3Q14 4Q14 1Q15
US
cen
t
non-fuel CASK
68.0%
70.0%
72.0%
74.0%
76.0%
78.0%
80.0%
82.0%
84.0%
-
5,000
10,000
15,000
20,000
25,000
30,000
35,000
40,000
1Q12 2Q12 3Q12 4Q12 1Q13 2Q13 3Q13 4Q13 1Q14 2Q14 3Q14 4Q14 1Q15
mn
ASK Load factor (rhs)
0.00
0.20
0.40
0.60
0.80
1.00
1.20
1.40
1.60
0.00
0.20
0.40
0.60
0.80
1.00
1.20
1.40
1Q12 2Q12 3Q12 4Q12 1Q13 2Q13 3Q13 4Q13 1Q14 2Q14 3Q14 4Q14 1Q15
RASK/CASK EUR/USD - avg (rhs)
Turkish Airlines Traffic Figures
TOTAL
May.14 May.15 YoY Apr.15 MoM 5M14 5M15 YoY
Number of Landing 35,632 39,395 10.6% 36,648 7.5% 163,998 173,789 6.0%
Available Seat Km ('000) 11,482,373 13,098,265 14.1% 12,060,761 8.6% 52,539,502 57,877,353 10.2%
Revenue Passenger Km ('000) 9,134,608 10,293,260 12.7% 9,443,385 9.0% 41,279,017 44,898,239 8.8%
Passenger Load Factor (%) 79.6% 78.6% -0.9p 78.3% 0.28p 78.6% 77.6% -0.9p
Passengers Carried 4,735,840 5,404,402 14.1% 4,955,005 9.1% 21,354,513 23,212,782 8.7%
Cargo and Mail (Tons) 58,012 65,321 12.6% 59,282 10.2% 271,165 284,198 4.8%
Km Flow n ('000) 67,040 72,835 8.6% 68,743 6.0% 310,750 331,974 6.8%
Int-to-Int Transfer Passengers Carried 1,123,383 1,327,959 18.2% 1,282,180 3.6% 5,509,329 6,137,552 11.4%
Source: Turkish Airlines, Garanti Securities

Please see the last page of this report for important disclosures.
15
RESEARCH
June 18, 2015
Airlines
Turkish Airlines
Source: The Company, Garanti Securities
Yearly Figures
8.6 8.58.2
7.16.8
0.0
1.0
2.0
3.0
4.0
5.0
6.0
7.0
8.0
9.0
2012 2013 2014 2015E 2016E
US
ce
nt
RASK
7.9 8.07.7
6.86.6
0.0
1.0
2.0
3.0
4.0
5.0
6.0
7.0
8.0
9.0
2012 2013 2014 2015E 2016E
US
ce
nt
CASK
0.0
0.1
0.2
0.3
0.4
0.5
0.6
0.7
0.0%
2.0%
4.0%
6.0%
8.0%
10.0%
12.0%
14.0%
16.0%
18.0%
20.0%
2012 2013 2014 2015E 2016E
US
ce
nts
EBITDAR margin RASK-CASK (rhs)
4.9
5.0
4.9
4.7
4.5
4.2
4.3
4.4
4.5
4.6
4.7
4.8
4.9
5.0
5.1
2012 2013 2014 2015E 2016E
US
cen
t
non-fuel CASK
77.0%
77.5%
78.0%
78.5%
79.0%
79.5%
-
20,000
40,000
60,000
80,000
100,000
120,000
140,000
160,000
180,000
200,000
2012 2013 2014 2015E 2016E
mn
ASK Load factor (rhs)
0.00
0.20
0.40
0.60
0.80
1.00
1.20
1.40
1.02
1.03
1.04
1.05
1.06
1.07
1.08
1.09
2012 2013 2014 2015E 2016E
RASK/CASK EUR/USD - avg (rhs)
THY Revenue by currency THY Expenses by currency
Source: The Company data
EURO, 40%
USD, 16%
TL, 14%
Other, 30%
2014
EURO, 14%
USD, 56%
TL, 24%
Other, 6%
2014

16
June 18, 2015
Pegasus Airlines Outperform (Maintained)
Current Price TL 25.10TL
12M Target Price TL 31.65TL
Potential Return TL 26%
Current Mcap (TLmn) 2,567
Current EV (TLmn) 4,477
939
Bloomberg/Reuters:
1 mth 3 mth 12mth
3% 1% -14%
16.9
YTD TL Return: -24%
102
Free Float (%): 35
41%
Financials and Ratios 2013 2014 2015E 2016E
Net Sales (TLmn) 2,394 3,082 3,564 4,113
EBITDA (TLmn) 412 412 363 463 Research Analyst: Baris Ince
EBITDAR (TLmn) 528 600 660 828 +90 (212) 384 1141
Net Income (TLmn) 92 143 190 279 [email protected]
EBITDA Margin 17.2% 13.4% 10.2% 11.3%
EBITDAR Margin 22.1% 19.5% 18.5% 20.1% Sales Contact:
P/E (x) 28.0 17.9 13.5 9.2 +90 (212) 384 1155-58
EV/EBITDA (x) 7.6 7.0 7.5 5.9 [email protected]
EV/Sales (x) 1.31 0.94 0.77 0.67
EPS (TL) 0.90 1.40 1.85 2.72
DPS (TL) 0.00 0.00 0.00 0.00
Current Mcap (US$mn)
Price Performance (TL)
Stock Market Data
PGSUS.TI / PGSUS.IS
Relative Performance:
52 Week Range (TL): 23.35 / 34.95
Average Daily Vol (US$mn) 3 mth:
Shares Outstanding (mn):
Foreign Ow nership in Free Float :
20.00
26.00
32.00
38.00
44.00
50.00
12.1
3
01.1
4
02.1
4
03.1
4
04.1
4
05.1
4
06.1
4
07.1
4
08.1
4
09.1
4
10.1
4
11.1
4
12.1
4
01.1
5
02.1
5
03.1
5
04.1
5
05.1
5
PGSUS BIST-100
Still attractive, yet ST risks dominate the agenda
We maintained Outperform rating for Pegasus Airlines with a 20%
lower 12 month forward target price of TL31.65/share, indicating
26% upside potential.
We find the airline’s growth prospects attractive, however, we doubt
that Pegasus will be able to achieve cost efficiencies over its
competitors in 2015 due to exchange rate pressure, changes in the fleet mix and initial ramp handling investments. Potential
competition from THY could also pressure the airline. Despite
aforementioned headwinds on cost side, we believe that the current
levels offer a good entry point for the LT investors. The stock trades
on par vs. peers, on its 2015E EV/EBITDA vs. 17% discount in 2016.
We reduced our estimates mainly on profitability side rather than
top line. The Company guides for stable yields compared to a c3 -4%
increase in unit costs. We trimmed our EBITDA and net income forecasts by a 18% and 35% for 2015.
Margins would be under pressure this year
Pegasus Airlines faced stiff competition from Turkish Airlines (THY) in 2014 with the flag carrier moving to form a second hub at SAW given the capacity
constraints at its IAA hub. THY plans to increase its market share at SAW by
5pps to 25% in 2015 with 28 aircraft operating from the terminal - which will
mean more pressure on revenue yields this year as well. In addition to
exchange rate movements and the change in the fleet mix, initial ramp
handling investments may burden Pegasus Airlines with additional cost
pressures in the short term. With our conservative assumptions, we cut our EBITDAR margin forecasts by 0.8 pps to 18.5% (vs. 19-21% guidance). On
the other hand, Pegasus enjoys strong ancillary revenues at EUR10.2/pax
(EUR9.3 in 2014), which are expected to remain between EUR10 -12 in the
next 2 years (we forecast EUR11.0/pax in 2016). We assume a 1% lower
RASK in 2015, but, 3% increase in CASK. The airline guides for a stable
yields and a 3-4% increase in CASK with a stable load factor. The Company
targets 15-17% growth in pax figures in 2015 (vs. our 12%). Pegasus recorded a net loss of TL147mn from derivative contracts on fuel and the
currency in 2014. As of 1Q15, Pegasus had a TL34mn liability under its
equity in connection with its derivatives contracts to be released to the P&L
in 2015 if realized, we conservatively reflected the amount of TL34mn to
2015E net income forecast (TL28mn in 1Q15). The Company hedges %45 of
its 2015 budgeted fuel consumption. Hedged price is around USD96. All else
being equal, each USD5/bbl and 1% change in our assumption for oil prices and EUR/USD result in a 12% and 3% change in the 2015E EBITDA for
Pegasus. (see page 6).The Company has recently converted international
ticket sales originating in Turkey to USD from EUR. Such sales account for
c13% of its revenue. This will reduce the negative impacts of currency
mismatch on operations. 39% and 15% of revenues were in EUR and USD,
respectively, in 2014 while those of costs were 23% and 56%.
RESEARCH
Turkey - Equity - Airlines
Company Update

Please see the last page of this report for important disclosures.
17
RESEARCH
SUMMARY FINANCIALS (TL mn)
The Company in Brief
Pegasus Airlines is a low cost carrier with a fleet of
61 aircrafts as April 2015. Founded in 1990 to
provide charter services, Pegasus’s business model
was changed following its acquisition by Esas
Holding in 2005. The airline uses Istanbul Sabiha
Gokcen Airport as main hub, and flies to 91 routes in
37 countries. Pegasus carried c.20mn passengers in
2014. In 2012, Pegasus placed an order for 100
aircraft (75 firm + 25 optional orders) to be delivered
between 2016 and 2022.
Shareholders
Esas Holding 62.92%,
Sabancı Family Members 2.57%
Free Float 34.51%
June 18, 2015
Airlines
Pegasus Airlines
Income Statement 2013 2014 2015E 2016E 15E/14
Net Sales 2,394 3,082 3,564 4,113 16%
Operating Expenses -2,118 -2,834 -3,407 -3,905 20%
Operating Profit 276 247 157 208 -37%
Consolidated EBITDA 412 412 363 463 -12%
Consolidated EBITDAR 528 600 660 828 10%
Net Other Income/ Expense -18 77 71 82 -8%
Profit (Loss) from Subsidiaries -5 9 24 28 178%
Net financial Income/ Expense -99 -198 -15 30 -92%
Profit (Loss) before Tax 155 136 237 348 75%
Tax -66 8 -47 -70 n.m.
Minority Interests -3 0 0 0 0%
Net Income 92 143 190 279 32%
Ratios
EBIT Margin 11.5% 8.0% 4.4% 5.1% -3.6 pp
EBITDA Margin 17.2% 13.4% 10.2% 11.3% -3.2 pp
EBITDAR Margin 22.1% 19.5% 18.5% 20.1% -0.9 pp
Net Income Margin 3.8% 4.7% 5.3% 6.8% 0.7 pp
Balance Sheet 2013 2014 2015E 2016E 15E/14
Current Assets 1,227 1,509 2,319 3,032 54%
Cash and Cash Equivalents 877 857 1,579 2,165 84%
Short-Term Trade Receivables 191 233 258 309 10%
Inventories 4 8 6 10 -16%
Other Current Assets 154 411 475 549 16%
Long Term Assets 2,278 2,026 2,160 2,297 7%
Total Assets 3,505 3,535 4,479 5,328 27%
Short Term Liabilities 684 863 1,230 1,449 43%
Short-Term Financial Loans 4 5 175 235 3783%
Short-Term Trade Payables 167 196 242 259 23%
Other Short-Term Liabilities 513 662 814 955 23%
Long Term Liabilities 1,674 1,511 1,898 2,439 26%
Long-Term Financial Loans 1,441 1,187 1,574 2,116 33%
Other Long-Term Liabilities 233 324 324 324 0%
Shareholders Equity 1,146 1,161 1,351 1,440 16%
T. Liabilities & S.h Equity 3,504 3,535 4,479 5,328 27%

Please see the last page of this report for important disclosures.
18
RESEARCH
June 18, 2015
Airlines
Pegasus Airlines
REVISIONS TO FORECASTS
2011 2012 2013 2014 2015E 2016E
# of total passengers (mn) - new 10.7 13.6 16.8 19.7 22.2 25.2
# of total passengers (mn) - old 10.7 13.6 16.8 19.9 22.9 26.4
Difference 0.0% 0.0% 0.0% -0.8% -3.2% -4.4%
YoY 33.7% 26.8% 23.9% 17.4% 12.3% 13.8%
Load factor - new 74.9% 78.2% 80.2% 80.0% 79.4% 79.9%
Load factor - old 74.9% 78.2% 80.2% 80.7% 81.2% 81.7%
Difference 0.0 pps 0.0 pps 0.0 pps -0.7 pps -1.7 pps -1.8 pps
YoY (pps) -0.8 pps 3.3 pps 2.0 pps -0.3 pps -0.5 pps 0.5 pps
ASK (bn) - new 13.5 16.4 20.2 24.4 28.4 33.1
ASK (bn) - old 13.5 16.4 20.2 23.8 28.0 32.8
Difference 0.0% 0.0% 0.0% 2.2% 1.4% 0.9%
YoY 26.6% 22.0% 22.7% 20.9% 16.5% 16.5%
RPK (bn) - new 10.1 12.8 16.2 19.5 22.6 26.4
RPK (bn) - old 10.1 12.8 16.2 19.2 22.7 26.8
Difference 0.0% 0.0% 0.0% 1.3% -0.7% -1.3%
YoY 25.3% 27.3% 25.9% 20.5% 15.8% 17.2%
RASK (EUR cents) - new 4.7 5.1 4.7 4.4 4.3 4.3
RASK (EUR cents) - old 4.7 5.1 4.7 4.5 4.5 4.5
Difference 0.0% 0.0% 0.0% -2.7% -5.0% -4.4%
YoY 2.6% 7.0% -7.4% -7.4% -1.3% 0.8%
Ancillenary revenue/pax (EUR) - new 5.9 7.4 8.0 9.3 10.0 11.0
Ancillenary revenue/pax (EUR) - old 5.9 7.4 8.0 9.1 10.8 11.4
Difference 0.0% 0.0% 0.0% 1.7% -7.1% -3.7%
YoY -0.6% 25.4% 8.8% 16.0% 7.8% 9.9%
CASK (EUR cents) - new 4.8 4.6 4.2 4.0 4.1 4.1
CASK (EUR cents) - old 4.8 4.6 4.2 4.1 4.1 4.1
Difference 0.0% 0.0% 0.0% -3.1% -0.1% 0.5%
YoY 6.9% -3.9% -9.1% -3.7% 2.6% 0.1%
CASK-ex fuel (EUR cents) - new 2.8 2.7 2.5 2.3 2.6 2.7
CASK-ex fuel (EUR cents) - old 2.8 2.7 2.5 2.6 2.6 2.5
Difference 0.0% 0.0% 0.0% -9.6% -0.1% 6.3%
YoY -1.6% -3.2% -10% -4.3% 10.1% 4.2%
ROAE - new -8.6% 46.1% 12.4% 12.4% 15.1% 20.0%
ROAE - old -8.6% 46.1% 12.4% 20.1% 18.9% 21.2%
Difference 0.0 pps 0.0 pps 0.0 pps -7.6 pps -3.8 pps -1.3 pps
YoY (pps) n.m 54.6 pps -33.6 pps 0.0 pps 2.7 pps 4.9 pps
Average Brent price (USD) - new 111 112 108 99 61 67
Average Brent price (USD) - old 111 112 108 103 68 80
Difference 0.0% 0.0% 0.0% -3.4% -10.6% -16.3%
Source: The Company, Garanti Securities
*Figures are based on our own calculations may differ from company's figures
*2014 old figures are our previous assumptions, new figures are actual
Revisions in model assumptions at a glance*

Please see the last page of this report for important disclosures.
19
RESEARCH
June 18, 2015
Airlines
Pegasus Airlines
As shown above, we have fine tuned some of our forecasts based on the our new macroeconomic assumptions and new guidance. We have
revised our traffic assumptions for the 2015-2016 period, while lowering
our RASK (EUR) forecasts by 5.0% and 4.4% for 2015 and 2016 while keeping our forecast for the CASK flat for 2015 but increasing it by 0.5%
for 2016. Those imply a 1% YoY lower RASK for 2015, compared to a 2.6% increase in CASK in the same period; for 2016, we expect a 0.8%
increase in the RASK and 0.1% increase in the CASK. The management
aims to post a stable yield, while securing a 3-4% increase in the CASK figures in 2015, with no change in the load factor.
While we have slightly revised our 2015-16 sales, we have trimmed our EBITDA forecast by 18% for 2015 and 14% for 2016 given the anticipated
further cost pressures f rom the exchange rate effect, change in the fleet
mix and ramp handling investments. We have slashed our net income forecasts for 2015-2016 on weaker profitability, losses f rom derivative
operations and new exchange rate assumptions.
2015E Guidance Garanti
Total Pax growth c15-17% 12%
Total ASK growth c17-19% 17%
Load Factor flat (c80%) 79%
Yields flat flat
Ancillary revenue per pax (EUR) 10 10
CASK (EUR) growth 3-4% 3%
EBITDAR margin 19-21% 18.5%
Source: The Company, Garanti Securities
Revision in Estimates
PGSUS
(TLmn) 2015E 2016E 2015E 2016E 2015E 2016E
Net Sales 3,532 4,302 3,564 4,113 1% -4%
EBITDA 444 540 363 463 -18% -14%
Net Profit 292 368 190 279 -35% -24%
EBITDA Margin 12.6% 12.6% 10.2% 11.3% -2.4% -1.3%
Net Income Margin 8.3% 8.6% 5.3% 6.8% -2.9% -1.8%
Target Price
Source: Bloomberg, Garanti Securities
OLD NEW % Change
39.80 31.65 -20%

Please see the last page of this report for important disclosures.
20
RESEARCH
June 18, 2015
Airlines
Pegasus Airlines
Bloomberg vs. Garanti Forecasts
Our forecasts are inline with the market consensus in terms of sales yet,
lower in terms of EBITDA and net income in 2015. We believe that the
consensus does not fully reflect the likely competition and further cost pressures. Different losses f rom derivative operations would be another
reason behind the deviation between net income forecasts. Meanwhile,
our target price of TL31.65 is 2% higher than the Bloomberg consensus of TL31.09.
Pegasus Airlines 1Q15 Results Review Pegasus reported a net loss of TL74mn in 1Q15, lower than the
consensus estimate of TL43mn net loss and our estimate of TL20mn net
loss. The Company generated TL583mn of revenues in the quarter – in line with both our own and the consensus estimate. EBITDA was weaker
compared to both consensus and our forecasts, yet, losses from
derivative operations and higher effective tax rate were the main reasons behind the worse than expected botomline.
Based on our calculations, EBITDAR margin turned to positive at 2% in 1Q15. The Company recorded TL82mn net other income which is driven
by FX gains in the quarter vs. TL13mn expense a year ago. Recall that, the Company’s functional currency is EUR and it has TL842mn long
position - most of which based in USD.
Pegasus recorded TL28mn losses f rom derivative operations. There was
tax expense of TL34mn (vs. TL10mn income in 1Q14) and minority
interest of TL6mn (vs. TL2mn in 1Q14) in the quarter vs. TL46mn loss before tax.
Consensus vs. Our estimates
PGSUS
(TLmn) 2015E 2016E 2015E 2016E 2015E 2016E
Net Sales 3,603 4,389 3,564 4,113 -1% -6%
EBITDA 410 485 363 463 -11% -4%
Net Profit 212 241 190 266 -11% 10%
EBITDA Margin 11.4% 11.1% 10.2% 11.3% -1.2 pps 0.2 pps
Net Income Margin 5.9% 5.5% 5.3% 6.5% -0.6 pps 1.0 pps
Target Share Price
Source: Bloomberg, Garanti Securities
Bloomberg Garanti Securities Difference
31.09 31.65 2%

Please see the last page of this report for important disclosures.
21
RESEARCH
June 18, 2015
Airlines
Pegasus Airlines
According to our calculations, domestic RASK (in TL) decreased by 3% YoY in 1Q15 (vs. 6% decline in 1Q14) while that of international was up
by 9% in EUR terms (vs. 18% decline in 1Q15). On cost front, CASK
increased by 1% in EUR terms in 1Q15 after 3% decline in 1Q14. Non-fuel CASK rose by 9% in 1Q15 due to the increased leasing expenses.
On the other hand, ancillary revenues per passenger increased by 13% to EUR10.2 and ancillary revenues accounts for 22% of total revenues in
1Q15 similar to 1Q14.
Pegasus Hava Tasimaciligi Summary Financials
(mn TL) 1Q14 2Q14 3Q14 4Q14 1Q15 1Q15/1Q14 1Q15/4Q14
Net Sales 511 800 1,109 662 583 14% -12%
Gross Profit -51 137 339 38 -35 n.m. n.m.
Operating Profit -113 81 293 -14 -93 n.m. n.m.
EBITDA -71 122 335 26 -53 n.m. n.m.
EBITDAR -30 169 384 77 11 n.m. -85%
Net Other Income/Expense -13 21 38 31 82 n.m. n.m.
Financial Inc./ Exp. (net) 9 9 -25 -190 -45 n.m. n.m.
Tax 10 -22 -60 81 -34 n.m. n.m.
Net Income -103 87 251 -92 -74 n.m. n.m.
Net Cash -758 -493 -261 -497 -408
Working Capital 87 114 82 44 82
Shareholders Equity 1,070 1,117 1,340 1,161 1,111
Ratios
Gross Margin n.m. 17.2% 30.6% 5.7% n.m. n.m. n.m.
Operating Margin n.m. 10.1% 26.4% n.m. n.m. n.m. n.m.
EBITDA Margin n.m. 15.3% 30.2% 3.9% n.m. n.m. n.m.
EBITDAR Margin n.m. 21.1% 34.7% 11.6% 2.0% n.m. -9.6 pp
Net Profit Margin n.m. 10.9% 22.6% n.m. n.m. n.m. n.m.
Change

Please see the last page of this report for important disclosures.
22
RESEARCH
June 18, 2015
Airlines
Pegasus Airlines
CASK non-fuel Analysis (EUR cents)
Source: Pegasus Airlines
2.63
2.85
0.05 0.03
0.14
2.00
2.10
2.20
2.30
2.40
2.50
2.60
2.70
2.80
2.90
3.00
2014 Q1 CASK nonfuel
Escalation on TLcost base (*)
Structural changes(**)
Fx & Other 2015 Q1 CASK nonfuel
1Q EBITDAR Evolution (TLmn)
-29.4
-4.8 10
66.9
-8.6-3.5
-19.4 11.3
-60
-40
-20
0
20
40
60
Source: Pegasus Airlines
Please see the last page of this report for important disclosures.
23
RESEARCH
June 18, 2015
Airlines
Pegasus Airlines
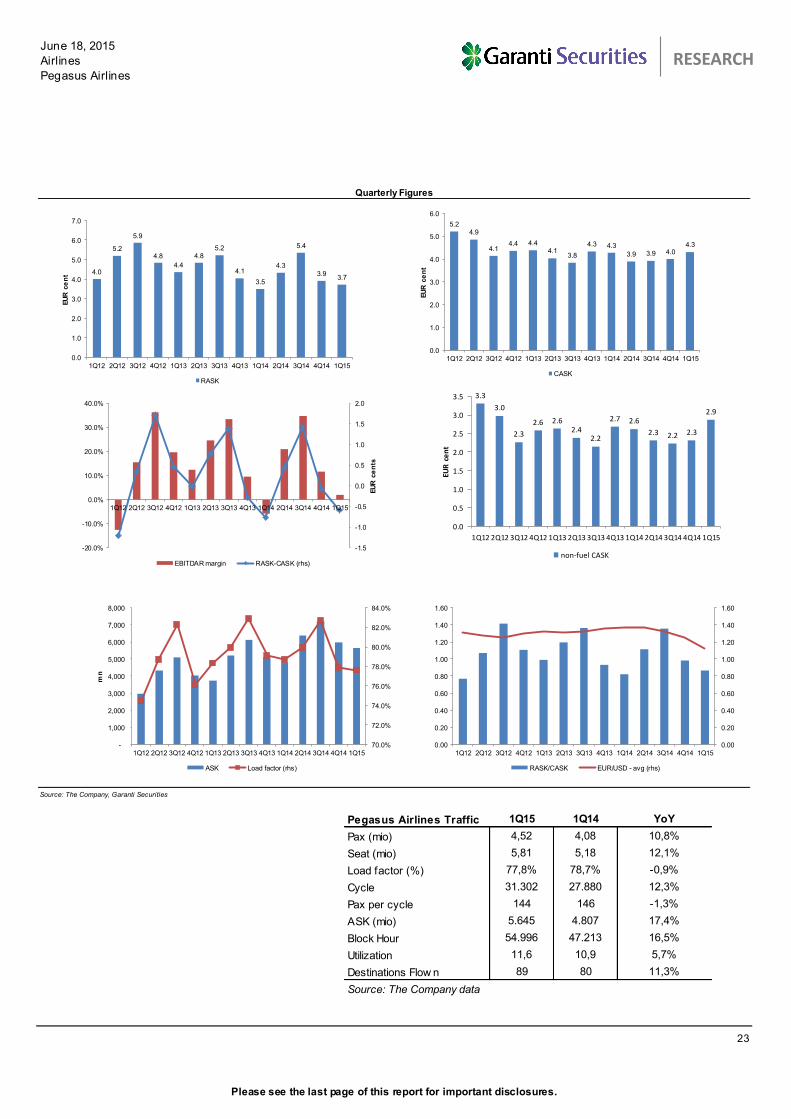
Source: The Company, Garanti Securities
Quarterly Figures
4.0
5.2
5.9
4.8
4.4
4.85.2
4.1
3.5
4.3
5.4
3.93.7
0.0
1.0
2.0
3.0
4.0
5.0
6.0
7.0
1Q12 2Q12 3Q12 4Q12 1Q13 2Q13 3Q13 4Q13 1Q14 2Q14 3Q14 4Q14 1Q15
EU
R c
en
t
RASK
5.24.9
4.14.4 4.4
4.13.8
4.3 4.3
3.9 3.9 4.04.3
0.0
1.0
2.0
3.0
4.0
5.0
6.0
1Q12 2Q12 3Q12 4Q12 1Q13 2Q13 3Q13 4Q13 1Q14 2Q14 3Q14 4Q14 1Q15
EU
R c
en
t
CASK
-1.5
-1.0
-0.5
0.0
0.5
1.0
1.5
2.0
-20.0%
-10.0%
0.0%
10.0%
20.0%
30.0%
40.0%
1Q12 2Q12 3Q12 4Q12 1Q13 2Q13 3Q13 4Q13 1Q14 2Q14 3Q14 4Q14 1Q15
EU
R c
en
ts
EBITDAR margin RASK-CASK (rhs)
3.3
3.0
2.3
2.6 2.62.4
2.2
2.7 2.6
2.3 2.2 2.3
2.9
0.0
0.5
1.0
1.5
2.0
2.5
3.0
3.5
1Q12 2Q12 3Q12 4Q12 1Q13 2Q13 3Q13 4Q13 1Q14 2Q14 3Q14 4Q14 1Q15
EUR
ce
nt
non-fuel CASK
70.0%
72.0%
74.0%
76.0%
78.0%
80.0%
82.0%
84.0%
-
1,000
2,000
3,000
4,000
5,000
6,000
7,000
8,000
1Q12 2Q12 3Q12 4Q12 1Q13 2Q13 3Q13 4Q13 1Q14 2Q14 3Q14 4Q14 1Q15
mn
ASK Load factor (rhs)
0.00
0.20
0.40
0.60
0.80
1.00
1.20
1.40
1.60
0.00
0.20
0.40
0.60
0.80
1.00
1.20
1.40
1.60
1Q12 2Q12 3Q12 4Q12 1Q13 2Q13 3Q13 4Q13 1Q14 2Q14 3Q14 4Q14 1Q15
RASK/CASK EUR/USD - avg (rhs)
1Q15 1Q14 YoY
4,52 4,08 10,8%
5,81 5,18 12,1%
77,8% 78,7% -0,9%
31.302 27.880 12,3%
144 146 -1,3%
5.645 4.807 17,4%
54.996 47.213 16,5%
11,6 10,9 5,7%
89 80 11,3%
Source: The Company data
Pax (mio)
Utilization
Destinations Flow n
Seat (mio)
Load factor (%)
Cycle
Pax per cycle
ASK (mio)
Block Hour
Pegasus Airlines Traffic

Please see the last page of this report for important disclosures.
24
RESEARCH
June 18, 2015
Airlines
Pegasus Airlines
Source: The Company, Garanti Securities
Yearly Figures
5.1
4.7
4.44.3 4.3
3.8
4.0
4.2
4.4
4.6
4.8
5.0
5.2
2012 2013 2014 2015E 2016E
EU
R c
en
t
RASK
4.6
4.2
4.0
4.1 4.1
3.7
3.8
3.9
4.0
4.1
4.2
4.3
4.4
4.5
4.6
4.7
2012 2013 2014 2015E 2016E
EU
R c
en
t
CASK
0.0
0.1
0.2
0.3
0.4
0.5
0.6
0.0%
5.0%
10.0%
15.0%
20.0%
25.0%
2012 2013 2014 2015E 2016E
EU
R c
en
ts
EBITDAR margin RASK-CASK (rhs)
2.7
2.5
2.3
2.6
2.7
2.1
2.2
2.3
2.4
2.5
2.6
2.7
2.8
2012 2013 2014 2015E 2016E
EUR
ce
nt
non-fuel CASK
72.0%
73.0%
74.0%
75.0%
76.0%
77.0%
78.0%
79.0%
80.0%
81.0%
-
5,000
10,000
15,000
20,000
25,000
30,000
35,000
2012 2013 2014 2015E 2016E
mn
ASK Load factor (rhs)
0.00
0.20
0.40
0.60
0.80
1.00
1.20
1.40
1.00
1.02
1.04
1.06
1.08
1.10
1.12
1.14
2012 2013 2014 2015E 2016E
RASK/CASK EUR/USD - avg (rhs)
Pegasus Revenue exposure Pegasus Expenses exposure
Source: The Company data
EURO, 39%
USD, 15%
TL, 41%
Other, 5%
2014
EURO, 23%
USD, 56%
TL, 19%
Other, 2%
2014
25
RESEARCH
Disclaimer
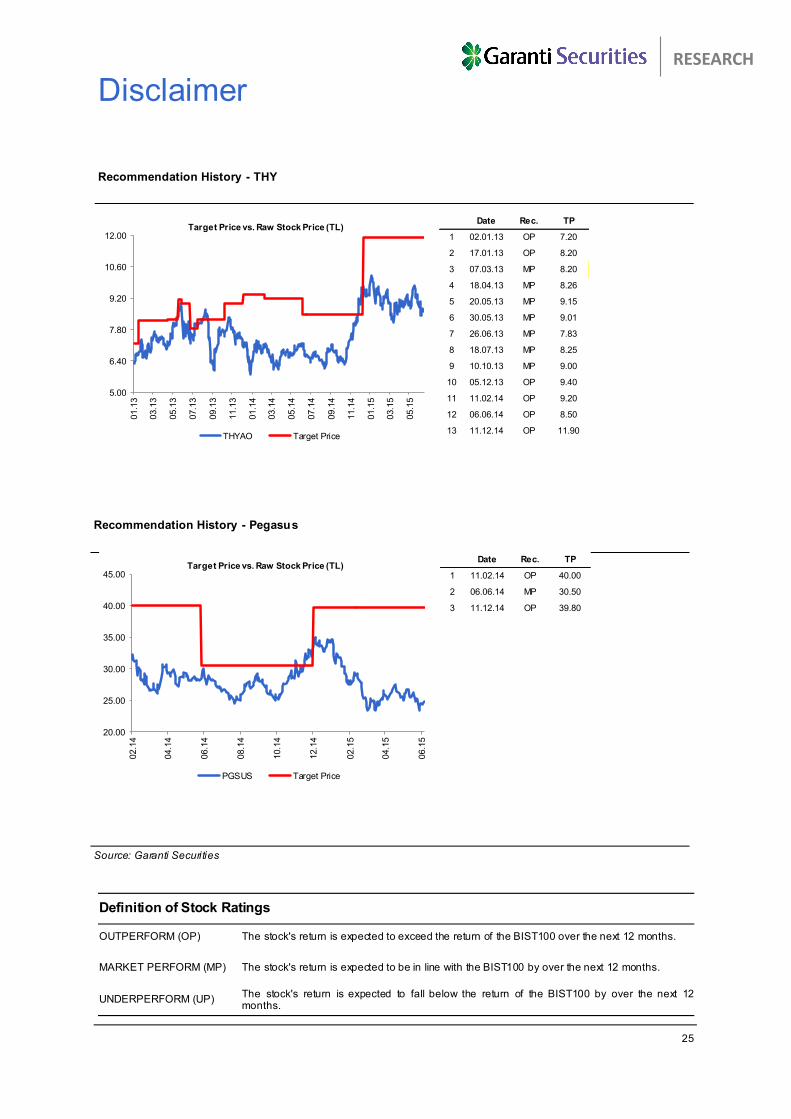
Recommendation History - THY
Definition of Stock Ratings
OUTPERFORM (OP) The stock's return is expected to exceed the return of the BIST100 over the next 12 months.
MARKET PERFORM (MP) The stock's return is expected to be in line with the BIST100 by over the next 12 months.
UNDERPERFORM (UP) The stock's return is expected to fall below the return of the BIST100 by over the next 12 months.
Recommendation History - Pegasus
Source: Garanti Securities
Date Rec. TP
1 02.01.13 OP 7.20
2 17.01.13 OP 8.20
3 07.03.13 MP 8.20
4 18.04.13 MP 8.26
5 20.05.13 MP 9.15
6 30.05.13 MP 9.01
7 26.06.13 MP 7.83
8 18.07.13 MP 8.25
9 10.10.13 MP 9.00
10 05.12.13 OP 9.40
11 11.02.14 OP 9.20
12 06.06.14 OP 8.50
13 11.12.14 OP 11.90
5.00
6.40
7.80
9.20
10.60
12.00
01.1
3
03.1
3
05.1
3
07.1
3
09.1
3
11.1
3
01.1
4
03.1
4
05.1
4
07.1
4
09.1
4
11.1
4
01.1
5
03.1
5
05.1
5
Target Price vs. Raw Stock Price (TL)
THYAO Target Price
Date Rec. TP
1 11.02.14 OP 40.00
2 06.06.14 MP 30.50
3 11.12.14 OP 39.80
20.00
25.00
30.00
35.00
40.00
45.00
02.1
4
04.1
4
06.1
4
08.1
4
10.1
4
12.1
4
02.1
5
04.1
5
06.1
5
Target Price vs. Raw Stock Price (TL)
PGSUS Target Price

Please see the last page of this report for important disclosures.
26
RESEARCH
Disclaimer
This document and the information, opinions, estimates and recommendations expressed herein,
have been prepared by Garanti Securities Research Department, to provide its customers with general information regarding the date of issue of the report and are subject to changes without prior
notice. All opinions and estimates included in this report constitute our judgment as of this date and are subject to change without notice.
This document and its contents do not constitute an offer, invitation or solicitation to purchase or subscribe to any securities or other instruments, or to undertake or divest investments. Neither shall
this document nor its contents form the basis of any contract, commitment or decision of any kind.
Investors who have access to this document should be aware that the securities, instruments or
investments to which it refers may not be appropriate for them due to their specif ic investment goals,
financial positions or risk prof iles, as these have not been taken into account to prepare this report. Therefore, investors should make their own investment decisions considering the said circumstances
and obtaining such specialized advice as may be necessary. The information in this report has been
obtained by Garanti Securities Research Department f rom sources believed to be reliable. However, Garanti Securities cannot guarantee the accuracy, adequacy, or completeness of such information,
and cannot be responsible for the results of investment decisions made on account of this report.
The market prices of securities or instruments or the results of investments could fluctuate against
the interests of investors. Investors should be aware that they could even face a loss of their investment. Transactions in futures, options and securities or high-yield securities can involve high
risks and are not appropriate for every investor. Indeed, in the case of some investments, the
potential losses may exceed the amount of initial investment and, in such circumstances, investors may be required to pay more money to support those losses. Thus, before undertaking any
transaction with these instruments, investors should be aware of their operation, as well as the rights,
liabilities and risks implied by the same and the underlying stocks. Investors should also be aware that secondary markets for the said instruments may be limited or even not exist.
This report is to be distributed to professional emerging markets investors only. This report is for private use only and intended solely for the individual(s). No information in this report may be copied,
modified, republished or exploited in anyway without the prior consent of Garanti Securities.
Additionally, with respect to our statements above, all our claims and plea rights are covered in the regulations which apply in the countries that this report has been sent to.
Garanti Securities
Etiler Mah. Tepecik Yolu
Demirkent Sokak No:1 34337 Besiktas, Istanbul / Turkey
Phone: +90 (212) 384-1155
Fax: +90 (212) 352-4240
RESEARCH