over-the-road bus industry and accessible service
TRANSCRIPT

Over-the-RoadBus Industry
and AccessibleService 2
FINDINGS●
●
●
●
The 3,500 private companies that operate over-the-roadbuses (OTRBs) range in size from Greyhound Lines, Inc.,with 2,300 OTRBs, to small companies with fewer than ahalf-dozen buses. This essentially unregulated, unsub-sidized industry provides a variety of services: fixed-route,regular-route service links some 6,000 communities; char-ter and tour services provide group travel opportunities; andcommuter, airport, and other services play importantroles in the lives of many Americans.Since the 1930s, OTRB fixed-route service has been anestablished mode of intercity travel. Since the 1960s,however, the bus industry has faced increasing competitionfrom other transportation modes. In addition, deregulationof the bus industry in 1982 permitted bus companies to dropless profitable routes. Consequently, freed-route OTRBservice now covers a much smaller passenger base (shrink-ing from 130 million passengers in 1971 to 37 million in1990) and decreasing numbers of points served (from17,000 in 1968 to 5,700 in 1991).The demographics of the markets served by bus companiesvary. People who use fixed-route bus service tend to occupythe lower rungs of the economic ladder. (Roughly one-halfhad incomes below $15,000 per year, in 1991 dollars.) Incontrast, one study showed that charter and tour buspassengers had average household incomes in excess of$47,000 per year (1991 dollars).Most fixed-route OTRB companies have small net operat-ing incomes when compared with their overall revenues.
41
42 0ver-the-Road Bus Access
(The average operating ratio for the largestcarriers in 1991 was 98.7 percent.)l Whilemost charter and tour companies appear torun with larger net operating incomes, thereis very little nonproprietary data from whichto make a comparison.
. The OTRB industry has been subject tolimited Federal regulation. Since 1982, Fed-eral regulation has primarily governed vehi-cle safety and driver qualifications, whichapply to motor carriers generally. Stateagencies have other intrastate requirements.Some States have developed small programsfor financial assistance to the bus industry.The Federal Government also has a smallassistance program geared to improvementof rural bus service (under Section 18(i) ofthe Federal Transit Act, which was funded at$5.3 million in fiscal year 1992).
. Before passage of the Americans with Disa-bilities Act (ADA), private OTRB transpor-tation operators were not required to provideaccessible transportation to people withdisabilities. A number of bus companies,however, have provided accessible serviceunder contract to public agencies that, be-cause of Federal or State assistance, wererequired by law to purchase lift-equippedvehicles. As of early 1993, virtually alllift-equipped OTRBs (approximately 350 inthe United States) operated by private buscompanies had been purchased or operatedwith the aid of public monies.
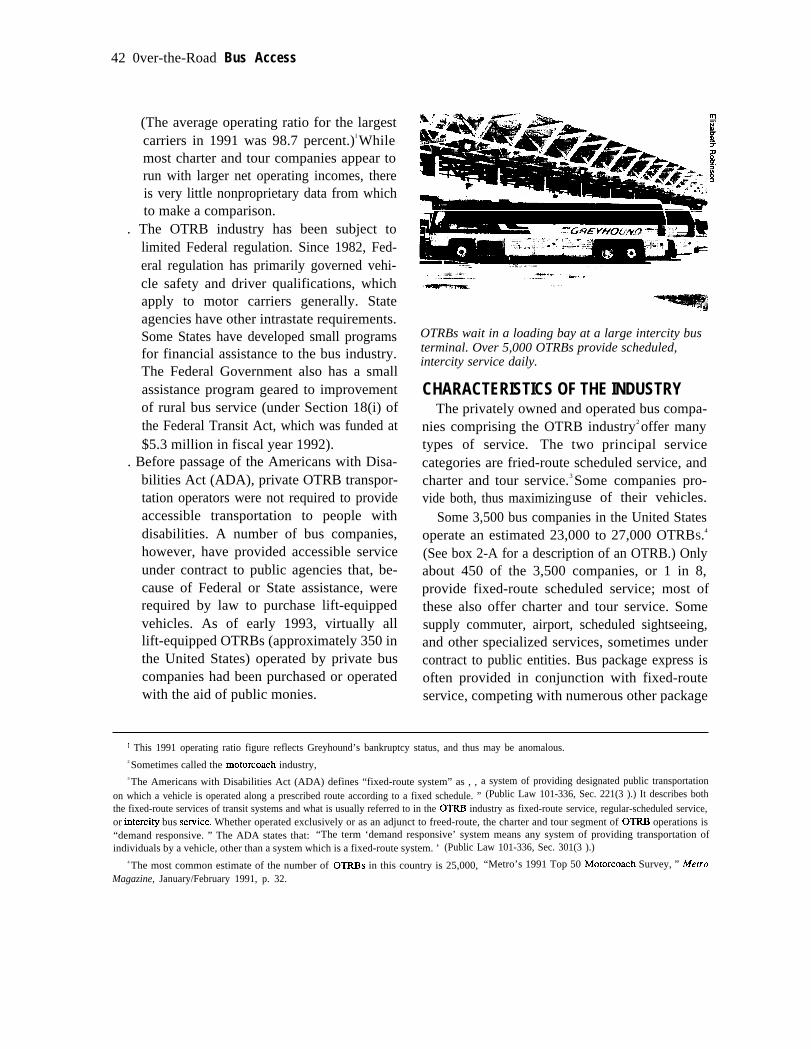
OTRBs wait in a loading bay at a large intercity busterminal. Over 5,000 OTRBs provide scheduled,intercity service daily.
CHARACTERISTICS OF THE INDUSTRYThe privately owned and operated bus compa-
nies comprising the OTRB industry2 offer manytypes of service. The two principal servicecategories are fried-route scheduled service, andcharter and tour service.3 Some companies pro-vide both, thus maximizing use of their vehicles.
Some 3,500 bus companies in the United Statesoperate an estimated 23,000 to 27,000 OTRBS.4
(See box 2-A for a description of an OTRB.) Onlyabout 450 of the 3,500 companies, or 1 in 8,provide fixed-route scheduled service; most ofthese also offer charter and tour service. Somesupply commuter, airport, scheduled sightseeing,and other specialized services, sometimes undercontract to public entities. Bus package express isoften provided in conjunction with fixed-routeservice, competing with numerous other package
‘ This 1991 operating ratio figure reflects Greyhound’s bankruptcy status, and thus may be anomalous.2 Sometimes called the motorcoach industry,3 The Americans with Disabilities Act (ADA) defines “fixed-route system” as , , a system of providing designated public transportation
on which a vehicle is operated along a prescribed route according to a fixed schedule. ” (Public Law 101-336, Sec. 221(3 ).) It describes boththe fixed-route services of transit systems and what is usually referred to in the OTRB industry as fixed-route service, regular-scheduled service,or intercity bus sewice. Whether operated exclusively or as an adjunct to freed-route, the charter and tour segment of OTRB operations is“demand responsive. ” The ADA states that: “The term ‘demand responsive’ system means any system of providing transportation ofindividuals by a vehicle, other than a system which is a fixed-route system. ’ (Public Law 101-336, Sec. 301(3 ).)
4 The most common estimate of the number of OTRBS in this country is 25,000, “Metro’s 1991 Top 50 Motorcoach Survey, ” MetroMagazine, January/February 1991, p. 32.
Over-the-Road Bus Industry and Accessible Service I 43
Box 2-A—What Is an OTRB?
The Americans with Disabilities Act (ADA) defines an over-the-road bus (OTRB) as “. . . a buscharacterized by an elevated passenger deck located over a baggage compartment.” l In practical terms, thisdescribes a bus 35 feet or longer, usually seating 40 or more passengers (depending on configuration), andcommonly called an intercity bus or motorcoach. This defintion does not include transit buses, vans, minibuses,school buses, and a variety of other types of vehicles that can be used in intercity transportation.
The exact dimensions of OTRBs vary. Before passage of the Intermodal Surface Transportation EfficiencyAct of 1991 (ISTEA), some States did not permit buses longer than 40 feet. However, ISTEA now authorizes theuse of buses up to 45 feet long in all 50 States. The height of an OTRB passenger deck ranges from 55 to 60 inchesabove the ground. Prominent exceptions to this were the GMC Scenicruiser and Flxible Vistaliners, manufacturedin the mid- 1950s, with seating on two levels. OTRB widths are either 96 or 102 inches. Aisle widths range from
a standard 14 inches to as much as 20 inches, and door widths from 24 to 36 inches (40 inches on a Neoplandouble-deck model).2
Most new standard OTRBs cost approximately $250,000. Although most OTRBs include a restroom as astandard feature, OTRBs providing freed-route service tend to have fewer additional features than those used fortours. More and more tour buses are equipped with video systems and other extra features. Wider doors and aislesare available by special order, as are larger (tinted) windows for sightseeing. Reading lamps, card tables, andAM/FM stereo/cassette players are becoming more common. These additional features cost more money, ofcourse, and manufacturers equip their OTRBs with custom features as specified by the purchaser.
The average life of an OTRB in the United States is about 20 years. Most bus operators expect to replacea vehicle after 10 to 15 years, but replacement schedules are determined by a number of factors, including theavailability of capital and the status of the bus resale market. The resale market consists of a handful of largenational firms that sell, lease, recondition, and rebuild used buses, plus an unknown number of small used-busdealers. Some bus companies handle their own resales. Purchasers of used buses are usually small bus companies,private organizations, and nonprofit groups.
1 Public Law 101-336, Sec. 301(5).
2 At one time, AFc, Crown Coach Eagle, Flxible, General Motors, MCI, and Neoplan all had OT’RB productionfacilities in the United States. Now only MCI, Eagle, and Neoplan remain. MCI, originally a Canadian company bought byGreyhound in 1948 and now owned by Greyhound Lines of Canada, Ltd., produces OTRBS in Manitobz Cana&V a U.S.presence is maintained by an assembly plant across the border in Pemb~ North Dakota. Neop@ a German company, hasmanufacturing facilities in Colorado. Eagle, owned f~st by Trailways, then by Greyhound, has been acquired by Mexicaninteres~Moto Diesel Mexicana S.A. de C. V., Aguascalientes, Mexico-and has resumed OTRB production on the UnitedStates-Mexican border. In addition to MCIS, Neoplans, and older buses no longer manufactured here, OTRBS used in thiscountry include Prevost (Canadian), %% Hool and LAG (Belgian), and Setra (German). A Wisconsin company, SABRE Busand Coach Corp., plans to manufacture a European-style touring OTRB. A European-style coach is characterized by largerwindows and made-to-order features, such as wider aisles and doors.
express services. The remaining 3,000-plus com- fixed-route scheduled service providers. 5 Grey -panics offer charter and tour service exclusively. hound Lines dominates the fixed-route industry
Approximately 7,500 OTRBs, or 1 in 3, are with its transcontinental network of routes. Grey -found in the fleets of the 43 largest bus compa- hound and 27 other companies are Class I carriers,nies, and only 10 of those firms are essentially defined by the Interstate Commerce Commission
5 $ ‘MCUOIS 1992 Top 50 Motorcoach Survey, “ Memo Magazine, January/February 1992, p. 18.

44 0ver-the-Road Bus Access
(ICC) as those carriers having over $5 million ingross annual revenue.6
About one-half of the Class I companies, andabout two dozen slightly smaller fins, areconsidered regional carriers. 7 Their operations, iflinked together, could form the basis of a nationalsystem comparable to Greyhound’s network ofroutes. Many of the regional carriers are membersof the National Trailways Bus System (NTBS), agroup of 28 companies that coordinate schedulesand share terminals and stations.8 All othercompanies providing freed-route scheduled serv-ice in the United States offer intercity transporta-tion and specialized transportation services insmaller, often local geographic areas.
To provide transportation services within aState, whether freed-route, charter and tour, orspecial services, a bus company often mustregister with its State Public Utility Commission(PUC) and file tariffs of services and fares. If thecompany wishes to offer interstate transportationservices, it must also register with the InterstateCommerce Commission (ICC) and file tariffs ofservices and fares with that body.
A Brief History of U.S. OTRB ServiceThe first recorded fixed-route bus service
began in 1913 between the towns of Hibbing andAlice in northern Minnesota. By 1926, 4,040companies were operating nationwide, includingGreyhound. The rapid growth of bus servicethroughout the country led individual States to
establish regulatory control over intercity busservice within their borders. Pennsylvania wasthe first to act, and by 1930 all but Delaware hadsome form of regulation. Passage of the MotorCarrier Act of 1935 authorized ICC to regulateinterstate fares, routes, safety, and other activitiesof the motorbus industry. Under its policy of‘‘universal service,’ ICC permitted some mo-nopolistic practices, ensuring companies an ab-sence of competition in exchange for makingservices widely available. The industry devel-oped rapidly during the Depression and WorldWar II years, growing from 10 billion passenger-miles in 1940 to 27 billion in 1945.9
Developments in the 1950s, however, led toerosion of the freed-route passenger base. Thenumber of personal automobiles burgeoned, con-struction of the Interstate Highway System began,and air travel increased rapidly. To combat theloss of ridership, the bus industry added packagedelivery and charter service. Many bus companiessought to scale back on their unprofitable routes,primarily in rural areas. In many cases, this wasmet with fierce resistance from State authorities,who could reject requests for abandonment ofroutes deemed to be in the public interest.
The bus industry was further challenged in the1970s by the formation of Amtrak and by airlinederegulation. Amtrak offered comfortable railservice at rates comparable to those for bus travel,thus cutting into market share, especially in thedensely populated and highly profitable North-
6 Interstate Commerce CormnissioG Office of Economics, “Transport Statistics in the United States: Passenger Carriers, ” draft rcpo~1991. Class II carriers have gross annual revenues between $1 and $5 million and Class III carriers less than $1 rnillio~ but ICC neither collectsnor maintains data on Class II and Class III carriers. The designation is a holdover from the days before emctment of the Bus Regulatory ReformAct of 1982.
7 Of the 28 Class I carriers in 1991, 21 were classified by ICC as ‘‘intercity carriers” and 7 as ‘‘local carriers. ” Interstate CommerceCommission, OffIce of Economics, “Transport Statistics in the United States: 1991,” draft document, table 5. As ICC explains: “Passengercarriers are classified as intercity carriers if the revenues received from intercity traffic equal or exceed 50 percent of the total revenues receivedfrom intercity and local or suburban traffic. If the intercity revenues are less than 50 percent the passenger carriers are classified as 10ML’Interstate Commerce Commission, Office of Economics, “Transport Statistics in the United States: Motor Carriers Part 2, for the Year EndedDecember 31, 1990, ” unpublished report, p. 2.
* Greyhound purchased Trailways Lines, Inc. inrnid- 1987, consolidated routes, schedules, and stations, and in November 1991 discontinueduse of the Trailways name, also withdrawing from the National Trailways Bus System.
9 John Meyer and Clinton V. Oster, Jr., Deregulation and the Future ofIntercity Passenger Travel (Cambridge, MA: The MIT Press, 1987),p. 171.
Over-the-Road Bus Industry and Accessible Service I 45
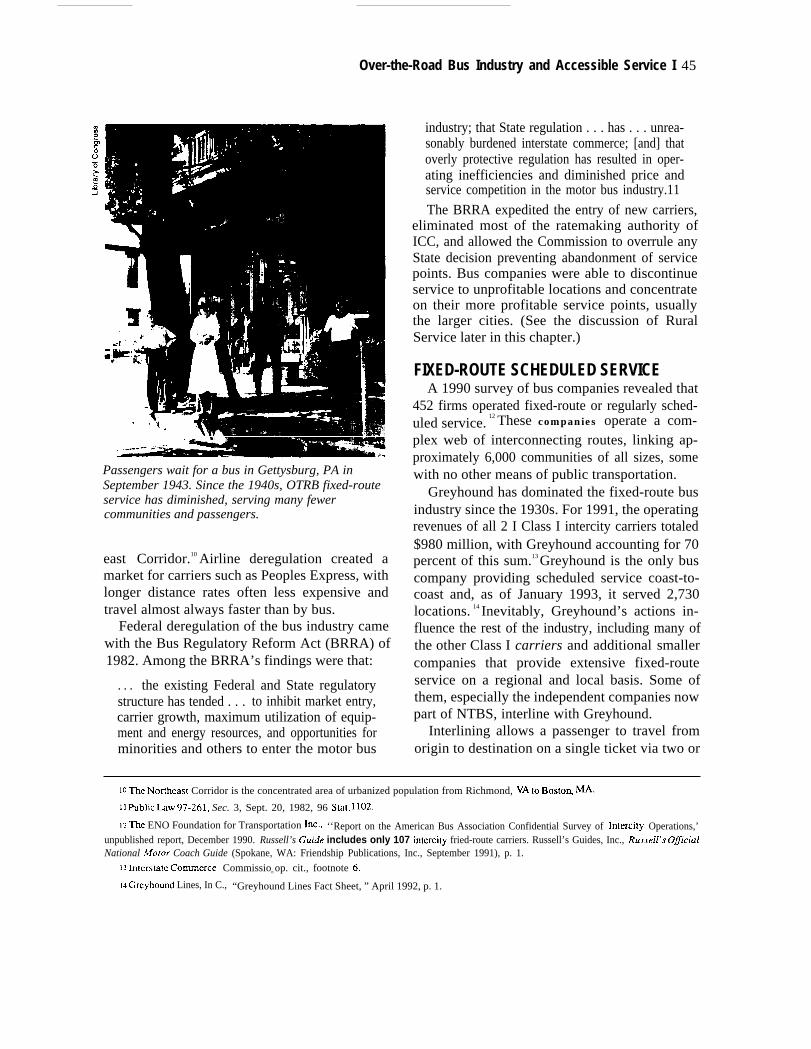
Passengers wait for a bus in Gettysburg, PA inSeptember 1943. Since the 1940s, OTRB fixed-routeservice has diminished, serving many fewercommunities and passengers.
east Corridor.10 Airline deregulation created amarket for carriers such as Peoples Express, withlonger distance rates often less expensive andtravel almost always faster than by bus.
Federal deregulation of the bus industry camewith the Bus Regulatory Reform Act (BRRA) of1982. Among the BRRA’s findings were that:
. . . the existing Federal and State regulatorystructure has tended . . . to inhibit market entry,carrier growth, maximum utilization of equip-ment and energy resources, and opportunities forminorities and others to enter the motor bus
industry; that State regulation . . . has . . . unrea-sonably burdened interstate commerce; [and] thatoverly protective regulation has resulted in oper-ating inefficiencies and diminished price andservice competition in the motor bus industry.11
The BRRA expedited the entry of new carriers,eliminated most of the ratemaking authority ofICC, and allowed the Commission to overrule anyState decision preventing abandonment of servicepoints. Bus companies were able to discontinueservice to unprofitable locations and concentrateon their more profitable service points, usuallythe larger cities. (See the discussion of RuralService later in this chapter.)
FIXED-ROUTE SCHEDULED SERVICEA 1990 survey of bus companies revealed that
452 firms operated fixed-route or regularly sched-uled service.
12 These companies operate a com-plex web of interconnecting routes, linking ap-proximately 6,000 communities of all sizes, somewith no other means of public transportation.
Greyhound has dominated the fixed-route busindustry since the 1930s. For 1991, the operatingrevenues of all 2 I Class I intercity carriers totaled$980 million, with Greyhound accounting for 70percent of this sum.13 Greyhound is the only buscompany providing scheduled service coast-to-coast and, as of January 1993, it served 2,730locations. 14 Inevitably, Greyhound’s actions in-fluence the rest of the industry, including many ofthe other Class I carriers and additional smallercompanies that provide extensive fixed-routeservice on a regional and local basis. Some ofthem, especially the independent companies nowpart of NTBS, interline with Greyhound.
Interlining allows a passenger to travel fromorigin to destination on a single ticket via two or
10 me Nofieast Corridor is the concentrated area of urbanized population from Richmond, VA to Bosto@ MA.
11 ~b]ic ~w 97-261, Sec. 3, Sept. 20, 1982, 96 SQt. 1102.
12 The ENO Foundation for Transportation k., ‘‘Report on the American Bus Association Confidential Survey of Intercity Operations,’unpublished report, December 1990. Russell’s Guide includes only 107 intercity fried-route carriers. Russell’s Guides, Inc., RusseZZ’s Ofl”ciulNational Motor Coach Guide (Spokane, WA: Friendship Publications, Inc., September 1991), p. 1.
13 Intem@te Commerce Commission op. cit., footnote 6.
14 Greyhound Lines, In C., “Greyhound Lines Fact Sheet, ” April 1992, p. 1.

46 0ver-the-Road Bus Access
more carriers.15 If a bus company belongs to theNational Bus Traffic Association (NBTA), itissues tickets and accepts those issued by anothercarrier with the assurance that NBTA will allocateamong the interlining companies the percentageof the proceeds to which they are entitled.
For example, if a bus company issues a ticketto a passenger’s destination and does not servethat community, the company will carry thepassenger to a point where he or she can connectwith a second company, which accepts the ticketand transports the passenger to the final destina-tion. The two companies share the proceedsaccording to agreed on allocation factors. Atpresent, many companies do not regularly informsubsequent carriers of any specific informationabout passengers (e.g., if they have disabilitiesand require assistance) who will be interliningwith their service.
Pooling, a less common method of intercom-pany coordination, is a formal agreement amongcarriers that enables the passenger to take a singlebus from origin to destination over the routes ofseveral carriers. For example, a company issuesthe ticket and carries the passenger on its own buswith its own driver from point A to point B. Atpoint B, another driver from another companycontinues the journey on the original bus. If thejourney is long enough, the same bus might endup at the destination point, having been driven bydrivers of three or four companies under this typeof pooling agreement. Often the participatingcompanies contribute buses to the pool of equip-ment operated on such a route.
Decline of Fixed-Route ServiceThe freed-route intercity bus industry declined
in virtually every measure of output or financialperformance from 1967 through 1986.16 Figure2-1 shows the decline in the number of passengersduring this period, with key events affecting thebus industry highlighted. Immediately after de-regulation, many companies acted to reducecosts. For instance, Greyhound embarked on aplanned shrinkage of the firm, leading to furtherridership losses from 1985 to 1988, even steeperthan those of previous years.
In March 1987, Greyhound was sold to GLIHolding Co. (GLIH), which also purchased Trail-ways Lines, Inc., the second largest bus companyin the United States. The new owners sought tomaintain their reduced operating costs whileoffering lower fares, marketing actively, andimproving services. With these attempts to gainridership, Greyhound increased its passenger-miles by 23 percent from 1986 to 1989. In 1990,these efforts were overwhelmed by the strike ofthe Amalgamated Transit Union GreyhoundCouncil, representing most of the firm’s union-ized drivers, and by the bankruptcy filing of GLIHin June of that year.
17 Other fixed-route providers
were affected by these developments because oftheir interlining arrangements with Greyhound, orbecause their service fed into Greyhound routes.They were also subject to many of the economictrends affecting Greyhound and had taken similarsteps to improve their operating ratios.18
Figure 2-2 shows the steady decline in thenumber of points served by the entire freed-route
15 Interlining is much less common since deregulation.
16 Much of this discussion is adapted from Wosometrics, ~c., ‘‘Background Paper on the Accessibility for the Disabled and the IntercityBus Industry,” OTA contractor report, Mar. 31, 1991.
17 From JUe L$, 1990 ~ough OCt. 31, Igpl, Greyhound operated p~suant to Chapterm of me Fe&rd Bankruptcy Code. & Of eitdy 199s,
the company was still operating under an approved Chapter XI reorganization plan.18 opera~g ratio is c~culat~ as operating expenses divided by opemt~g revenues.
Over-the-Road Bus Industry and Accessible Service 47
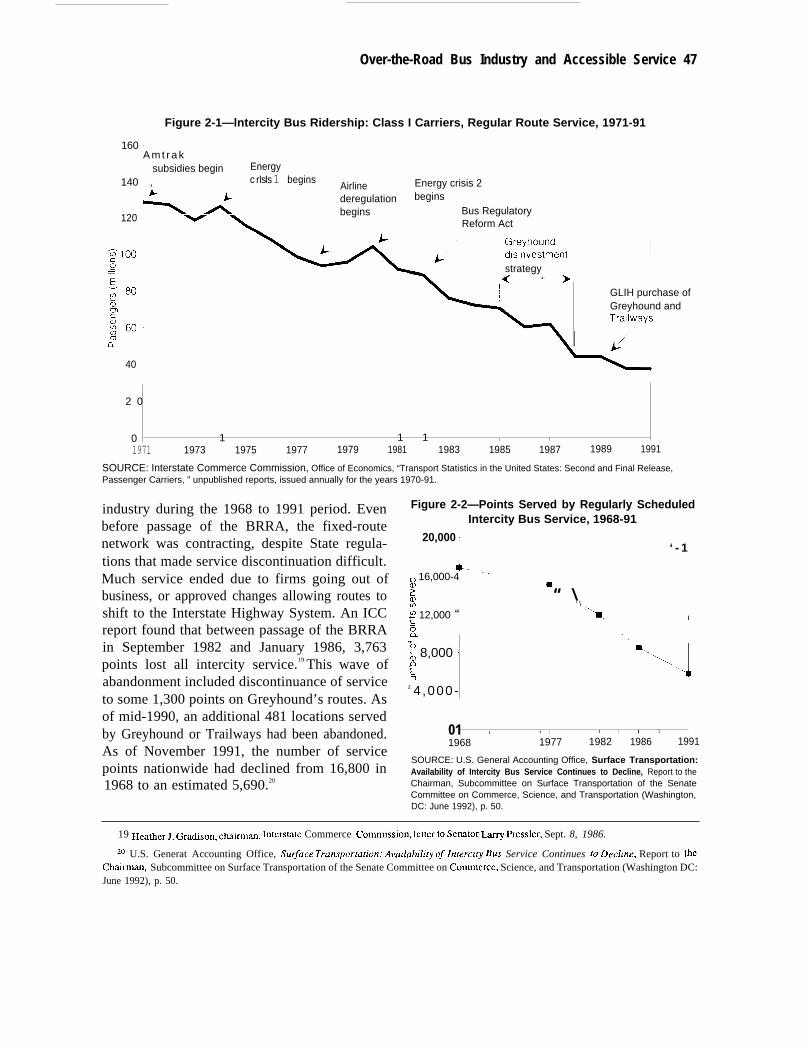
Figure 2-1—lntercity Bus Ridership: Class I Carriers, Regular Route Service, 1971-91
160 -A m t r a k
subsidies begin Energy
140 , crIsIs 1 beginsAirline Energy crisis 2
120
40
deregulation begins
begins Bus RegulatoryReform Act
strategy,< ‘- >
GLIH purchase ofGreyhound and
2 0
0 1 1 1 I 1 1 1
1971 1973 1975 1977 1979 1981 1983 1985 1987 1989 1991
SOURCE: Interstate Commerce Commission, Office of Economics, “Transport Statistics in the United States: Second and Final Release,Passenger Carriers, ” unpublished reports, issued annually for the years 1970-91.
industry during the 1968 to 1991 period. Evenbefore passage of the BRRA, the fixed-routenetwork was contracting, despite State regula-tions that made service discontinuation difficult.Much service ended due to firms going out ofbusiness, or approved changes allowing routes toshift to the Interstate Highway System. An ICCreport found that between passage of the BRRAin September 1982 and January 1986, 3,763points lost all intercity service.19 This wave ofabandonment included discontinuance of serviceto some 1,300 points on Greyhound’s routes. Asof mid-1990, an additional 481 locations servedby Greyhound or Trailways had been abandoned.As of November 1991, the number of servicepoints nationwide had declined from 16,800 in1968 to an estimated 5,690.20
Figure 2-2—Points Served by Regularly ScheduledIntercity Bus Service, 1968-91
20,000 [‘ - 1
8-- ---~ 16,000-4
:Ing? 12,000 “6QE; 8,000 ~DE3
z 4,000-
m“ \
‘\
\ I
..
\‘\.
J
/01 i I 1 1 1 1 1 1 1
1968 1977 1982 1986 1991
SOURCE: U.S. General Accounting Office, Surface Transportation:Availability of Intercity Bus Service Continues to Decline, Report to theChairman, Subcommittee on Surface Transportation of the SenateCommittee on Commerce, Science, and Transportation (Washington,DC: June 1992), p. 50.
19 Hmhcr J. Gra~S~n, ~mm, lnters~te Commerce commission, ]etter to Senator Larry Fressler, Sept. 8, 1986.
20 U.S. Generat Accounting Office, Su&ace Transportation: A)’ailabilify of ]nterciry Bus Service Continues @ DecZine, Report to theCbairrnan, Subcommittee on Surface Transportation of the Senate Committee on Commcrcc, Science, and Transportation (Washington DC:June 1992), p. 50.

48 0ver-the-Road Bus Access
Box 2-B—Use of ICC Data in This Study
The best data on the financial and operational performance of the over-the-road bus (OTRB) industry havebeen collected from individual bus companies by the Interstate Commerce Commission (ICC). However, theportion of the industry reporting to ICC and the comprehensiveness of those reports have not been consistent overtime. Therefore, ICC data must be used cautiously.
ICC has collected data from bus companies since 1938. Until passage of the Bus Regulatory Reform Act of1982 (BRRA), data were collected from all carriers registered with ICC to perform interstate service. Large,medium, and small carriers, referred to as Class I, Class II, and Class III carriers respectively, were classified bytheir adjusted annual gross operating revenues. After passage of the BRRA, data were no longer collected fromClass II and III carriers, and data collected from Class I companies were less detailed. Thus, any attempt to useICC data to measure performance of the OTRB industry over the past decade must be confined to Class I carriers.
OTA’s use of ICC data also recognizes the following inconsistencies and shortcomings.
● Class I definitionsThe ICC definition of Class I carriers since 1938 has been based on adjusted annual gross operatingrevenue in excess of a certain threshold. However, this threshold has been changed four times since1938.1 In addition, from 1970 to 1991, the numbers of bus companies with adjusted gross incomesabove the threshold varied from year to year.2
● Definition of “Intercity Service Providers”For purposes of this study, (OTA used ICC data on intercity service providers. ICC classifies carriersas intercity if more than 49 percent of their total revenues comes from intercity traffic. Many of theClass I intercity carriers, however, provide a mix of services. ICC breaks out these costs by type ofservice, but it is unclear how these numbers are calculated. In addition, OTA discovered that at leastone of the Class I carriers providing primarily local service did not report to ICC revenues in the formof extensive public subsidies it received for certain of the local services it provided. As aconsequence, its operating ratio was substantially above 100 every year it appeared on the Class Ilist.
● Quality controlICC does not routinely check, and has few means to verify, whether carrier figures are accurate.
1 w ~eshold, initially establ@h~ at $100,000, was raised to $200,000 in 1950, to $1 million ill 1%9, tO $3 millionin 1977, and to the current level of $5 million in 1988.
z h 1970, tire w=e 71 CIass I carriers providing essentialIy intercity service; in 1990, b W- 21. m 1991 CkI carrier report has been compiled by ICC and, as of early 1993, waa under internal review.
ICC publishes very limited data on carrier net at that time, as receiving revenues over $1operating income.
21 (For a discuss ion of the million) had a collective net operating income ofproblems with ICC data, see box 2-B.) However, $260 million (1989 dollars). In 1989, the 20 Classin 1970, the 71 Class I intercity carriers (defined, I intercity carriers (then defined as receiving
21 Meuuement by ICC of tie ~ctivi~ of cl~s I c~ms h~ v~ed considerably over me yWS. The ICC definition of (3i.tss I ChW3 SillCe
1938 has been based on adjusted annual gross operating revenue in excess of a certain threshold. Through 1979, the level of detail in the ClassI carrier reports was considerable. The reports of 1980 to 1986 were less detailed, and those from 1987 to 1991, the latest year available as ofautumn 1992, were far more rudimentary. However, not until 1987 were data displayed by carrien before that they were broken down onlyby geographic district and region.
Over-the-Road Bus Industry and Accessible Service 49
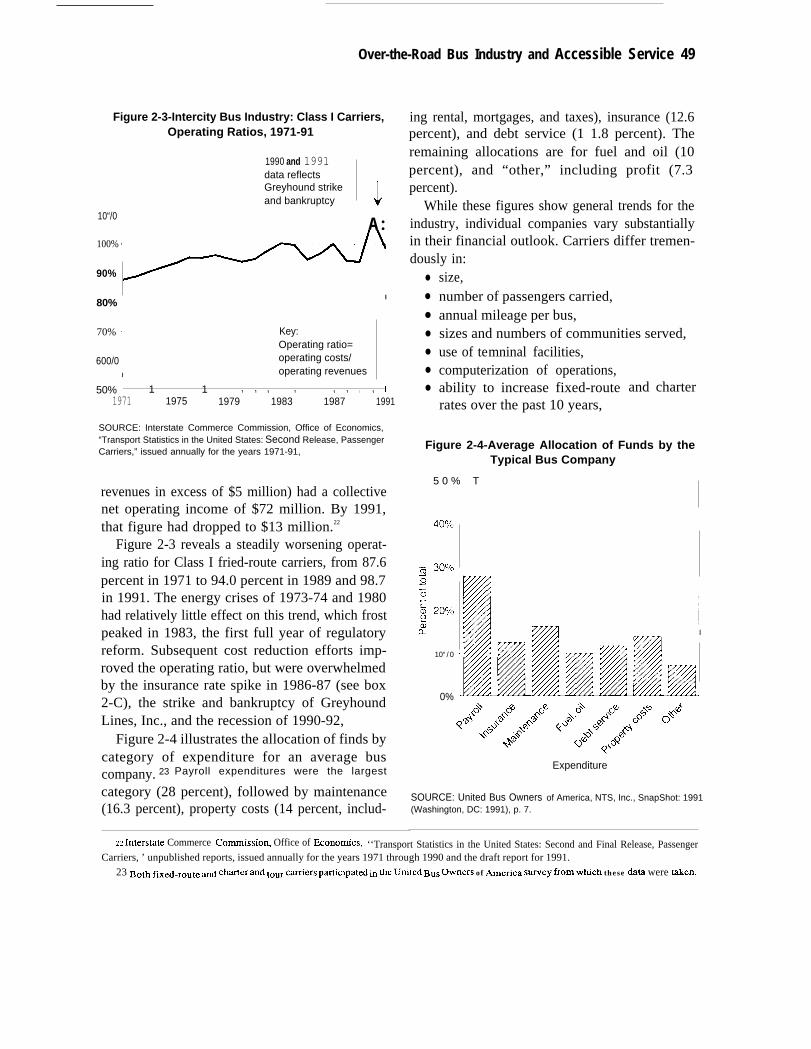
Figure 2-3-Intercity Bus Industry: Class I Carriers,Operating Ratios, 1971-91
1990 and 1991data reflectsGreyhound strikeand bankruptcy ‘J
10“/0A :
100% ‘
90%~]
80% ~I
I
70% ‘ Key:Operating ratio=
600/0 ~ operating costs/
I operating revenues
50% J 1 1 1 1 1 1 1 1 1 1 1 I
1971 1975 1979 1983 1987 1991
SOURCE: Interstate Commerce Commission, Office of Economics,“Transport Statistics in the United States: Second Release, PassengerCarriers,” issued annually for the years 1971-91,
revenues in excess of $5 million) had a collectivenet operating income of $72 million. By 1991,that figure had dropped to $13 million.22
Figure 2-3 reveals a steadily worsening operat-ing ratio for Class I fried-route carriers, from 87.6percent in 1971 to 94.0 percent in 1989 and 98.7in 1991. The energy crises of 1973-74 and 1980had relatively little effect on this trend, which frostpeaked in 1983, the first full year of regulatoryreform. Subsequent cost reduction efforts imp-roved the operating ratio, but were overwhelmedby the insurance rate spike in 1986-87 (see box2-C), the strike and bankruptcy of GreyhoundLines, Inc., and the recession of 1990-92,
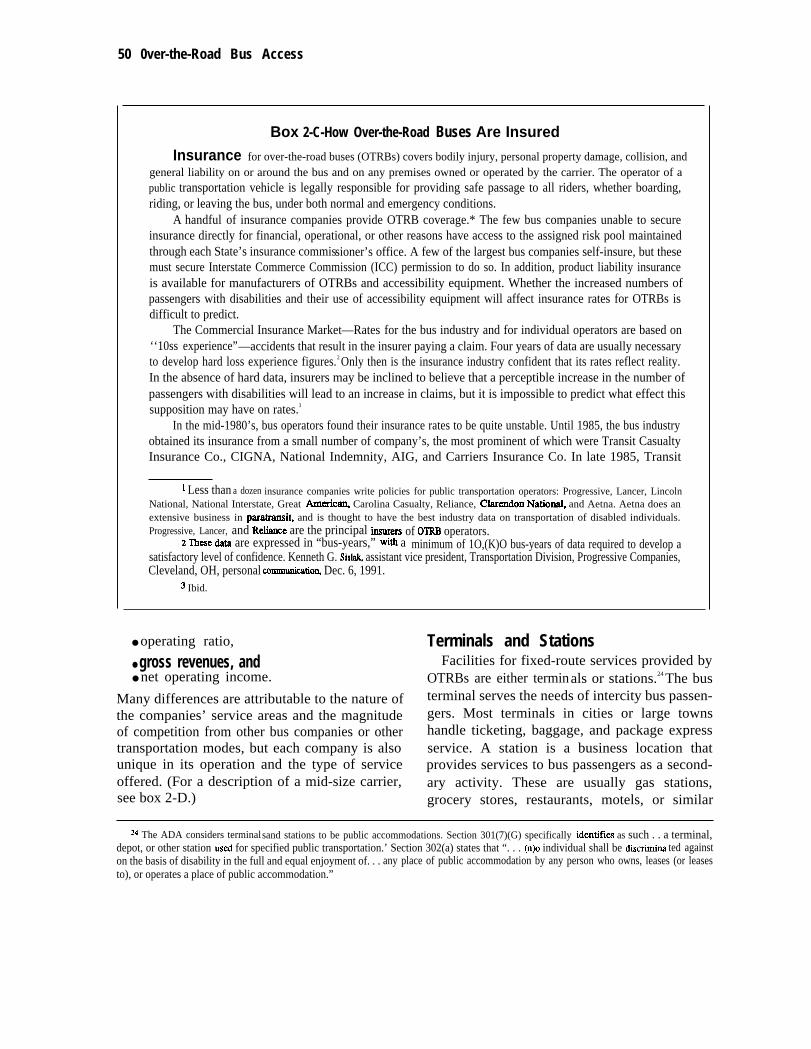
Figure 2-4 illustrates the allocation of finds bycategory of expenditure for an average buscompany. 23 Payroll expenditures were the largest
category (28 percent), followed by maintenance(16.3 percent), property costs (14 percent, includ-
ing rental, mortgages, and taxes), insurance (12.6percent), and debt service (1 1.8 percent). Theremaining allocations are for fuel and oil (10percent), and “other,” including profit (7.3percent).
While these figures show general trends for theindustry, individual companies vary substantiallyin their financial outlook. Carriers differ tremen-dously in:
●
●
●
●
●
●
●
size,number of passengers carried,annual mileage per bus,sizes and numbers of communities served,use of temninal facilities,computerization of operations,ability to increase fixed-routerates over the past 10 years,
and charter
Figure 2-4-Average Allocation of Funds by theTypical Bus Company
5 0 % T
I
10“/0
0%
Expenditure
SOURCE: United Bus Owners of America, NTS, Inc., SnapShot: 1991(Washington, DC: 1991), p. 7.
u Intersmte Commerce Commissio~ Office of ECOIIO~CS, ‘‘Transport Statistics in the United States: Second and Final Release, PassengerCarriers, ’ unpublished reports, issued annually for the years 1971 through 1990 and the draft report for 1991.
23 Both f~~.route ad ~~ermd tom cfier5 ~~cipat~ ~ the unit~ Bus Owners of ~efica swey from which these data were taken.
50 0ver-the-Road Bus Access
Box 2-C-How Over-the-Road Buses Are Insured
Insurance for over-the-road buses (OTRBs) covers bodily injury, personal property damage, collision, andgeneral liability on or around the bus and on any premises owned or operated by the carrier. The operator of apublic transportation vehicle is legally responsible for providing safe passage to all riders, whether boarding,riding, or leaving the bus, under both normal and emergency conditions.
A handful of insurance companies provide OTRB coverage.* The few bus companies unable to secureinsurance directly for financial, operational, or other reasons have access to the assigned risk pool maintainedthrough each State’s insurance commissioner’s office. A few of the largest bus companies self-insure, but thesemust secure Interstate Commerce Commission (ICC) permission to do so. In addition, product liability insuranceis available for manufacturers of OTRBs and accessibility equipment. Whether the increased numbers ofpassengers with disabilities and their use of accessibility equipment will affect insurance rates for OTRBs isdifficult to predict.
The Commercial Insurance Market—Rates for the bus industry and for individual operators are based on‘‘10ss experience”—accidents that result in the insurer paying a claim. Four years of data are usually necessaryto develop hard loss experience figures.2 Only then is the insurance industry confident that its rates reflect reality.In the absence of hard data, insurers may be inclined to believe that a perceptible increase in the number ofpassengers with disabilities will lead to an increase in claims, but it is impossible to predict what effect thissupposition may have on rates.3
In the mid-1980’s, bus operators found their insurance rates to be quite unstable. Until 1985, the bus industryobtained its insurance from a small number of company’s, the most prominent of which were Transit CasualtyInsurance Co., CIGNA, National Indemnity, AIG, and Carriers Insurance Co. In late 1985, Transit
1 Less than a dozen insurance companies write policies for public transportation operators: Progressive, Lancer, LincolnNational, National Interstate, Great Americaq Carolina Casualty, Reliance, Clarendon Natio@ and Aetna. Aetna does anextensive business in paratransit, and is thought to have the best industry data on transportation of disabled individuals.Progressive, Lancer, and ReIiance are the principal imurers of OTRB operators.
2 ~~e dati are expressed in “bus-years,” tith a minimum of 1O,(K)O bus-years of data required to develop asatisfactory level of confidence. Kenneth G. Sisl& assistant vice president, Transportation Division, Progressive Companies,Cleveland, OH, personal communicatio~ Dec. 6, 1991.
3 Ibid.
● operating ratio, Terminals and Stations● gross revenues, and Facilities for fixed-route services provided by● net operating income. OTRBs are either terminals or stations.24 The bus
Many differences are attributable to the nature of terminal serves the needs of intercity bus passen-the companies’ service areas and the magnitude gers. Most terminals in cities or large townsof competition from other bus companies or other handle ticketing, baggage, and package expresstransportation modes, but each company is also service. A station is a business location thatunique in its operation and the type of service provides services to bus passengers as a second-offered. (For a description of a mid-size carrier, ary activity. These are usually gas stations,see box 2-D.) grocery stores, restaurants, motels, or similar
~ The ADA considers terminalsand stations to be public accommodations. Section 301(7)(G) specifically identiles as such . . a terminal,depot, or other station used for specified public transportation.’ Section 302(a) states that “. . . (n)o individual shall be discrimina ted againston the basis of disability in the full and equal enjoyment of. . . any place of public accommodation by any person who owns, leases (or leasesto), or operates a place of public accommodation.”
Over-the-Road Bus Industry and Accessible Service I 51
Casualty Insurance Co. and Carriers Insurance Co. became insolvent, and CIGNA dropped its participation in aplan under which coverage was provided at group rates for members of the United Bus Owners of America.Without these major providers, insurance became more difficult to obtain and rates increased dramatically, inmany cases doubling. By mid-1987, however, with the entry of other insurance companies into the field, ratesbegan to drop.
Assigned Risk Pools—The insurance industry adminis ters most assigned risk pools. Risk pool premiumscan be twice those available directly from a commercial insurer. Anyone reasonably entitled to insurance andunable to obtain coverage in the open market is placed in the pool. In Washington State, for example, the onlyeligibility criterion is that an applicant’s coverage must not have been canceled for nonpayment within the past2 years. Pool rates are currently set at 150 percent of the standard rates for commercial vehicles within the State. 4
Self-Insurance--ICC requires each motor carrier applying for self-insurance to provide financial, safety,and claims data for the last 3 years and evidence of safe operations in the form of a satisfactory safety rating fromthe U.S. Department of Transportation. ICC reviews this and other information under general guidelines; widedifferences in motor carriers’ size and operational characteristics preclude the use of specific criteria.5 Oncepermission to self-insure is granted, ICC monitors the carrier, requiring quarterly financial reports and claims data.
As of summer 1992, only two bus companies were self-insured: Greyhound and Peter Pan. Three othercompanies had permission to self-insure but had not done so. Some companies may want to self-insure only forthe first $1 million of the required $5 million and buy the rest on the open market, where the first $1 million ofcoverage is the most expensive. Other companies may view permission to self-insure as a bargaining chip withinsurance carriers.6
Product Liability Insurance-Product liability insurance protects the manufacturer of a lift device or anOTRB, but not all manufacturers carry such insurance. Manufacturers generally retain legal and engineeringexperts to advise them on how best to prevent accidents and lawsuits.
q Mien Morrow, deputy insurance commissioner, State of Washington, pWSOnd COIIUUUnkdOIL Jm. 14, 1992.5 Interstate Cornmercs Commissio~ “EX Parte No. MC-178: Investigation Into Motor Carrier Imurance Rates,”
decided Jan. 20, 1987, p. 6.
6 Alice ~sey, assistant to tie deputy director, Section of Operations and Enforcement Interstate CommerceComrnissio~ personal commurticatiou Feb. 18, 1992.
small business establishments whose proprietors study identified 1,991 terminals and 1,775 sta-serve as agents for the freed-route lines serving tions for a total of 3,766 fixed-route passengerthe community. The flag stop-locations by the facilities. More than 80 percent of these facilitiesside of the road where the bus picks up passengers— were owned or leased by Greyhound, Trailways,is far less prevalent with the decline of rural and the members of NTBS. Independent carriersservice. accounted for the remainder.
In 1984, a combined ICC/U.S. Department of The subsequent shrinkage of the GreyhoundTransportation (DOT) study found that in cities of and Trailways networks, the sale of many termi-more than 100,000 population, 84 percent of bus nal properties by Greyhound, the purchase offacilities were terminals compared to only 39 Trailways by Greyhound, and the consolidationpercent in towns under 15,000 population.25 The of facilities, have resulted in far fewer terminals
‘5 U.S. Department of Transportation, Office of the Secretary, Transportation Systems Center, and Interstate Commerce Commission, OffIceof Transpoflation Analysis, “The Intercity Bus Terminal Study: A Report to the President and the Congress of the United States,” unpublishedreport, December 1984, p. 13.
52 I Over-the-Road Bus Access
Box 2-D-Profile of a Fixed-Route Carrier
Acme Busl is a family-owned mid-size intercity bus company that has operated in the Midwest since shortlyafter World War I. The company’s routes and services have evolved with the changes in the intercity bus business,but do not connect on a regular basis with publicly operated rural bus service or paratransit.
Acme serves more than a half-dozen States in the Midwest and interlines with Greyhound. Scheduledfreed-route service represents about threequarters of the company’s ridership. The remainder consists of charterservice plus a bit of tour service. Its fixed-route service has changed considerably since the passage of the BusRegulatory Reform Act. The company has eliminated most service to small towns in favor of large andmedium-size cities, although a couple of routes linking major cities have been dropped. Acme managers estimatethat more than 90 percent of its passengers board at full-service terminals. Only one or two bus stations operatingout of a food store or gas station remain on the system; there are no bus shelters on Acme’s routes, and it servesno flag stops.
The company’s freed-route passengers are seniors, students, and middle- to low-income persons who do notfly for financial or other reasons. Since 1981, ridership has declined steadily. Although Acme has conducted nomarketing surveys, management views the private automobile as its prime competitor and believes that itspassenger profile has not changed since the early 1980s.
None of Acme’s nearly three dozen over-the-road buses-average age about 10 years-is lift-equipped.Acme’s managers estimate that each year they receive around 15 inquiries about accessible service frompassengers who use wheeled mobility aids and that perhaps 100 of its 250,000 passengers need some kind ofassistance to board. Boarding assistance extends to lifting and carrying if necessary.
Acme has 50 or so drivers and approximately one dozen mechanics, all of whom are male. These employeesare unionized; employees who perform supervisory, managerial, clerical, and other support functions are not.Acme uses computers for accounting and for charter information, but not for dispatching. The company does nothave an advance reservation system.
The company’s operating ratio for 1985 to 1990 was around 95 percent. Like many similar companies thatinterline with Greyhound, Acme was affected by that company’s 1990 strike. Acme’s operating ratio was furtherhurt by the recession of the early 1990s and the reluctance of some individuals to travel during the Gulf War inearly 1991. However, Acme’s worst year coincided with the insurance crisis of 1986-87. Due to competitivepressures, Acme has not raised its fixed-route fares since a 10 percent increase in 1983. Its charter rates rose in1985 by 6 percent and again, in 1991, by 5 to 10 percent.
When asked, “If you could do anything you wished, what would you change about your business?” Acmemanagement replied: “The company has changed about as much as it could over the last 10 yearn, eliminatingmost of the nonproductive routes and cutting out a lot of fat. Not much more can be done. ” The managers thinkthe future of the industry lies in cooperative arrangements among bus companies, through the sharing of systems,terminals, and technology.
1 “Acme” is a fictitious name; the bus company is real.
and stations than a decade ago. Generally, termi- figures show that, as of May 1991, the companynals are no longer staffed by bus company used a total of 1,967 terminal and station facili-employees, but by contract agents. Greyhound ties. 26
26 Econometrics Inc., ‘‘Description of Available Intercity Services, OTA contractor report, May 21, 1992, p. 35.
Over-the-Road Bus Industry and Accessible Service I 53
Fixed-Route RidershipIn August 1989 and 1991, Greyhound con-
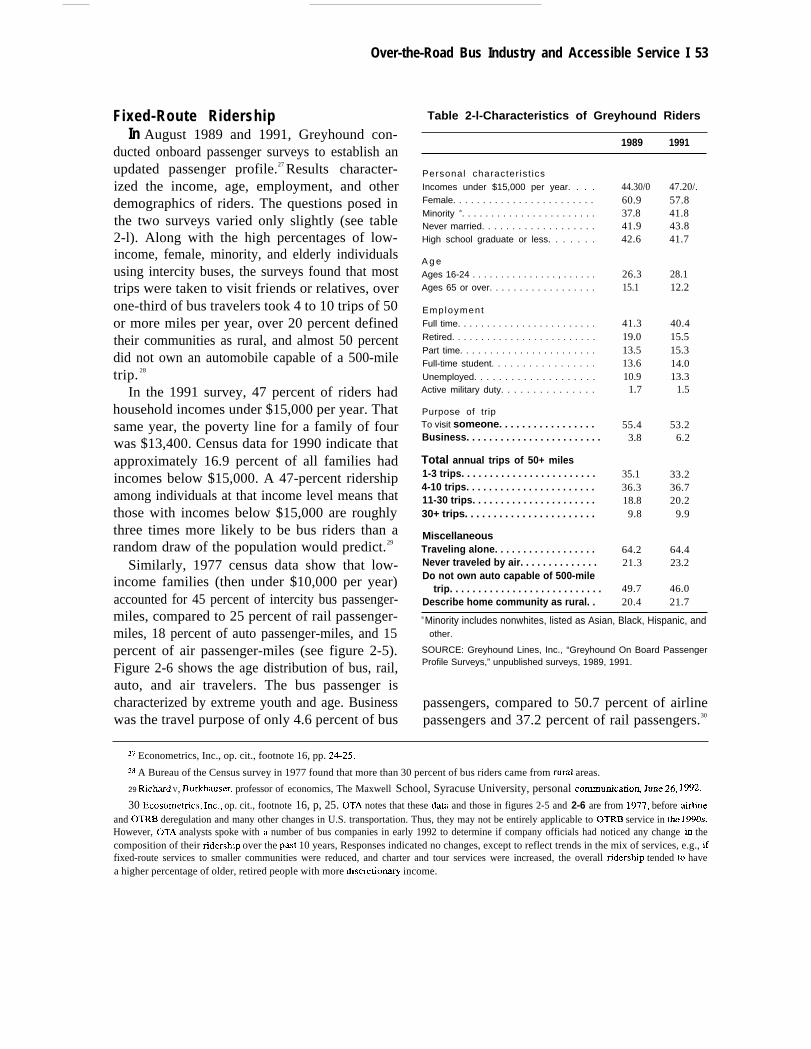
ducted onboard passenger surveys to establish anupdated passenger profile.27 Results character-ized the income, age, employment, and otherdemographics of riders. The questions posed inthe two surveys varied only slightly (see table2-l). Along with the high percentages of low-income, female, minority, and elderly individualsusing intercity buses, the surveys found that mosttrips were taken to visit friends or relatives, overone-third of bus travelers took 4 to 10 trips of 50or more miles per year, over 20 percent definedtheir communities as rural, and almost 50 percentdid not own an automobile capable of a 500-miletrip. 28
In the 1991 survey, 47 percent of riders hadhousehold incomes under $15,000 per year. Thatsame year, the poverty line for a family of fourwas $13,400. Census data for 1990 indicate thatapproximately 16.9 percent of all families hadincomes below $15,000. A 47-percent ridershipamong individuals at that income level means thatthose with incomes below $15,000 are roughlythree times more likely to be bus riders than arandom draw of the population would predict.29
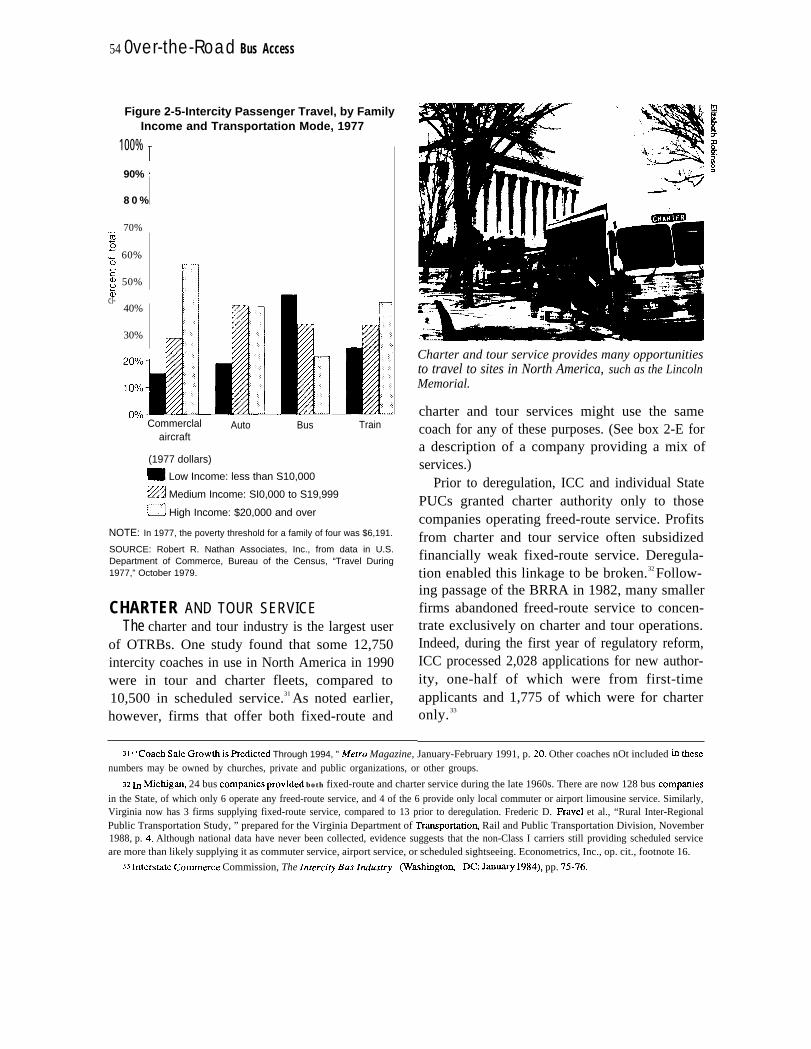
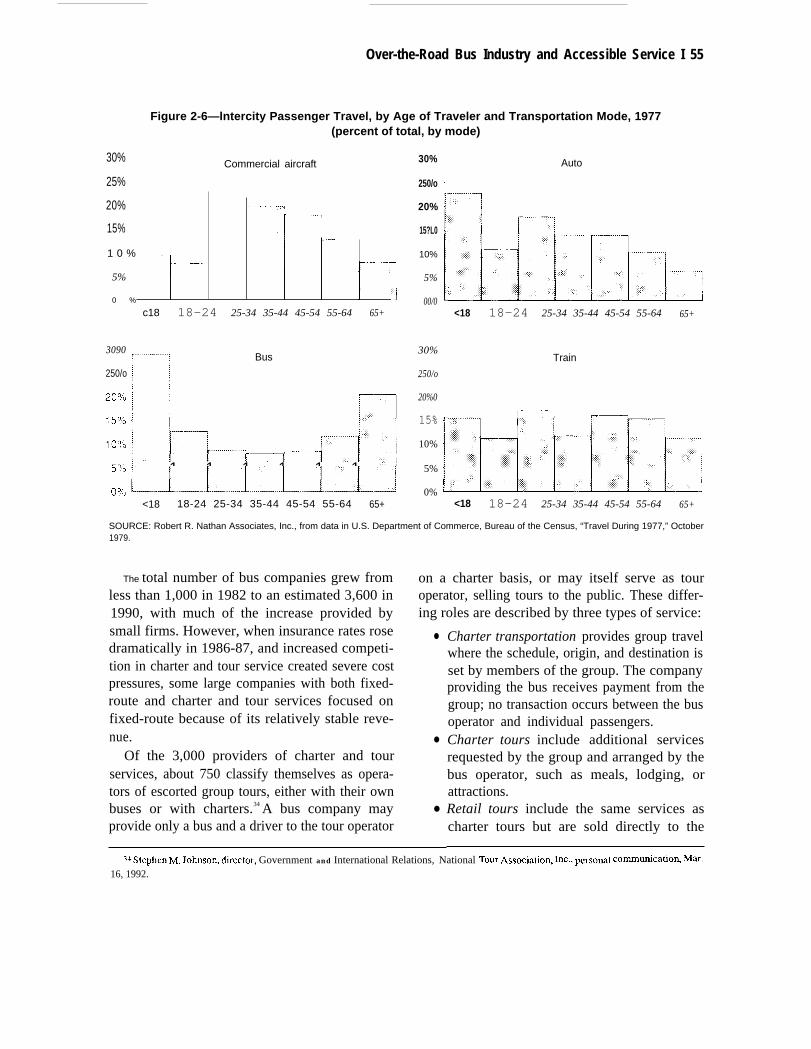
Similarly, 1977 census data show that low-income families (then under $10,000 per year)accounted for 45 percent of intercity bus passenger-miles, compared to 25 percent of rail passenger-miles, 18 percent of auto passenger-miles, and 15percent of air passenger-miles (see figure 2-5).Figure 2-6 shows the age distribution of bus, rail,auto, and air travelers. The bus passenger ischaracterized by extreme youth and age. Businesswas the travel purpose of only 4.6 percent of bus
Table 2-l-Characteristics of Greyhound Riders
1989 1991
Personal character ist ics
Incomes under $15,000 per year. . . .Female. . . . . . . . . . . . . . . . . . . . . . . .
Minority a. . . . . . . . . . . . . . . . . . . . . . .Never married. . . . . . . . . . . . . . . . . . .High school graduate or less. . . . . . .
A g eAges 16-24 . . . . . . . . . . . . . . . , . . . . . .Ages 65 or over. . . . . . . . . . . . . . . . . .
Employment
Full time. . . . . . . . . . . . . . . . . . . . . . . .
Retired. . . . . . . . . . . . . . . . . . . . . . . . .
Part time. . . . . . . . . . . . . . . . . . . . . . .Full-time student. . . . . . . . . . . . . . . . .
Unemployed. . . . . . . . . . . . . . . . . . . .Active military duty. . . . . . . . . . . . . . .
Purpose of tripTo visit someone. . . . . . . . . . . . . . . . .Business. . . . . . . . . . . . . . . . . . . . . . . .
Total annual trips of 50+ miles1-3 trips. . . . . . . . . . . . . . . . . . . . . . . .4-10 trips. . . . . . . . . . . . . . . . . . . . . . .11-30 trips. . . . . . . . . . . . . . . . . . . . . .30+ trips. . . . . . . . . . . . . . . . . . . . . . .
MiscellaneousTraveling alone. . . . . . . . . . . . . . . . . .Never traveled by air. . . . . . . . . . . . . .Do not own auto capable of 500-mile
trip. . . . . . . . . . . . . . . . . . . . . . . . . . .Describe home community as rural. .
44.30/060.937.841.942.6
26.315.1
41.319.013.513.610.91.7
55.43.8
35.136.318.89.8
64.221.3
49.720.4
47.20/.57.841.843.841.7
28.112.2
40.415.515.314.013.3
1.5
53.26.2
33.236.720.2
9.9
64.423.2
46.021.7
a Minority includes nonwhites, listed as Asian, Black, Hispanic, andother.
SOURCE: Greyhound Lines, Inc., “Greyhound On Board PassengerProfile Surveys,” unpublished surveys, 1989, 1991.
passengers, compared to 50.7 percent of airlinepassengers and 37.2 percent of rail passengers.30
27 Econometrics, Inc., op. cit., footnote 16, pp. 2425.
‘s A Bureau of the Census survey in 1977 found that more than 30 percent of bus riders came from rural areas.
29 Ric&d V, Bur&~uscr, professor of economics, The Maxwell School, Syracuse University, personal cornmunicatio% Jme 26, 1992.
30 Ecosornetfics, Inc., op. cit., footnote 16, p, 25. OTA notes that these da~ and those in figures 2-5 and 2-6 are from 1977, before airlticand OTRB deregulation and many other changes in U.S. transportation. Thus, they may not be entirely applicable to OTRB service in the 1990s.However, OTA analysts spoke with a number of bus companies in early 1992 to determine if company officials had noticed any change in thecomposition of their ridership over the past 10 years, Responses indicated no changes, except to reflect trends in the mix of services, e.g., iffixed-route services to smaller communities were reduced, and charter and tour services were increased, the overall ridership tended to havea higher percentage of older, retired people with more discretiomry income.
54 0ver-the-Road Bus Access
Figure 2-5-Intercity Passenger Travel, by FamilyIncome and Transportation Mode, 1977
100% ~90% ‘
8 0 %
70%~
~ 60%
F: 50%5
cl-40%
30%
r
- ,-Commerclal Auto Bus Train
aircraft
(1977 dollars)
_ Low Income: less than S10,000
~~ Medium Income: SI0,000 to S19,999
~ High Income: $20,000 and over
NOTE: In 1977, the poverty threshold for a family of four was $6,191.
SOURCE: Robert R. Nathan Associates, Inc., from data in U.S.Department of Commerce, Bureau of the Census, “Travel During1977,” October 1979.
CHARTER AND TOUR SERVICEThe charter and tour industry is the largest user
of OTRBs. One study found that some 12,750intercity coaches in use in North America in 1990were in tour and charter fleets, compared to10,500 in scheduled service.31 As noted earlier,however, firms that offer both fixed-route and
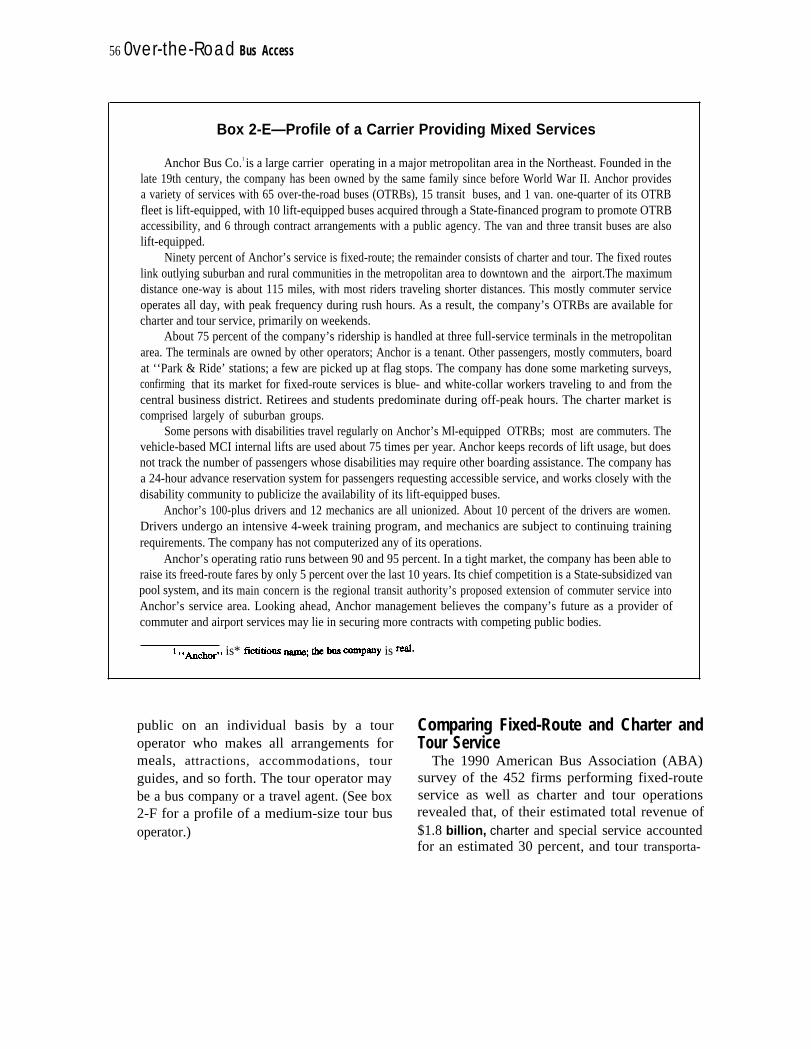
Charter and tour service provides many opportunitiesto travel to sites in North America, such as the LincolnMemorial.
charter and tour services might use the samecoach for any of these purposes. (See box 2-E fora description of a company providing a mix ofservices.)
Prior to deregulation, ICC and individual StatePUCs granted charter authority only to thosecompanies operating freed-route service. Profitsfrom charter and tour service often subsidizedfinancially weak fixed-route service. Deregula-tion enabled this linkage to be broken.32 Follow-ing passage of the BRRA in 1982, many smallerfirms abandoned freed-route service to concen-trate exclusively on charter and tour operations.Indeed, during the first year of regulatory reform,ICC processed 2,028 applications for new author-ity, one-half of which were from first-timeapplicants and 1,775 of which were for charteronly. 33
31 { ‘Coach Sale Grow~ is Predicted Through 1994, ” kferro Magazine, January-February 1991, p. 20. Other coaches nOt included in ~esenumbers may be owned by churches, private and public organizations, or other groups.
32 ~ ~ctiga, 24 bus comp~es provided both fixed-route and charter service during the late 1960s. There are now 128 bus comptiesin the State, of which only 6 operate any freed-route service, and 4 of the 6 provide only local commuter or airport limousine service. Similarly,Virginia now has 3 firms supplying fixed-route service, compared to 13 prior to deregulation. Frederic D. Fravel et al., “Rural Inter-RegionalPublic Transportation Study, ” prepared for the Virginia Department of Transportatio~ Rail and Public Transportation Division, November1988, p. 4, Although national data have never been collected, evidence suggests that the non-Class I carriers still providing scheduled serviceare more than likely supplying it as commuter service, airport service, or scheduled sightseeing. Econometrics, Inc., op. cit., footnote 16.
u Intcm~te Commerce Commission, The Inrercity Bus Industry (Wash@toq DC: JaDWMY 1984), pp. 75-76.
Over-the-Road Bus Industry and Accessible Service I 55
30%
25%
20%
15%
1 0 %
5%
0 %
Figure 2-6—lntercity Passenger Travel, by Age of Traveler and Transportation Mode, 1977(percent of total, by mode)
Commercial aircraft
— . . . . . . .———.. 1
.. .-,.
.
I ... .. —.—.——. ——. --—1J
c18 18-24 25-34 35-44 45-54 55-64 65+
3090
i---l
Bus
250/o
50/01 1 1 1 1 1 1o,ouJ_LLLd<18 18-24 25-34 35-44 45-54 55-64 65+
30%
250/o
20%
15?L0
10%
5%
00/0
30%
250/o
20%0
15%
10%
5%
0%
Auto
<18 18-24 25-34 35-44 45-54 55-64 65+
Train
<18 18-24 25-34 35-44 45-54 55-64 65+
SOURCE: Robert R. Nathan Associates, Inc., from data in U.S. Department of Commerce, Bureau of the Census, “Travel During 1977,” October1979.
The total number of bus companies grew from on a charter basis, or may itself serve as tourless than 1,000 in 1982 to an estimated 3,600 in operator, selling tours to the public. These differ-1990, with much of the increase provided by ing roles are described by three types of service:small firms. However, when insurance rates rose ●
dramatically in 1986-87, and increased competi-tion in charter and tour service created severe costpressures, some large companies with both fixed-route and charter and tour services focused onfixed-route because of its relatively stable reve-nue. ●
Of the 3,000 providers of charter and tourservices, about 750 classify themselves as opera-tors of escorted group tours, either with their ownbuses or with charters.34 A bus company may ●
provide only a bus and a driver to the tour operator
Charter transportation provides group travelwhere the schedule, origin, and destination isset by members of the group. The companyproviding the bus receives payment from thegroup; no transaction occurs between the busoperator and individual passengers.Charter tours include additional servicesrequested by the group and arranged by thebus operator, such as meals, lodging, orattractions.Retail tours include the same services ascharter tours but are sold directly to the
34 Stephen M. Jolm.son, (iircctor, Government and International Relations, National Tour Association+ ~c., personal cornrn~catio~ MM.16, 1992.
56 0ver-the-Road Bus Access
Box 2-E—Profile of a Carrier Providing Mixed Services
Anchor Bus Co.1 is a large carrier operating in a major metropolitan area in the Northeast. Founded in thelate 19th century, the company has been owned by the same family since before World War II. Anchor providesa variety of services with 65 over-the-road buses (OTRBs), 15 transit buses, and 1 van. one-quarter of its OTRBfleet is lift-equipped, with 10 lift-equipped buses acquired through a State-financed program to promote OTRBaccessibility, and 6 through contract arrangements with a public agency. The van and three transit buses are alsolift-equipped.
Ninety percent of Anchor’s service is fixed-route; the remainder consists of charter and tour. The fixed routeslink outlying suburban and rural communities in the metropolitan area to downtown and the airport.The maximumdistance one-way is about 115 miles, with most riders traveling shorter distances. This mostly commuter serviceoperates all day, with peak frequency during rush hours. As a result, the company’s OTRBs are available forcharter and tour service, primarily on weekends.
About 75 percent of the company’s ridership is handled at three full-service terminals in the metropolitanarea. The terminals are owned by other operators; Anchor is a tenant. Other passengers, mostly commuters, boardat ‘‘Park & Ride’ stations; a few are picked up at flag stops. The company has done some marketing surveys,confirming that its market for fixed-route services is blue- and white-collar workers traveling to and from thecentral business district. Retirees and students predominate during off-peak hours. The charter market iscomprised largely of suburban groups.
Some persons with disabilities travel regularly on Anchor’s Ml-equipped OTRBs; most are commuters. Thevehicle-based MCI internal lifts are used about 75 times per year. Anchor keeps records of lift usage, but doesnot track the number of passengers whose disabilities may require other boarding assistance. The company hasa 24-hour advance reservation system for passengers requesting accessible service, and works closely with thedisability community to publicize the availability of its lift-equipped buses.
Anchor’s 100-plus drivers and 12 mechanics are all unionized. About 10 percent of the drivers are women.Drivers undergo an intensive 4-week training program, and mechanics are subject to continuing trainingrequirements. The company has not computerized any of its operations.
Anchor’s operating ratio runs between 90 and 95 percent. In a tight market, the company has been able toraise its freed-route fares by only 5 percent over the last 10 years. Its chief competition is a State-subsidized vanpool system, and its main concern is the regional transit authority’s proposed extension of commuter service intoAnchor’s service area. Looking ahead, Anchor management believes the company’s future as a provider ofcommuter and airport services may lie in securing more contracts with competing public bodies.
1 ,c~kr,, is* fictitious z; tk bm co~~y is ‘d”
public on an individual basis by a tour Comparing Fixed-Route and Charter andoperator who makes all arrangements for Tour Servicemeals, attractions, accommodations, tour The 1990 American Bus Association (ABA)guides, and so forth. The tour operator may survey of the 452 firms performing fixed-routebe a bus company or a travel agent. (See box service as well as charter and tour operations2-F for a profile of a medium-size tour bus revealed that, of their estimated total revenue of
operator.) $1.8 billion, charter and special service accountedfor an estimated 30 percent, and tour transporta-

Over-the-Road Bus Industry and Accessible Service I 57
Box 2-F—Profile of a Medium-Size Bus Tour
Ajax Tours, Inc.1 is a medium-size bus tour operator, in business for almost 20 years, and based in a midwestcommunity of about 100,000 population. Ajax operated 150 tours in 1991, about 75 percent of them between Mayand October, the peak season in that part of the country. Business is fairly good during the shoulder seasons fromOctober to early December and again from March to May. During the winter it falls off drastically.
The company owns two new over-the-road buses, which are not lift-equipped but have a kneeling featurefor easier boarding.2 Four 12-passenger vans are used mostly for passenger pickups. Ajax charters six to eightadditional over-the-road buses from a bus operator located a few miles out of town, making reservations 6 to 8months in advance. The operations of Ajax Tours, Inc. are completely computerized.
The company conducts tours throughout the continental United States and Canada with its own buses andits charters. The most popular and frequent tours, representing 25 percent of the company’s total business, are toNashville, Tennessee, and Branson, Missouri, centers for country music. Sixty percent of all tours are for 1 day.The typical longer tour is 3 to 5 days, with some tours as long as 30 days.
Most passengers are over 55 years of age, with disposable income, who like to travel but can no longer driveor who prefer not to. In recent years, the number of passengers in their fifties has increased, and females clearlypredominate. In a typical tour group of 40, only 4 to 8 are males.
Customers tend to be less interested in tours of 2 weeks or more, preferring in such cases to fly to theirdestinations and spend more time touring locally. Increasing numbers seem to want less structured tours than inyears past, with more options to see sites of particular interest to them.
In a given year, Ajax will accommodate from 12 to 15 persons using wheeled mobility aids who thus far,with the kneeling feature of the bus, have been agile enough to board by themselves. Their wheelchairs or scootersare stowed in the baggage compartment. Larger numbers of passengers who have limited mobility but do not usewheeled mobility aids, and others with visual and hearing impairments, tour on Ajax during the course of a year.
The company’s chief competition is nonprofit organizations running tours for their members. Over the past5 years, Ajax has been able to raise its tour rates by 10 to 15 percent and remain competitive in the commercialtour market.
1 “Ajax” is a fictitious name; the company iS Rd.
2 me ~eel@ fea~e ~eduCes he height of tie f~st st~ to 9 inch- above tie gro~d, a rtiuction of 4 1/2 inches.
tion for about 6 percent.35 Fixed-route service charter passenger and $21.18 per fixed-routeaccounted for 57 percent and package express for passenger. These figures also reflect differences7 percent of revenues.36 in average trip lengths. Of particular note is that
The 452 firms provided an estimated 38 million the average passenger revenue was $1.97 perpassenger-trips on charter and special services, fixed-route bus-mile compared to $1.63 for char-and 1.5 million trips on tours. The average ter and special services, and $1.83 for tour
services. 37 However, a subset of 56 firms operat-revenue for tour passengers is estimated to be$64.04 per passenger, compared to $12.98 per ing only fixed-route OTRBs reported $2.21 per
35 Mark Beavers, “A Picture of the Industry, ” Destinations (American Bus Association), December 1990. Magazine survey respondentstend to be self-selecting and therefore do not always represent the target audience.
36 ENO Foundation for Tr~PO~tiO~ InC., op. cit., footnote 12 percentage of revenues de~ved ffom pactige express VarieS frOIll C~er
to carrier, ranging from about 5 to 15 percent.
37 ibid., p. 3.
330-069 0 - 93 - 3 QL:3
58 0ver-the-Road Bus Access
bus-mile. This may be due to the fact that someOTRBs on freed-route service generate incomefrom package express.
These revenue estimates suggest that althoughfreed-route ridership is shrinking, it is the onlyservice capable of paying higher operating costs.For charters and tours to be profitable, operatingcosts must be lower on a bus-mile basis. This maybe the reason why a number of the unionizedfins, which pay higher wages, such as Grey-hound Lines, Jefferson Lines, and Carolina Coach,have substantially reduced their charter and touroperations, focusing instead on their fixedroutes. 38 The large increase in the number ofcompanies offering charter and tour services hasalso increased competition, severely limiting theability of some higher cost firms to compete inthis market.
RidershipLittle nonproprietary information about charter
and tour passengers is available. A 1986 marketresearch effort to identify the characteristics ofthe customers of one particular firm showed thatbus tour patrons have a median age of 60, and takean average of nearly five l-day vacation trips peryear, 4.1 overnight or weekend vacation trips, and2.3 extended vacation trips annually.39 Theytravel primarily to socialize, attend sporting orcultural events, and go sightseeing; have a house-hold income of over $34,000 (1985 dollars, over$47,000 in 1991 dollars), and an average autoownership of 1.8 autos per household; preferpackage tours and economy vacations and arerelatively averse to planning their own vacations;are more likely to be female; and prefer grouptravel to travel on their own. Most groups contain
Iu)
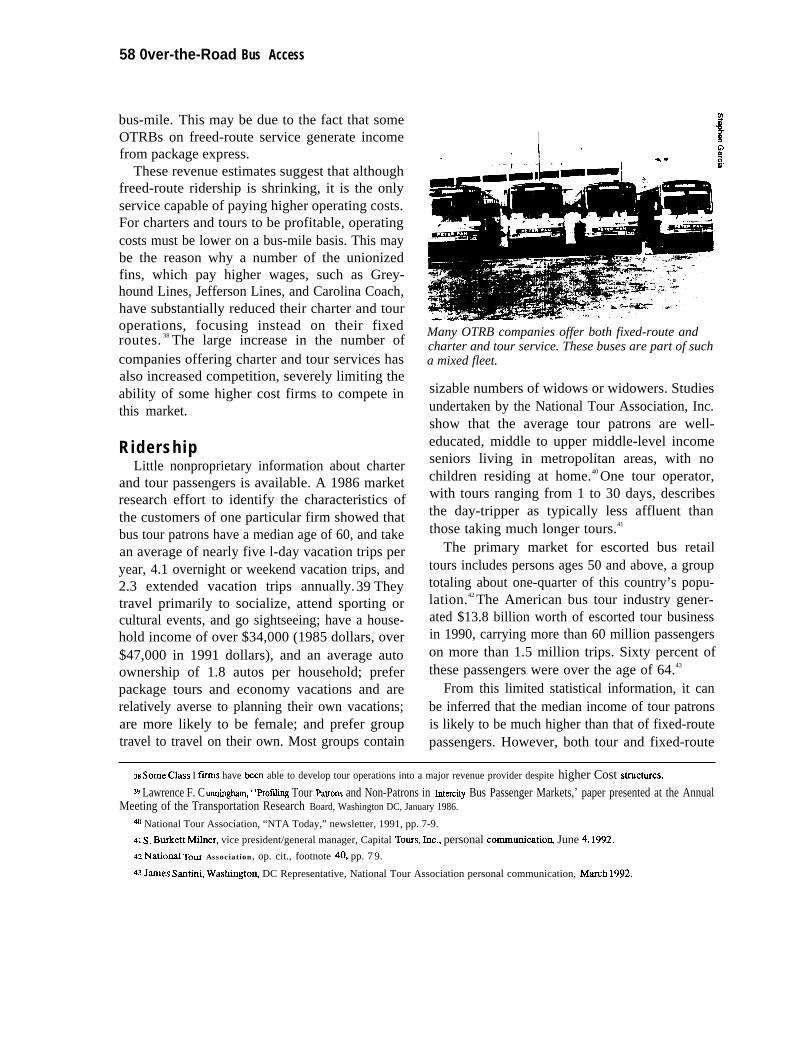
Many OTRB companies offer both fixed-route andcharter and tour service. These buses are part of sucha mixed fleet.
sizable numbers of widows or widowers. Studiesundertaken by the National Tour Association, Inc.show that the average tour patrons are well-educated, middle to upper middle-level incomeseniors living in metropolitan areas, with nochildren residing at home.40 One tour operator,with tours ranging from 1 to 30 days, describesthe day-tripper as typically less affluent thanthose taking much longer tours.41
The primary market for escorted bus retailtours includes persons ages 50 and above, a grouptotaling about one-quarter of this country’s popu-lation.42 The American bus tour industry gener-ated $13.8 billion worth of escorted tour businessin 1990, carrying more than 60 million passengerson more than 1.5 million trips. Sixty percent ofthese passengers were over the age of 64.43
From this limited statistical information, it canbe inferred that the median income of tour patronsis likely to be much higher than that of fixed-routepassengers. However, both tour and fixed-route
38 Some Class I firms have been able to develop tour operations into a major revenue provider despite higher Cost s~ctures.39 Lawrence F. Curmingham, ‘Proftig Tour Patxons and Non-Patrons in Interehy Bus Passenger Markets,’ paper presented at the Annual
Meeting of the Transportation Research Board, Washington DC, January 1986.
~ National Tour Association, “NTA Today,” newsletter, 1991, pp. 7-9.
41 S. Burkett Milner, vice president/general manager, Capital Tours, hc., personal commtiatio~ June 4, 1992.AZ Natio~ TOW Association, op. cit., footnote w, pp. 7-9.
AS James su~i, wastin~o~ DC Representative, National Tour Association personal communication, March 1992.
Over-the-Road Bus Industry and Accessible Service 59
patrons are more likely to be over 65 thantravelers on other modes of transportation. Thisgroup will be a growing percentage of thepopulation in coming years. The Bureau of theCensus projects a growth in population in the 65and over category, from 31 million in 1990 tomore than 65 million in 2050, rising from 12,5percent to 22.9 percent of the overall population.
SERVICE TO RURAL AREASAmong the six specific areas the ADA directs
OTA to analyze is: “The impact of accessibilityrequirements on the continuation of over-the-roadbus service, with particular consideration of theimpact of such requirements on such service torural communities. ”44
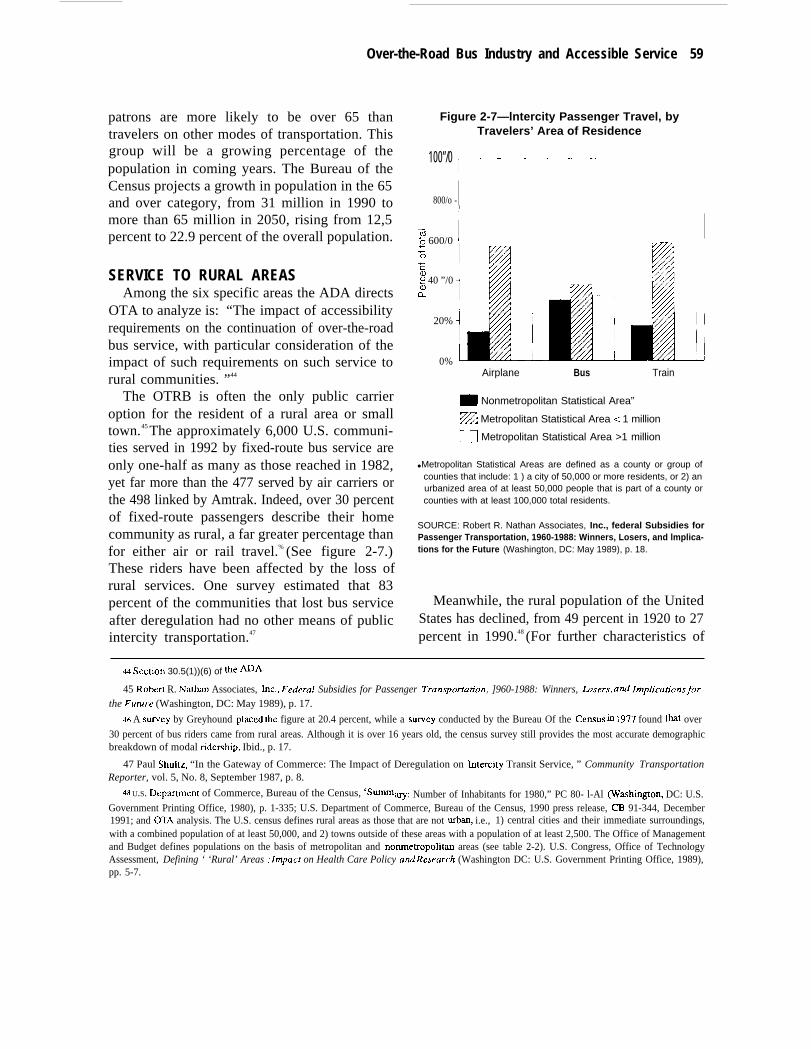
The OTRB is often the only public carrieroption for the resident of a rural area or smalltown.45 The approximately 6,000 U.S. communi-ties served in 1992 by fixed-route bus service areonly one-half as many as those reached in 1982,yet far more than the 477 served by air carriers orthe 498 linked by Amtrak. Indeed, over 30 percentof fixed-route passengers describe their homecommunity as rural, a far greater percentage thanfor either air or rail travel.% (See figure 2-7.)These riders have been affected by the loss ofrural services. One survey estimated that 83percent of the communities that lost bus serviceafter deregulation had no other means of publicintercity transportation.47
Figure 2-7—lntercity Passenger Travel, byTravelers’ Area of Residence
100”/0 r “ ‘-- ‘- - ‘- ‘-1
800/o -I
3~ 600/0 ‘
zEa)2 40 ”/0:
20%
0%Airplane Bus Train
m Nonmetropolitan Statistical Area”
~ Metropolitan Statistical Area c 1 million
~ Metropolitan Statistical Area >1 million
● Metropolitan Statistical Areas are defined as a county or group ofcounties that include: 1 ) a city of 50,000 or more residents, or 2) anurbanized area of at least 50,000 people that is part of a county orcounties with at least 100,000 total residents.
SOURCE: Robert R. Nathan Associates, Inc., federal Subsidies forPassenger Transportation, 1960-1988: Winners, Losers, and lmplica-tions for the Future (Washington, DC: May 1989), p. 18.
Meanwhile, the rural population of the UnitedStates has declined, from 49 percent in 1920 to 27percent in 1990.48 (For further characteristics of
44 Section 30.5(1))(6) of tie ~A
45 Robefl R. Nati Associates, Inc., Federal Subsidies for Passenger Transportan”on, ]960-1988: Winners, hsers, ati Imp/icaliOnsfOrthe Furure (Washington, DC: May 1989), p. 17.
46 A smey by Greyhound pl~ed tie figure at 20.4 percent, while a su~ey conducted by the Bureau Of the CeIISUS ti 1977 found MI over
30 percent of bus riders came from rural areas. Although it is over 16 years old, the census survey still provides the most accurate demographicbreakdown of modal ndership. Ibid., p. 17.
47 Paul Shultz, “In the Gateway of Commerce: The Impact of Deregulation on Intercity Transit Service, ” Community TransportationReporter, vol. 5, No. 8, September 1987, p. 8.
48 U.S. Dcp~ent of Commerce, Bureau of the Census, ‘Summary: Number of Inhabitants for 1980,” PC 80- l-Al (WashingtorA DC: U.S.Government Printing Office, 1980), p. 1-335; U.S. Department of Commerce, Bureau of the Census, 1990 press release, CB 91-344, December1991; and OTA analysis. The U.S. census defines rural areas as those that are not urbzq i.e., 1) central cities and their immediate surroundings,with a combined population of at least 50,000, and 2) towns outside of these areas with a population of at least 2,500. The Office of Managementand Budget defines populations on the basis of metropolitan and nonmetropolitan areas (see table 2-2). U.S. Congress, Office of TechnologyAssessment, Defining ‘ ‘Rural’ Areas :Impact on Health Care Policy andResearch (Washington DC: U.S. Government Printing Office, 1989),pp. 5-7.

60 0ver-the-Road Bus Access
Table 2-2—Selected Characteristics of Metropolitan and Nonmetropolitan Populationsa
Metro Non metro
Total population. . . . . . . . . . . . . . . . . . . . . . . . . . . . .Population density per square mile. . . . . . . . . . . . .Median age. . . . . . . . . . . . . . . . . . . . . . . . . . . . . . . . .Percent of population under age 18.. . . . . . . . . . . .Percent of population age 65 and over. . . . . . . . . .Median family income. . . . . . . . . . . . . . . . . . . . . . . ,Percent with family incomes below poverty level. .Unemployment rate. . . . . . . . . . . . . . . . . . . . . . . . . .Median years of education completed. . . . . . . . . . .
187,072,000328
30.027.8%10.7Y0
$33,13112.5%6.9%11.6
56,324,00019
30.229.4%13.0%
$24,39716.9?4.8.4%10.9
a Based on office of Management and Budget definitions: Metropolitan Statistical Areas (MSAs) are counties or groups ofcounties that have either a city of 50,000 or more people or an urbanized area that has at least 50,000 people located in acounty or group of counties of at least 100,000 population. Counties that do not have central cities can be counted as MSAsif they have other characteristics of metropolitan areas such as significant commuting to other counties or high populationdensity. Nonmetropolitan populations reside in all other counties.
SOURCE:U.S. Congress, Office of Technology Assessment, Health Care in Rural America, OTA-H-434 (Washington, DC: U.S.Government Printing Office, September 1990), p. 40.
metropolitan and nonmetropolitan populations,see table 2-2.) For example, Iowa, with anextremely large rural population of 39 percent,49
has a higher percentage of the elderly than all butthree States, two of which, Florida and Arizona,are retirement havens.50 This demographic pic-ture appears to make rural America a good fit forthe fixed-route bus market, whose passengerstend to be disproportionately made up of the poor,young, and elderly.
Effects of Deregulation on Rural ServiceThe passage of the BRRA resulted in signifi-
cant point abandonment, with service lost to2,154 communities in the first year alone.51 Thisabandonment did not necessarily eliminate serv-ice to entire rural areas; often just unprofitablestops were dropped. Further, many bus operations
shifted to the Interstate Highway System, elimi-nating stops along parallel local routes usingolder U.S. and State highways. This meant that,for individuals able to travel a short distanceoutside their home town, intercity service wassometimes still available.52 How much of thereduction in service points was due to deregula-tion is a matter of debate. Quite possibly, eco-nomic trends would have eventually forced theshut down of service to some communities.53
Small towns bore the brunt of deregulationbecause of their lack of ridership and locations offof main routes. In Iowa, 70 percent of the pointsthat lost service served fewer than 10 passengersper month. 54 Figures such as these did nottranslate into profits for the intercity carriers,especially when the bus had to travel off thebeaten path to pick up only a few riders. In a
@ U.S. Dep~ent of Commerce, Bureau of the census, ‘‘Percent Urban and Rural Population, 1990 and 1980, ” The Census and You, vol.27, No. 1 (Washington DC: U.S. Government Printing OffIce, January, 1992).
50 os~ Gray Davidson, Broken Heartla~: The Rise of Americans Rural Ghetto (New York NY: The Fr= press. 1990)} P. 63.
51 Ecosome~cs, Inc., op. cit., footiote 16, p. 17.
52 All ~om~ties in~on~ tit lost Semicehad ~o~er ~temity bus stop ~tween9 md 21 miles away. In Iowa, 37 percent of ticket agents
in communities that lost semice reported that the nearest stop was over 20 miles away. John Due et al., Transportation Service to SmallCommunities: Effecfs of Deregulation (Ames, IA: Iowa State University Press, 1990), p. 86.
53 Meyer and Oster, op. cit., footnote 9, p. 219.
54 Ma.ry KihI, “TheImpact of Bus Deregulation on Small Towns, ” Tratqwrtation Research Record1012 (Washington DC: TransportationResearch Board, National Research Council, 1985), as cited in Eric Hansen et al., The Berrefils of Zntercity Bus Service (Milwaukee, WI: TheSchool of Architecture and Urban PIarming, The University of Wisconsin-Milwaukee, October 1986), p. A9.

Over-the-Road Bus Industry and Accessible Service I 61
Figure 2-8—North Dakota Fixed-Route Service,1979 and 1990
●
✎ = Minot*.*. * .* . . * * .. = * .“ 1’d ‘* ! Grand*-.**Williston
{.
-% L1
Forks● .’
1979
1991
● = Service points
SOURCE: U.S. General Accounting Office, Surface Transportation.’Availability of Intercity Bus Service Continues to Decline (Washington,DC: June 1992), pp. 21-22.
sample of 12 States, of the communities that lostservice in the first 2 years of deregulation, 82percent had populations under 2,500 and 94percent had populations of less than 10,000.55
When given the option, the major carriers concen-trated on the most profitable routes, those be-tween large central cities. Unlike the AirlineDeregulation Act of 1978, which provided subsi-dies for continued air service to small communi-
Figure 2-9-Fixed-Route Service From Columbusto Grand Island, Nebraska
r‘L - - . .
-\.
L.Columbus 2 hrs ‘
, 1.5 hrs~ P -—–->o ,Omaha/ \.’
b, 1, ‘ 1.15 hrs
I b- IJ-—--- ●
Grand Island Z i’s hrs Lin~o’@
(~.
–~
‘ -- Old route — New route
SOURCE: Russell’s Guides, Inc., Russell's Official National MotorcoachGuide (Spokane, WA: Friendship Publications, Inc., October 1982 andNovember 1991), cited in U.S. General Accounting Office, SurfaceTransportation: Availability of Intercity Bus Service Continues toDecline (Washington, DC: June 1992), p. 25.
ties, the BRRA included no such provision forcommunities left without bus service.
For example, the two maps in figure 2-8compare freed-route service in North Dakota in1979, when 129 locations were served, and in1991, when 68 locations received service.56 Allcommunities south of Interstate 94 (I-94) lostservice during that period. Bus service along theI-94 corridor still connects Fargo, in the east,through Jamestown and Bismark to the Montanaborder. However, I-94 now serves 17 interveningpoints compared to 34 in 1979. Service was alsodiscontinued for points along the route linkingJamestown on I-94 and Minot, and the routebetween Minot and Williston. Williston, theWilliams County seat, and eight other communi-ties in that part of western North Dakota, nowhave no bus service.
Unlike Williston, Jamestown is still linked toMinot by bus, but the Jamestown passenger mustnow go through Bismark, adding approximately25 percent to the distance traveled. Similarly,figure 2-9 demonstrates why, in 1992, travel by
55 ~~~ton @p.r ~~ C. ~~ am, The jmp=ctf of Regulat~q R.@or~ on ~n~ercify Bus se~ice (Bloomi~gto~, IN: Indiana u?l~VtTSiQ,
September 1984.
56 U.S. Gene~ Accounting Office, Suflace Transportation: A~*ailability of Intercity Bus Service Continues to Decline (w~~@o% Dc:June 1992), pp. 21-22.
62 0ver-the-Road Bus Access
bus within Nebraska between Columbus andGrand Island is less convenient than it was 5 yearsearlier and less attractive as a travel option.57
Formerly a 1 l/2-hour trip, the journey now takes6 1/2 hours.
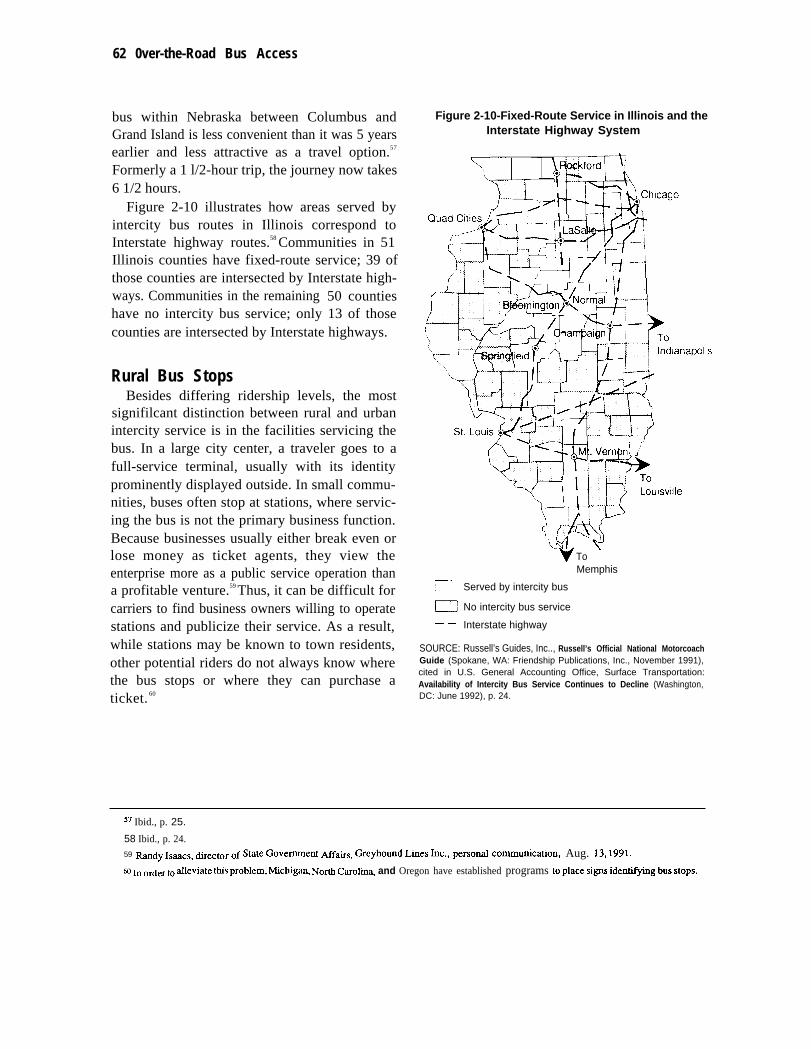
Figure 2-10 illustrates how areas served byintercity bus routes in Illinois correspond toInterstate highway routes.58 Communities in 51Illinois counties have fixed-route service; 39 ofthose counties are intersected by Interstate high-ways. Communities in the remaining 50 countieshave no intercity bus service; only 13 of thosecounties are intersected by Interstate highways.
Rural Bus StopsBesides differing ridership levels, the most
signifilcant distinction between rural and urbanintercity service is in the facilities servicing thebus. In a large city center, a traveler goes to afull-service terminal, usually with its identityprominently displayed outside. In small commu-nities, buses often stop at stations, where servic-ing the bus is not the primary business function.Because businesses usually either break even orlose money as ticket agents, they view theenterprise more as a public service operation thana profitable venture.59 Thus, it can be difficult forcarriers to find business owners willing to operatestations and publicize their service. As a result,while stations may be known to town residents,other potential riders do not always know wherethe bus stops or where they can purchase aticket. 60
Figure 2-10-Fixed-Route Service in Illinois and theInterstate Highway System
——
“\
F!orwT-l
Iapolls
WH---i3wv To
——
SOURCE:Guide (Spokane, WA: Friendship Publications, Inc., November 1991),cited in U.S. General Accounting Office, Surface Transportation:Availability of Intercity Bus Service Continues to Decline (Washington,DC: June 1992), p. 24.
Memphis
Served by intercity bus
No intercity bus service
Interstate highway
Russell’s Guides, Inc.., Russell’s Official National Motorcoach
37 Ibid., p. 25.
58 Ibid., p. 24.59 ~dy IS~c-, &=ctor of Smte Government Aff~s, Greyho~d Lines kc., perso~ Cc)tnmuniCritiOn, Aug. 13, 1991.
60 In order t. ~lcviate MS problem, Michigq North Carol@ and Oregon have established programs to place signs iden@@ bus stoPs.

Reliance on ServiceThe extent to which rural areas depend on
fixed-route passenger and package service isdifficult to determine. Studies of rural communi-ties that have lost service have concluded that,while on the whole the adverse consequences totowns were usually not severe, some individualbusinesses and people who had used the busendured significant hardship.61
Dependence on Passenger ServiceWith the exception of the private automobile,
no readily available alternative exists for travelalong many passenger bus routes. Therefore, thepotential adverse effect of abandonment can bevery high in rural communities. But in anyanalysis, the perceived need for the intercity busmust be separated from the actual demand for theservice.62
Community Dependence—Studies have con-sistently shown that route abandonment has hadminimal effects on rural communities in general.A study of 15 States facing substantial routediscontinuance after the passage of the BRRAfound no formal protests from communitieslosing service,63 Whether this was due to indiffer-ence or because of ignorance of how best toprotest is unclear. In the few States wheresignificant protest has occurred, a proposed aban-donment has often been stalled, or the route hasbeen partially subsidized by government funds. InNebraska, the work of a‘ ‘Save the Bus’ committ-ee eventually led to State funding of a rural route.Citizens were able to demonstrate that bus service
Over-the-Road Bus Industry and Accessible Service I 63
was in the public interest and that a substantialportion of the community wanted to maintain theservice. The route from Omaha to Rapid City,South Dakota, was maintained by Arrow andBlack Hills Stage Lines for several years after aFederal Transit Authority study recommendedState subsidies. However, ridership continued todecline, and the bus company stopped operationof the route on June 1, 1991.@
Because most residents of rural areas never usebus service, its loss has little impact on their lives.The business community is seldom affectedsignificantly, either, as most fixed-route bus tripsare taken for purposes of visiting friends orrelatives, and not for shopping or business trips.65
A nationwide study of service to rural areasconcluded that ‘‘. . . most intercity trips taken byrural residents . . . are not critical to their day-to-day needs [and] do not materially relate to thebasic economic functions of rural areas, ”66
Individual Dependence—For individuals de-pendent on bus service, however, communityabandonment often means increased isolation. Inthe Wisconsin study, 20 percent of bus riders fromsmall towns said they would not be able to makea similar trip if bus service were unavailable.Among the elderly, dependence on the bus is evenmore striking: 48 percent of those over 65 saidthey would not be able to make the trip if busservice were unavailable.67
However, community abandonment does notseem to have occurred disproportionately intowns with numerous poor and elderly residents.
c1 The wisco~fi Dep~cnt of Transportation conducted a study on the benefits of intercity bus service, which included an @ysis oftowns that have lost service. Similar studies have been conducted in Iowa and other States. Hansen et al., op. cit., footnote 54.
62 Due et al., op. cit., footnote 52, p. 88.
63 Ibid., p. 89.
ti U.S. Department of Transportation Comprehensive Study cflnterciry Bus Service in Nebrasb (Washington, DC: March 1988); andFrederic D. Fravel, Ecosornetrics, Inc., personal cornmunicatiom Feb. 16, 1993.
65 Due et aI., op. cit., footnote 52, p. 85.
66 JOhII Weus et a]., U.S. Dep~ent of Tr~po~tio~ Office of the Assistant Secretary for Policy and International AfftiS, ~nter-cify~u$,Rail, and Air Servicefor Residents of Rural Areas, 1980 (Washingto~ DC: U.S. Government printing Office, 1980), cited in Hansen et al.,op. cit., footnote 54, p. Al.
CT Hansen et al., op. cit., footnote 54, p. B2.
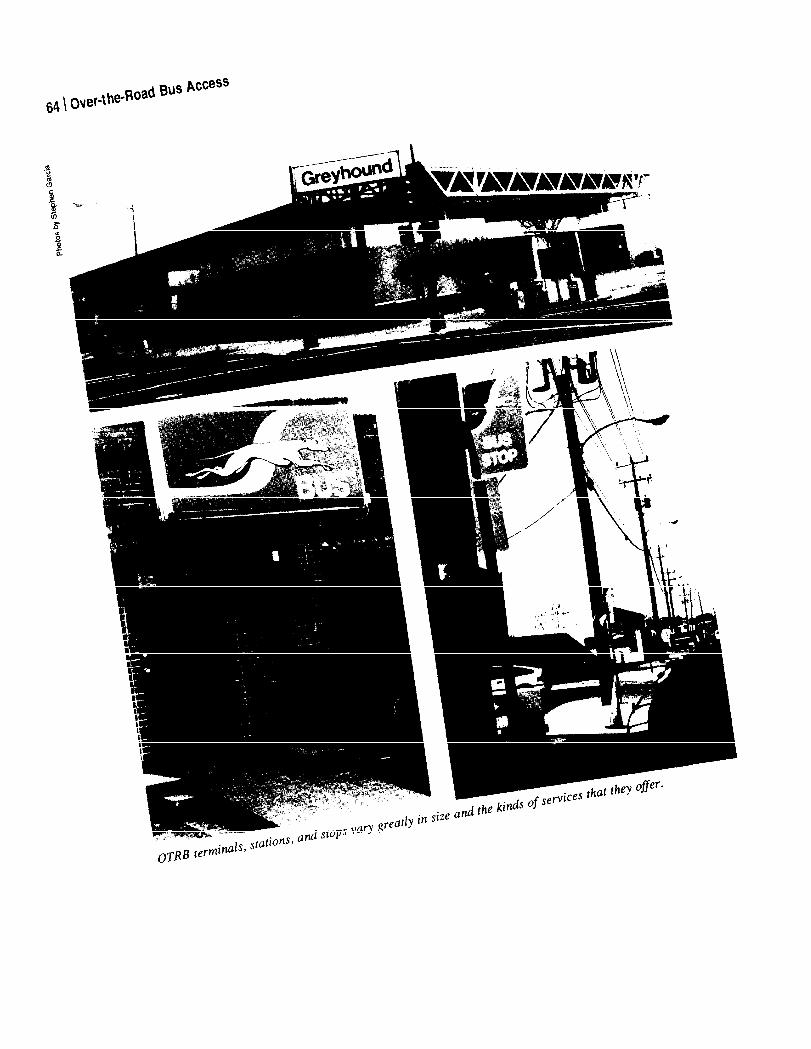
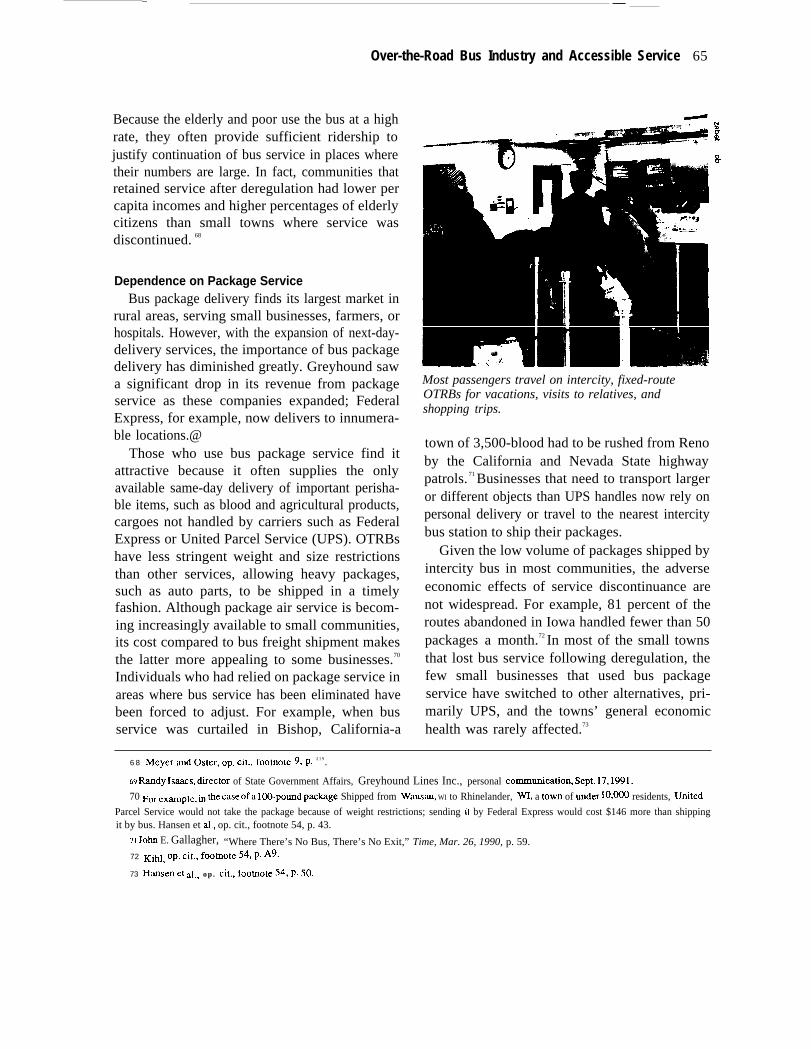
. —
Over-the-Road Bus Industry and Accessible Service 65
Because the elderly and poor use the bus at a highrate, they often provide sufficient ridership tojustify continuation of bus service in places wheretheir numbers are large. In fact, communities thatretained service after deregulation had lower percapita incomes and higher percentages of elderlycitizens than small towns where service wasdiscontinued. 68
Dependence on Package ServiceBus package delivery finds its largest market in
rural areas, serving small businesses, farmers, orhospitals. However, with the expansion of next-day-delivery services, the importance of bus packagedelivery has diminished greatly. Greyhound sawa significant drop in its revenue from packageservice as these companies expanded; FederalExpress, for example, now delivers to innumera-ble locations.@
Those who use bus package service find itattractive because it often supplies the onlyavailable same-day delivery of important perisha-ble items, such as blood and agricultural products,cargoes not handled by carriers such as FederalExpress or United Parcel Service (UPS). OTRBshave less stringent weight and size restrictionsthan other services, allowing heavy packages,such as auto parts, to be shipped in a timelyfashion. Although package air service is becom-ing increasingly available to small communities,its cost compared to bus freight shipment makesthe latter more appealing to some businesses.70
Individuals who had relied on package service inareas where bus service has been eliminated havebeen forced to adjust. For example, when busservice was curtailed in Bishop, California-a
Most passengers travel on intercity, fixed-routeOTRBs for vacations, visits to relatives, andshopping trips.
town of 3,500-blood had to be rushed from Renoby the California and Nevada State highwaypatrols. 71 Businesses that need to transport largeror different objects than UPS handles now rely onpersonal delivery or travel to the nearest intercitybus station to ship their packages.
Given the low volume of packages shipped byintercity bus in most communities, the adverseeconomic effects of service discontinuance arenot widespread. For example, 81 percent of theroutes abandoned in Iowa handled fewer than 50packages a month.72 In most of the small townsthat lost bus service following deregulation, thefew small businesses that used bus packageservice have switched to other alternatives, pri-marily UPS, and the towns’ general economichealth was rarely affected.73
6 8 Meyer and Os[er, Op. ClI., fOOtUOte 9. p. 2 1 9.
69 Randy 15a.acS, director of State Government Affairs, Greyhound Lines Inc., personal COmmUni@iOG Sept. 17, 1991.
70 For ~x~ple, ~ be case of a l~pomd pz~ge Shipped from Wausau, WI to Rhinelander, WI, a town of under lo,o~ residents, United
Parcel Service would not take the package because of weight restrictions; sending it by Federal Express would cost $146 more than shippingit by bus. Hansen et aI,, op. cit., footnote 54, p. 43.
71 JohII E. Gallagher, “Where There’s No Bus, There’s No Exit,” Time, Mar. 26, 1990, p. 59.72 Kl~, op, cit., fOOtllOtc 54, P ‘9.
73 Hmen et ~., op. Cit., fOO~Ote .54, P. 50

66 0ver-the-Road Bus Access
Government Assistance to Rural TransitFederal and State Governments offer financial
assistance for rural transit services, which aregenerally provided by vehicles other than OTRBs.The principal instrument for this assistance isSection 18 of the Federal Transit Act, successorto the Urban Mass Transportation Act of 1964.
●
●
●
Section 18 authorizes the Secretary of Trans-portation, through the Federal Transit Adminis-tration (FTA), to provide funds to each Stateto be used for public transportation projectsin nonurbanized areas .74 The funds may beused for planning, capital, and operatingassistance by State and local governmentbodies, nonprofit organizations, operators ofpublic transportation services, and others.The Section 18 program aims to facilitaterural residents’ access to health care, educa-tion, employment, public services, and otheractivities through improvement of publictransportation systems in rural and smallurban areas. It also seeks to encourage asmuch as possible the participation of privatetransportation providers in rural and smalltown transportation service.State agencies receive additional funds underSection 16(b)(2) of the 1978 Surface Trans-portation Assistance Act. These FTA fundsassist private nonprofit organizations topurchase vehicles and equipment to trans-port the elderly and individuals with disabil-ities in both rural and urbanized areas.Transportation providers serving primarilyrural areas may receive both Section 16(b)(2)and Section 18 funds from their State agen-
T4 states rwelve funds based on their Percenbge of the Nation’s total rural population usfig the census definition of ~.
75 The Dep~~ent of He~fi and Human Services provides $1 billion for transportation. However, that money Often is Spread out over avariety of local agencies, and coordinating resources among transportation providers is a major stumbling block in rural tm.nsportation. U.S.Department of Agriculture, Reconnecting Rural America: Report on Rural lnfercify Regional Transportation (Washington DC: U.S.Government Printing Office, July 1989), p. 2.
76 Conmul~ty Transportation Association of Americ~ A Profile of the Sec[ion 18 program (was~to~ DC: 19~), P. 4.
77 Due et ~1,, op. ~lt,, fwtnote 52, p. 85. [n a 1984 Smey, tie majofi~ of fo~er interci~ bus ticket agents in Iowa recaltcd that tb.KXqUarterS
of their passengers traveled less than 100 miles, usually within the State.76 Community T~portation Association of Americ% op. cit., foo~ote 76> P 4.
Package express service, which delivers large,perishable, or other special cargo, can generatesignificant revenue for the bus company.
cies; some may also receive funds from theU.S. Department of Health and HumanServices to provide transportation for certaindisadvantaged individuals.75
Over one-quarter of all rural transit agenciesoperate in more than one county, their vehiclesoften traveling long distances over several coun-ties on individual trips.76 A number of these busestravel distances similar to those of the averagerural freed-route bus trip (estimated at 125 miles),making some rural transit operations suitablesurrogates for discontinued bus service .77 Personswho use wheeled mobility aids make up 7 percentof all riders of Section 18 systems; 39 percent ofall passengers are over 65.78 Many vehiclesoperated by FTA-supported agencies are lift-equipped, enabling passengers with mobilitydisabilities to travel more easily.

Over-the-Road Bus Industry and Accessible Service 67
1991 Amendments to Section 18Section 18 was amended by the Intermodal
Surface Transportation Efficiency Act of 1991(ISTEA),79 which added Subsection (i) to encour-age the further involvement of the OTRB industryin serving rural areas. Section 18(i) calls for eachState to spend no less than a fixed percent of itsapportionment for that purpose, unless the Gover-nor certifies that the State’s intercity bus needs areadequately met.80
●
●
Section 18(i) provides funds to support a setof national objectives that: 1) connect nonurban-ized areas to the larger regional or nationalsystem of intercity bus service; 2) meet theintercity travel needs of residents of nonur-banized areas; and 3) improve the infrastruc-ture of the fixed-route network.Eligible activities for funding under Section18(i) include planning and marketing, capi-tal grants for shelters, joint-use stops anddepots, operating grants through purchase-of-services agreements, user-side subsidies anddemonstration projects, and coordination ofrural connections between small transit op-erations and fixed-route carriers .81 FTA draftguidance specifies that capital assistancemay be used to purchase vehicles or vehicle-related equipment such as wheelchair liftsfor use in intercity service. For vehicle-related equipment required by the ADA, theFederal share is 90 percent of its incrementalcost. For purposes of Section 18, charter and
sightseeing services are not eligible for FTAassistance; commuter service is not includedin the definition of intercity service, butpackage express is.
In connection with its June 1992 report on theintercity bus industry, the U.S. General Account-ing Office (GAO) identified 20 States withintercity bus service programs ranging fromfinancial support for individual bus routes totoll-free telephone numbers for route and sched-ule information.82 Seventeen of these States useFederal funds, 14 also use State or local gover-nment funds, and 3 use only funds generated withinthe State.83 While 30 States have no programs forsupporting fixed-route service, 43 States indi-cated to GAO that they expect to use the Section18(i) set-aside moneys for improvement of inter-city bus transportation.
Rural Connector ProgramsAs major freed-route carriers dropped rural
stops from their routes, community leaders andindustry sought ways to provide transportation topotential riders in isolated areas. In 1987, Grey-hound, with the cooperation of the CommunityTransportation Association of America (CTAA)and FTA, sought to link existing intercity routeswith public providers of rural transit by establish-ing the Rural Connector Program (RCP).84 As ofDecember 1991, 73 transit agencies serving over850 communities in 20 States were participatingin RCP.85 Local transit systems took passengers
79 public Law 102-240.
go Five percent in fiscal yew 1992, 10 percent in fiscal year 1993, and 15 percent in fiscal year 1994 and thereafter. The fiscal Yc~ 1992appropriation for Section 18 activities was $66.13 millio% the fiscal year 1993 appropriation is $90.83 million.
SI The IIUMimUm Federa sh~e is 80 percent of capital expenses and 50 pWCCIM Of Operating costs.
13Z U s, General Accounting Office, Op. Cit., footnote 56, PP. 3W1
83 Fouflwn of fie 20 States provide ope~ting subsidies, typically designed to m~nt~n pub[ic ~~po~tion services forrurld ad Small tOWn
residents. Six have vehicle programs whereby State-owned buses are leased to private operators to provide intercity bus service. Five offerassistance for construction or remodeling of terminal facilities, particularly for intermodal transportation. Ten provide other types of rmistancesuch as promotional materials, maps, signage, passenger sheltem, and tax credits on fuel expenditures.
84 Greyhound Lines invested approx~ately $5M,000 in RcP, with CTAA contributing $200,~. cTAA’s cost.~ were offset by ag~t from
ITA. U.S. Department of Transportation, Intercity Bus Feeder Project Program Analysis: FinaZ Report (Washington, DC: September 1990),p. S-13.
85 U.S. General Accounting Office, op. cit., footnote 56, p. 4.
68 0ver-the-Road Bus Access
to and from intercity bus stops and acted as ticketagents for Greyhound, selling intercity bus ticketsalong with the regular transit service fee. Between1987 and the beginning of the Greyhound strikein 1990, the program allowed Greyhound to add941 points to its fixed-route service.86 The strikeand the company’s subsequent bankruptcy filing,however, placed the program on hold in all but afew communities.
The greatest concern surrounding RCP was thelack of ridership.87 After almost 2 years of
operation, the program had generated 2,744 totaltrips, with average ridership for individual transitagencies ranging from O to 64 trips monthly .88Local operators offered the following reasons forthe program’s inability to attract passengers: lackof advertising funds made marketing difficult;Greyhound marketing materials were ill-suited tosmall community needs; and intercity coachesoften arrived during hours not covered by localproviders. In addition, many rural transit opera-tors serve primarily human service agency clients,and have limited abilities to serve the generalpublic. 89
Another reason for the program’s low ridershipwas that Greyhound was unable to serve a portionof the Section 18 operators’ clientele—individuals with disabilities, In fact, Minnesota’sState Department of Transportation declared thatit would not support the participation of itsSection 18 operators in RCP in view of theinaccessibility of Greyhound’s OTRBS.90
OTRB ACCESSIBILITY PRIOR TO THEAMERICANS WITH DISABILITIES ACT
Legislative Precedents, 1970 to 1990Twenty years of legislation, rulemaking, and
court decisions involving access to publiclyfunded transportation preceded the 1990 enact-ment of the ADA.91 Milestones during that timeincluded:
●
●
●
In 1970, the Urban Mass TransportationAssistance Act established as national pol-icy that individuals with disabilities haveequal right of access to publicly assistedmass transportation facilities and services,and that planning and design of such facili-ties and services should assure that right. Itauthorized the use of up to 3.5 percent oftotal mass transit appropriations for imp-roved access. But suits brought by individ-uals with disabilities claiming that publictransit authorities must now purchase acces-sible vehicles were dismissed by the courts.In 1973, Section 504 of the RehabilitationAct became law, stating that: “No otherwisequalified handicapped individual . . . shall,solely by reason of his handicap, be ex-cluded from the participation in, be deniedthe benefits of, or be subjected to discrimina-tion under any program or activity receivingFederal financial assistance. ”92
In 1976, the Urban Mass TransportationAdministration (UMTA, now FTA) of DOTadopted regulations requiring public transit
$6 Ec050me~cs, IIIC.$ op. cit., foot(lotc 16, P. 19
87 ~ 1987, he s~te of M1c~gm fitituted i~ Om comector pro~~ wi~ ~A suppofl, provid~g f~ds LO IOCd tsansit agencies tO conduct
the service. By the spring of 1991, Michigan’s RCP had attracted more ndership than Greyhound’s national version. Once ITA funding ended,however, even these ridership levels could not justify continuance of the program, which continued to lose money.
88 us, Dep~ent of Transportation, op. cit., footnote 84, p. s-1 1.
8!) Isaacs, op. cit., foomote 59.
90 David Rap~el, ~xecutlve dfiector, Comm@ly T’r~pofiation Association of Americ% pe~o~ comrm.micatlon, July 18, 1991; ~d
Randy Isaacs, Isaacs & Associates, personal communication, Oct. 6, 1992.
~1 The following materd is based on Paul Stephen Dempsey, ‘‘The Civil Rights of the Handicapped in Transportation: The Americans WithDisabilities Act and Related Legislation, ’ Transportation Law Journal, vol. 19, No. 2, 1991, pp. 314-317,
w public hw 93.112, approved ScpI. 26, 1973, 29 USC 794.

.
Over-the-Road Bus Industry and Accessible Service I 69
agencies to make special efforts to accom-modate individuals with disabilities, butwithout indicating how that should be done.Some agencies responded by purchasingLift-equipped buses and others establisheddial-a-ride or paratransit services.93
In 1978, the then-Department of Health,Education, and Welfare issued lead agencyguidelines requiring that individuals withdisabilities be “mainstreamed’ into Federalprograms. Retrofitting of buses and subwaysystems was required, with the provision ofspecialized services allowed to supplementor substitute for accessibility. In 1979, UMTAissued rules requiring that all new fixed-route buses be made accessible to individu-als with disabilities, including those usingwheelchairs. The rule required that 50 per-cent of peak-hour buses be accessible within3 years.In 1981, however, the courts held that suchspecific requirements were beyond the scopeof DOT authority. Congress then enacted theSurface Transportation Assistance Act (STA)of 1982, with provisions requiring DOT toestablish minimum service criteria for indi-viduls with disabilities, but requiring nei-ther equal access nor comparable service.In 1986, UMTA issued final rules pursuantto the STA, giving transit agencies threeoptions: installing lifts on buses, establish-ing a paratransit system, or establishing amixed system of accessible buses and para-transit. In rulings on suits brought against themixed system approach, the courts held thatmixed systems were legal since no right forequal access existed at that time, eitherlegislatively or constitutionally.
● In 1990, however, equal access became thelaw with passage of the Americans withDisabilities Act, which for the first timeaddressed private entities providing publictransportation.
I Current Status of Accessible ServicePrior to passage of the ADA, the statutes,
regulations, and court decisions noted aboverequired federally assisted public transit systemsto provide some accessible transit buses and vans,and by 1990 considerable progress had beenmade. However, examples of accessible OTRBswere few. The first lift-equipped OTRBs ap-peared in 1985 in Canada under government-sponsored demonstration programs. In 1986,Massachusetts initiated its own program provid-ing publicly financed, lift-equipped OTRBs to anumber of private operators within the State forfreed-route, commuter, and other services, In1987, two public transit agencies, the DenverRegional Transportation District and the GoldenGate Bridge, Highway and Transportation Dis-trict of San Rafael, California, began operating atotal of 39 lift-equipped OTRBs. (See chapter 3for a discussion of the Denver RTD project.)
Privately Operated Service
As of late-1992, OTA had identified 26 busoperators nationwide who ran some 350 lift-equipped OTRBs. At that time, these 26, plusother operators without lift-equipped buses, hadan additional 100 accessible buses on order. Ofthe 26 bus operators, 7 are public transit authori-ties. The remaining 19 are private companies, but,with two exceptions, they operate their accessible
93 pMatrmSit, ~lsO fomcrly ~efemed t. ~~ di~.a-ride, is ~~~actcrimd by flexjb]e routes and schedules, curb-to-curb or door-to-door pickup
and dropoff points, requested in advance by a user eligible for the service. Under the DOT Interim Regulations (issued pursuant to Sec.306(a)(2)(A) of the ADA), paratransit “. means comparable transportation service required by the ADA for individuals with disabilities whoare unable to use fixed-route transportation systems, 56 Federal Register 45624 (Sept. 6, 1991).

70 0ver-the-Road Bus Access
Greyhound cares about our customers If you wouldlike assistance while traveling because of a disability).please ask any Greyhound employee for assistance.
.
En Greyhound. m.~m es su mamcnte mwxmmleSI nemsita ayuda debkkr a algunsr MC-fWIM. dicIte aswmcur de cwfquier ctnplcak) dCGrAluu&. ,“**
A few travel agents and tour operators havepersons with disabilities as their primary clientbase.96 Travel agents and tour operators specializ-ing in travel for individuals with disabilities claimthat arranging accessible motorcoach tours in theUnited States is next to impossible, although afew small bus companies may have accessiblevehicles for highly localized tours, and some tourdestinations are thoroughly accessible, most nota-bly Disney World. (See chapter 3 for a discussionof the charter and tour market for individuals withdisabilities.)
A sign at a Greyhound terminal in February 1993indicates the company’s willingness to serve personswith disabilities.
OTRBs under contract to public bodies.94 (One ofthe exceptions is a tour operator whose singlelift-equipped OTRB was purchased and operateswithout public financial assistance. See box 2-G.)Fewer than 5 of the 26 operators are principallyproviders of traditional freed-route service; theothers provide essentially commuter, airport andspecial services, and charter and tour services.
Approximately 40 companies list themselvesin the 1992 Motorcoach Marketer as providers ofaccessible tours to persons with disabilities.However, OTA has been able to confirm only sixof these as having lift-equipped OTRBs.95 Therest provide accessible service with minibuses,vans, school buses, and other vehicles.
PRESENT DOT REGULATIONSDOT regulations require privately operated
OTRBs to provide handrails, stanchions, in-creased lighting, slip-resistant flooring, contrast-ing edge surfaces, and a door width of 30 incheswhere possible and in no cases less than 27inches. The ADA also called on the Secretary ofTransportation to issue interim regulations 1 yearafter enactment, so that each private entity usingan OTRB provides access for persons withdisabilities .97 These regulations could not requirestructural changes in OTRBs or the purchase ofboarding assistance devices, and remain effectiveuntil supplanted by the Secretary’s final regula-tions.98
The DOT interim regulations require privateentities operating OTRBs to assist individualswith disabilities in boarding and disembarking,
~ ~ ~~tion t. the private bus companies participating in the Massachusetts demonstratio~ and the two public agencies, the DenverRegional Transportation District and Golden Gate, the following private operators provide accessible OTRB semice, all under contract to public
Laidlaw Transit, Antelope Bus Co., Inc., Gray Line Tours, Goodall’s Charter Bus Service, Inc., All-West Coach Lines,agencies: California—Amtravel; Comecticut-Post Road Stages; and New York-Central New York Coach Lines, which owns a lift-equipped OTRB but has neveroperated it. A public transit authority operating its own accessible OTRBS is Dallas Area Rapid Transit. Houston MefropoMa.nTransit Authorityordered 40 accessible OTRBS in early 1992. This list may not be all-inclusive.
95 Brush HiU, Central New York Coach Lines, Goodall’s Charter Bus Service, Inc., H&L Bloom, Inc., Post Road Stig% md peter pa.
96 *$A &avel agency i5 a ~e~l mem&[ who ,@ls &avel to me co~umer. A tour operator is a Wholeder Who puts tours together, then Se~S
them to a travel agency. Many travel agencies are also tour operators.” Helen Hecker, Directory of Travel Agencies for the Disabled(M.ncouver, WA: Twin Peaks Press, 1991), p. 2. Some foreign travelers with disabilities who are interested in touring the United States bymotorcoach assume accessible coaches are available, and foreign travel agents making inquiries on their behalf are often astounded to fmdotherwise. Yvonne Nau, Nautilus Tours, Inc., Tarzana, CA, personal communication, Jan. 28, 1992.
97 fiblicly oWmt~ Oms (orpfivately o~ed Oms operated~der con~ct to apubfic e@r) must meet all of the service requirements
applying to public entities, and all of the vehicle accessibility requirements that apply to transit buses under Part 38 of DOT’s regulations.
9856 Federal Register 45624 (Sept. 6, 1991).
Over-the-Road Bus Industry and Accessible Service I 71
Box 2-G—An Accessible Tour Bus: Evergreen Travel Service, Inc.
Evergreen Travel Service, Inc., of Lynnwood, Washington, has been operating tours since 1960. After 20years of conducting tours all over the world for persons with disabilities, proprietors Betty Hoffman and her sonJack decided they needed their own bus. The Hoffmans bought a used bus, equipped it with a Crow River lift,rebuilt the restroom to make it accessible, and installed 16 tie-down positions. Its current configurationaccommodates 12 tie-downs. The Crow River is an external lift, takes up no baggage space, and is located in frontof the rear wheels and immediately in front of the restroom. The restroom is equipped with a 40-inch-wide doorfacing the aisle.
Jack Hoffman says the bus was used for only 1 year before the insurer discovered it was being used totransport a number of passengers with disabilities and raised the insurance rates to $3,000 per month. Hoffmanclaims he was told he could pay normal rates only if he were to tear out the lift. Instead, he parked the bus andleft it unused for 7 years. Meanwhile, he unsuccessfully tried to secure coverage through the State of Washingtonhigh-risk pool. He was later placed in a high-risk pool in San Francisco where he could have obtained coveragefor $900 per month, but that figure was not economically feasible. Only in early 1992 was the Evergreen bus putback into operation, after being insured at $525 per month through a pooling arrangement with another eight busesoperated by a family company in the Seattle area. Hoffman believes that rate to be about $125 per month abovethe going rate for OTRBs in Washington State.l
In more than 30 years, Evergreen has conducted tours to more than 100 countries for individuals with avariety of mobility and sensory disabilities. In some countries, accessible coaches can be arranged easily. Britain,Scandinavia, several other countries in Western Europe, and Israel are favorite destinations where accessibilitypresents few major problems. In other countries, including Tibet, Nepal, India, and Burma, accessible buses donot yet exist, nor are facilities accessible. In such cases, lifting and carrying are the only options. Hoffman hasconducted six tours to China and in 1991 took a group of 23 individuals with disabilities there. He tells the storyof getting persons who use wheeled mobility aids or scooters to the top of the Great Wall of China via routesunknown to his Chinese guides, using ramps initially built for supply horses and encountering only five stepsalong the way.
1 It is I-Ioffm’s belief that insuranc e company concerns are misplaced. Most suits brought by individuals withdisabilities are dismissed, he claims, with the court finding that they are already disabled, and proof of further disability as aresult of an accident di.fflcult to establish. Suits brought by formerly able-bodied people disabled in accidents, however, arefrequently found in favor of the passengev it is in these cases that insurance companies end up paying claims. Hoffman believesthat insurance companies should not focus on a company’s ability to transport disabled passengers but on its safety record.
including moving to and from the bus seat. ment, size permitting. If this is not possible, theyCarrying is a disfavored method of assistance, butsince the purchase of boarding assistance devicescannot be required, there may be times whencarrying is the only available means of access. Insuch cases, it is the responsibility of the entity toensure that personnel providing boarding assist-ance, especially by carrying or direct physical aid,are trained to do so safely and appropriately.
Wheelchairs and other mobility aids and assis-tive devices may be accommodated in the areasfor personal effects in the passenger compart-
are to be stored in the baggage compartment of thebus. At any stop, a person with a wheelchair orother assistive device would have the deviceloaded before other items at the same stop,although luggage already on the bus could not be“bumped” to accommodate the device.
The OTRB operator may require up to 48 hoursadvance notice, but only if boarding assistance isnecessary. “While advance notice requirementsare generally undesirable, this appears to be a casein which a needed accommodation may be able to
72 I Over-the-Road Bus Access
be provided successfully only if the transportationprovider knows in advance that some extrastaffing is needed to accomplish it. ’ ’99 If advancenotice is not provided, the entity still has theobligation to offer boarding assistance, if it can bedone with available staff.
One year after submission of the OTA study,DOT must issue final regulations specifying thelevel of service required on accessible intercitycoaches for individuals with disabilities. These
regulations will be enforced by a governmentalframework divided among many different agen-cies. While modes such as air and rail have entireadministrations within DOT geared to their over-sight, private OTRB companies find regulatoryauthority splintered not only within DOT butthroughout the State and Federal Governments(see app. B.) Within this complex regulatoryenvironment, DOT must determine how best toadminister and enforce accessibility regulations.
9956 Federal Register 45756 (Sept. 6, 1991).