over central north carolina - weather
TRANSCRIPT
an El Niño episode when the
3-month average sea-surface
temperature departure ex-
ceeds 0.5 C in the east-
central equatorial Pacific.
While this may not seem like
a very big difference in tem-
perature, the energy that has
to go into raising the temper-
ature of a basin of water as
large as the Pacific Ocean is
quite substantial. There is
also such a thing as “ENSO-
neutral,” which refers to
those periods when neither
El Niño nor La Niña is pre-
sent. During these periods,
the ocean temperatures,
tropical rainfall patterns, and
atmospheric winds over the
equatorial Pacific Ocean are
near the long-term average.
So, how do El Niño and La
Niña affect the Atlantic hurri-
cane season? An easy way to
think of it would be that El
Niño results in less Tropical
Cyclone formation and La
Niña results in more Tropical
Cylones. During El Niño
years there are more hurri-
canes in the Pacific and less in
the Atlantic. This is largely
due to the lower (higher)
vertical wind shear over the
Pacific (Atlantic). Wind shear
is bad for hurricanes and thus
lower shear is more favorable
for Tropical Cyclone for-
mation. The opposite follows
for La Niña years. Currently,
we are in an El Niño phase,
(continued on page 7)
Sometimes, it is hard to link
planetary scale phenomenon,
like El Niño, to smaller scale
weather features, but the link
between tropical cyclone
activity in the Atlantic Basin
and El Niño is relatively clear.
El Niño and La Niña repre-
sent the warm and cool phas-
es of the El Niño/Southern
Oscillation (ENSO) cycle,
respectively. The ENSO cycle
refers to the coherent and
sometimes very strong year-
to-year variations in sea-
surface temperatures, con-
vective rainfall, surface air
pressure, and atmospheric
circulation that occur across
the equatorial Pacific Ocean.
El Niño refers to the periodic
warming (warm phase) in sea-
surface temperatures across
the central and east-central
equatorial Pacific, while La
Niña refers to the cold phase.
Both are naturally occurring
phenomena that result from
interactions between the
ocean surface and the atmos-
phere over the tropical Pacif-
ic. Changes in the ocean sur-
face temperatures affect trop-
ical rainfall patterns and at-
mospheric winds over the
Pacific Ocean, which in turn
impact the ocean tempera-
tures and currents and can
cause changes in the weather
patterns around the world.
Basically, El Niño shifts the
global pattern and places
once favorable for tropical
cylone formation are no long-
er as favorable. NOAA’s Cli-
mate Prediction Center
(CPC) declares the onset of
El Niño Putting Breaks on 2015 Atlantic Hurricane Season...so far.
I N S I D E T H I S
I S S U E :
Hurricane
Preparedness
2
Raleigh Fore-
casters Partici-
pate in Forecast
Experiment
3
NWS Raleigh
Supports EM at
Rolling Stones
Concert
4
RDU Completes
StormReady
Certification
5
NWS Raleigh
Forecasters
Participate in
Broadcast
Conference
6
S U M M E R 2 0 1 5 V O L U M E 1 2 , I S S U E 2
Changing Skies Over Central North Carolina
N O A A ’ S N A T I O N A L W E A T H E R S E R V I C E R A L E I G H , N C
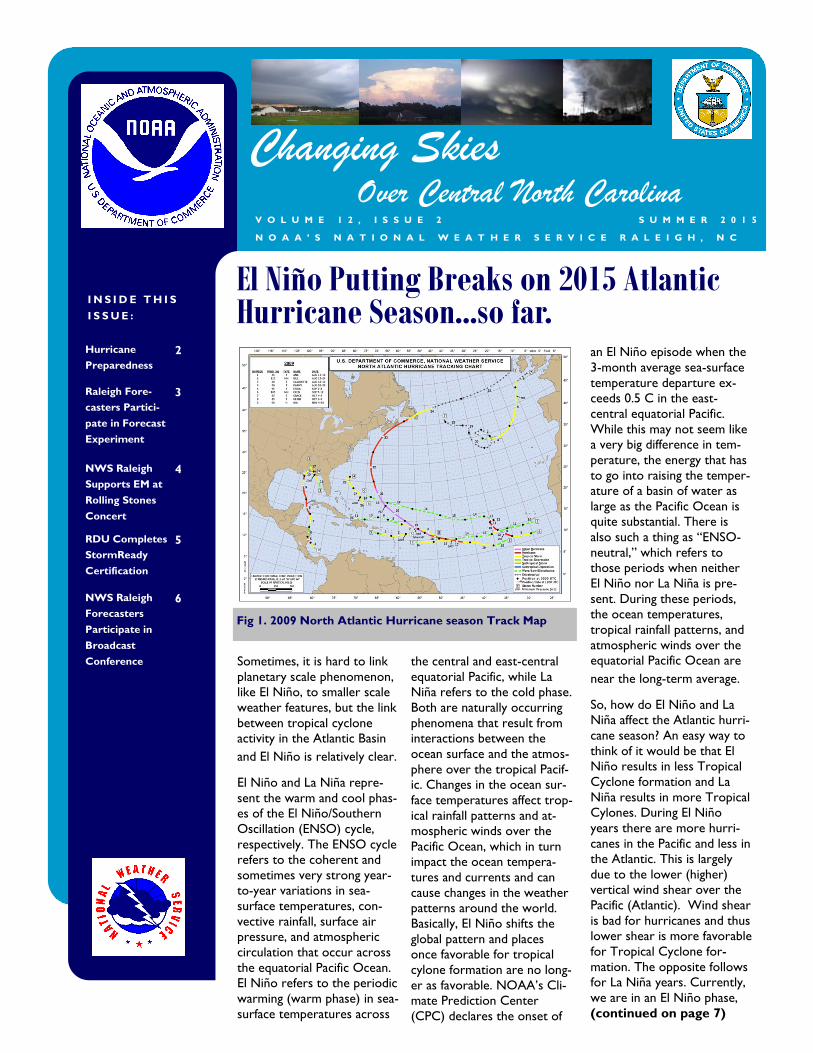
Fig 1. 2009 North Atlantic Hurricane season Track Map

P A G E 2
NC Emergency Management Urges Preparedness
During Hurricane Season
North Carolina has seen its
share of damaging hurri-
canes. Since 1954, 27 hurri-
canes or tropical storms
have had lasting impacts on
the state. According to the
National Weather Service, a
tropical storm or hurricane
will make direct landfall on
North Carolina’s coast
about once every two years.
“No part of our state is
immune from tropical
storms and hurricanes,” said
Sprayberry. “The heavy rain,
damaging winds and flooding
brought by hurricanes can
devastate a community.
Many residents remember
the destruction Hurricanes
Hugo, Fran, Floyd, Frances,
Ivan and Irene caused; pow-
er outages, floods, land-
slides, toppled trees and
wind destruction.”
Hurricane Arthur, a Cate-
gory 1 storm that struck
July 3, 2014, made history as
the earliest hurricane to
make landfall in North Caro-
lina since 1901.
Be Ready
Take steps to be ready long
before the first storm warn-
ings are issued. Make an
emergency plan, then prac-
tice it with your family.
Write down the evacuation
routes you may need. Build –
or update- an emergency
supply kit and have it ready
to go with enough non-
perishable food and bottled
water (1 gallon per person
per day) to last three to sev-
en days.
Kits also should include:
Copies of insurance pa-
pers and identification
sealed in a watertight
plastic bag
First-aid kit
Weather radio and
batteries
Supply of prescription
medicines
Bedding
Changes of clothes
Hygiene items such as
toothbrush, toothpaste,
soap and deodorant
C H A N G I N G S K I E S
Summer in North Carolina
is famous for beach trips,
fresh local produce and lazy
days. It’s a great time to kick
back and relax. In North
Carolina, summer relaxing
goes hand-in-hand with hur-
ricane preparation.
“North Carolina is known
for its pristine beaches and
relaxing atmosphere yet it is
a lightning rod for tropical
storms,” said Mike Spray-
berry, North Carolina
Emergency Management
Director. “As we saw in
early May with Tropical
Storm Ana and last year
with Hurricane Arthur,
tropical storms and hurri-
canes can occur any time.
While most storms tend to
strike North Carolina be-
tween August and October,
it’s never too early to be
ready.”
Emergency Preparedness Kit (NCDPS-NCEM)
“As we saw in ear-
ly May with Tropi-
cal Storm Ana and
last year with Hur-
ricane Arthur,
tropical storms
and hurricanes can
occur any time.
While most storms
tend to strike
North Carolina
between August
and October, it’s
never too early to
be ready.”

P A G E 3 V O L U M E 1 2 , I S S U E 2
Cash or checkbook
Pet supplies including
food, water, leashes, bed-
ding, muzzle and vaccina-
tion records
Stay informed during severe
weather using a battery-
powered radio. Monitor the
weather reports and heed the
warnings of local and state
officials. Evacuate quickly
when told to do so. And pay
close attention to flooded or
washed-out roads.
Also, review and update your
homeowners' or renters’ in-
surance policies to make sure
they include coverage for acci-
dental damage, natural disas-
ters and, if necessary, flood
insurance.
Sprayberry said preparing for
emergencies before they strike
can make the recovery process
easier and quicker.
The free ReadyNC mobile app
provides real-time information
on traffic, weather, opened
shelters and riverine flood
levels. It also provides basic
instructions on making emer-
gency plans, supply kits and
what to do before, during and
after different emergencies. Go
to
http://www.ReadyNC.org
for more information and de-
tails on how to develop an
emergency supplies kit and
specific details about preparing
your home for a hurricane.
-Laura Leonard
A great deal of important
meteorological research is
done every day around the
world. The task of linking
researchers and operational
meteorologists is often ac-
complished through some-
thing called “research-to-
operations”, abbreviated
R2O. In R2O, various tests
and experiments are designed
and conducted in which opera-
tional forecasters try out the
latest and greatest discoveries
and innovations from the re-
search community, to assess
their effectiveness and viability
in an operational environment.
Over the last few years, sever-
al forecasters at NWS Raleigh
have been fortunate to have
been a part of a crucial R2O-
focused laboratory called the
Hazardous Weather Testbed,
or HWT. The HWT is con-
ducted each spring and sum-
mer at the National Severe
Storms Laboratory (NSSL) in
Norman, OK, and comprises
several different experiments
that focus on hazardous
weather needs. Forecasters
from around the world are
brought into the HWT every
year to test out new ideas and
techniques.
This past May, WFO Raleigh
Senior Forecaster Gail Hart-
field had the opportunity to
participate in the Spring
(continued on page 8)
NWS Raleigh Forecasters Test New Forecast Techniques in Oklahoma
Hazardous Weather Testbed in Norman, OK

P A G E 4
NWS Raleigh Provides Decision Support at Rolling Stones Concert
NWS Raleigh recently pro-
vided onsite decision support
to North Carolina State Uni-
versity Emergency Manage-
ment during the July 1st Roll-
ing Stones Concert at NC
State’s Raleigh campus. Ra-
leigh forecaster Katie De-
deaux and Hollings Scholar
Raelene Campbell were on
site in the stadium’s fourth
floor incident command post.
The team briefed emergency
officials as severe thunder-
storms moved in from the
west, potentially threatening
the more than 40,000 at-
tendees at this outdoor
event. Fortunately, the
storms weakened before
reaching the stadium and the
concert went on without
weather-related delays.
Katie and Raelene learned
several best practices from
C H A N G I N G S K I E S
this event
to improve
on-site
briefing
services.
The team
discovered
mobile in-
ternet can
get quickly
bogged
down when
40,000 peo-
ple in a
confined
area are
using their
smart
phones and
overwhelm-
ing the data
flow pro-
vided by
nearby cell
phone tow-
ers. While
there was
just enough bandwidth availa-
ble to maintain timely radar
updates, they quickly adjusted
their data strategy and re-
frained from downloading
nonessential weather prod-
ucts.
Another best practice was
the collaboration that took
place not only between the
onsite NWS staff and the
emergency officials, but also
between the onsite NWS
staff and the staff back at the
forecast office. Katie and
Raelene frequently conferred
by phone with the evening
shift staff about pending thun-
derstorm warning decisions
and storm timing. This collab-
oration was especially im-
portant given that severe
thunderstorm warnings were
in effect just a short distance
west of the concert venue.
“In today’s world, anyone can
pull out their smart phone or
tablet radar app and make a
reasonable assessment about
the thunderstorm potential
at any given location; howev-
er, nothing beats having
NWS expertise at your side
when making weather-related
decisions that can affect the
safety of tens of thousands of
people,” said WCM Nick
Petro, NWS Raleigh. “That’s
what onsite decision support
services provided to our lo-
cal, state, and federal govern-
ment partners is all about,”
Petro said.
WFO Raleigh is housed on
NC State’s Centennial Cam-
pus. WFO Raleigh and NC
State have a great relation-
ship. In addition to support-
ing the university emergency
managers, this decision sup-
port event provided a great
learning opportunity for
WFO Raleigh’s Hollings
Scholar Raelene Campbell.
Raelene, stationed at Raleigh
for the summer and working
on a North Carolina Torna-
do Climatology project, had
the opportunity to experi-
ence first-hand one of the
key components of the NWS
Weather-Ready Nation initia-
tive.
WFO Raleigh has a growing
decision support program
that includes weekly impact
weather briefings, high-
impact weather webinars and
email briefings, remote
weather support via the
state’s 800 Megahertz radio
system, a robust social media
program, and on-site decision
support services for high-
impact events and incidents.
-Nick Petro
Forecaster Katie Dedeaux watching
storms approaching Carter Finley Stadium
“The team briefed
emergency officials
as severe thunder-
storms moved in
from the west, po-
tentially threatening
the more than
40,000 attendees at
this outdoor event.”

P A G E 5 V O L U M E 1 2 , I S S U E 2
Nearly 90% of all presidentially
declared disasters are weather-
related, leading to around 500
deaths per year and nearly $14
billion in damage. To help Amer-
icans guard against the ravages
of severe weather, NOAA’s
National Weather Service
(NWS) designed the Storm-
Ready program. StormReady
helps arm America’s communi-
ties with the communication and
safety skills they need to save
lives and protect property.
Many laws and regulations exist
to help local emergency manag-
ers deal with hazardous material
spills, search and rescue opera-
tions, medical crises, etc., but
there are few guidelines dealing
with the specifics of hazardous
weather response. The NWS
recognized this need and de-
signed StormReady to help com-
munities of all kinds – towns,
cities, counties, Tribal Nations,
universities, airports, and indus-
trial complexes – implement
procedures to reduce the po-
tential for disastrous weather-
related consequences. To be
recognized as StormReady, com-
munities must meet guidelines
established by the NWS in part-
nership with federal, state, and
local emergency management
professionals. More specifically,
to be recognized as Storm-
Ready, communities must:
Incorporate severe weather
threats into their hazard
mitigation and emergency
response plans.
Establish a 24-hour Warning
Point and Emergency Oper-
ations Center.
Establish multiple ways to
receive severe weather
warnings and forecasts and
to alert the public.
Create a system that moni-
tors weather conditions
locally.
Promote the importance of
public readiness through
community seminars, severe
weather spotter training
and by conducting emergen-
cy exercises.
In early July, NWS Raleigh had
the pleasure and honor of rec-
ognizing Raleigh-Durham Inter-
national Airport (RDU) as its
newest StormReady Communi-
ty. The emergency management
and safety personnel at RDU not
only meet the six primary guide-
lines to become StormReady,
but they also take the time to
exercise their comprehensive
hazardous weather response
plan by conducting table top
exercises and live drills, and
NWS Raleigh representatives
are often invited to participate in
these drills. Communicating and
collaborating with NWS Raleigh
is a key component of RDU’s
severe weather readiness and
awareness program. “I am al-
ways impressed by RDU’s readi-
ness and understanding of what
they need to do to keep the
folks who work at and travel
through RDU safe during severe
weather episodes,” said Nick
Petro, Warning Coordination
Meteorologist at NWS Raleigh.
“RDU takes severe weather
seriously, and their proactive
and protective actions during
recent severe weather drills and
live severe weather episodes
have demonstrated that RDU is
StormReady,” said Petro.
For more information about
StormReady, please visit http://
www.nws.noaa.gov/stormready.
-Nick Petro
When Seconds Count, StormReady Communities are Prepared
Raleigh-Durham International Airport officials re-
ceiving their StormReady recognition sign. From
left: Michael Landguth, RDU President and CEO;
Nick Petro, WCM NWS Raleigh, NC; Don Atkin-
son, RDU Airport Operations Officer; Duane Le-
gan, RDU Vice President of Airport Operations;
John Graves, RDU Director of Operations; and
Richard (Dickie) Thompson, RDU Board Chair-
man.
P A G E 6
NWS Raleigh Participates in Local Broadcast Meteorology Conference
whose program chairpersons
included local TV meteorolo-
gist and producer Nate John-
son.
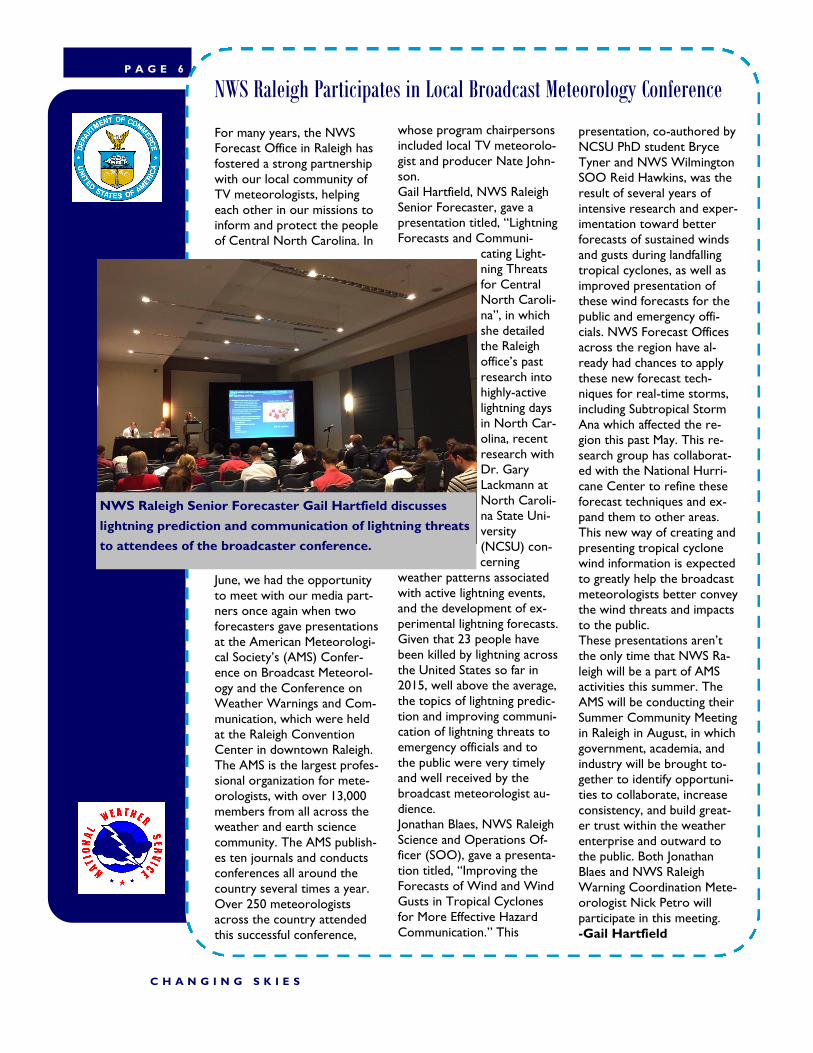
Gail Hartfield, NWS Raleigh
Senior Forecaster, gave a
presentation titled, “Lightning
Forecasts and Communi-
cating Light-
ning Threats
for Central
North Caroli-
na”, in which
she detailed
the Raleigh
office’s past
research into
highly-active
lightning days
in North Car-
olina, recent
research with
Dr. Gary
Lackmann at
North Caroli-
na State Uni-
versity
(NCSU) con-
cerning
weather patterns associated
with active lightning events,
and the development of ex-
perimental lightning forecasts.
Given that 23 people have
been killed by lightning across
the United States so far in
2015, well above the average,
the topics of lightning predic-
tion and improving communi-
cation of lightning threats to
emergency officials and to
the public were very timely
and well received by the
broadcast meteorologist au-
dience.
Jonathan Blaes, NWS Raleigh
Science and Operations Of-
ficer (SOO), gave a presenta-
tion titled, “Improving the
Forecasts of Wind and Wind
Gusts in Tropical Cyclones
for More Effective Hazard
Communication.” This
presentation, co-authored by
NCSU PhD student Bryce
Tyner and NWS Wilmington
SOO Reid Hawkins, was the
result of several years of
intensive research and exper-
imentation toward better
forecasts of sustained winds
and gusts during landfalling
tropical cyclones, as well as
improved presentation of
these wind forecasts for the
public and emergency offi-
cials. NWS Forecast Offices
across the region have al-
ready had chances to apply
these new forecast tech-
niques for real-time storms,
including Subtropical Storm
Ana which affected the re-
gion this past May. This re-
search group has collaborat-
ed with the National Hurri-
cane Center to refine these
forecast techniques and ex-
pand them to other areas.
This new way of creating and
presenting tropical cyclone
wind information is expected
to greatly help the broadcast
meteorologists better convey
the wind threats and impacts
to the public.
These presentations aren’t
the only time that NWS Ra-
leigh will be a part of AMS
activities this summer. The
AMS will be conducting their
Summer Community Meeting
in Raleigh in August, in which
government, academia, and
industry will be brought to-
gether to identify opportuni-
ties to collaborate, increase
consistency, and build great-
er trust within the weather
enterprise and outward to
the public. Both Jonathan
Blaes and NWS Raleigh
Warning Coordination Mete-
orologist Nick Petro will
participate in this meeting.
-Gail Hartfield
C H A N G I N G S K I E S
For many years, the NWS
Forecast Office in Raleigh has
fostered a strong partnership
with our local community of
TV meteorologists, helping
each other in our missions to
inform and protect the people
of Central North Carolina. In
June, we had the opportunity
to meet with our media part-
ners once again when two
forecasters gave presentations
at the American Meteorologi-
cal Society’s (AMS) Confer-
ence on Broadcast Meteorol-
ogy and the Conference on
Weather Warnings and Com-
munication, which were held
at the Raleigh Convention
Center in downtown Raleigh.
The AMS is the largest profes-
sional organization for mete-
orologists, with over 13,000
members from all across the
weather and earth science
community. The AMS publish-
es ten journals and conducts
conferences all around the
country several times a year.
Over 250 meteorologists
across the country attended
this successful conference,
NWS Raleigh Senior Forecaster Gail Hartfield discusses
lightning prediction and communication of lightning threats
to attendees of the broadcaster conference.

P A G E 7 V O L U M E 1 2 , I S S U E 2
which is fairly easy to figure out
when looking at the number of
tropical cyclones that have de-
veloped this season. In the At-
lantic there have been 3 named
storms, all of which were tropi-
cal storms and one of which
(Ana) developed prior to the
start of the Atlantic Hurricane
season. In the Pacific, there have
been 7 named storms, 4 of
which were hurricanes. The
Climate Prediction Center’s
Oceanic Niño Index (ONI) also
confirms we are in an El Niño,
with gradually increasing SST
anomalies over the past several
3 month running averages. In
fact, the current 3 month run-
ning average is 0.9°C which is
almost twice the amount needed
to be considered an El Niño.
When the CPC released their
Atlantic hurricane season fore-
cast back in May, El Niño was
the main factor expected to
suppress Atlantic hurricane ac-
tivity. However, just because
less activity is expected in the
Atlantic, doesn’t mean we are
off the hook. One storm, such
as Hurricane Andrew in 1992,
can have a significant impact on
coastal and inland locations
along the East coast of the U.S.
and the Gulf of Mexico. NOAA
will issue an updated outlook for
the Atlantic hurricane season in
early August, just prior to the
historical peak of the season.
A quick comparison of the At-
lantic hurricane season from
2009 (the last time we had an El
Niño) and 2010 (La Niña) is a
good demonstration of how the
two impact the Tropical Atlantic
and Gulf of Mexico. Ironically
enough, the storm names for
this season (2015) are the same
as those from 2009 as they cycle
every 6 years. In 2009, there
were 11 tropical systems: 2 de-
pressions, 6 tropical storms, and
3 hurricanes. Figure 1 shows the
tracks of these systems. Contra-
rily, the 2010 season (La Niña)
was much more active, with 21
tropical systems: 2 depres-
sions, 7 tropical storms, and
12 hurricanes. That map is
shown in Figure 2.
While it is clear that El Niño
is having an effect on the num-
ber of tropical cyclones form-
ing in the Atlantic, it is im-
portant to remain vigilant be-
cause one storm hitting the
coast is more impactful than
15 storms that aren’t hitting
the coast. Now is the time to
make sure your hurricane
preparedness kits are up to
date and for your family to
make a hurricane plan so that
if one does threaten, you will
be ready.
-Kathleen Pelczynski and
NOAA Sources
Fig 2. 2010 North Atlantic Hurricane season Track Map
El Niño and Atlantic Hurricanes (continued from page 1)
El Niño / La Niña Snapshot
El Niño
At least 0.5°C Warmer
Waters in the Pacific
Ocean
Generally less Atlantic
Hurricanes
La Niña
At least 0.5°C Cooler
Waters in the Pacific
Ocean
Generally more Atlantic
Hurricanes
Current Status
3 month running average
of 0.9°C (El Niño)
1005 Capability Drive Suite 300 Centennial Campus Raleigh, NC 27606
Phone: 919-515-8209 Fax: 919-515-8213
NOAA’s National Weather Service
Raleigh, NC
NWS Raleigh Tests Forecast Techniques (continued from page 3)
periment. During this experi-
ment, Barrett and other visiting
forecasters worked with re-
search scientists to assess
emerging concepts and products
related to hydrology, to improve
the accuracy, timing, and speci-
ficity of flash flood watches and
warnings. Activities included
evaluating short-term forecast
tools such as improved precipita-
tion estimates and new comput-
er models which predict river
behavior, including river levels
and flooding. Participants also
explored the use of experi-
mental watch and warning prod-
ucts which convey the uncertain-
ty and magnitude of the flooding
threat.
-Gail Hartfield
threat-specific day-one and day-
two outlooks which focused spe-
cifically on tornado, damaging
wind, and large hail risks.
Also, WFO Raleigh Forecaster
Brandon Dunstan participated in
an HWT experiment which in-
vestigated various applications to
improve severe storm detection
and prediction. Products exam-
ined included the convective
initiation output (which predicts
the onset of storms as their par-
ent clouds are first forming, using
satellite data), the lightning jump
algorithm (which calculates rapid
increases in lightning activity
which may precede the onset of
severe weather), and a new
“ProbSevere” model, a radar
product which highlights storms
that show increasing strength, to
improve warning forecasters’
situational awareness.
Finally, WFO Raleigh Senior
Forecaster Barrett Smith partici-
pated in the “HWT-Hydro” Ex-
Forecast Experiment. During
this particular experiment, the
primary focus was to evaluate
numerous new weather fore-
cast models and use the out-
put to create enhanced one-
hour-long “mini-outlooks” for
the following 1-12 hours.
These types of detailed out-
looks are related to the
“warn-on-forecast” concept,
in which high-resolution mod-
els and other data are used to
create longer alerts for severe
storms; these mini-outlooks
are then adjusted as new ob-
servations come in. These can
be thought of as a bridge be-
tween a severe weather
watch and a severe weather
warning – on a longer time
scale and with less confidence
than a warning, but on a
shorter time scale and with
greater confidence than a
watch. Gail and her counter-
parts also used this model
output to create enhanced,