outsourcing and structural change. an application to a set ... · outsourcing and structural...
TRANSCRIPT

Outsourcing and Structural Change.
An application to a set of OECD countries∗
Sandro Montresor† Giuseppe Vittucci Marzetti‡
Abstract
The paper aims at bridging outsourcing and structural change
analysis in order to obtain more accurate insights on the actual extent
of the former and draw more reliable policy implications to deal with
its effects. Such a bridge is set at work by applying a “battery” of out-
sourcing measurements to some OECD countries over the ’80s and the
middle ’90s. On the one hand, standard results (e.g. the idiosyncratic
outsourcing patterns of the UK) are confirmed on a more systematic
and comparable basis. On the other hand, original results (e.g. the
low integration of business services into manufacturing of the former
socialist economies) are obtained by exploiting new available data.
Keywords: Outsourcing; Input-output; Vertical integration; Tertiarisa-
tion; Manufacturing.
JEL Classification: D230, D570, L160, L220, L240, L600, O140.
∗The two authors contributed equally to Sections 1 and 4. Section 2 is the work mainly
of Sandro Montresor. Section 3 is the work mainly of Giuseppe Vittucci Marzetti. The
authors are indebted to Malcolm Sawyer and to an anonymous referee for their comments
on an earlier version of the article. The authors gratefully acknowledge financial support by
the Autonomous Province of Trento (Italy), as the sponsor of, respectively, the OPENLOC
research project under the call for proposals “Major Projects 2006” (both of them), and a
post-doc 2006 scholarship (Giuseppe Vittucci Marzetti). The usual disclaimers apply.†Dpt. of Economics, University of Bologna, Italy, E-mail: [email protected]‡Dpt. of Economics, University of Trento, Italy, E-mail: [email protected]
1

“Outsourcing and offshoring. . . involve the vertical break-
up of previously integrated sectors, on the basis of su-
perior capabilities, leveraged across sectors in newly
emerging “industries” that cut across traditional clas-
sifications. Such transformations also suggest that we
may need to reconsider the boundaries of existing indus-
tries, which are actively redrawn as a result of the pro-
cess of vertical disintegration and reintegration. . .We
need a new empiricism, which defines industries in a
more dynamic way, transcending the traditional SIC
definitions, and focuses on the comparative analysis of
value chain instead.”
(Jacobides & Winter, 2005, p.410)
1 Introduction
Outsourcing is emerging as an extremely pervasive economic phenomenon
(e.g. Domberger, 1998; Spencer, 2005). Important implications have been
identified and debated about it in terms of: firms’ costs and profitability
(e.g. Gorg & Hanley, 2004); contractual relationships, technology and growth
patterns (e.g. Acemoglu et al., 2002; Naghavi & Ottaviano, 2005); international
fragmentation of production processes and cross-countries trade patterns (e.g.
Baldone et al., 2002; Kohler, 2004; Jones & Kierzkowski, 2001); upgrading of
global value-chains and development strategies (e.g. Gereffi, 2003; Humphrey
& Schmitz, 2002).
Less attention has been paid to its implications in terms of structural
change, that is in reconfiguring the sectoral structure of the economic systems.
In fact, since the seminal work by Momigliano & Siniscalco (1982), along
with other contributions in the ’80s (e.g. Stanback, 1979; Ginzberg & Vojta,
1981; McFetridge & Smith, 1988), few efforts have been devoted to this
issue. Mainly for decomposing aggregated growth patterns, rather than
investigating disaggregated patterns of change (e.g. Dietrich, 1999; McCarthy
& Anagnostou, 2004).
This could be due to at least three reasons. First of all, at a theoretical
2

level, outsourcing has been traditionally conceived as a switching from “make”
to “buy”, from the “firm” to the “market”, with no other structural change
implications but the emergence of market prices in place of internal prices.
Second, at a methodological level, Input-Output (IO) tables, the main tool
for structural change analysis, have been usually considered unsuitable for
investigating firm-specific processes, as they rely on establishment-specific
data. Third, at an empirical level, disaggregated sectoral and IO data to
measure the structural change implications of outsourcing have been missing
for long time.
As we have argued more extensively elsewhere (Montresor & Vittucci Mar-
zetti, 2006, 2007), these reasons are now less binding and thus allow further
research on the topic. Hence, after having recapitulated the main issues in
Section 2, in Section 3 we apply some “special” outsourcing measurements
at sectoral and sub-system level to a set of OECD countries .1 In so doing,
the paper aims at investigating to what extent these indicators can show
traces of outsourcing records in the structural analysis of the investigated
economies and how reliable these traces are. The paper concludes with some
final remarks and the policy implications of our findings (Section 4).
2 Outsourcing and structural change: research
issues
In the analysis of the structural change implications of outsourcing, the
researcher needs to deal with at least three kinds of issues: theoretical,
methodological and empirical. Let us briefly consider each of them in turn
(for a more extensive analysis see Montresor & Vittucci Marzetti, 2007).
2.1 The theoretical issue
From a theoretical point of view, outsourcing is usually conceived as a process
symmetric to vertical integration, since it reduces the “vertical scope” of the
firm (for a critical view of this perspective see, among the others, Becker &
Zirpoli, 2009).
3

However, such a theoretical account can be contrasted by looking at the
firm as an “open system” or an “extended enterprise” (e.g. McCarthy &
Anagnostou, 2004), by arguing that outsourcing makes its boundaries more
“permeable” to other organizations and market mechanisms (Jacobides &
Billinger, 2005).
Sticking to one or the other interpretation has different structural change
implications. According to the former, the fact that a certain manufacturing
firm outsources one of its production activities to an external supplier just
diminishes its economic contribution to manufacturing and, in case of business
service outsourcing (e.g. of janitorial services), that of manufacturing with
respect to services in the economic system: service outsourcing entails nothing
but a “tertiarisation” effect. On the contrary, according to the latter, the
same outsourcing operations entail a restructuring effect of manufacturing,
making it so to say more “transversal”. Following this last interpretation,
outsourcing is actually a particular kind of structural change, amounting
to an extension of manufacturing sectors into non-manufacturing ones (e.g.
Dietrich, 1999; McCarthy & Anagnostou, 2004). Accordingly, the theoretical
division between the analysis of outsourcing and that of structural change
can be misleading.
2.2 The methodological issue
In order to analyse the structural change implications of outsourcing, re-
searchers need data on intersectoral flows. Since IO tables are built up by
referring to deliveries of goods and services occurring between different estab-
lishments, rather than firms (or enterprises), and since many firms are in fact
multi-plant, this might constitute a serious obstacle (e.g. Woodrow Eckard,
1979; Postner, 1990).
However, the insensitivity of IO tables to outsourcing is seldom total and
rather depends on the specific circumstances. At most, the sensitivity is
quite high when, for instance, a certain establishment substitutes services
and/or intermediate inputs provided by an establishment of a different firm,
for those previously produced within the establishment itself. Or whenever
an establishment contracts-out ancillary activities, which were not counted
4

as products in national accounts before outsourcing.
If one deals with service outsourcing, as we mainly do in the present
paper, these two cases are probably the most frequent ones. On the one
hand, being neither storable nor transportable, services are embedded in
establishments rather than in firms. On the other hand, as also explicitly
recognized in the SNA93 (United Nations, 2006, par.6.87), even when they
entail deliveries between different establishments of a certain firm, it is not
always possible to identify and record them separately. Accordingly, also
the methodological obstacles to bridge the analysis of outsourcing with that
of structural change are not so prohibitive. Moreover, the relative analysis
will be the more accurate, the less diversified firms are in their constituting
establishments.2
2.3 The empirical issue
From an empirical point of view, the most straightforward way to capture
service outsourcing for structural change analysis is, of course, referring to
sectoral measurements (in the following, we will refer to an economic system
of n sectors, which is therefore the order of the relative intersectoral matrices).
For instance, a first indicator can be obtained by analyzing the changes
occurred over time in the transactions (at constant prices) of intermediate
business services (SERVi) made by the manufacturing firms of sector i per
unit of production (Qi), i.e. in the ratio SERVi/Qi.
A second related indicator is given by those changes occurred in the ratio
between the transactions of intermediate business services (SERVi) and the
value of wages and salaries of the same sector (LABRi), i.e. in the ratio
SERVi/LABRi (McFetridge & Smith, 1988).
Although with an important signaling power, however, both the indicators
require to assume some problematic hypotheses, and should therefore be used
with caveats (on this issue, see Montresor & Vittucci Marzetti, 2007).
Further signals emerge by considering that outsourcing can make standard
IO coefficients (Miller & Blair, 1985) – i.e. the elements of the matrix
A = Qq−1 – change by affecting intersectoral intermediate consumptions
(the Q matrix), total sectoral production (the diagonalised vector q) and
5

sectoral value added. More precisely, ceteris paribus, intrasectoral outsourcing
in sector i – i.e. involving units of production belonging to the same sector i –
increases the intermediate consumption and the gross output of the relevant
sector, while leaving its value added hardly affected: accordingly, it determines
a change in the relevant IO autocoefficient, aii. The same effect, instead, does
not occur in the case of intersectoral outsourcing by sector i – i.e. involving
production units belonging to two different sectors – because the gross output
of the “outsourcer” sector i remains relatively stable, while its value added
diminishes: in this case, thus, aii is not expected to change (for a formal proof
of this result, see Montresor & Vittucci Marzetti, 2007).
Although important in suggesting all these implications, the sectoral level
of analysis is however unable to catch the effects outsourcing exerts on the
whole set of relationships of an economic system. In trying to capture both
vertical and horizontal linkages, and both direct and indirect effects, one should
thus rather refer to the concepts of subsystems or vertically integrated sectors.3
In particular, drawing on the contribution by Momigliano & Siniscalco (1982),
one can refer to a matrix C formally defined as:
C = lB( ˆl′B)−1 (1)
where l′ is the row vector of labour inputs, the hat symbol is used to denote
diagonalisation and B is defined as:
B = q−1(I − A)−1y. (2)
In Eq.(2), q is the diagonalised vector of gross production, A is the matrix
of IO coefficients calculated on the basis of domestic flows and y is the
diagonalised vector of total final demand. Each cell cij of C (on whose
properties see Montresor & Vittucci Marzetti, 2007) measures the share
accounted by sector i in the total labour required by subsystem j to produce
the output needed to satisfy the final demand for it.
Starting from this matrix, two useful indicators can be obtained. The first
one is given by each element of the main C diagonal (cii). Ranging from 0 to
1, it can be taken as a proxy of the vertical integration degree of sector i: the
closer cii is to 0, the more sector i will be vertically disintegrated, the more
outsourcing processes can be retained relevant for it.
6

The second indicator is given by the sum, for each column i, of the rows
of C, say from m to n, which refer to business sector services (∑n
k=m cki).
This is a proxy of the service integration in the subsystem i: the higher this
sum, the more market services are integrated into the relevant manufacturing
subsystem, the more service outsourcing is presumable in place.
These two indicators refer to what can be called “system” integration,
determined by both technological and organizational factors, not only specific
to the sector under consideration. It can be proved that C is not affected by
intrasectoral outsourcing phenomena (Montresor & Vittucci Marzetti, 2007).
Furthermore, when C is built up by using total production flows (domestic
plus imported), as we do in the present paper (unlike Momigliano & Sinis-
calco, 1982), the relative indicators are also able to account for intersectoral
international outsourcing.4
In synthesis, the outsourcing indicators one can use for structural change
analysis are among them inherently diverse. As Table 1 shows, one should
first consider whether she is interested in capturing the structural effects
of inter rather than intrasectoral outsourcing. In the first case, service
outsourcing is signaled, incontrovertibly but also somehow inaccurately, by
an increase in the two sectoral ratios SERVi/Qi and SERVi/LABRi. A
more comprehensive measure of it, instead, is provided by an increase in the
weight of business sector services on the relative subsystem in terms of hours
worked (∑n
k=m cki) and a correlated decrease of the vertical integration degree
of the same sector (cii). On the contrary, subsystem measures do not capture
intrasectoral outsourcing: cii and∑n
k=m cki are expected not to change. In
this case, signals of outsourcing should instead come from both an increase in
the autocoefficient of the relevant sector (aii) and a decrease of the sectoral
ratio SERVi/Qi.
All the indicators are affected by a certain degree of inaccuracy. For this
reason, they should be used, rather than alternatively, in a complementary
way, by retaining their different signaling power. This is what we will do in
the remainder of the paper. In particular, the indicators at the subsystem
level (cii and∑n
k=m cki) will be mainly used in Section 3.1, while those at the
sectoral level (SERVi/Qi, SERVi/LABRi and aii) in Section 3.2.
7

Table 1: Expected variations of the sector/subsystem indicators in manufac-
turing sector i
Event Level IndicatorsExpected
variation
Intersectoral
disintegration
Sector aiia = / − ∆
SERVi/Qib +∆
SERVi/LABRic +∆
Subsystem ciid −∆
∑n
k=mcki
e +∆
Intrasectoral
disintegration
Sector aiia +∆
SERVi/Qib −∆
SERVi/LABRic =
Subsystem ciid =
∑n
k=mcki
e =
aAutocoefficient of sector i: aii = [A]ii = [Qq−1]ii, where Q is the matrix of sectoral
intermediate consumption and q the diagonalised vector of sectoral total production.bIntermediate market services expenditure per production unit in sector i.cIntermediate market services expenditure on labour compensation in sector i.dVertical integration of sector i: cii = [C]ii = [lB( ˆl′B)−1]ii, where l′ is the row vector
of labour inputs and B = q−1(I − A)−1y, with y the diagonalised vector of final demand.eService integration in subsystem i: row-sum of C for the business sector services.
3 Outsourcing and structural change in a vari-
able set of OECD countries
In this section we apply the outsourcing measurements described in the
previous one to some OECD countries over the ’80s and the middle ’90, both
at cross-sectional and inter-temporal level. Because of data availability, we
will refer to two different country sets, that we will call, respectively: the
OECD6, made up of Canada, Denmark, France, Japan, UK and US, over
the ’80s; the OECD18, that includes Australia, Canada, Check Republic,
Denmark, Spain, Finland, France, Germany, Greece, Hungary, Italy, Japan,
Korea, Netherlands, Norway, Poland, UK and US, with respect to the middle
’90s (see Appendix A).5
8

Still because of data availability, we retained a disaggregation of 14 manu-
facturing sectors (including construction) for the OECD6, and of 17 sectors
for the OECD18 (see Appendix B).6
3.1 The subsystem level
As we said before, the structural change implications of outsourcing can be
caught at two levels of analysis: the subsystem and the sectoral level. Let us
consider each of them in turn, starting from the more general.
3.1.1 Vertical integration/disintegration over the ’80s in the OECD6
Although for a limited number of OECD countries, imposed by the use of IO
tables at constant prices, Figure 1 and 2 show some interesting results.
First of all, the average value of cii of the retained sectors shows in general
a reversed U-shaped pattern of change over time: first increasing (in the
early ’80s) and then decreasing (in the late ’80s). Outsourcing thus seems
to have added to other disintegration determinants just in the last part of
the decade, and to a different extent in different sectors. For the sake of
illustration, just compare machinery & equipment – on average, one of the
most disintegrating sectors in the middle ’80s – with fabricated metal products
– whose disintegration has been relatively less intense.
A relevant exception to this trend is transport equipment, including motor-
vehicles: the only sector whose average cii is decreasing over the whole period,
being it due to technological change or outsourcing.
Further insights can be obtained by analyzing the temporal changes
occurred in∑n
k=m cki. Figure 3 and 4 show that, unlike vertical disintegration,
service integration was already occurring in the early ’80s (with the only
exception of residual manufacturing). It is worthwhile observing that the
correlation between the rankings in terms of changes in cii and in∑n
k=m cki is
positive (+0.115), thus possibly hinting at a certain role of service outsourcing
in driving vertical disintegration in the middle ’80s.
Going further these common trends, important country specificities emerge.
Looking at manufacturing as a whole, in the UK business sector services were
the most integrated in the manufacturing subsystem in 1990, while in 1980
9

Figure 1: Vertical integration degree (cii) of OECD6 manufacturing – cross-
country average values: 1980-1990
Figure 2: Vertical integration degree (cii) of OECD6 manufacturing – changes
in cross-country average values: 1980-1990
10

Figure 3: Service integration in manufacturing subsystems (∑n
k=m cki) – cross-
country average values: 1980-1990
Figure 4: Service integration in manufacturing subsystems (∑n
k=m cki) –
changes in cross-country average values: 1980-1990
11

(a) Vertical integration degree (cii) (b) Service integration (∑
n
k=mcki)
Figure 5: Textiles, textile products, leather and footwear: 1980-1990
(a) Vertical integration degree (cii) (b) Service integration (∑
n
k=mcki)
Figure 6: Transport equipment: 1980-1990
they were the least integrated ones. In Japan,∑n
k=m cki increased consistently
only during the late ’80s and, what is more relevant, it was not accompanied
by an appreciable vertical disintegration of the manufacturing sector. The US
were the only country in which∑n
k=m cki during the ’80s decreased, hinting at
a different strategy of US manufacturing firms (the relative data are available
from the authors at request).
Further inter-country differences emerge when we refer to two sectors of our
disaggregation which are usually deemed more “vulnerable” to outsourcing:
textiles (with leather & footwear) and transport equipment.
As Figure 5 shows, during the ’80s the cii of the textile sector has pro-
gressively decreased, and the corresponding∑n
k=m cki considerably increased,
12

mainly in the European countries (Denmark, France and UK). For the non-
European countries (Canada, Japan and US), instead, these measures did not
change significantly from the early to the late ’80s.
What seems to emerge as the “UK case” gets confirmed in other sub-
systems, and in particular in transport equipment (Figure 6). Accordingly,
the large increase of service integration in the UK manufacturing subsystem
shown by the data seems to support the hypothesis of an overestimation of
the tertiarisation of the UK economy over the ’80s due to an inaccurate resort
to sectoral data (McCarthy & Anagnostou, 2004; Vittucci Marzetti, 2008).
The analysis of transport equipment (Figure 6) also shows a notable
disintegration of the Japanese sector, indeed the most disintegrated one over
the whole period, far beyond the others, and with a recent increase in the
disintegration ranking. Particularly interesting is the comparison with cii in
the US, both in terms of levels (in the ’90s) and rates of change (from the
early to the late ’80s). These data seem thus to confirm the outcomes of the
studies, mainly at firm level, on the Japanese transport equipment sector
(e.g. Womack et al., 1990), as they show how the economic restructuring in
this sector changed the contribution of the sector itself to the corresponding
subsystem in terms of labour.
3.1.2 Vertical integration/disintegration in the middle ’90s in the
OECD18
By referring to the middle ’90s, the previous integration/disintegration analysis
can be carried out, using IO tables at current prices, with respect to a broader
set of countries (Appendix A).
To start with, we worked out cross-country average values of cii and∑n
k=m cki for all the manufacturing sectors/subsystems. Table 2 classifies
them into three groups, depending on the vertical integration degree being
lower than 40% (low vertical integration), in-between 40% and 50% (middle
vertical integration) and higher than 50% (high vertical integration).7
The ranking points to five “suspect” sectors in terms of disintegration, that
is: (i) coke, refined petroleum products and nuclear fuel; (ii) food products,
beverages and tobacco; (iii) motor vehicles, trailers and semi-trailers; (iv)
13

chemicals and chemical products; (v) basic metals. For the last three, the
suspicious finds confirmation in other studies at the firm and industry level,
which show that “buy” rather than “make” has become a dominant strategy for
them (e.g. Piachaud, 2002; Bongart, 1993; Lieberman & Johnson, 1999). Less
expected was the result for the first two “resource intensive” sectors. However,
the intersectoral approach to outsourcing we are following allows us to conclude
that, for these two sectors, vertical disintegration represents quite a structural
feature on the production side, not only directly linked to outsourcing or
organizational factors. Indeed, they heavily rely on, respectively, the mining
and the agricultural sectors (data available from the authors at request). A
similar structural feature cannot be found instead in the subsystems of the
other least integrated sectors, such as basic metals, chemical and transport
equipment, for which no manufacturing or agricultural sector out of the main
diagonal seems to play a pivotal role.
The “closeness” of one economic sector to those producing raw mate-
rials is thus an important, differentiating aspect of the level of vertical
integration/disintegration of the firms operating in it. Once reported at the
microeconomic level, this result appears particularly interesting, as it recovers
in the analysis the importance of those production and technological aspects
that the standard, new institutional accounts of outsourcing downplay in
front of that of the organization and contracting ones. In this last respect,
the IO analysis thus seems to support the complementary use of transaction
costs and resource-competence-based views of vertical integration and disinte-
gration that Jacobides & Winter (2005), among the others, point as essential
in understanding the “institutional structure of production”.
Going back to our cii results, and crossing them with those for∑n
k=m cki,
further insights on the five “candidate” sectors can be obtained (Table 2).
With the only exception of food, beverages and tobacco, the remaining four
are subsystems in which market services are the most integrated in the middle
’90s. Let us also observe that the two rankings with respect to the middle
’90s are quite similar, supporting our tentative interpretation of a relationship
between cii and∑n
k=m cki: the Spearman’s rank correlation index is 0.684 and
becomes 0.798 when the two “resource intensive” sectors previously analyzed
are not considered.
14

Table 2: Vertical integration (cii) and service integration (∑n
k=m cki) – middle
’90s – cross-country average values
Sector/subsystem
Avg % values
Vertical
integrationRank
Service
integrationRank
Low vertical integration
Coke, refined petroleum products and nuclear fuel 9.9 1 35.8 1
Food products, beverages and tobacco 26.3 2 20.6 14
Motor vehicles, trailers and semitrailers 35.1 3 28.4 4
Chemicals 35.4 4 35.3 2
Basic metals 37.4 5 30.2 3
Middle vertical integration
Rubber and plastics products 44.2 6 25.7 7
Electrical machinery & Apparatus, nec 45.4 7 24.9 8
Office and computing machinery - Communica-
tion equipment - Medical, precision and optical
instruments
46.9 8 27.6 5
Other non-metallic mineral products 48.5 9 26.3 6
Machinery and equipment, nec 49.4 10 23.4 10
Other transport equipment 49.6 11 21.2 13
Wood, products of wood and cork 50.2 12 18.2 16
High vertical integration
Manufacturing, nec; Recycling 52.2 13 19.4 15
Construction 52.4 14 21.4 11
Pulp, paper, printing and publishing 53.2 15 24.9 9
Fabricated metal products 54.2 16 21.3 12
Textiles, textile products, leather and footwear 64.6 17 17.8 17
Source: our calculation on OECD I-O Database and 60-Industries GGDC Database, 2005.
15

Apart from these last two sectors, some remarks should be made about
the other ones that exhibit both low cii and high∑n
k=m cki: motor vehicles,
chemicals and basic metals. With respect to the first, due to the long value
chain characterizing its production processes, as well as the large resort to
outsourcing pointed out in many case-studies (e.g. Womack & Jones, 1994),
this result is not surprising. And this holds true also for chemicals, in which
service outsourcing practices are widespread, in particular as far as R&D
activities are concerned (e.g. Howells, 1999). The ranking of basic metals
is instead somehow counterfactual, given that, on the basis of the relative
“closeness” to raw materials, we would have expected a relative high cii. The
prominent role of horizontal linkages over the vertical ones for manufacturing,
together with the high value of∑n
k=m cki in the basic metal subsystem, thus
seems to suggest a process of change far beyond its structural nature.
Looking at the changes occurred over time in the levels of cii, Table 3
compares the ranking of the considered manufacturing sectors in terms of
average cii in the early ’80s, late ’80s and middle ’90s. With respect to the
restricted set of countries we analyzed in Section 3.1.1 (OECD6), apart from
some notable exceptions, the ranking of the retained sectors in terms of cii
represents quite a stable feature. In spite of all the relevant technological,
organizational and demand changes occurred in the period, the “club” of
the most disintegrated sectors remains substantially unaltered: coke, refined
petroleum products and nuclear fuel; food products, beverages and tobacco;
chemicals and chemical products; and basic metals are the subsystems on
which the correspondent sector weights relatively less in all the three periods.
However, two important structural changes can be noticed, although still on
average. First of all, the disintegration process of the transport equipment
sector, already detected above, has brought it progressively from, on average,
one of the most integrated (in the early ’80s) to one of the least integrated
ones (in the middle ’90s), and the change seems to have occurred at an
increasing rate.
Second, in approaching the middle ’90s the construction sector seems
to have been affected by an opposite phenomenon. More gradual changes
over the period can be observed in non-metallic mineral products, fabricated
metal products and in machinery equipment. Quite interestingly, while the
16

Table 3: Vertical integration degree (cii) of OECD6 manufacturing sectors:
1980-1995
Code Sectorearly ’80s early ’90s mid-’90s
Avg Rank Avg Rank Avg Rank
23 Coke, refined petroleum products
and nuclear fuel
5.3 1 6.8 1 10.4 1
15-16 Food products, beverages and to-
bacco
23.0 2 25.4 2 29.1 2
20 Wood and products of wood and cork 35.0 3 34.5 3 49.7 6
24 Chemicals 35.9 4 35.2 4 35.6 3
27 Basic metals 37.5 5 38.0 5 42.7 4
25 Rubber and plastics products 45.4 6 44.4 6 49.9 7
45 Construction 51.2 7 50.4 7 53.2 11
26 Other non-metallic mineral products 54.6 8 52.2 9 52.9 10
28 Fabricated metal products 54.8 9 52.2 10 57.8 13
34-35 Transport equipment 56.7 10 52.2 8 44.2 5
21-22 Pulp, paper, printing and publishing 56.8 11 54.8 12 57.6 12
29 -33 Machinery and equipment 57.6 12 54.2 11 52.8 9
17-19 Textiles, textile products, leather
and footwear
65.6 13 65.1 13 66.9 14
36-37 Manufacturing, nec; Recycling 69.8 14 71.2 14 51.6 8
Source: our calculation on OECD I-O Database and 60-Industries GGDC Database, 2005.
17
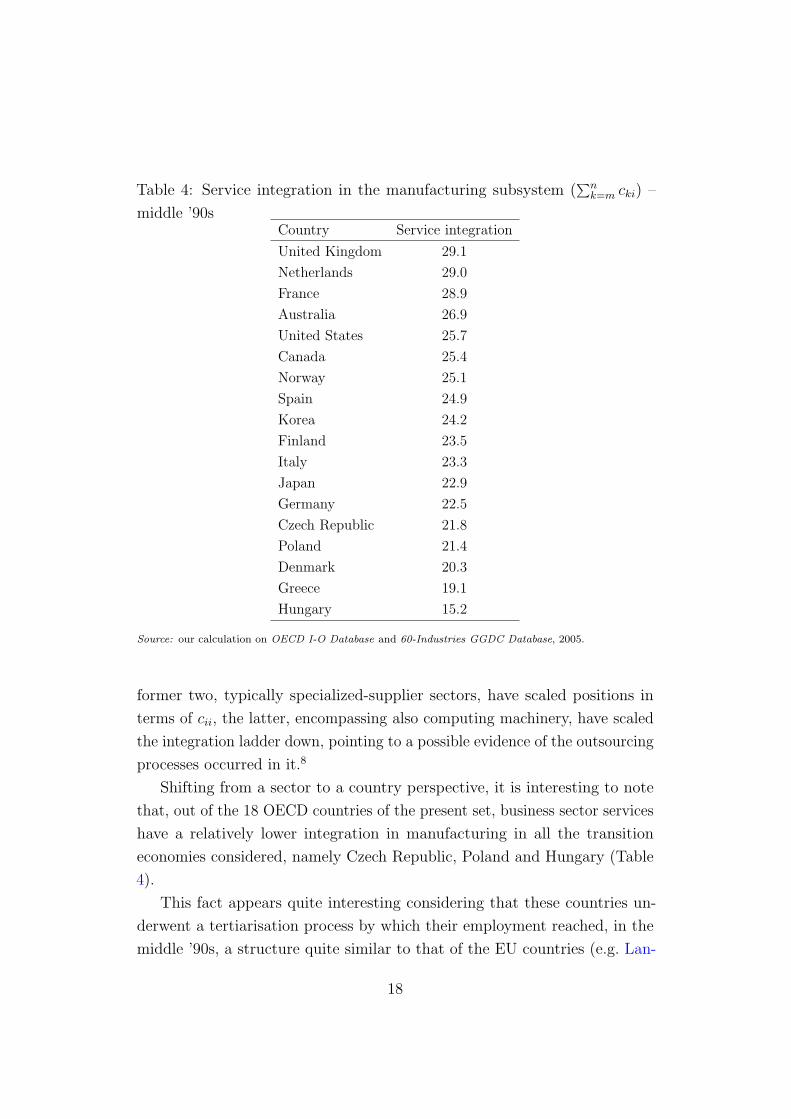
Table 4: Service integration in the manufacturing subsystem (∑n
k=m cki) –
middle ’90sCountry Service integration
United Kingdom 29.1
Netherlands 29.0
France 28.9
Australia 26.9
United States 25.7
Canada 25.4
Norway 25.1
Spain 24.9
Korea 24.2
Finland 23.5
Italy 23.3
Japan 22.9
Germany 22.5
Czech Republic 21.8
Poland 21.4
Denmark 20.3
Greece 19.1
Hungary 15.2
Source: our calculation on OECD I-O Database and 60-Industries GGDC Database, 2005.
former two, typically specialized-supplier sectors, have scaled positions in
terms of cii, the latter, encompassing also computing machinery, have scaled
the integration ladder down, pointing to a possible evidence of the outsourcing
processes occurred in it.8
Shifting from a sector to a country perspective, it is interesting to note
that, out of the 18 OECD countries of the present set, business sector services
have a relatively lower integration in manufacturing in all the transition
economies considered, namely Czech Republic, Poland and Hungary (Table
4).
This fact appears quite interesting considering that these countries un-
derwent a tertiarisation process by which their employment reached, in the
middle ’90s, a structure quite similar to that of the EU countries (e.g. Lan-
18

desmann, 2000). Among them, Hungary deserves a particular attention. As
Landesmann’s (2000) survey on the European post-socialist countries clearly
shows, this is the country in which in the ’90s there was the largest increase
in the service share, both in terms of value added and labour, and where
manufacturing labour productivity grew faster. Nevertheless, in this country
business sector services are the least integrated in manufacturing, thus sug-
gesting that the increase in the service sector was mainly due to consumer
services, whereas the producer services still lag behind.
It is worthwhile noticing that the country ranking we got in terms of∑n
k=m cki is somewhat different from that obtained working with SERVi/Qi
and SERVi/LABRi. In particular, these data lead to a significant under-
estimation for some countries, namely, France, Netherlands, Finland and
Poland, in which producer services appear more important than final ones.
On the contrary, the same data overestimate the integration of services in
manufacturing with respect to Greece and Hungary, possibly because of the
prominent role of final services in producer ones (data available from the
authors at request).
In concluding, it could be interesting to analyze the most recent integration-
disintegration patterns occurred in the “usual suspect” manufacturing sectors:
textiles, leather & footwear, and transport equipment (Figure 7).
In general, the low value of∑n
k=m cki for the former socialist European
countries, and for Hungary in particular, gets confirmed in both the two
sectors. Confirmed is also the high value of∑n
k=m cki in France, UK and
Netherlands, as well as the reversing trend of it in the US (see Figures 5-6). As
for the other countries, it is interesting to note the close ranking of Japan and
Korea, both in terms of cii and of∑n
k=m cki, especially in transport equipment
and machinery & equipment.
Trying to have a closer look at each sector, the analysis of textiles reveals
the low value of∑n
k=m cki in the Italian subsystem, whose recent delocalisation
strategies are well-known.9 For the transport equipment sector, what emerges
is the marked distance of Germany, Italy, Spain from the disintegrated
model characterizing France, UK, Japan and US, thus suggesting institutional
idiosyncrasies in the organisation of the relative subsystem.
19

(a) Textiles, textile products, leather and footwear
(b) Transport equipment
Figure 7: Vertical integration degree (cii) and service integration (∑n
k=m cki) -
middle ’90s
3.2 The sectoral level
As we have argued, the subsystem and the sectoral level of analysis should be
regarded as complementary. While the former takes into account the overall
changes occurred in intersectoral production linkages due to externalizations
practices, the latter is suitable for mapping firms’ outsourcing strategies.
For a more straightforward comparison, we have calculated the outsourcing
indicators at the sectoral level for the same countries of Section 3.1.1 and with
respect to the usual “candidate” sectors, namely textiles, leather & footwear,
and transport equipment. Figures 8 and 9 show the results of this analysis
20

(a) Textiles (b) Transport Equipment
Figure 8: Intermediate business sector services expenditure per production
unit in manufacturing (SERV/Q) (constant prices): 1980-1990
with respect to the ’80s.
At the outset, let us observe that, while France registers the highest
average levels of both SERV/Q and SERV/LABR, the UK shows their
highest growth rates: for manufacturing as a whole, for example, SERV/Q
increased more than 66%, while SERV/LABR by 60.6%. Data thus provide
further evidence of the economic restructuring of the UK manufacturing sector
during the ’80s, and especially in the last five years. At the same time, they
seem to point to a possible “European model of externalisation”, given that for
the European countries the two data series are quite consistent between them
and decisively supportive of the outsourcing hypothesis for all the considered
sectors. Finally, crossing these data with those on the service integration
in manufacturing subsystems (Section 3.1.1), an interesting fact should be
noticed: the service integration in UK manufacturing, usually retained a
systemic feature resulting from the complex interactions of technological and
organizational factors in the overall system, appears largely underestimated
by the two indicators of the present Section, both in terms of levels and of
rates of changes, as it clearly emerges comparing Figures 5-6 with Figures
8-9.
As far as Canada and the US are concerned, the sectoral data do not show
significant tendencies toward service outsourcing in any of the considered
sectors. In particular, in the US during the ’80s the overall rate of change
21

(a) Textiles (b) Transport Equipment
Figure 9: Intermediate business sector services expenditure on labour com-
pensation (current prices) (SERV/LABR): 1980-1990
of SERV/Q for the whole manufacturing is negative (-5.2%), whereas the
rate of change of SERV/LABR, though positive, is relatively small (6.9%).
The only exception is the US transport equipment sector in the late ’80s,
with respect to which SERV/Q and SERV/LABR possibly hint at a certain
rethinking of the insourcing strategies followed in the early ’80s by the US
firms. Indeed, after a marked decrease of SERV/Q and SERV/LABR for
the sector between 1980 and 1985 (respectively, -30.3% and -19.2%) both
the indicators considerably increased in the late ’80s (+20.7% and +33.9%).
Quite interestingly, this fact involved neither an increase of service integration
in the transport equipment subsystem, nor a vertical disintegration of the
relative sector for the US (Figure 6).
Finally, special attention should be paid to the case of Japan, and of
the Japanese transport equipment sector in particular, for which the picture
is somehow mixed-up. On the one hand, we have a small and decreasing
SERV/Q, that seems to exclude service outsourcing in the sector, coupled
with the fact that the average level of SERV/Q over the ’80s is particularly
small for transport equipment.10 On the other hand, a large and increasing
SERV/LABR could lead to an opposite conclusion, in particular once crossed
with an increasing service integration in the relative subsystem. The indicator
increased a lot also for machinery & equipment (+35.4%), the main supplier
sector of transport equipment. Furthermore, looking at the average levels of
22

(a) Japan
(b) United Kingdom
Figure 10: IO coefficients (aii and aij) in transport equipment (constant
prices): 1980-1990
the indicators in the two sectors, Japan shows the highest values. In synthesis,
it seems that the Japanese economic restructuring, while reflected in the
changes occurred in the employment structure, does not result from the data
on intermediate service consumptions per production unit.
This apparent inconsistency seems to be due to the intrasectoral nature
of the outsourcing patterns of the Japanese transport sector. Indeed, as we
said, in case of intrasectoral outsourcing SERV/Q would tend to decrease in
the outsourcing sector i, whereas its SERV/LABR would be, ceteris paribus,
hardly affected. What is more, all the IO coefficients of the same sector tend
23

to decrease, with the exception of the aiis, which, on the contrary, increase.
Consistent changes can be observed in the present case where, over the ’80s,
the relative aiis increased by 70.9%, while, among the remaining five countries
of the OECD6 set, the largest increase occurred in the UK and was of just
32.9% (Figure 10).11 At the same time, all the remaining aijs, in particular
those referred to basic metals, machinery & equipment and fabricated metal
products, three of the most important and complementary inputs in the
production of transport equipment. Over the ’80s, in all the countries but
Japan the reduction in the aij of basic metals was accompanied by an increase
for machinery & equipment and fabricated metal products. On the contrary,
in Japan they all decreased: -31.4% for basic metals, -37.3% for machinery
& equipment and -22.7% for fabricated metal products. One might argue
that these results, rather than by disintegration, are mainly due to technical
progress. However, if it was so, how to explain the marked increase of the
autocoefficients (aii)?
A certain intrasectoral disintegration of the Japanese transport equipment
sector appears therefore more than arguable and it is consistent with the
data on employees per establishment in the automobile industry (Williams
et al., 1998, p.25). Of course, other factors might have played a role in
explaining the detected inconsistency. First of all, the particular relationships
(“keiretsu”) between the “outsourcee” firms and the “outsourcer” ones (e.g.
Domberger, 1998) might have made input prices more similar to intra-firm
“transfer prices” rather than to normally negotiated “market prices” (see, for
instance, Jarillo, 1993), and then led to an underestimation of the service
inputs of manufacturing sectors. Second, a certain increase in the service
labour share of the transport equipment subsystem might have been due
to the large labour productivity gains reached in the transport equipment
during the ’80s in Japan, not accompanied by an equal increase of labour
productivity in the service sectors. In other words, the observed changes in
the sectoral labour shares might have been also due to the different growth
rates of sectoral productivity. However, although more than plausible, all
these interpretations turn out to be complementary, rather than primary,
with respect to the particular disintegration hypothesis we have put forward.
24

4 Final remarks and policy implications
The paper argues that outsourcing and structural change are closely intercon-
nected. While shifting firms’ boundaries, or making them more permeable to
market mechanisms, outsourcing inevitably shifts also sectoral boundaries.
The organizational and the structural changes it determines are thus nothing
but two coins of the same medal.
An effective bridging of outsourcing and structural change analysis has
been hampered so far by different reasons. However, recent developments
have made these obstacles less binding and made the investigation of the
structural change implications of outsourcing more feasible.
On this basis, the paper tries to show how outsourcing, along with other
determinants, might have reshaped the economic structure of some OECD
economies over the ’80s and the middle ’90s. We have built a “battery” of
indicators and carried out cross-country and temporal analyses to identify
structural differences and patterns of change related to outsourcing.
A subsystem analysis has been contrasted to the standard sectoral analysis
of service outsourcing, typically carried out in terms of intermediate market
services expenditure on output and labour compensation.
Some of the results are supportive of evidences other contributions find
through case-studies and/or nation specific analysis, such as the idiosyncratic
resort to service outsourcing of the UK manufacturing sectors. Other results
are, instead, quite original, such as the low degree of integration of services
in manufacturing revealed by the post-socialist countries over the ’90s, that
helps better qualifying the massive process of tertiarisation they underwent.
Our analysis has some important policy implications. First of all, as
shown in other studies (e.g. Dietrich, 1999; McCarthy & Anagnostou, 2004),
investigating the structural change implications of outsourcing might help in
getting rid of wrong signals in orienting policies of industrial development.
Without considering the intersectoral networks of production relationships
that service outsourcing creates, the decline of manufacturing with respect
to services might be overestimated: the tertiarisation of the former socialist
countries, for example, should be better qualified in the light of the present
study.
25

Second, the structural change analysis of outsourcing could be helpful in
better orienting trade policies. If the actual extent of service integration in
manufacturing due to outsourcing is not recognized, the impact of manufac-
tured goods imports on the domestic economy might be undervalued: the
evaluation of the internal sustainability of the domestic UK economy, for
example, could benefit from the results of the present paper.
Third, bridging outsourcing and structural change analysis might have an
important role in driving industrial policies aimed at fostering productivity.
The effects outsourcing produces by changing firm boundaries are well-known
in productivity analysis, where it is now clear that outsourcing can in fact
influence value added-based Total Factor Productivity (TFP) measures (e.g.
Balk, 2003). The notable debate on the technology and TFP “race” between
US and Japan, for example, should be informed by the different outsourcing
strategies that seem to emerge for them from our study, in particular in such
key sectors as transport equipment.
Last but not least, the direct and indirect relationships fueled by outsourc-
ing processes should be retained in evaluating their employment effects and
the relative employment policies. The different outsourcing patterns the paper
shows between European and non-European countries, for example, could
add important elements in better appreciating the different performances of
their labour market.
26
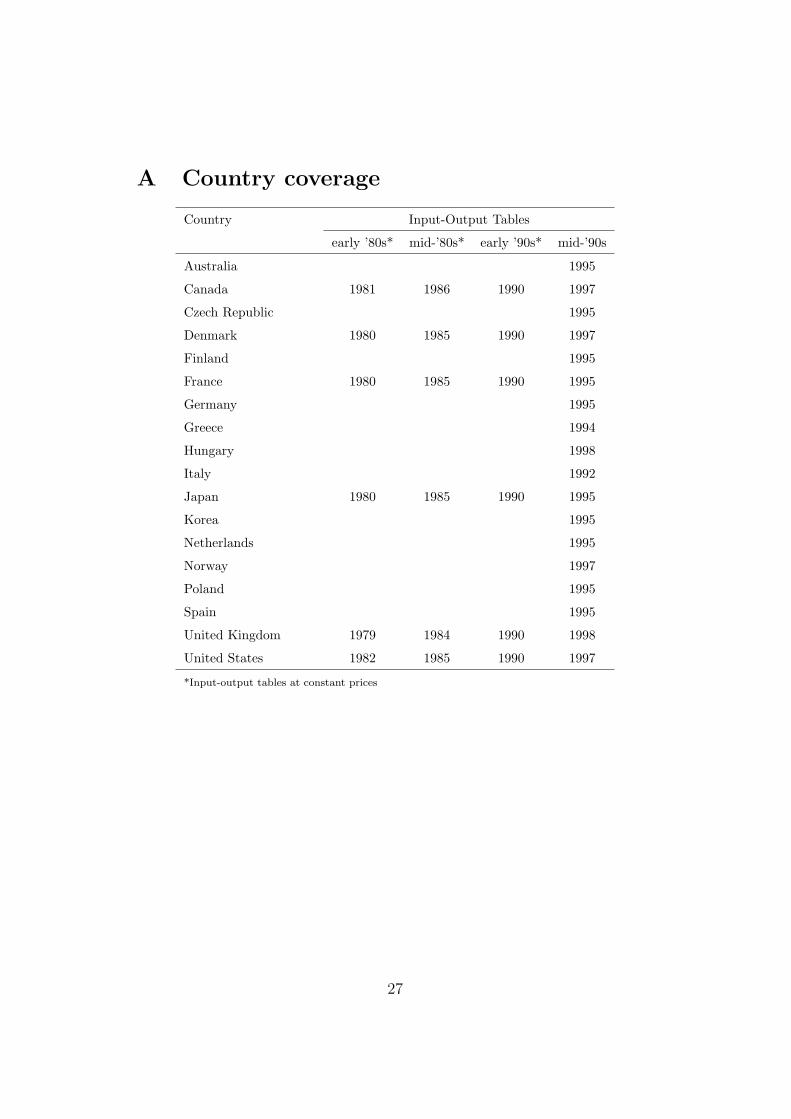
A Country coverage
Country Input-Output Tables
early ’80s* mid-’80s* early ’90s* mid-’90s
Australia 1995
Canada 1981 1986 1990 1997
Czech Republic 1995
Denmark 1980 1985 1990 1997
Finland 1995
France 1980 1985 1990 1995
Germany 1995
Greece 1994
Hungary 1998
Italy 1992
Japan 1980 1985 1990 1995
Korea 1995
Netherlands 1995
Norway 1997
Poland 1995
Spain 1995
United Kingdom 1979 1984 1990 1998
United States 1982 1985 1990 1997
*Input-output tables at constant prices
27

B Sector classification
Sector ISIC Rev.3 Codes
Food products, beverages and tobacco 15-16
Textiles, textile products, leather and footwear 17-19
Wood and products of wood and cork 20
Pulp, paper, paper products, printing and publishing 21-22
Coke, refined petroleum products and nuclear fuel 23
Chemicals 24
Rubber and plastics Products 25
Other non-metallic mineral products 26
Basic metals 27
Fabricated metal products 28
Machinery & equipment
...Machinery and equipment, nec 29
...Office and computing machinery - communication
equipment - medical, precision and optical instruments
30,32-33
...Electrical machinery and apparatus, nec 31
Transport equipment
...Motor vehicles, trailers and semitrailers 34
...Other transport equipment 35
Manufacturing, nec; Recycling 36-37
Construction 45
28

Notes
1Some results of this application have been sketched in another work of ours (Montresor
& Vittucci Marzetti, 2007) in order to show how the same measurements work in practice.2Using micro data for 5 OECD countries, Pilat & Wolfl (2005) show that the employment
and revenues shares of manufacturing and services using establishment and enterprise
based classifications are fairly similar.3These concepts have been analytically studied since the late 1960 (see, for instance,
Zaghini, 1967; Pasinetti, 1973) and mainly applied to empirical studies on productivity
(e.g. Gupta & Steedman, 1971; Milberg, 1991; De Juan & Febrero, 2000).4Their construction requires in this case a more articulated interpretation for the
multiplication between labour input coefficients and the Leontief inverse. Furthermore,
the invariance of C to relative price changes does not hold anymore (see Montresor &
Vittucci Marzetti, 2007).5We will discuss only the results of total flows-based measures, as they enable us to
take into account international outsourcing. However, the analysis of the domestic flows-
derived measures leads to similar results. The interested reader can refer to Montresor &
Vittucci Marzetti (2006).6To minimise distortions coming from sectoral aggregation, calculations have been
carried out at the maximum level of disaggregation, and the results then reaggregated.7The boundaries of the three intervals are somehow arbitrary and just used to better
underline differences among sectors.8As for the wood and cork sector, the observed shift between the ’80s and the middle
’90s might have been affected by a change in the classification from ISIC Rev.2 to ISIC
Rev.3.9The high vertical integration degree of Italy, instead, is not significant because this
indicator is not affected by “intrasectoral disintegration”, both within and across national
boundaries.10Service expenditure per production unit did not increase significantly in its traditional
supplier sectors either, i.e. machinery & equipment, basic metals, rubber and plastics
products and other fabricated metal products. Although sectoral input flows at constant
prices from business sector services increased more than 89.8%, the overall increase in
sectoral gross production was 95.6%, thus determining a reduction in the coefficients of
-2.94%.11It is worth noting that the increase in aii we register in Japan is due neither to changes
in the composition of the sector nor to the reorganisation of production across national
boundaries. On the one hand, by increasing the level of disaggregation the basic insights
get confirmed: the growth rate of motor vehicles, trailers and semitrailer in Japan was of
52.7%, whereas in the UK it was of just 12.9%. On the other hand, domestic flows-based
autocoefficients in the Japanese transport equipment sector over the ’80s increased by 71%,
almost the same as total flows-based ones.
29

References
Acemoglu, D. et al. (2002) Vertical integration and distance to frontier,
Working Paper 9191, NBER.
Baldone, S. et al. (2002) EU Enlargement to the CEECs: Trade Competition,
Delocalisation of Production, and Effects on the Economies of the Union
(Milan: Franco Angeli).
Balk, M. (2003) On the relation between gross-output and value-added based
productivity measures: The importance of the Domar factor, Working
paper, Centre for Applied Economic Research.
Becker, M. C. & Zirpoli, F. (2009) An organizational approach to the design
of firm boundaries, Economia Politica, 3.
Bongart, A. (1993) The automotive industry: supply relations in contexts, in:
H. de Jong (Ed), The Structure of European Industry, pp. 147–161 (London:
Kluwer Academic Publishers).
De Juan, O. & Febrero, E. (2000) Measuring productivity from vertically
integrated sectors, Economic Systems Research, 12(1), pp. 65–82.
Dietrich, M. (1999) Explaining economic restructuring: an input-output
analysis of organisational change in the European Union, International
Review of Applied Economics, 13(2), pp. 219–240.
Domberger, S. (1998) The Contracting Organization. A Strategic Guide to
Outsourcing (Oxford: Oxford University Press).
Gereffi, G. (2003) The governance of global value chains, Review of Interna-
tional Political Economy, forthcoming.
Ginzberg, E. & Vojta, G. (1981) The service sector of the U.S. economy,
Scientific American, 3.
Gorg, H. & Hanley, A. (2004) Does outsourcing increase profitability, The
Economic and Social Review, 35(3), pp. 267–288.
30

Gupta, S. & Steedman, I. (1971) An input-output study of labour productivity
in UK, Oxford Bulletin of Economics and Statistics, 33, pp. 21–34.
Howells, J. (1999) Research and technology outsourcing and innovation sys-
tems: an exploratory analysis, Industry and Innovation, 6(2), pp. 111–129.
Humphrey, J. & Schmitz, H. (2002) How does insertion in global value chains
affect upgrading in industrial clusters, Regional Studies, 36, pp. 1017–1027.
Jacobides, M. G. & Billinger, S. (2005) Designing the boundaries of the firm:
from “make, buy or ally” to the dynamic benefits of vertical architecture,
London Business School - Strategic and International Management Working
Paper Series, working Paper.
Jacobides, M. G. & Winter, S. G. (2005) The co-evolution of capabilities
and transaction costs: Explaining the institutional structure of production,
Strategic Management Journal, 26, pp. 395–413.
Jarillo, J. (1993) Strategic Networks: Creating the Borderless Organization
(Oxford: Butterworth-Heinemann).
Jones, R. W. & Kierzkowski, H. (2001) A framework for fragmentation, in:
S. W. Arndt & H. Kierzkowski (Eds), Fragmentation: New production
patterns in the world economy, pp. 17–34 (Oxford and New York: Oxford
University Press).
Kohler, W. (2004) Aspects of international fragmentation, Review of Interna-
tional Economics, 12(5), pp. 793–816.
Landesmann, M. (2000) Structural change in the transition economies, 1989-
1999, Economic Survey of Europe, 2/3, pp. 95–123.
Lieberman, M. B. & Johnson, R., Douglas (1999) Comparative productivity of
japanese and u.s. steel producers, 19581993, Japan and the World Economy,
11(1), pp. 1–27.
McCarthy, I. & Anagnostou, A. (2004) The impact of outsourcing on the
transaction costs and boundaries of manufacturing, International Journal
of Production Economics, 88, pp. 61–71.
31

McFetridge, D. G. & Smith, D. A. (1988) The Economics of Vertical Disinte-
gration (Vancouver: Fraser Institute).
Milberg, W. S. (1991) Structural change and international competitiveness
in Canada: an alternative approach, International Review of Applied Eco-
nomics, 5, pp. 77–93.
Miller, R. E. & Blair, P. D. (1985) Input-Output Analysis: Foundations and
Extensions (New Jersey: Princeton-Hall).
Momigliano, F. & Siniscalco, D. (1982) The growth of service employment: a
reappraisal, BNL Quarterly Review, 142, pp. 269–306.
Montresor, S. & Vittucci Marzetti, G. (2006) Outsourcing and structural
change: Shifting firm and sectoral boundaries, Working Paper 566, Depart-
ment of Economics, University of Bologna.
Montresor, S. & Vittucci Marzetti, G. (2007) Outsourcing and structural
change. What can input-output analysis say about it?, Economia Politica,
XXIV(1), pp. 43–78.
Naghavi, A. & Ottaviano, G. (2005) Outsourcing, contracts and growth,
mimeo, University of Bologna.
Pasinetti, L. L. (1973) The notion of vertical integration in economic analysis,
Metroeconomica, 1, pp. 1–29.
Piachaud, B. S. (2002) Outsourcing in the pharmaceutical manufacturing
process: an examination of the cro experience, Technovation, (2), pp. 81–90.
Pilat, D. & Wolfl, A. (2005) Measuring the interaction between manufacturing
and services, STI Working Paper 2005/5, OECD, Paris.
Postner, H. H. (1990) The contracting-out problem in service sector analysis:
Choice of statistical unit, Review of Income and Wealth, 36(2), pp. 177–186.
Spencer, B. J. (2005) International outsourcing and incomplete contracts,
Working Paper 11418, National Bureau of Economic Research.
32

Stanback, T. M. (1979) Understanding the Service Economy (Baltimora:
Johns Hopkins University Press).
United Nations (2006) System of national accounts 1993, Studies in Methods
Series F, No.2, United Nations Statistics Division, New York.
Vittucci Marzetti, G. (2008) Input-output data and service outsourcing. a reply
to Dietrich, McCarthy and Anagnostou, Working Papers 621, Department
of Economics, University of Bologna.
Williams, K. et al. (1998) Cars: Analysis, History, Cases (USA: Berghahn
Books).
Womack, J. P. & Jones, D. (1994) From lean production to the lean enterprise,
Harvard Business Review, March-April, pp. 93–103.
Womack, J. P. et al. (1990) The Machine That Changed the World : The
Story of Lean Production (New York: Harper Collins Publishers).
Woodrow Eckard, E., Jr (1979) A note on the empirical measurement of
vertical integration, Journal of Industrial Economics, 28(1), pp. 105–107.
Zaghini, E. (1967) Una nota sui subsistemi di Sraffa, Studi Economici, 22, pp.
290–305.
33