outside funding and the dynamics of...
TRANSCRIPT

OUTSIDE FUNDING AND THE DYNAMICS OF PARTICIPATION IN COMMUNITY ASSOCIATIONS 1
Mary Kay Gugerty2
Michael Kremer3
June 18, 2006
Abstract
The poor and disadvantaged are widely seen as having weak organizations and low rates of participation in community associations, impeding their political representation and economic advancement. A number of policy initiatives aim to build participation and organizational strength among the disadvantaged by funding local community associations. Taking advantage of random assignment in a program which provided support to women's community associations in Kenya, we find little evidence that outside funding expanded organizational strength but substantial evidence that funding changed group membership and leadership. The program led younger women, more educated women, and women employed in the formal sector to enter the groups. Men, educated women, and new entrants moved into leadership positions, and government officials increased efforts to build vertical links to the groups. The rate at which members left groups due to conflicts doubled and exit rates among older women, the most socially marginalized demographic group, increased by two-thirds. A dynamic model based on the findings may help explain the relative weakness of organizations of the disadvantaged and low civic participation among the disadvantaged.
1 The authors would like to thank the World Bank Social Capital Initiative and the National Bureau of Economic Research for funding. We also thank the staff of ICS for their participation and support of this project, especially Robert Namunyu, Moses Osia, and Sylvie Moulin. This paper has benefited from discussions at seminars at Harvard University, UCSD, the World Bank Policy Research Division, Yale University, the Working Group on African Political Economy at the UCLA Center for Comparative and Global Research, and the Bureau for Research in Economic Analysis of Development (BREAD) as well as from research assistance from Dave Evans, Nava Ashraf, Stephen Barham, and Maria Gomez. . We thank Ben Olken and Dan Wood for suggestions on this model. We thank David Evans, Archon Fung, Jennifer Hochschild, Jessica Leino, Malgosia Madajewicz, Edward Miguel, and Aseem Prakash for comments. All errors are our own. 2 University of Washington, Box 353055, Seattle, WA 91891. (206) 297-7142. [email protected] 3 Harvard University, Littauer Center 207, Cambridge, MA 02138. (617) 496-9195. [email protected]
“What is it…that the poor reply when asked what might make the greatest difference to their lives? They say, organizations of their own so that they may negotiate with government, with traders, and with nongovernmental organizations. Direct assistance through community driven programs so that they may shape their own destinies. Local ownership of funds, so that they may put a stop to corruption.” James Wolfensohn, former World Bank president (Wolfensohn, 1999).
1. Introduction
The poor and disadvantaged have lower rates of participation in civic groups, religious groups, and
community associations (Almond and Verba, 1965; Verba, Schlozman and Brady, 1995; Ayala, 2000).
When the disadvantaged do participate in civic life, their organizations are often weak: Walzer (2002)
writes that “It is a general rule of civil society that its strongest members get stronger. The weaker and
poorer members are either unable to organize at all … or they form groups that reflect their weakness and
poverty.”
Many argue that this limits the political influence and economic development of the
disadvantaged. For example, Banfield (1958) documents the low levels of civic engagement in southern
Italy and argues that this is an important reason for the area’s underdevelopment. Putnam (1993, 2000)
argues that independent community organizations with horizontal ties among members enhance civic
capacity and participation; build trust, norms of cooperation, and support for democracy; and provide
templates for cooperation that ultimately lead to improved governance.
Scholars of democratic theory have long been concerned with the potential for associations to
equalize representation and participation in civic life (Fung, 2003) and hold states accountable to citizens
(Diamond, 1999). Some seek to identify policy interventions that can encourage a politics of association
among the disadvantaged (Cohen and Rogers, 1995). Outside assistance to organizations of the
disadvantaged could potentially help empower these groups, for example by providing a means for
articulating interests to policy-makers (Warren, M.E. 2001).
Efforts to build civic and economic participation of the poor by funding local civic and
community organizations range from components of the Johnson-era War on Poverty to more recent
U.S.-government supported efforts to build civic organizations internationally through the National
Democratic Institute and the International Republican Institute. As the quote above from former World
Bank President James Wolfensohn reflects, international development donors increasingly seek to
1

strengthen associations of the poor and disadvantaged in particular. The World Bank increased the share
of its projects with a community-based or community-driven component from two percent in 1989 to 25
percent in 2003 (World Bank, 2005), and other aid donors have moved in the same direction (Ottaway
and Carothers, 2000; Smillie and Helmich, 1999).
However, external support could also potentially influence who participates in associations, how
they are governed, and the autonomy of such groups. In the U.S. context, Skocpol (2003, 2004a, 2004b)
has argued that reliance on donor funding helps produce professionally-run organizations that do not
engage members in active participation in group activities and have fewer lower-status members. Piven
and Cloward (1979) argue that elite participation in membership organizations of the poor can divert
these organizations from their original purposes. Tripp (2000), Mansuri and Rao (2004), and Platteau and
Gaspart (2002) have voiced concerns that outside funding can lead to elite capture of organizations of the
poor in developing countries. Other authors suggest that outside funding benefits more advantaged
groups (Henderson, 2002; Sundstrom, 2005), reduces the role of the disadvantaged within these groups
(Garforth, 1994; Howes, 1997), or shifts the membership and leadership of such groups away from the
grassroots and towards more professional elites (Igoe, 2003). Payne (1995) shows how the success of the
southern civil rights movement changed the rewards available to participants, attracting higher status
individuals who saw opportunities for prestige and political influence.
The causal relationship between social disadvantage and participation in civic life is difficult to
pin down, as is the impact of outside funding on participation and group strength. In part this is because
much of the available evidence is based on single case studies. It is difficult to know whether these
represent typical outcomes or merely salient ones. Beyond this, however, is a deeper problem in social
science of assessing causation based on observed correlations in the data. Low participation of the
disadvantaged in civic life is consistent with a variety of different causal mechanisms, with different
policy implications. For example, low participation in civic associations could inhibit economic
development, as argued by Banfield. Alternatively, civic groups may represent the class interests of more
advantaged members and systematically exclude the disadvantaged. A third factor, such as psychological
traits like shyness could impede both civic engagement and socio-economic advancement, even in the
absence of a direct causal link between socioeconomic status and civic participation. Similarly,
2

education could provide social skills that promote participation in community associations (Glaeser,
Ponzetto and Shleifer, 2006; Verba et al, 1995) and could also independently spur economic success,
leading to a correlation between participation in community associations and economic status. As
Walzer (2002) suggests, the poor will simply have less to contribute to their organizations, and this may
make their organizations weaker. Disentangling the importance of these mechanisms empirically is
difficult, yet it is important for understanding the potential impact of policy.
In particular, assessing the impact of external assistance on the strength of civic groups and on
the role of the disadvantaged is particularly difficult based purely on correlations in non-experimental
data. A correlation between groups’ organizational strength and external assistance could arise because
stronger groups attracted more funding, because funding led to stronger organizations, or because some
third factor, like able leadership, led to both organizational strength and to increased external funding. A
correlation between whether groups receive external assistance and the socioeconomic status of their
membership and leadership could arise because external assistance attracts members and leaders of
higher socioeconomic status, because people of higher socioeconomic status are more successful at
securing outside funding, or because able leaders are likely to both attract funding and to rise in social
status. Adding control variables will not solve the causal inference problem if some potential
confounding factors remain unmeasured.
Studies that take advantage of random assignment to treatment and comparison groups can help
address these causality issues by eliminating systematic differences in potential confounding factors
between treatment and comparison groups. While such studies are common in some fields, such as
medicine, they are still relatively rare in political science. We take advantage of a unique opportunity to
assess causal impact that is created by random phase-in of a program designed to strengthen women's
associations in rural Kenya. Since the nongovernmental organization (NGO) that implemented the
program had limited funding and administrative resources, the program was phased in gradually, and the
order of phase in was determined randomly. By comparing groups that were supported early with those
that had not yet been funded, we estimate the impact of the program and shed light on one reason why the
poor and disadvantaged are less likely to participate in civic organizations and why their organizations
tend to be weak.
3
We find that members of groups receiving funds reported more satisfaction with group
leadership, but there is little evidence that objective measures of group activity improved. Increases in
agricultural output by program groups were worth far less than the inputs provided by the NGO. Meeting
participation rates, assistance to members, and assistance to other community projects did not increase.
Outside funding did change the nature of group membership and leadership, however. It
encouraged the entry into groups of younger, more educated women and women employed in the formal
sector, as well as people from outside the village. New entrants, men, and educated women assumed key
leadership positions. The program led to a two-thirds increase in the exit rate of older women, the most
disadvantaged demographic group, and a doubling of the rate at which members left groups due to
conflict. Amounts paid by new entrants and leaders to enter the groups were far less than the per capita
value of the assistance provided by the NGO or of group assets built up by existing members. Those who
left the groups were not compensated for the substantial investments in time and reinvested profits they
had made over the years in building up the groups.
The empirical results suggest that, at least in some circumstances, external assistance designed to
strengthen local community associations of the disadvantaged may actually weaken the role of the
disadvantaged in these groups. A model based on the results suggests a more general reason why the
disadvantaged often have weak organizations and low participation rates in civic organizations.
Membership in organizations is continually turning over, and organizations that can deliver more to their
members may generally attract stronger applicants. If those of higher socioeconomic status can typically
contribute more to organizations, then when existing members of organizations decide which applicants
to admit, they will typically prefer to admit those of higher socioeconomic status. We show that if
organizations differ in the extent to which they can deliver benefits to members, the steady state of a
dynamic process of turnover among members of groups will involve people of higher socioeconomic
status joining the strongest organizations and those of lower socioeconomic status either joining weaker
organizations or not joining organizations at all.
The rest of the paper proceeds as follows: Sections 2 and 3 provide background on women’s
groups in Kenya and the project we examine. Section 4 discusses the project's impact on group
agricultural activities and finances and Section 5 discusses its impact on group cohesion and community
4
interaction. Sections 6, 7 and 8 show how the program affected group membership, leadership and exit
from groups. Section 9 builds a stylized model of group dynamics based on the data, and argues that it
can help explain weak organizations and low participation rates among the disadvantaged.
2. Women’s Groups and Associational Life in Kenya
Women’s groups in Kenya exemplify the type of horizontal organization emphasized by Putnam (1993).
Their roots are truly indigenous, going back to a pre-colonial tradition of community self–help groups,
such as funeral and rotating labor clubs. In Kenya, they are probably the most widespread form of secular
community organization that does not rely on support from the government or foreign donors. In densely
settled agricultural areas of Kenya, it is estimated that half of all adult women belong to a women’s group
(Hammerslough, 1994 as cited in Udvardy, 1998). Such groups are widespread in much of sub-Saharan
Africa. These associations typically provide social, economic, and insurance benefits for their members,
as well as providing public benefit for individuals outside the group.
First, rural women's groups provide a form of social connection and civic participation for
women, a group that is not only disadvantaged within Kenyan society, but also particularly in danger of
social isolation. Traditionally much of Kenyan social structure revolves around kinship and clan
structure. Strict exogamy rules prevent marriages among relatives and residence is patrilocal, so at
marriage women typically move away from their home and kinship networks, leaving them with a
limited social network outside of that provided by their husband's family. Thus, women's groups may be
particularly important for widows and older women, who are particularly disadvantaged in rural African
communities because of reduced support from kin and weaker access to community resources (Miguel,
2005; Aboderin, 2004; Abt, 1997).
Women’s groups also provide economic benefits to their members through income generating
activities, typically agricultural, and rotating savings and credit associations, in which members meet on a
regular schedule and contribute to a pot which is given in turn to each member. They also provide
members with assistance in emergencies and sponsor labor exchange among members. Many of these
activities have a social insurance component. For example, rotating savings and credit associations
typically allow members with special needs to receive funds earlier than their allotted turn, or allow
5

members with financial difficulties to miss a contribution, with the understanding that this member will
receive a lower payout when it is her turn to receive funds. Most groups distribute the proceeds of
agricultural production equally among all members, independent of actual labor input, providing implicit
social insurance to sick or elderly members who may not be able to work with the same capacity as other
members. Of the reported total value of crops harvested prior to the program we study, 55 percent was
retained by the group for collective use and 38 percent was distributed to members, either in-kind or as
cash (7 percent was given away). Because such a large share of group proceeds are reinvested in the
group as a whole, membership in the group to some extent acts as an investment program, as women who
have spent some time in the group are in effect building up equity in the group, and are repaid when they
receive a share of a group output later, when they are older and weaker.4
The benefits of women’s groups extend beyond their members. Many women’s groups contribute
to community fundraising events (harambees) that are important for raising local funds for public goods
such as schools and health clinics in Kenya (Miguel and Gugerty, 2005; Barkan and Holmquist, 1989;
Thomas, 1987). Women’s groups in Kenya have been critical in campaigns to reduce deaths from the
brewing of illegal liquor and in the prevention of violence against women (United Nations, 2003; Kahler,
2000). Anderson and Baland (2002) argue that women’s rotating savings and credit associations in
Kenya improve women’s bargaining position within the household and Thomas (1988) shows how
participation in women’s associations increases household access to productive resources in Kenya. Even
women who do not join groups could potentially benefit from a stronger bargaining position within the
household as a result of having the option to join these groups (Agarwal, 2001). Tripp (1994) and House-
Midamba (1996) argue that women’s associations and voluntary associations in East Africa help
strengthen women’s civic participation through organizing for the economic and social improvement of
their members and by creating horizontal ties that transcend ethnic divisions.
In addition to providing output for members and externalities for non-members, groups
sometimes create private benefits for leaders. For example, one group leader in our sample, a primary
4 Contributions to social insurance are a public good within the groups and are not fully contractible, so
these groups are potentially subject to collective action problems as Olson (1965) would suggest. Most groups have elaborate systems of fines for members who miss meetings or fail to contribute financially and retain the threat of expulsion for members who do not contribute sufficiently.
6
school teacher in her early thirties, was selected by the government to be an assistant chief, the first
female to ever hold such a position in her area. Her management of the women’s group was cited as a key
factor in her appointment. The extent of private benefits is likely to vary with the person’s characteristics:
older women with little education are unlikely to have much hope of a career in politics or a position with
an NGO. The educated, the young and the male may have relatively more career benefits from group
membership or leadership.
The groups we study are small, locally initiated self-help groups that had been in existence for an
average of 6.7 years and had an average of 21 members prior to the funding project. Almost all the
women in the women's groups have been married, and thus have moved away from their kinship
networks. Older women are somewhat overrepresented in the sample, relative to their proportion in the
Kenyan adult population. Five of the eighty groups in our sample are composed entirely of widows.5
The women’s groups have a horizontal, democratic structure. Group leaders are unpaid, rather
than professionals, and key group decisions are made by consensus or by a vote of members. Leaders are
typically selected by members, either through a voting procedure or by discussion and consensus. The
executive officials - chair, secretary and treasurer - organize and chair meetings, set meeting agendas, and
represent the group at community events. In addition to the executive officials, groups typically have a
large number of other group-specific minor officials such as the Mama Safi who ensures group members
are neatly dressed at meetings. In our sample, on average 31 percent of the group members hold some
kind of official position.
The groups are not elite dominated. Women with secondary education are disproportionately
likely to be executive officials, but the majority of executive officials have no secondary education.
Women’s groups in Kenya typically include some male members (Srujuna, 1996), and in our sample,
roughly 20 percent of group members are male, 73 percent of whom were husbands of female members.
However, men are generally excluded from holding key executive leadership positions. At baseline, 97
percent of executive officials in our sample were women.
The small, rural women’s groups we study are largely autonomous of the formal political
structure. Most receive no outside funding or government support. Some authors argue that politicians
5 Three of the widows groups received assistance and two did not.
7
and the government have tried to replace the horizontal ties among women’s group members with
vertical patron-client relationships with the state, for example through the Maendeleo Wa Wanawake
(Progress for Women) organization, established in the colonial period and later made part of the KANU
(Kenya African National Union) ruling political party. Groups are sometimes visited by Community
Development Assistants (CDAs) employed by the Ministry of Culture and Social Services who are
supposed to provide organizational support. However, in the area we study rural women’s groups do not
seem to be co-opted by the political structure prior to the funding program we study, consistent with
Kabira and Nzioki (1993), Ahlberg (1988) and Thomas (1988).
Subsidies to such groups may be justified due to the external civic benefits that groups provide or
because free-rider problems mean there will be an undersupply of group production and benefits (Olson,
1965). However, free riding also implies that the impact of external support may be attenuated to the
extent that external support crowds out members’ contributions, or that members undersupply
complementary inputs or divert externally supplied group resources to individuals.
Outside assistance could also lead to changes in group membership through a variety of
mechanisms. If outside assistance and human capital are complements in producing group output, then a
shift toward more educated membership may lead groups to recruit these members and group output will
increase as a consequence. However, outside assistance could also lead to a shift toward higher
socioeconomic status membership even if this has no positive consequences for group output. This
would be the case either if external assistance disproportionately raises private benefits of group
membership for those of higher socioeconomic status or if external assistance simply raises the value of
group membership across the board but those of higher socioeconomic status are better placed to take
advantage of the resulting opportunities.
The distribution of benefits from changes in group membership will depend on the system of
property rights. If existing group members hold enforceable individual property rights in membership,
those exiting the group would have to be fully compensated for their share of the group's capital stock
and for the expected discounted future value of membership, including the value of any assistance
expected to be provided to the group. New entrants would have to compensate existing members
equivalently for joining.
8

However, group members may not have fully enforceable individual property rights in
membership, and thus may not be fully compensated for letting others join or for leaving the group. It
may difficult to exclude high status people who want to join. Moreover, membership rights are not
individual, but collective. If higher status people want to join a group, it may well be in the interest of the
majority of existing members to let them in. Since forcing members out relieves others of the obligation
to provide social insurance or share group output with those who exit, the majority may have an incentive
to vote to push out the old, weak, and sick, especially if they can find sufficiently attractive replacements.
In the rest of the paper we first describe the women’s group project, and then test the extent to
which external assistance a) led to a strengthening of groups and expansion in their activity and b) led to
changes in group membership and leadership.
3. The Women’s Group Project
The projects we evaluate took place in two poor, densely populated rural districts in western Kenya,
Busia and Teso. The local economy is based primarily on small–scale rain fed farming for subsistence
and local market trade. Humans are the principal source of farm power, limiting the area that each family
can cultivate. For these reasons, the area has a relatively large amount of fallow land, with estimates in
Busia District that as little as 55 percent of arable land is under cultivation (Bishop-Sambrook, 2003).
According to our data, 74 percent of the land used by groups for agricultural activities is owned by a
group member and was made available by the member for group use without charge. In the other 26
percent of cases, groups rented land, either in exchange for cash, labor, or a portion of the harvest. It is
rare for groups to own land communally. Agricultural production is typically undertaken through
organized sessions where members meet at the group plot to work.
3.A Group Selection and Phase-in, Data Collection
A Dutch nongovernmental organization, International Child Support (ICS), designed and
conducted the project, in consultation with women’s groups and the local Ministry of Agriculture office.
ICS identified 100 operational women’s groups in the area it served through lists provided by the
Ministry of Culture and Social Services and interviews with local Community Development Assistants.
Of these 100 groups, 80 met eligibility criteria for the project, which required that the groups met
9
regularly and were already engaged in group–based agricultural activity.6 Some wealthier groups located
in the district capital were excluded from eligibility. Groups are typically located some distance apart and
we find no evidence that groups are in competition for the same potential members.
Once the 80 eligible groups were selected, the groups were stratified by administrative division,
ordered alphabetically, and every other group was selected to receive training and inputs; we call these
the program groups. At the time of recruitment, the remaining forty groups were notified that they would
not be funded immediately but that the NGO would try to fund them in the future; we refer to these as the
comparison groups. Although no guarantees were given, comparison groups presumably felt future
funding was likely given the NGO’s track record in the area. In fact, the comparison groups were funded
two years after the start of the original program.7 To the extent that members and potential members of
comparison groups expected to receive assistance in the future, they may have begun to change their
behavior during the first year of the project. This would likely bias estimates of program impact toward
zero, making it more difficult to identify program effects. As discussed below, we nonetheless find
significant differences between program and treatment groups in a relatively small sample.
Three sets of surveys were administered to the groups. A baseline survey was conducted at the
start of the project, before the randomization was done or funding provided; the data from this survey are
referred to throughout as pre-intervention data. Fourteen months later a second survey was administered
to assess the impact of the assistance. Follow–up surveys were administered six months after that. These
data comprise the post-intervention data. Both the program and the comparison groups were given a
small set of tools at the time of each survey to compensate them for their time. These were worth about
$3 per member. In general, treatment groups did not differ systematically from program groups prior to
the start of the project, as shown in Table 1.
3.B Project Description
6 Njonjo (1984) finds that 90 percent of women’s group activities in Kenya were agriculturally based. 7 Many groups had some continuing relationship with the NGO after the project. 38 of the original 80 groups subsequently received irrigation equipment with a value of $130 or participated in an agricultural project with a value of $340 after the end of this project. Program and comparison groups were equally likely to benefit from this subsequent funding, which was determined largely by the amount of land groups had to cultivate and the suitability of the land for pump-based irrigation.
10

According to project documents, the two goals of the project were to strengthen women’s
community organizations and to improve agricultural practices and output (Webo, 1997). The
organizational strengthening component consisted of two days of training for three group leaders at a
seminar in the district capital. A Kenyan specialist in the training of community organizations conducted
the training, which emphasized leadership skills, group management techniques, book–keeping, and
project administration using a standard curriculum for the area. Funds for travel, food, and
accommodation were provided to the trainees. The agricultural component included both inputs and
training. Each group received a set of agricultural inputs that included hoes and other implements,
certified seeds for six crops, fertilizer, and pesticide/herbicide sprayers. These were intended for use on
collective group farms but were stored at the homes of individual members since few groups own any
collective property. In addition to inputs, three executive officials and one additional member were
funded to travel to the district capital for five days of classroom instruction and experiential training on
agricultural practices and husbandry at the farmer training center of the Ministry of Agriculture.
The value of assistance was quite large relative to per capita income in the area. The World Bank
reports per capita GDP in Kenya in 2000 was $328; estimates of per capita GDP in Busia district are
substantially lower.8 The project spent $674 per group or an average of $34 per member. Half the total
value of assistance was accounted for by agricultural inputs, 16 percent by organizational and group
management training, and 34 percent by agricultural training. Roughly half the value of the agricultural
inputs (or 22 percent of total assistance) was comprised of seeds, fertilizer and pesticides; the other half
of the inputs were agricultural implements and tools.
Women and long-standing group members were particularly likely to be chosen for the
organizational and management training sessions, but there is some evidence that the agricultural training
session boosted the role of men and younger women in groups. Program groups were invited to send their
three executive officials for agricultural training as well as one additional member of their choice. In
practice, executive officials did not fully utilize the training opportunities in many groups and groups
were allowed to send substitutes. More educated members were statistically more likely to be sent for
training, and since younger women and men had more education, the non-executive members sent for
8 The Busia District office, for example, estimates per capita income in the district in 2002 was $170 (Bishop-Sandbrook, 2003).
11

agricultural training were more likely to be young and male than the typical group member. (Men and
younger women were significantly more likely to attend training sessions, but this effect disappears
controlling for education.) Trainees tended to increase their status in the group. After 18 months of
program participation, 24 percent of the non-executives who had attended agricultural training became
executives. Seven non-member men were sent for training and subsequently became group members. No
non-member women received agricultural training.
5. Agricultural and Financial Outcomes
To the extent that group members face a choice of whether to use resources in group or individual
production and that land, labor, and capital are complements in agricultural production, donations of
capital to groups should be expected to lead to increased member contributions of land and labor to group
production, but to crowd out member contributions of capital and perhaps even lead to diversion of
donated capital out of groups to individual production.9 Empirically, we find that external assistance led
to much less than proportional increases in use of complementary inputs in group production and to
increases in group production that were much less than the value of inputs provided. There is some
evidence of diversion of inputs to individual production, particularly to leaders' farms.
Recall that the program provided more than $674 in assistance to program groups, of which $337
was direct agricultural inputs. The inputs provided were sufficient to cultivate at least 3.5 acres of land.
Since the typical comparison group had $243 in assets before the project started, this represents an
increase in capital stock of almost 140 percent. This increase in the capital of the group, however, led to
much smaller increases in land and labor input. We present data for both agricultural seasons, the main
season known as the “long rains” in which grains and the main staple crops are planted and a shorter,
9 To see this, note that economic efficiency would require that the productivity of resources inside and outside the group be equalized at the margin. In the arguably more plausible case in which there is free riding within groups, the marginal product of inputs in group production will be greater than in home production. Even in this case, however, the ratio of the marginal products of land, labor, and capital between group and home production should still be equal, or individuals could increase both their home production and group production by reducing one type of input to the group and increasing another in its stead.
A donation of capital to a group will lower the marginal product of capital in group relative to home production and raise the marginal product of land and labor in the group relative to that in private production. Restoring equality in the ratios of group and home marginal product between various inputs will require some combination of reduced member contributions to capital, diversion of capital away from the group, and increased land and labor provision by members. If the production function is homogenous, then land, labor, and capital in the group should all increase in proportion.
12

secondary season known as the “short rains.” Treatment groups planted about half an acre more each
season than comparison groups (Table 2). This represents a 70 percent increase over the average planting
of comparison groups. The increase in planting was only 30 percent of the 3.5 additional acres that could
have been cultivated by program groups using the additional inputs provided by the project.
The typical program group member spent an additional nine hours working on group agricultural
production during the main agricultural season (column 2) but only a statistically insignificant two
additional hours in the subsequent short rains (column 5), representing overall a 30 percent increase over
the labor inputs of the average comparison group member. Point estimates suggest that during the long
rains output was $18 higher in program groups than in comparison groups (column 3) and only $4.20
higher in the short rains (column 6), but neither figure is statistically significant. These point estimates of
the increase in agriculture output are only three percent of the total value of agricultural inputs and
training received. Even if one neglects inputs such as training and tools that should yield a return over the
long-run, the increase in the harvest was only six percent of the value of inputs such as seeds and
fertilizer which should have paid off within one season, suggesting that if any significant share of the
inputs indeed went towards group production the return was spectacularly negative.
The disappointing increase in output could be due to inadequate increases in complementary
inputs supplied by the members or diminishing returns in group activities. Another explanation for the
limited increase in land and labor input as well as overall output on group land is diversion of inputs to
members for individual use. Surveys conducted after the project ended indicated that 70 percent of the
program groups reported distributing project seeds to members for use on their individual farms,
although only 29 percent gave seeds to every member. Fifty-eight percent of program groups report that
project fertilizer was distributed to individual group members. The actual numbers may be higher if
groups were reluctant to report this to enumerators. Of course group members may be acting rationally in
diverting inputs to individual use, and indeed this may even be collectively rational as well. However, if
the aim of the program is to boost the activity of local community associations, it is important to
recognize that a considerable share of funds provided may not go to group activities.
Estimates of the extent of diversion are necessarily speculative, but if one assumes a rough
proportionality in input levels, it is possible to hazard a guess. Overall the program generated a 30
13
percent increase in labor input over the comparison group levels and a 70 percent increase in land inputs.
If the proportionate increase in capital used in group production was halfway in between the increase in
land and labor inputs, at 50 percent, this would mean that about $175 of the agricultural inputs provided
to the groups went towards group cultivation and $161 was converted to individual use. The extra labor
supplied by group members was worth about $1.60 per member or $32 per group, while the rental value
of the additional land supplied was worth about $25 per group. This would imply that when the NGO
gave $337 in direct agricultural inputs, about $175 + $32 + $25 = $ 232, or just under 70 percent of the
direct agricultural resources provided went into group production, with the remainder either crowding out
member contributions or being diverted.
The limited data available on individual cultivation indicate that some diversion may have taken
place, but the average group member (as opposed to executives) did not benefit significantly from any
diversion. Data are available for individual cultivation on home farms during the short rains period
following the intervention for those crops for which the NGO provided seeds. Individuals in program
groups cultivated slightly less acreage of these crops than did individuals in comparison groups (Table 2,
column 7). Non-executives in program groups were also no more likely to use fertilizer on their home
crops than were individuals in comparison groups (column 8). Among executive officials, however, those
in program groups were 12 percent more likely to use fertilizer than executives in comparison groups
(column 9). Overall, the program does not appear to be an effective tool for increasing group output, as
measured by collective agricultural production. We examine next whether the program affected other
indicators of group strength.
6. Group Strength and Community Interaction
Group members report more positive subjective assessments on the quality of group leadership to the
NGO. However, we find no evidence that the program improved objectively measurable indicators of
group capacity. Members of program groups did not participate more in non–agricultural group activities
than did comparison groups during the project, nor did the internal solidarity of program groups improve
as indicated by objective measures of group activity. There is no evidence that program groups created
14
more positive externalities than did comparison in terms of attendance or contributions at public
harambee fundraisings.
6.A Group Strength
Individual members in program groups are more likely to report that group leadership had
improved in the program period (Table 3, Panel A, column 1).10 The reported improvement in leadership
could reflect actual improvements in group functioning, bias due to more general positive feelings about
the groups after receiving massive external support, or a desire to report positively to donors, since the
training explicitly addressed quality of leadership and the running of meetings. As we discuss below,
people of higher status assumed leadership positions following the program, and it is possible that
members are more likely to view high status leaders positively, even if their objective performance is
worse (see Duflo and Topalova, 2004).
We therefore examine objective as well as subjective measures of performance and group
cohesion. The change in attendance rates at general meetings from pre- to post-intervention is not
significantly different in groups that received funding (Table 3, Panel A, column 3). The point estimate is
actually lower. Program groups do not meet more often than do comparison groups (column 4). Program
groups do not visit a member’s home to give emergency assistance at higher rates than comparison
groups, nor do they support members with higher amounts of cash assistance (columns 5 and 6) or
through donations of food or labor (not reported). Program groups do not meet more frequently for their
rotating savings and credit association (rosca) activities than comparison groups (column 7) nor do they
have higher monthly contributions (column 8).
6.B Community Interaction
One rationale for assisting community groups is that these groups create positive externalities. However,
there is little evidence that the groups funded through the project did more to assist their neighbors.
Program groups neither have greater participation in harambee community fundraising events (Table 3,
Panel B, column 1), nor do they give higher amounts at such fundraisers on average (column 2).
One reason that the funding NGO wanted to provide assistance to women’s groups was to
stimulate the growth of networks and the diffusion of information on agriculture and nutrition among the 10 Older members are less likely to report improvements in program groups, but the coefficient is not significant.
15

community, particularly among women. There is no evidence, however, that groups receiving funding
had higher levels of contact with other women’s groups: program groups did not receive any more visits
from other women’s groups than did comparison groups (not reported).
NGO assistance crowded out assistance from other sources for program groups, although the
resources crowded out were trivial relative to those provided by the funding program. Program groups
received lower levels of cash grants during the post-intervention period than did comparison groups
(column 3) although the average level of grants to comparison groups is only $11 per group. Likewise,
program groups on average received fewer in-kind donations (column 4) than did comparison groups in
the post-intervention period, but the average number of in-kind donations in comparison groups was only
0.13 per group during this 14 month period.
The most marked impact of funding on community interaction is the increase in visits from
government officials. Program groups received 75 percent more visits from agriculture and health
extension agents than did comparison groups, representing 2.5 visits more than comparison groups in the
year following the intervention (column 6). One hypothesis is that treatment groups required more advice
from extension agents, since they were given access to new technologies. However, program groups also
received nearly twice as many visits from local government officials (chiefs, elders, and district officials)
than did comparison groups. Program groups received on average 5.5 more visits from local government
officials (column 7). This suggests a move towards more vertical, patron-client relationships between
government officials and groups.
7. Entry into Group Membership and Leadership
The program increased the participation of advantaged individuals in groups, changing the very
characteristics of the groups that made them attractive to funders in the first place. New members in
program groups were better educated and more likely to have formal sector income than their
counterparts in comparison groups. More new entrants, men, and women with secondary education
assumed leadership positions in program groups. Payments by new entrants and leaders were small
relative to the extent to which their entrance diluted the value of group assets for existing members, and
16
since there is no evidence of improved group functioning, it seems likely that this new entry harmed the
original members.
7.A Entrance into Group Membership
A regression of the number of new entrants on an indicator variable for receiving assistance
shows that program groups have twice as many new entrants as comparison groups. The average program
group had almost four new entrants over the eighteen months between surveys (Table 4, column 1); the
average comparison group had two. (As discussed in Section 8, exit also increased, thus no significant
increases in program group membership are seen, consistent with there being some optimal group size.)
New entrants in program groups were roughly twice as likely to have formal sector income, have
secondary education, and be from outside the village as their counterparts in comparison groups. The
proportion of new entrants with formal sector income was 11 percentage points higher in program groups
than in comparison groups; this result is not quite significant at the five percent level (Table 4, column 2).
Female entrants were 12 percentage points more likely to have a secondary education in program groups
than in comparison groups, and the difference is significant at the ten percent level (column 4). New
entrants were 27 percentage points more likely to be from outside the village (column 5). The proportion
of new entrants who were married is 4 percentage points lower in program groups (column 6).
The increase in entry came immediately after the project started, suggesting both that new
members joined in time to take advantage of the material inputs available under the program, and that
new entry was not solely due to the agricultural training. During the first six months of the project, when
organizational training was conducted but before inputs were distributed, 52 people joined program
groups, while 15 joined comparison groups. During the next four months, when agricultural training and
input provision took place, 50 people joined program groups and 17 joined comparison groups. In the
final four months, 25 people joined program groups and 25 also joined comparison groups. In the first 6
months of the project, new entrants in program groups had significantly higher years of education than in
program groups at the 5 percent level; this difference between program and comparison declines over the
next 8 months of the project (not reported). Program groups also had a higher proportion of new entrants
with formal sector income in the first 5 months of the project than did comparison groups, significant at
the 10 percent level. This difference also declines over the next eight months.
17

7.B Entry into group leadership
There is some evidence program groups were more likely to change leadership. During the
project period at least one new executive official entered leadership in 53 percent of program groups as
compared to 35 percent of comparison groups (Table 5, Panel A, column 1). This difference is not quite
significant at the ten percent level. Program groups are 12 percentage points more likely to have an
executive official who was not originally a member at the start of the period (column 2). Men and better-
educated women were more likely to take on leadership roles in program groups. The change in the
proportion of men who hold executive positions is four percent greater in program groups than in
comparison groups (column 3). The change in the proportion of female executives with secondary
education is four percent greater in program groups than in comparison groups (column 5), significant at
the ten percent level. Since at baseline only about 3 percent of executive officials were male, and less
than 40 percent of females had secondary education, these are large changes over a short period.
7.C Payments for Membership and Officership
There is some evidence that people paid more to join program groups and become officers in
these groups, but these payments were very small relative to the $34 per member value of the program,
suggesting either that the assistance was not valued by members or that those joining the assisted groups
may have received substantial rents. Although more people paid to join program groups than comparison
groups (Table 5, panel B, column 1), point estimates suggest program groups collected only $2.74 more
in entrance fees per new entrant than did comparison groups (column 2), and this difference is not
statistically significant.
There is limited evidence that new entrants in program groups paid to get into groups through
non-cash means, such as donating land to be used for group cultivation. Four new members in program
groups provided land for the group to cultivate; none did in comparison groups. This difference is
significant at the 5 percent level (column 3). Of these four members, two received compensation of
roughly $9 for the use of their land. The average amount of land donated by these four group members
for cultivation was 0.32 acres; the rental value of 0.32 acres of average quality land in the area was
roughly $8.30. The uncompensated value of donated land is therefore $15; this has a value of $0.10 per
new entrant to program group. If groups collected $2.74 in cash plus $0.10 in rental value of land per
18
new entrant on average, the total average payment of new entrants was roughly $2.84, less than 10
percent of the $34 per member in benefits provided through the program and an even smaller fraction of
the per member value of total group assets, which also include the $11 per member assets groups had
accumulated on their own before the NGO program began. One interpretation of this is that new entrants
appropriated approximately $45 - $2.84 = $42 from existing members. This amounts to well over 10
percent of GDP per capita. Another interpretation is that the NGO inputs were not valued heavily, but it
is worth noting that member contributions were worth considerably less than even pre-existing group
assets per member.
There is some evidence that program group members who made in-kind contributions were more
likely to secure an official position. In the first post-intervention planting cycle, the probability of a group
promoting at least one individual whose land was used for group cultivation to an executive position was
8 percent higher in program groups; this is nearly significant at the 5 percent level (column 4). Among
people providing land for group cultivation, those in program groups are 17 percentage points more
likely to be promoted to an executive position than their counterparts in comparison groups (column 5).
Hypothetically, the new entrants could have contributed to the groups through human capital or through
labor. However, if these contributions are substantial it would presumably be reflected in higher
agricultural output or in better group functioning. We saw no evidence of improvements in these areas.
Overall, external assistance increased entry into groups, and led people with higher socio-
economic status to enter group membership and leadership. New entrants and leaders seem to have paid
something in exchange for these positions, but the amount they paid was not worth much, much less than
the value of the assistance provided to groups, or than the per member value of the assets accumulated by
group members.
8. Exit from Groups
One might have expected the program to sharply decrease exit rates from groups due to the
greater financial benefits of membership in assisted groups, especially as there is no formal mechanism
for cashing out the value of membership. In fact, overall exit rates from program groups were not
statistically different than in comparison groups (Table 6, column 1), but the nature of exit changed.
19

Fewer members left due to difficulty paying fees, consistent with the greater financial benefits of
membership, but exit due to conflict doubled (columns 2-3). Older, female members were
disproportionately likely to leave in program groups. The proportion of those leaving groups or becoming
inactive during the project period who were female and older than 50 was more than twice as great in
program groups as in comparison groups (column 4). The absolute probability of a woman over 50
leaving or becoming inactive is fourteen percentage points higher in program groups than in comparison
groups representing a more than 60 percent increase over the base exit rate of 18 percent. As noted
earlier, older women are particularly socially isolated in this society, due to the combination of exogamy
and patrilocal residence. Moreover, since more than half of group agricultural production was retained by
the group prior to the project period and since effort is required to organize and register groups, write
bylaws, and attend meetings, older members will typically have invested a fair amount in groups. There
is no evidence that members leaving groups received any compensation for their years of investment in
the group.
The rate at which members left program groups is particularly high after inputs were distributed.
In the first year after our baseline survey, exit rates due to conflict were only somewhat higher in
program groups, but over the next six months, eleven people were cited as leaving program groups due to
conflict, whereas only one member left a comparison group due to conflict. Anecdotal evidence suggests
that there was conflict over use of inputs, such as tools, that had been provided to the groups.
9. A Model of Group Dynamics
The previous sections of the paper suggest that a static analysis, assuming that group composition will
stay the same in the face of external funding, will yield misleading inferences about the impact of outside
funding on the strength of organizations of the disadvantaged. In this section, we construct a dynamic
model of how groups evolve over time as existing members leave and the remaining members select new
members from among those who want to join. While the previous sections of this paper take advantage
of the random order of program phase-in to show that people of higher socioeconomic status join
women’s groups that receive external funding, this section is based on the premise that people will more
20

generally seek to join groups that are able to deliver more benefits to their members and will avoid
organizations that extract too much from their members relative to what they deliver.
We assume groups vary in the ability to deliver benefits to members. This could be due to
variation in outside funding, but it could be due to other causes as well, such as differences among groups
in assets, political connections, or internal norms. We also assume that when groups select among new
applicants, they will typically prefer to admit those who can bring more to the group and that this will be
positively correlated with socioeconomic status. The model implies that in steady state, as suggested by
Walzer (2002), the disadvantaged will either have weak organizations or not participate in civic
organizations at all. The model is designed to apply to the women’s groups we study, but we think the
results may be relevant to civic groups more generally in contexts in which there are effective limits on
group size and formation of new groups, different individuals can differentially contribute to groups, and
groups differ in the ability to deliver services to members.
Subsection A sets out the assumptions of the model, subsection B solves for the steady state, and
subsection C discusses extensions and implications.
9A. Assumptions
Suppose that people live for two periods: prime age and old age.11 They work in prime age, and,
with potentially diminished capacity, in old age. Each period, the old die, the prime-age become old, and
a new population of prime age workers enters the labor force. Each generation has an infinity of
individuals.12 At the beginning of each period, a new generation of prime-age workers can apply to join
groups and the existing, newly old, members of each group decide which applicants to admit. Joining a
group involves some fixed commitment of time to the group, which could otherwise be spent in
individual production.13
It is likely to be the case that the larger the group size, the more difficult it will be to manage free
rider problems within the group. We will assume that group size is fixed at N. This corresponds to the
extreme case when free rider issues can be managed perfectly within groups up to some size N, but
11 One could also assume a period of youth, in which people go to school, but do not work, and do not join groups. 12 This assumption is technical, letting us avoid complications from heterogenous groups. 13 For simplicity we will assume that people can be members of only a single group, but the results would generalize readily to the case in which people had time to be members of up to some fixed maximum number of groups.
21

cannot be managed at all for larger sizes. We assume that groups have N/2 prime-age members and N/2
old members.14
People enter prime age differing in the ability to contribute to groups, which we call
“productivity.” In the context of the women’s groups we study, productivity would incorporate physical
strength, agricultural knowledge, the ability to interact with donors and political leaders, and ownership
of land, tools, or other assets that might be of use to the group. In an organization of parents sponsoring a
children's soccer league, it might include the ability to coach kids, ownership of a minivan, or
organizational skills. We assume a person’s productivity in the group is positively correlated with his or
her individual earning ability, which can be taken as a measure of socioeconomic status.15
Suppose that if person i has an initial productivity Li,p when prime age, her productivity when old
is ipioi LL εδ +−= ,, where δ is the average loss in productivity with age and ε is random variation in
health. (The assumption of lower productivity among the elderly is the main assumption of the model
that is designed to be specific to the context of women’s groups we study, but it is important only for the
result that elderly members will be the most likely to be expelled in the extension of the model in which
members can be forced to leave.)
Suppose that an individual j can produce Lj working on her own and that a group G with N/2
prime age members and N/2 old members can produce f(Lg , Xg), where Lg = ∑∑==
+2
1,
2
1
N
joi
N
ipi LL , and Xg is a
group-specific productivity term that depends on group-specific characteristics such as the right to use a
particularly productive or unproductive plot of land, the efficacy of controlling free riding within the
group, or favorable and unfavorable relationships with donors or government officials. We will assume
in particular that group output is equal to the sum of member productivity and group productivity, Xg.16
14 Note that if we did not constrain groups to have N/2 prime age workers and N/2 old workers, then there might be cycles in membership, with some groups having large cohorts in odd periods and small cohorts in odd periods. We conjecture that with adjustment costs in group size, however, groups would wind up evenly balanced across cohorts in steady state. 15 Of course this correlation is not perfect. Incorporating an imperfect correlation would yield a positive correlation between socioeconomic status and group membership in steady state, rather than a cut-off level of socioeconomic status above which people join groups and below which they do not. 16 Note that if L and X are complements, so total output in society is maximized by assigning high productivity people to work in highly effective groups, there will be an additional force leading high socioeconomic status
22

Xg represents the net effect of group activities, such as roscas and targeted help to needy group members,
and productivity losses due to free-riding. In particular Xg may be negative. Assume there is a continuous
distribution of L and X and that individuals have constant absolute risk aversion with parameter a,
implying that risk aversion does not depend on wealth. Utility is [ ]211 acac eea
−− +− where c1 and c2 are
consumption when prime age and old respectively. We make the assumption about risk aversion to
ensure that all individuals get the same insurance benefits from groups and discuss relaxing the
assumption later.
In addition to the assumptions about the production and utility functions, we make an assumption
about the functioning of groups that will generate a motive for members of groups to prefer high
productivity applicants to those of lower productivity when deciding which new applicants to admit. In
particular, we assume that the groups require a fixed time contribution from each member and that while
some proportion of group output may be distributed in proportion to members’ productivity, there is at
least some proportion that is distributed equally. There is both theoretical and empirical justification for
this assumption. Since workers are risk averse and are subject to random shocks to their labor
productivity, members of each generation would want to commit to egalitarian redistribution ex ante
when they join groups. Moreover, if the distribution of shocks is right skewed, so the mean level of
productivity is greater than the median level, then an ex post vote among members would lead to such
redistribution because the median voter will prefer at least some redistribution (Kremer,1997).
Empirically, almost all groups require similar time contributions from all members and divide output
equally. If groups divide at least some share of output equally among members, then existing group
members will prefer to admit higher productivity applicants, because they will wind up obtaining a share
of their output.17
people to be selected together into the strongest groups, but we argue here that even in the absence of such factors there may be sorting across groups in steady state. 17 Hypothetically this preference for admitting members of higher productivity could be neutralized by a system of higher entrance fees for applicants with low productivity, so that existing members would be indifferent whether to accept high or low productivity applicants. However, empirically, in the context we examine, observed entrance fees are typically very low. This may well be due in part to borrowing constraints that make it difficult for low skill workers to pay high enough entrance fees to induce groups to admit them in preference to higher skill applicants. Indeed, it is standard in overlapping generation models to assume that each new generation starts out without capital. It may be particularly appropriate in this context to assume that the women in each generation of the lowest socioeconomic status would have difficulty saving enough to pay substantial entrance fees to join groups. There is
23

Suppose that the process for recruiting new group members works as follows. At the beginning
of each period, prior to the realization of health shocks, new prime-age workers decide which groups they
wish to apply to and the newly old members of each group vote on which prime-age applicants to admit.
Stable matches will be those in which a) there is no case in which both a group and an applicant would
prefer for the applicant to be in the group but the applicant is not in the group, and b) there is no person in
a group who would be better off producing individually. Equilibria are assignments of people to groups
such that all matches are stable. (Here we consider the case in which once a member joins he or she
cannot be removed, but in the next subsection we discuss an extension in which existing members can be
removed. We assume there are sufficient social sanctions available to the group that no member leaves in
order to default on obligations to fellow members.) We assume that applicants cannot borrow to finance
payments to the group in exchange for membership.
9.B. Steady States
In this subsection, we solve for steady-state equilibria given the assumptions above and some
initial distribution of groups with associated levels of member benefits, X. We will define a steady state
as an equilibrium in which the distribution of initial productivity of group members, L, stays constant
over time.
Note first that groups providing sufficiently low benefits for members cannot exist in steady
state. If the level of X in a group is too low, the cost of membership will outweigh the benefits of group
membership relative to private production: in our context such benefits include insuring against shocks
such as risks to one's labor endowment and providing a savings mechanism as members contribute more
valuable labor when prime-age and in exchange build up "equity" in the group that allows them to share
output with prime-age members when old. In civic groups in general, benefits may include other benefits
such as the health benefits of participating in a soccer club or the enjoyable nature of group activities.
Proposition: There will be a cutoff value of Xg , denoted Xc , such that no group with X < Xc will exist in
steady state. More generally, no group with X < Xc can sustain itself indefinitely.
evidence that intrahousehold dynamics make it difficult for women to save in this environment, and in fact some argue that a principle role for women’s groups run is to shield savings from husbands and other family members (Anderson and Baland 2002).
24

Proof: Denote the net insurance and savings benefit to a prime-age worker of productivity L of joining a
group at time t, conditional on people of type L joining at t-1 and t+1 as B. B is the difference between
expected utility in the group and in individual production. Expected utility in individual production for
person i is U(Li) + E [U (L i δ− + iε )]. Expected utility in a group of people of the same productivity
level is:
⎟⎟⎟⎟⎟⎟
⎠
⎞
⎜⎜⎜⎜⎜⎜
⎝
⎛+−
−∑=
N
XLEU
gj
N
j][
2
2
1εδ , so that B =
⎟⎟⎟⎟⎟⎟
⎠
⎞
⎜⎜⎜⎜⎜⎜
⎝
⎛+−
−∑=
N
XLEU
gj
N
j][
2
2
1εδ - ( ) ( )[ ]iLUELU εδ +−−
Define Xc as the level of X such that if Xg =Xc , people with the same prime-age productivity join a
group each generation and B will be exactly equal to zero. Because individuals are risk averse, Xc < 0.
It is straightforward to see that there cannot be a steady state in which members of the same
initial L join a group with X < Xc every generation, because then members would have been better off
producing individually. This implies that people will only join a group with X< Xc if they expect that the
average productivity of other members of the group over their lifetime in the group to be higher than their
own by at least some small amount, ε . Yet this violates the definition of steady state above.
More generally, groups with X < Xc cannot persist indefinitely because each generation cannot
have at least ε lower productivity than average in their group over their lifetime. In a group with low X
but high productivity, initial members may attract lower productivity members in the next generation, but
eventually a time will come when there are not enough potential members of at least ε lower
productivity to replace existing members. ■
It is possible to show that in steady state either the disadvantaged will not be members of any
group or they will be members of weaker groups than more advantaged people. Denote the number of
groups with X > Xc per person as q. Formally,
Proposition: There is a steady state equilibrium in which all sustainable groups have N
members, for any two groups i and j, implies ji XX > ji LL > , where bars denote group averages, and
if q < 1/N then there is a cutoff level of L below which no one is a member of a group, and above which
everyone is. Furthermore, if the distributions of L and X have positive support along their complete
ranges there is no steady state in which and ji XX > ji LL < for any i, j.
25

Proof: Recall that free rider problems limit the size of a group to N. Thus if there are fewer than
1/N groups per capita, some individuals will not join groups. All individuals prefer to join sustainable
groups, and all groups prefer to admit another member with at least as high productivity as the group
mean, because of risk aversion. To see that there is a steady state in which the most advantaged people
are in the strongest groups, note that if at time t there exists a situation where all groups with high
member benefits also have higher member productivity,ji XX > ji LL > and if the same is true at
time t + 2, then at time t + 1 all applicants will prefer to join groups with higher X. Since all groups
prefer to admit applicants with higher L, the unique equilibrium will be for workers and groups to pair in
order of desirability. Induction implies this will be a steady state such that groups begin with
and
ji XX >
ji LL > in every period.
To see that there cannot be a steady state in which and ji XX > ji LL < , note that if the rank
order of groups in X were different than the rank order in L, then members of a group with the jth highest
level of X and the ith highest level of L, where j< i could recruit members of slightly higher L than
themselves, since in this case the new members who joined the group would have discretely higher X and
only slightly lower level L than their co-members. Thus this cannot be an equilibrium.■
There is no steady state in which a prime-age person of productivity L ′ does not join a group and
a person of productivity L < L ′ does join. To see this, note that this would imply that there must be some
productivity level, , such that someone with slightly higher productivity than is not a member of a
group and someone with slightly lower productivity is a member of a group with X >X
^L
^L
c. But in that case
the person with L > would prefer to have joined the group and the members would have preferred that
applicant to one they admitted. ■
^L
It is worth noting that we do not show that the steady state above is unique. We focus here on the
most favorable equilibrium, i.e., that in which all existing groups with Xg > Xc survive with qN <1 and
otherwise the 1/N groups with highest X survive.
The proposition implies that starting from a steady state, an increase in Xg of a group with
disadvantaged members, whether due to an outside aid program or the efforts of its own members, will
26
have only a temporary impact on the correlation between social status and group membership in society
or on the relative strength of groups of the advantaged and disadvantaged. (This would not be the case if
a group originally had X < Xc and the assistance raises the group’s X above Xc, making a group viable in
steady state that would not have been viable otherwise.) If groups spend all their assets, there will be no
long-run effect of an infusion of capital into groups, but this proposition implies that even if infusions of
capital and training programs permanently raise a group’s X, in the long run this will simply lead higher
status people to join the group. The process may take some time, however. To see this, note that starting
in steady state, if a group i has a positive shock to X, it will be able to attract higher productivity new
members in the next period. The presence of these higher productivity numbers will enable it to attract
members of still higher productivity in the period following that. Asymptotically, the human capital
level of its members will approach the level that will be commensurate with its new X. 18
9.C. Discussion and Extensions
Under the model, those of higher socioeconomic status will have stronger groups in the sense
that they belong to groups that are able to provide greater benefits to members, i.e. with higher X. Those
of lower socioeconomic status will either not be members of any group or members of weaker groups.
This is consistent with the claims of Walzer (2002) and the findings of Almond and Verba and
subsequent writers.
In the model, there is no overall social efficiency gained from sorting of high-productivity people
into groups with high X and L.19 High productivity workers are asked to join groups with other high
productivity members and with high levels of X purely because this is the way that previous generation of
members of these groups can extract the most benefit. But of course the allocation of members to groups
may affect total output. To the extent that there is complementarity between X and L, as seems plausible,
18 To see how groups respond over time to changes in X, without loss of generality order the groups by X so group i has the ith highest X. By the previous proposition, it will also have the ith highest productivity members at t = 0. If X increases for the ith group at time 0, then at time 1, the group will still have old members with productivity rank order i, but will have capital X with rank order j, where j < i. It will have overall desirability i1, where j < i1 < i, and hence will attract members with productivity of rank order i1. By induction, this implies that j < i2 < i1 < i, where i2 denotes the attractiveness of the group at time 2. As this process repeats, worker productivity will asymptotically approach rank order j.
19 Total output in society is independent of who is a member of which group, given the assumption that output is additive in L and X.
27
there may be efficiency gains from this type of matching. Indeed with complementarity between
individual productivity and collectively produced benefits, there would be matching of high skill workers
together in the groups with highest X even in the absence of institutional tendencies of groups toward
sorting.
A key result of this model is that when the number of groups is limited and individuals cannot
borrow to pay entrance fees, even a slight difference in the ability of individuals to contribute to group
output may lead to a very big difference in participation in organizations among people of high and low
socioeconomic status in steady state, even without any innate complementarity between group and
individual productivity. Note an important difference from views that stress the importance of education
for participation in associations. In this model differences in the strength of organizations between rich
and poor or educated and uneducated will not just be proportional to the differences in the ability of
individuals to contribute to these organizations, but may wind up being much greater, because the rich
and educated will be in a better position to secure membership in the strongest organizations by virtue of
their ability to contribute more to group output.
Thus, rather than seeing differences in participation between people of different levels of
education solely as a matter of a personal propensity, albeit perhaps one that can be changed by
education, the model suggests that these differences may in part be a social phenomenon. Those with
higher income wind up with beach houses. This is not because they are necessarily better at building
them but simply because they can purchase them. A similar process may take place with organizations.
However, if norms or credit constraints make it difficult to simply purchase membership in organizations,
then what group one joins will depend on how much one can contribute to the organization and therefore
how desirable a candidate is to the existing members of the organization. If there are no cash payments,
then this may depend on the personal qualities of the individual - on human capital as much as physical
capital. This can help explain why there may be a stronger correlation between individual social status or
human capital and participation in organizations than between income and participation.
One question is whether this process could be limited if organizations put clauses in their
constitutions limiting membership or leadership to members of disadvantaged groups. It is worth noting
that 1) only groups with a strong ideological commitment to serve the disadvantaged will make such
28

commitments in the first place; 2) constitutional provisions that restrict organizations’ ability to choose
members and leaders may create costly inflexibility; and 3) it is hard to make such provisions stick,
because in the future members may, at the margin, prefer admitting higher members of higher
socioeconomic status. Even the Chinese Communist Party recently decided to admit capitalists. Note
also that the changes outlined here do not have to take place suddenly. They may take place over quite a
long period. Some organizations may be constitutionally committed to open membership, but even in
these organizations there may be a limited number of slots that are particularly attractive and people may
want to join only if they have a realistic chance of obtaining one of these slots. In this case, much of the
previous analysis will apply even to open-membership organizations.
In the analysis above, we considered the case in which it is impossible to expel existing
members. We now consider informally the case in which groups can expel members. Groups will
typically expel elderly members who receive productivity-lowering shocks and increases in assets will
make them more likely to expel members. Suppose that at the beginning of each period each group
selects a leader who can explicitly or implicitly propose a change in group membership, which is subject
to an up or down vote. If the proposal is voted down, then there are no further opportunities to expel
members. Suppose expelling a member causes disruption and this effectively reduces output by an
amount ω , perhaps in part because it damages the group’s reputation and makes it harder to recruit
members in the future.
Consider a group that is in steady state and experiences no shock to its capital stock. If ω is
small enough, then the leader will have incentives to propose letting a bare majority of existing members
stay and kicking out the 49% of existing members with the lowest productivity. This allows the
remaining members to expropriate the implicit value of their share of the capital stock and avoid having
to share output with lower productivity members. If ω is large enough, the chairlady will not propose
kicking out existing members. There will be a critical level of ,, critωω below which groups will expel
some members. Of course if groups kick out members often enough this will reduce the insurance
benefits of groups and may break equilibria in which groups exist in steady state.
To see that grants to groups will make them more likely to expel elderly members of low
productivity, note that the larger the assets of the group, the less the incentive to share them with
29

additional members. Therefore the critical value of ‚, critωω below which groups will expel some
members will fall in response to an exogenous increase in the group's capital stock.
The model abstracts away from the question of how groups are initially formed and how they
exit. It could be generalized by assuming that groups exit with some probability and that with some
probability people are able to spontaneously form a group. This would produce a steady-state distribution
of groups. In the limiting case as the exit and entry probability approach zero, the distribution will
converge to the distribution shown here. More generally, the distribution would look similar, but with a
bit of churning as new groups enter and approach their steady state. In the limiting case when groups
enter and exit infinitely rapidly, the propensity of people to be in groups in steady state will be simply
their propensity to form groups and the effects described in the model will not arise.
We conjecture that in such a dynamic model, the ratio of population to groups will depend on the
relative entry and exit rate of organizations. If the entry rate is relatively high then both rich and poor will
belong to organizations in steady state, but those of higher socioeconomic status will disproportionately
belong to stronger organizations (those with higher X), even if low and high status people create
organizations at the same rate and with the same distribution of efficacy. One plausible scenario is that
creating groups of low X is relatively easy, but all groups are subject to shocks to X. Then organizations
of the poor will be fragile and transient, either surviving and turning into organizations of the more
advantaged, or atrophying and exiting. This is consistent with the tendency noted by many scholars for
organizations of the poor to change their mission, leadership and membership away from a focus on the
poor (Piven and Cloward, 1979; Payne 1995).
This may help clarify why this model differs from theories in which higher socioeconomic status
people or more educated people simply have higher propensity to form or join organizations. In the
limiting case as groups enter and exit very quickly, our model would reduce to such a model. To the
extent that opportunities for groups to enter/exit occur only at certain times, differences in participation
rates with individual characteristics will grow.
Finally, it is worth noting that our model does not imply that the only reason that those of lower
socioeconomic status are less likely to participate in associational life is that they are pushed out of
successful organizations by people of higher socioeconomic status. This would not, for example, fully
30

account for differences in participation between geographic areas with different income or education
levels in places with limited geographic mobility. It seems reasonable that there are other channels as
well.
10. Conclusion
At least since the work of Almond and Verba (1965) it has been known that the poor and
disadvantaged are less likely to participate in civic associations. This lower participation rate has been
seen as an impediment to political influence and economic development. Policy makers have sometimes
responded by funding community associations, as in the War on Poverty in the United States, or in recent
international development programs designed to promote community driven development. Yet it has
been extremely difficult to rigorously assess either the causal impact of these programs or the causal
relationships underlying the correlation between socioeconomic status and participation in civic
associations. Many causal stories are potentially plausible and a host of factors could potentially
confound attempts to empirically disentangle causal links.
This paper takes advantage of a rare opportunity to assess causal impact by comparing
community groups that had been randomly chosen for early phase-in of a program providing funding
with groups that had not yet participated in the program. We find that new entrants in groups receiving
funds are twice as likely to be from outside the village, have secondary education, and have formal sector
income as new entrants in comparison groups. Program groups are more likely to elect new officials and
to have a new group member in an executive position, and the newly elected executive officials in
program groups are more likely to be male. The assistance appears to have reduced the role of the most
disadvantaged members of these groups. The exit rate of older women increased by two-thirds as a result
of the program, and the rate at which members left due to conflict doubled. Departing members were not
compensated for their contributions to the groups’ capital stock over the years, and entrance fees paid by
newly joining members were far less than the per member value of the assistance or of the other assets
groups had built up over time.
While increasing the role of higher status individuals could theoretically have positive effects on
group activity, and members report more positive subjective evaluations of group leadership, we find
31

little objective evidence of positive impacts on group output, organizational strength, or community ties.
Program groups have no additional contact with other community groups but appear to become more
vertically tied to local administrative officials.
These results may create a dilemma for those, such as former World Bank President Wolfensohn
quoted earlier, seeking to strengthen organizations of the poor. Strengthening the material status of these
organizations may induce changes in membership that lead them to no longer represent the
disadvantaged. While it is impossible to completely rule out the possibility that the impacts we identify
were due to particular features of the environment or the program, we think it would be a mistake to
simply dismiss these findings as an artifact. Compared to many other efforts to fund civil society, this
program was organized in a way that was relatively sensitive to power relationships and the dangers of
elite capture. For example, while foreign donors are sometimes accused of funding “briefcase NGOs” set
up by elites to extract funds, we examine a program that assisted indigenous groups which had not been
formed in the hope of getting external assistance and which were genuinely led by rural women. One
cannot rule out the possibility that other programs in other settings would have different effects, but in
the absence of rigorous evaluations, that must remain conjecture. The one program for which we can
estimate treatment effects by taking advantage of random assignment to treatment and comparison groups
suggests that the dangers of external assistance highlighted by Skocpol (2004a, 2004b; 2003) and others
are very real, at least in some contexts.
Until more randomized evaluations are conducted, the policy lesson is not that such programs
will always fail, but rather that they may fail, and even backfire, and that simple surveys asking about
member satisfaction may not pick this up. This suggests that it is prudent to first run such programs on a
pilot basis and carefully evaluate their impact before expanding them. To the extent that such programs
need to be phased in over time in any case, randomizing the order of phase in creates an opportunity to
more rigorously examine their impact. This would provide an evidence-based alternative to
overoptimistic calls to action that too often pay inadequate attention to the potential for unintended
consequences; to a generalized aid pessimism; and to the faddism that often characterizes the
development assistance world. In this alternative, programs would be phased in gradually, their results
would be measured, failed programs would be abandoned, and successful programs would be scaled up.
32

Such an approach would help ensure resources are better used and, over time, it would build up a better
picture of how and when programs are likely to succeed and a more nuanced understanding of how to
promote equity and participation in civic life and development more generally.
Aside from their policy implications, our results also have implications for understanding the
relationship between socioeconomic status and associational life. The composition and leadership of
organizations is not static -- as groups prosper they are likely to attract higher social status members and
leaders, potentially displacing those of lower socioeconomic status. Similar processes are likely to
operate in other contexts. A church or an educational institution serving the poor that receives a generous
gift or undergoes a period of particularly good leadership is likely to attract higher status members and
students. A neighborhood where community members effectively organize to fight crime, improve
schools, and lobby the city government for civic improvements is likely to gentrify. In contrast, in
neighborhoods where the community is not able to organize, rents are likely to remain low, and poor
people are likely to remain.
A dynamic model of organizations based on the empirical findings suggests that through this
process the disadvantaged will either have weak organizations or will not participate, consistent with the
observations of Walzer (2002) and the empirical findings of Verba and others (1995). Group dynamics
will lead to a positive correlation between the strength of groups and their members’ socioeconomic
status. If creating organizations is costly, this group dynamic will create a correlation between
socioeconomic status and organizational membership, even if the disadvantaged and the advantaged start
new organizations at the same rate.
The formal model sheds light on both the generality of the results and their limitations and thus
may be useful in clarifying when these phenomenon are likely and when they are not. First, we show that
in environments such as those we model, variation in the strength of organizations and the extent of
participation with socioeconomic status may not be just proportional to people’s ability and propensity to
contribute to organizations, but that even small differences in the ability to contribute to organizations
may lead to large differences in the strength of organizations and in participation between those of
different socioeconomic status. Second, although we agree that one mechanism through which outside
assistance may lead to changes in groups is through the imposition of formal structures and bureaucratic
33
requirements that empower the more educated members of groups, we show that even in the absence of
these effects, outside assistance can change group membership and leadership simply by making
membership attractive to a broader range of people.
The formal model is also useful in showing what may limit these effects and possible ways to
overcome them. Thus, one of the assumptions necessary for the result is that there is a continuous
distribution of productivity in the population. Another assumption is that organization deliver benefits to
all members in a similar way, or at least in ways that do not depend on social status. One reason why
women’s groups in Kenya have long survived and thrived as organizations of the disadvantaged is that
the disadvantaged may value their insurance functions more highly than the better off. The NGO program
we study provided groups with agricultural inputs that were likely as valuable to those of higher
socioeconomic status as to the disadvantaged, and the model suggests that this will lead to the entry of
more advantaged.
To the extent that those inside an organizations can structure it in ways that disproportionately
benefit members of lower socioeconomic status, or that external assistance can be provided in ways that
create this effect, it may be possible to increase participation and strength of organizations of the
disadvantaged over the long term (see for example, Warren, 2001). For example, religious and cultural
associations that provide large benefits to those from a particular community but smaller benefits to those
outside the community would be less likely to attract outsiders, even if they accumulate assets, undergo
periods of particularly strong leadership, build up external connections, or otherwise increase the benefits
available from participation in the group. They will be particularly unlikely to attract outsiders if there is
a sharp discontinuity in social status associated with the communities' ethnic or religious identity. The
reluctance of the socially advantaged to enter organizations of disadvantaged ethnic and religious groups,
rather than any innate predisposition of the disadvantaged to organize on ethnic or religious lines, may
help explain why some of the strongest organizations of the disadvantaged are organized on ethnic and
religious lines.
34
References
Aboderin, Isabella, 2004. “Modernisation and Ageing Theory Revisited: Current Explanations of Recent Developing World and Historical Shifts in Material Support for Older People.” Ageing and Society. 24, pp 29-50.
Abt, Nana Araba, 1997. Ageing in Africa. Geneva: World Health Organization.
Agarwal, Bina, 2001. "’Bargaining’ and Gender Relations: Within and Beyond the Household.” In in Beneria, Lourdes; Bisnath, Savitri, eds: Gender and Development: Theoretical, Empirical and Practical Approaches. 1, pp 445-95. Delhi: Institute of Economic Growth.
Ahlberg, Beth Maina, 1988. “Women’s Collective Participation in Development: A Socio-Cultural and Historical Analysis of Mobilization of Women for Collective Action with Special Emphasis on Health and Reproduction.” Ph.D. Dissertation, Uppsala University, Department of Sociology.
Almond, Gabriel and Sidney Verba, 1965. The Civic Culture: Political Attitudes and Democracy in Five Nations. Boston: Little and Brown.
Anderson, Siwan and Jean-Marie Baland, 2002. “The Economics of Roscas and Intra-household Resource Allocation.” Quarterly Journal of Economics. 117(3), pp 963-95.
Ayala, Louis. "Trained for Democracy: The Differing Effects of Voluntary and Involuntary Organizations on Political Participation." Political Research Quarterly. 53 (1) March 2000.,
Banfield, Edward, 1958. The Moral Basis of a Backward Society Glencoe, Ill.: Free Press & Chicago: Research Center in Economic Development and Cultural Change, University of Chicago.
Barkan Joel and Frank Holmquist, 1989. “Peasant-State Relations and the Social Base of Self-Help in Kenya” World Politics, 41 (3) pp. 259-380.
Bishop-Sambrook, Clare, 2003. “Labour Constraints and the Impact of HIV/AIDS on Rural Livelihoods in Bondo and Busia Districts Western Kenya.” A Joint Study by the International Fund for Agricultural Development (IFAD) and the Food and Agricultural Organization (FAO).
Boruch, Robert, 2005. “Evaluation for Evidence-Based Policy: Randomized Trials in Education, Criminology, Welfare and Health”, Annals of the American Academy of Political and Social Science, 599, May 2005.
Chambers, Simone and Will Kylicka. Alternative Conceptions of Civil Society. 2002. Princeton: Princeton University Press.
Cohen J. and J. Rogers, 1995. Associations and Democracy. London: Verso.
Diamond, Larry, 1999. Developing Democracy: Towards Consolidation. Baltimore, MD: Johns Hopkins Press.
Duflo, Esther and Petia Topalova, 2004. “Unappreciated Service: Performance Perceptions and Women Leaders in India.” Mimeo, MIT Department of Economics.
Esman, Milton and Norman Uphoff, 1984. Local Organizations: Intermediaries in Rural Development. Ithaca: Cornell University Press.
Fung, Archon, 2003. “Associations and Democracy: Between Theories, Hopes and Realities.” Annual Review of Sociology. 29: 515-39.
Garforth, Chris, 1994. ‘Rural People’s Organizations and Agricultural Extension in the Upper North of Thailand: Who Benefits?” Journal of International Development. 6(6), pp 707-20.
Glaeser, Edward L. Giacomo Ponzetto and Andrei Shleifer, 2006. “Why Does Democracy Need Education?” National Bureau of Economic Research, Working Paper 12128.
Green, Donald P., 2004. “Mobilizing African-American Voters using direct mail and commercial phone banks: a field experiment.” Political Research Quarterly. 57(2) pp. 245-256.
35

Hearn, Julie. 1998. “The NGO-isation of Kenyan Society: USAID and the Restructuring of Health Care.” Review of African Political Economy 75. pp 89-100.
Henderson, Sarah. 2002. “Selling Civil Society: Western Aid and the Nongovernmental Organization Sector in Russia.” Comparative Political Studies, 35 (2), March 2002. pp 139-167.
House-Midamba, Bessie. 1996. “Gender Democratization and Associational Life in Kenya.” Africa Today. 43(4) July/September 1996. 289-305.
Howes, Mick, 1997. “NGOs and the Institutional Development of Membership Organizations: A Kenyan Case.” The Journal of Development Studies. 33(6), pp 820-48.
Igoe, Jim. “Scaling Up Civil Society: Donor Money, NGOs and the Pastoralist Land Rights Movement in Tanzania.” Development and Change. 34 (5) 863-885.
Kabira, Wanjiku Mukabi and Elizabeth Akinyi Nzioki, 1993. Celebrating Women’s Resistance: A Case Study of Women’s Groups Movement in Kenya. Nairobi: African Women’s Perspective.
Kahler, Peter, 2000. “Kenya Women Step Up War Against Illegal Brews.” Financial Times Information/PanAfrican News Agency, November 22.
Kremer Michael "Why Are Worker Cooperatives So Rare?," NBER Working Paper 6118, 1997.
Krishna, Anirudh, Norman Uphoff and Milton Esman, eds., 1997. Reasons for Hope: Instructive Experiences in Rural Development. West Hartford: Kumarian Press.
Mansuri, Ghazala and Vijayendra Rao, 2004. “Community-Based and –Driven Development: A Critical Review.” The World Bank Research Observer, 19(1) pp. 1-39.
Miguel, Edward, 2005. “Poverty and Witch Killing.” Review of Economic Studies 72(4) pp. 1153-1172.
Miguel, Edward and Mary Kay Gugerty, 2005. “Ethnic Diversity, Social Sanctions and Public Goods in Kenya.” Journal of Public Economics.89(11-12) pp. 2325-2368.
Njonjo, A. and others. 1984. “Study of the Production of Women’s Groups Products in Kenya.” Nairobi: unpublished report.
Olson, Mancur. 1965. The Logic of Collective Action. Cambridge: Harvard University Press.
Ottaway, Marina and Carothers, Thomas, 2000. Funding Virture: Civil Society Aid and Democracy Promotion. Washington: Brookings Institution Press.
Payne, Charles M. 1995. I’ve Got the Light of Freedom: The Organizing Tradition and the Mississippi Freedom Struggle. Berkeley: University of California Press.
Piven, Frances Fox and Richard A. Cloward. 1979. Poor People’s Movements: Why They Succeed, How They Fail. New York: Vintage Books.
Platteau, Jean-Philippe, 2004. “Monitoring Elite Capture in Community-Driven Development.” Development and Change. 35(2) pp. 223-246.
Platteau, Jean Phillippe and Frederic Gaspart, 2002.“The Risk of Resource Misappropriation in Community-Driven Development. World Development. 31(10) pp. 1687-1703.
Putnam, Robert, 2000. Bowling Alone: The Collapse and Revival of American Community. New York: Simon and Schuster.
Putnam, Robert, with Robert Leonardi and Raffaella Nanetti. 1993. Making Democracy Work. Princeton, NJ: Princeton University Press.
Sampson, Robert J.; Raudenbush, Stephen W.; Earls, Felton,"Neighborhoods and Violent Crime: A Multilevel Study of Collective Efficacy." Science. 1997, 277, 918 - 924.
Skocpol Theda, 2004a. “The Narrowing of Civic Life” The American Prospect. June 2004.
Skocpol, Theda, 2004b. “Voice and Inequality: The Transformation of American Civic Democracy.” Perspectives on Politics, 2(1), March 2004.
36

Skocpol, Theda, 2003. Diminished Democracy: From Membership to Management in American Civic Life. Norman: University of Oklahoma Press.
Smillie, Ian and Henny Helmich, 1999. Stakeholders: Government-NGO Partnerships for International Development. London: Earthscan.
Srujana, K. 1996. Status of Women in Kenya: A Sociological Study. Delhi: Kalinga Publications.
Sundstrom, Lisa McIntosh, 2005. “Foreign Assistance, International Norms and NGO Development: Lessons from the Russian Campaign.” International Organization. 59, Spring 2005, pp. 419-449.
Thomas, Barbara, 1988. “Household Strategies for Adaptation and Change: Participation in Kenyan Rural Women’s Associations.” Africa. 58(4), pp 401-22.
Thomas, Barbara, 1987. “Development Through Harambee: Who wins and who loses? Rural self-help projects in Kenya.” World Development. 15(April) .
Tripp, Aili Mari, 2001. “Women’s Movement and Challenges to Neopatrimonial Rule: Preliminary Observations from Africa.” Development and Change. 21 (2001) pp. 33-54.
Tripp, Aili Mari, 2000. Women and Politics in Uganda. Madison: University of Wisconsin Press.
Tripp, Aili Mari, 1994. “Gender, Political Participation, and the Transformation of Associational Life in Uganda and Tanzania.” African Studies Review. 37(1) April 1994. pp. 107-31.
Udvardy, M.L., 1998. “Theorizing Past and Present Women’s Organizations in Kenya.” World Development. 26(9), pp 1749-61.
United Nations Integrated Regional Information Networks, 2003. “ Rights Groups Condemn Rape by Police.” February 6.
Verba, Sidney, Kay L. Schlozman, and Howard E. Brady, 1995. Voice and Equality: Civic Voluntarism in American Politics. Cambridge, MA: Harvard University Press.
Walzer, Michael. 2002.“Equality and Civil Society” in Chambers, Simone and Will Kylicka. Alternative Conceptions of Civil Society. 2002. Princeton: Princeton University Press.
Wantchekon, Leonard, 2003. “Clientelism and Voting Behavior: Evidence from a Field Experiment in Benin.” World Politics 55 (3), Apr., 2003, pp. 399-422.
Warren, Mark E. 2001. Democracy and Association. Princeton, NJ: Princeton Univ Press. Warren, Mark R. 2001. Dry Bones Rattling: Community Building to Revitalize American Democracy.
Princeton University Press.
Webo, Christopher Wanjala. 1997. “International Child Support Fund Agriculture and Food Security Proposal.” June, 1997
Wolfenson, James D., 1999. “Coalitions for Change.” Address to the Board of Governors of the World Bank and IMF. September 28.
World Bank, 2005. The Effectiveness of World Bank Support for Community-Based and -Driven Development. Operations Evaluation Department, Evaluation.
37

Table 1: Pre-intervention Comparisona
Panel A: Group Characteristics
Program group mean (standard deviation)
Comparison groups mean (standard deviation)
Years in operation 7.83 (5.2)
7.55 (5.6)
Group size 21.7 (7.71)
20.8 (7.75)
Proportion of members living in same village 0.73 (0.25)
0.67 (0.25)
Distance from a paved road (kilometers)
10.8 (15.8)
9.95 (10.8)
Attendance rates at all meetingsb 0.90 (0.12)
0.92 (0.12)
Attendance rates at group farmwork meetingsc
0.88
(0.17) 0.90
(0.17) Proportion of groups holding an election for officials in year prior to pre-intervention survey
0.11 (0.03)
0.15 (0.36)
Number of visits group visited members’ home for emergency assistanced
2.91 (0.64)
2.84 (0.66)
Panel B: Characteristics of Members and Executive Officials
All Members (standard deviation)
Executive Officials (standard deviation)
Program Comparison Program Comparison Proportion of females 0.78
(0.16) 0.81
(0.17) 0.99
(0.07) 0.95
(0.13) Average agee 41.5
(6.1) 41.2
(4.06) 40.5
(6.97) 39.8
(5.62) Proportion over 50 years of age 0.29
(0.23) 0.25
(0.15) 0.21
(0.29) 0.15
(0.21) Proportion who have ever been married 0.98
(0.01) 0.98
(0.05) 0.99
(0.03) 0 .99 (0.07)
Average years of educationf 5.33 (2.74)
5.31 (1.96)
7.13 (2.83)
6.87 (2.87)
Proportion with no formal education 0.34 (0.23)
0.32 (0.16)
0.12 (0.20)
0.17 (0.23)
Proportion of females with secondary education 0.23 (0.23)
0.23 (0.16)
0.38 (0.36)
0.39 (0.35)
Proportion with formal sector income 0.17 (0.19)
0.12 (0.11)
0.18 (0.27)
0.15 (0.25)
Proportion from same village 0.73 (0.23)
0.67 (0.25)
0.75 (0.23)
0.73 (0.22)
Note: For each variable, an unpaired (two-sample) t-test for the equality of means was run, but no significant differences were seen. bBased on group records of individual attendance at the two most recent meetings of 8 randomly selected members in each group. cBased on group records of individual attendance at the two most recent farmwork meetings of 8 randomly selected members in each group. dNumber of times out of four possible times that groups visited members’ homes prior to the intervention. eData were collected for individuals using the following age ranges: 20 or under years of age, 21-30 years of age, 31-40 years of age, 41-50 years of age, over 50 years. fData were collected for individuals using the following ranges: no formal education, some primary education, completed primary education, some secondary education, completed secondary education, some “A” level education, completed “A” levels, some post secondary education.
38
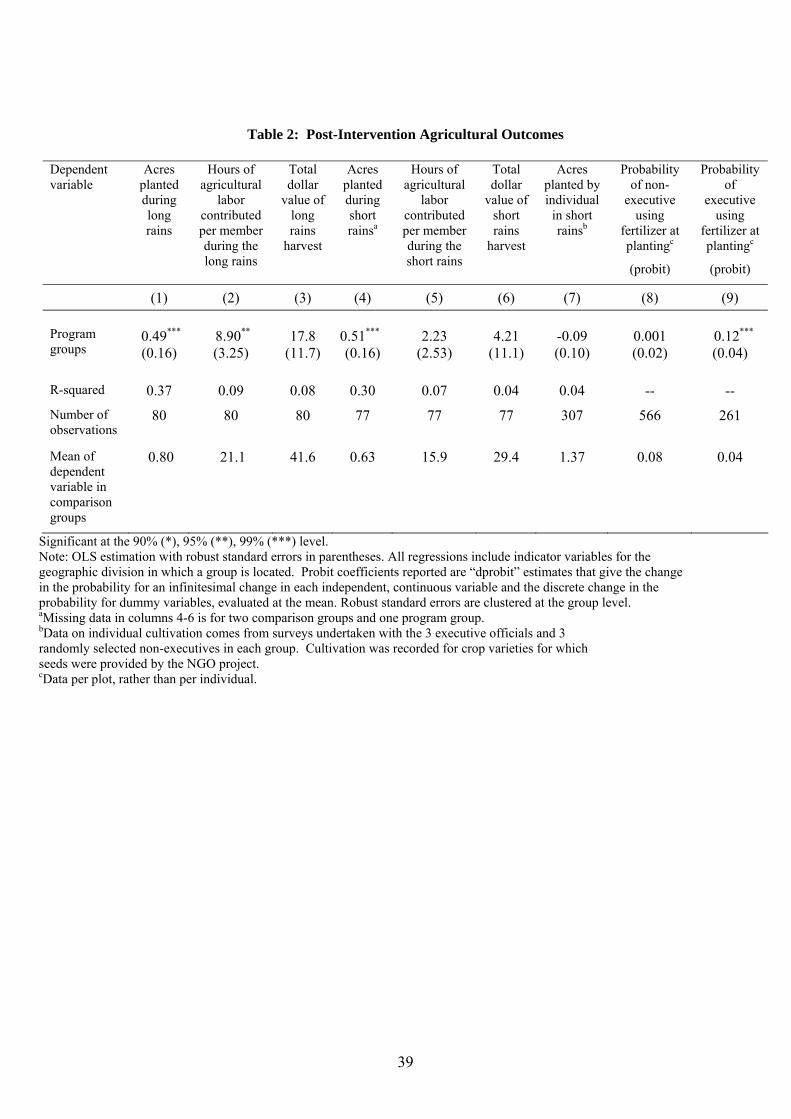
Table 2: Post-Intervention Agricultural Outcomes
Dependent variable
Acres planted during long rains
Hours of agricultural
labor contributed per member during the long rains
Total dollar
value of long rains
harvest
Acres planted during short rainsa
Hours of agricultural
labor contributed per member during the short rains
Total dollar
value of short rains
harvest
Acres planted by individual
in short rainsb
Probability of non-
executive using
fertilizer at plantingc
(probit)
Probability of
executive using
fertilizer at plantingc
(probit)
(1) (2) (3) (4) (5) (6) (7) (8) (9) Program groups
0.49***
(0.16)
8.90**
(3.25)
17.8
(11.7)
0.51***
(0.16)
2.23
(2.53)
4.21
(11.1)
-0.09 (0.10)
0.001 (0.02)
0.12***
(0.04)
R-squared 0.37 0.09 0.08 0.30 0.07 0.04 0.04 -- -- Number of observations
80 80
80 77 77 77 307 566 261
Mean of dependent variable in comparison groups
0.80 21.1 41.6 0.63 15.9 29.4 1.37
0.08 0.04
Significant at the 90% (*), 95% (**), 99% (***) level. Note: OLS estimation with robust standard errors in parentheses. All regressions include indicator variables for the geographic division in which a group is located. Probit coefficients reported are “dprobit” estimates that give the change in the probability for an infinitesimal change in each independent, continuous variable and the discrete change in the probability for dummy variables, evaluated at the mean. Robust standard errors are clustered at the group level. aMissing data in columns 4-6 is for two comparison groups and one program group. bData on individual cultivation comes from surveys undertaken with the 3 executive officials and 3 randomly selected non-executives in each group. Cultivation was recorded for crop varieties for which seeds were provided by the NGO project. cData per plot, rather than per individual.
39

Table 3: Post-intervention Group Outcomes
Panel A: Group Cohesion
Members’ evaluation: has group leadership
improved? a
Members’ evaluation:are meetings more effective? a
Change in attendance
rates at general
meetingsb
Number of days
between general
meetings
Number of times group
visited members’ home for
emergency assistance
Total amount of cash
assistance members gave
to other members in
US$
Average frequency of rosca meeting
in weeksc
Average dollar
amount collected per month through rosca
Probit probit OLS OLS OLS OLS OLS OLS
(1) (2) (3) (4) (5) (6) (7) (8) Program groups
0.23***
(0.05)
0.10
(0.07)
-0.04 (0.06)
3.85
(17.2)
0.14
(0.49)
9.0
(11.6)
-0.19 (0.25)
3.79
(6.34)
R-squared -- -- 0.06 0.03 0.13 0.12 0.09 0.16 Number of observations
288
281
77
77
80
80
77
74
Mean of dependent variable in comparison groups
0.60 0.64 -0.07 53 12.0 23.7 3.2 26.0
. Panel B: Community Interaction
Number of contributions to
community fundraising
events
Amount contributed to
community fundraising
events in US $
Dollar value of grants
received by groupsd
Number of times group received in-
kind donations
Number of total
community visitse
Number of visits by extension workersf
Number of visits by local government
officialsg
(1) (2) (3) (4) (5) (6) (7) Program groups
-1.85 (1.97)
-0.33 (3.29)
-11.1** (5.46)
-0.10* (0.06)
8.54**
(3.52)
2.47*
(1.39)
5.49**
(2.52)
R-squared 0.18 0.09 0.28 -- 0.15 0.13 0.09
Number of observations
80 80 77 77 77 77 77
Mean of dependent variable in comparison groups
4.2 12.3 11.3 0.13 13.5 3.3 4.6
Significant at the 90% (*), 95% (**) level, 99% (***) level. Note: OLS estimation with robust standard errors in parentheses unless otherwise noted. All regressions include indicator variables for the geographic division in which a group is located. The post-intervention period is the 14 month period following the first pre-intervention survey. a Probit estimation of individual-level data based on interviews with 3 randomly selected non-executive group members. Coefficients reported are “dprobit” estimates. Robust standard errors are clustered at the group level. b Change in attendance from the pre-intervention period. Group attendance rates are based on group attendance records for 6 randomly selected members for each group. Two program groups did not have attendance records for the project period and one additional program group had no pre-intervention attendance information. There is no significant difference between program and comparison groups in the level of post-intervention attendance rates. c Prior to funding, 66 groups held rotating savings and credit associations (roscas). There is no difference pre-intervention in the number of program versus comparison groups holding roscas. Post-intervention, three program groups did not hold roscas d Two program groups and one comparison group did not have records on donations or visitors. e This includes visits by government administration officials, Ministry of Agriculture, Health and Social Services field workers, other women’s and community groups, religious groups, and NGOs. f Includes extension officers from the Ministries of Health and Agriculture. g Includes Chief and sub-chiefs, village elders, district officers and any senior administrative government officials.
40

Table 4: Entry into Groups
Number of new
entrants
Proportion of new
entrants with formal sector
income
Proportion of new
entrants who are male
Proportion of female entrants
with secondary education
Probability that new
member does not come from
majority village
Proportion of new entrants
who are married
OLS OLS OLS OLS probit OLS
(1) (2) (3) (4) (5) (6) Program groups
1.88**
(0.79)
0.11* (0.06)
0.04
(0.09)
0.12*
(0.07)
0.27**
(0.10)
-0.04** (0.02)
R-squared 0.07 0.08 0.14 0.08 -- 0.20 Number of observations
80 56 57 50 236 55
Mean of dependent variable in comparison groups
2.0
0.09
0.25
0.08
0.23
1.0
Significant at the 90% (*), 95% (**) level, 99% (***)level. Note: OLS estimation with robust standard errors. All regressions include indicator variables for the geographic division in which a group is located. The post-intervention period is the eighteen months following the pre-intervention survey. Column 5 reports “dprobit” estimates that give the change in the probability for an infinitesimal change in each independent, continuous variable and the discrete change in the probability for dummy variables, evaluated at the mean. Robust standard errors are clustered at the group level.
41
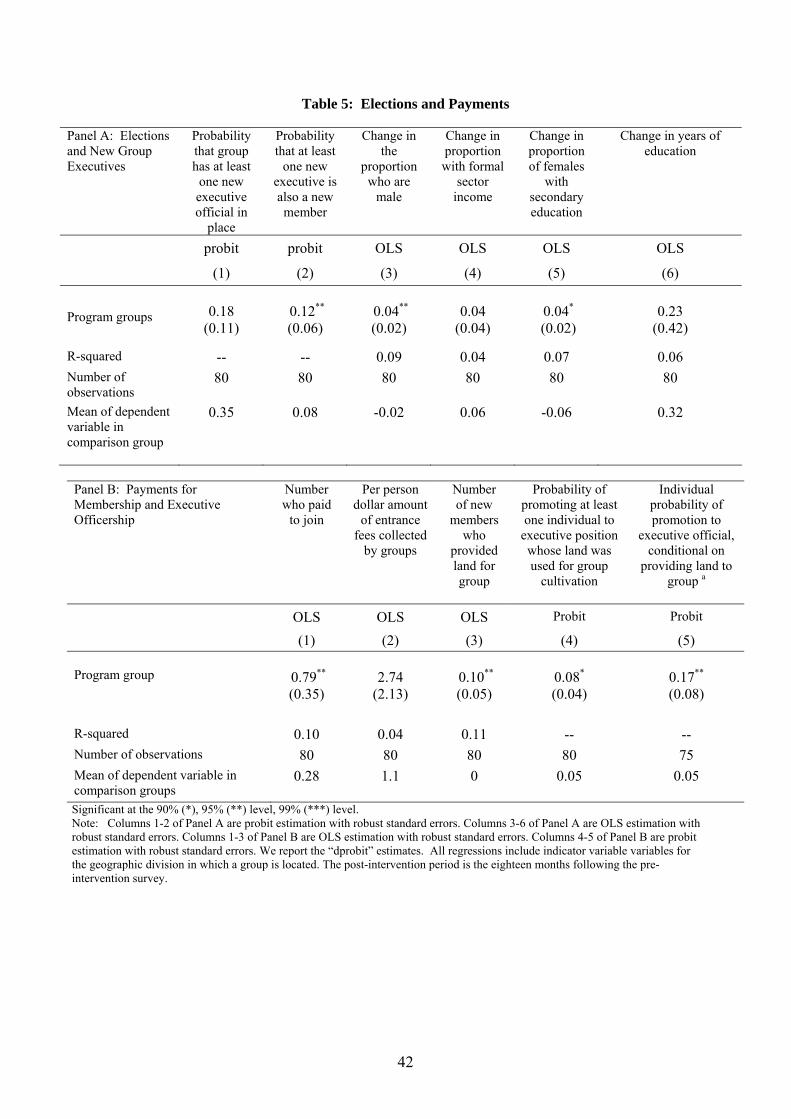
Table 5: Elections and Payments
Panel A: Elections and New Group Executives
Probability that group has at least
one new executive official in
place
Probability that at least
one new executive is also a new member
Change in the
proportion who are
male
Change in proportion with formal
sector income
Change in proportion of females
with secondary education
Change in years of education
probit probit OLS OLS OLS OLS
(1) (2) (3) (4) (5) (6)
Program groups
0.18
(0.11)
0.12**
(0.06)
0.04** (0.02)
0.04
(0.04)
0.04*
(0.02)
0.23
(0.42)
R-squared -- -- 0.09 0.04 0.07 0.06 Number of observations
80 80 80 80 80 80
Mean of dependent variable in comparison group
0.35 0.08 -0.02 0.06 -0.06 0.32
Panel B: Payments for Membership and Executive Officership
Number who paid
to join
Per person dollar amount
of entrance fees collected
by groups
Number of new
members who
provided land for group
Probability of promoting at least one individual to
executive position whose land was used for group
cultivation
Individual probability of promotion to
executive official, conditional on
providing land to group a
OLS OLS OLS Probit Probit
(1) (2) (3) (4) (5) Program group
0.79** (0.35)
2.74
(2.13)
0.10**
(0.05)
0.08*
(0.04)
0.17**
(0.08)
R-squared 0.10 0.04 0.11 -- -- Number of observations 80 80 80 80 75 Mean of dependent variable in comparison groups
0.28 1.1 0 0.05 0.05
Significant at the 90% (*), 95% (**) level, 99% (***) level. Note: Columns 1-2 of Panel A are probit estimation with robust standard errors. Columns 3-6 of Panel A are OLS estimation with robust standard errors. Columns 1-3 of Panel B are OLS estimation with robust standard errors. Columns 4-5 of Panel B are probit estimation with robust standard errors. We report the “dprobit” estimates. All regressions include indicator variable variables for the geographic division in which a group is located. The post-intervention period is the eighteen months following the pre-intervention survey.
42

Table 6: Exit from Groups
Number leaving groupa
Number leaving due to
conflict
Number leaving due to difficulty
paying group fees
Proportion of those leaving that
are female and over 50b
Net change in group size
OLS OLS OLS OLS OLS
(1) (2) (3) (4) (5)
Program groups
1.14
(1.11)
0.64**
(0.31)
-1.02*** (0.30)
0.14***
(0.05)
1.34
(0.90)
R-squared 0.05 0.09 0.17 0.10 0.05
Number of observations
80 80 80 80 80
Mean of dependent variable in comparison
groups
6.9 0.65 1.4 0.10
Significant at the 90% (*), 95% (**) level, 99% (***)level.
0.1
Note: OLS estimation with robust standard errors. All regressions include indicator variables for the geographic division in which a group is located. The post-intervention period is the eighteen months following the pre-intervention survey. Robust standard errors are clustered at the group level. aIncludes individuals who left the group, as well as those individuals who entered the official category “dormant,” meaning they were inactive and no longer attended any group meetings or participated in any group activity. The specification in column 2 is robust to the inclusion of the pre-intervention proportion of members over the age of 50. bBased on individual-level data. Coefficient represents the additional likelihood of leaving or becoming inactive in a treatment group, given than one is a woman over 50 years of age.
43