outside directors and corporate board decisions
TRANSCRIPT

www.elsevier.com/locate/econbase
Journal of Corporate Finance 11 (2005) 37–60
Outside directors and corporate board decisions
Jay Dahyaa, John J. McConnellb,*
aBaruch College, CUNY, USAbKrannert School of Management, Purdue University, 403 W. State Street, West Lafayette, IN 47907-2056, USA
Received 11 April 2003; received in revised form 1 May 2003; accepted 20 October 2003
Available online 7 February 2004
Abstract
Between 1993 and 2000, at least 18 countries saw publication of guidelines proposing minimum
representation of outside directors on corporate boards. Underlying this movement is an apparent
presumption that boards with significant outside directors will make different and, perhaps, better
decisions than boards dominated by insiders. As the first-mover in this movement, the United
Kingdom provides a laboratory for a ‘‘natural experiment’’ to examine this presumption empirically.
We find that UK boards that complied with the exogenously imposed standard were more likely to
appoint outside chief executive officers (CEOs). Additionally, announcement period stock returns
indicate that investors appear to view appointments of outside CEOs as good news. Apparently,
boards with more outside directors make different (and perhaps better) decisions.
D 2005 Elsevier B.V. All rights reserved.
JEL classification: G32; G34; G30; K22
Keywords: Cadbury; CEO; Directors; Governance; UK
1. Introduction
Historically, the composition of the boards of directors of publicly traded US
corporations has differed from that of most other countries in that US boards have been
characterized by substantial representation and, in most cases, a majority of outside
directors. For example, in 1990, for 421 of the Fortune 500 firms (i.e., 84.2% of the firms)
outsiders comprised at least 50% of the board membership. In comparison, in 1990, of the
largest 25% of firms, ranked by market capitalization, listed on the stock exchanges of the
United Kingdom, France, Italy, Australia, South Africa, Hong Kong, Singapore, Malaysia,
0929-1199/$ - see front matter D 2005 Elsevier B.V. All rights reserved.
doi:10.1016/j.jcorpfin.2003.10.001
* Corresponding author. Tel.: +1-765-494-5910; fax: +1-765-494-9658.
E-mail address: [email protected] (J.J. McConnell).
J. Dahya, J.J. McConnell / Journal of Corporate Finance 11 (2005) 37–6038
Thailand, India, Brazil and Mexico, outsiders comprised 50% or more of the board in less
than 18% of the firms in each country.
Over the last decade and beyond, pressure has come to bear on publicly traded
corporations worldwide to increase representation of outside directors. Between 1993 and
December 2000, at least 18 countries witnessed publication of reports sponsored by their
governments and/or their major stock exchanges that advocated or mandated minimum
standards for outside director representation on boards of publicly traded companies.
These minimum standards typically represent a major increase in outside board member-
ship in these countries relative to the early 1990s and before.
Arguably, the recent global movement toward a more prominent role for outside directors
can be traced to the Cadbury Report issued in 1992 in the United Kingdom. Among other
things, the Cadbury Report recommended that publicly traded UK companies have at least
three outside directors. Compliance with the Cadbury recommendation represented a sea
change for UK companies. As documented by Dahya et al. (2002), during 1988, outsiders
comprised a majority of the board for only 21 of the Financial Times (FT) 500 and, of all
London Stock Exchange (LSE) companies, only 26.7% had at least three outside directors.
In comparison, during 1998, outsiders were a majority of the board for 257 of the FT 500
firms, and 62.3% of all LSE listed companies had at least three outside directors.
The apparent premise underlying the movement towards greater outside director
representation is that more outside directors will lead to different and, presumably, better
decisions by the board. The purpose of this study is to examine one board task to determine
whether this premise is justified. The task upon which we focus is the appointment of the
top manager. Our motivation for focusing on the appointment of chief executive officers
(CEOs) derives from the generally accepted proposition that one of the key responsibilities
of corporate boards is the hiring of top managers. We ask whether the fraction of outside
directors on the board is correlated with the decision of whether to hire an insider or outsider
as the new CEO when the firm’s current CEO is replaced. We use the United Kingdom as
the laboratory for this study because, as we noted, the United Kingdom can be viewed as a
first-mover in the global push toward the prescribed inclusion of outside directors.
Additionally, as we will document further below, prior to the mid-1990s, in terms of its
board compositions, the United Kingdom was the inverse of the United States, with
outside directors being a distinct minority in the United Kingdom and a heavy majority in
the United States. Most importantly, however, because of its status as the first-mover, the
United Kingdom provides a sufficiently long time series of data following its recent
emphasis on the inclusion of outside board members to allow for a ‘‘before-and-after
event’’ comparison.
The prior study most closely related to ours is Borokhovich, Parino, and Trapani (BPT)
(1996) who study board composition and CEO appointments in the United States. They
analyzed 969 CEO appointments over the interval 1970–1988. After controlling for other
factors, they report a positive and significant correlation between the fraction of outside
directors and the probability of a newly appointed CEO being from outside the company.
One of the questions we address here is whether that result is unique to the United States.
Additionally, however, we go beyond BPT in that their study potentially suffers from
endogeneity in the CEO appointment process. In particular, it may be that companies that
tend to appoint outside CEOs also tend to have a larger fraction of outside directors. Thus,
J. Dahya, J.J. McConnell / Journal of Corporate Finance 11 (2005) 37–60 39
the correlation reported by BPT may be spurious. Our study potentially provides a way
around this endogeneity.
Specifically, our study of CEO appointments in the United Kingdom spans the 11 years
from 1989 to 1999 and, thus, encompasses the period from before to after the publication
of the Cadbury Report (1992). Publication of the Report represents a ‘‘natural’’ experiment
in which an exogenous force coerced companies into adding outside directors. If the
appointment process is endogenous, then, presumably, addition of outside directors in
response to this exogenous mandate will have no effect on the CEO appointment process.
We do not find that to be the case.
Both before and after UK firms comply with the Cadbury Report, the probability of an
outside CEO appointment increases with the fraction of outside board members.
Additionally, however, once a firm comes into compliance with the Cadbury recommen-
dation, the probability of an outside CEO appointment increases further. Thus, at least in
part, the appointment decision is not endogenous. That is, outside directors tend to appoint
outside CEOs.
As we describe later, different countries have taken different prescriptive routes toward
increasing the role of outside directors. The United Kingdom and Thailand have specified
a minimum number of outsiders. Australia, Belgium, Brazil, Greece, India, Mexico, and
Singapore have specified a minimum fraction. France, Malaysia, and South Africa have
specified both a minimum number and a minimum fraction. Korea has initially specified a
minimum number of outside directors with a further provision that provides for a
minimum fraction of outside directors over a longer term. We also address the question
of whether it is the number or fraction of outside directors that affects the CEO
appointment decision. We determine that the fraction of outside directors dominates the
number, and that, after controlling for other factors in a multivariate analysis, the
relationship between the fraction of outside directors and the company’s propensity to
appoint an outside CEO increases as the fraction of outside directors increases.
Of course, these results only indicate that more outsiders on the board lead to different
decisions (or, at least, different CEO appointment decisions). The results do not indicate
whether the CEO appointment decisions are better. To address that question, at least
preliminarily, we conduct an event study in which we examine excess stock returns around
announcements of CEO appointments. For the companies in our sample, announcements
of outside CEO appointments are accompanied by an average 2-day excess stock return
(0.79%) that is significantly greater than the average 2-day excess stock return that
accompanies inside CEO appointments (0.20%). Thus, given that the probability of an
outside CEO appointment increases as the fraction of outside directors increases, the
global push toward a more prominent role for outside directors is apparently good news for
shareholders. Not only are the board’s decisions different, on average, investors apparently
expect them to be better.
2. The global movement toward outside directors
As we noted, in 1992, the Report on the Financial Aspects of Corporate Governance
issued by the Cadbury Committee recommended, among other things, that boards of

J. Dahya, J.J. McConnell / Journal of Corporate Finance 11 (2005) 37–6040
publicly traded UK companies include at least three outside directors. Although these
recommendations have not been legislated, the committee was appointed by the
government and the recommendations have been adopted by the LSE. Between publica-
tion of the Cadbury Report and December 2000, at least 18 other countries witnessed
publication of similar reports. The introductory statement in the Handbook for Issuers on
The Copenhagen Stock Exchange (2001) offers up a justification for this global
movement:
Initially, the Corporate Governance debate arose partly in response to pressure from the
increasingly prevalent institutional ownership, and partly in response to financial
scandals at the end of the 1980’s. . . The Cadbury Report contained a number of specific
recommendations regarding good corporate governance also called ‘best practice’ or
‘code of conduct’. The aim was to meet the demands of the institutional owners and to
prevent new business and financial scandals. . . The debate has more recently moved
from primarily being driven by a wish to stimulate ‘owner activism’ and increase the
supervision of management. . . (p. 1)
In that spirit, in 1993, the Swedish Shareholders Association established guidelines
for boards of publicly traded Swedish corporations that closely mimicked those of the
Cadbury committee. In 1994, the King Committee Report on Corporate Governance in
South Africa recommended that publicly traded companies have at least two outside
directors and equal numbers of inside and outside directors. In 1995, the Bosch
Committee Report on Corporate Practices and Conduct in Australia prescribed that,
for listed firms, a majority of the board be outsiders and at least one-third be
independent.
In 1998, the Report on Desirable Corporate Governance issued by the Confederation
of Indian Industry promulgated that for large firms, at least 30% of the board comprise
outside directors unless the chairman of the board is also CEO, in which case the
fraction of outsiders should be at least 50%. The Report on the Roles, Duties and
Responsibilities of the Directors of Listed Companies issued by the Stock Exchange of
Thailand mandated that boards of exchange-listed firms have at least two outside
directors. The Report on Corporate Governance for Belgian Listed Companies adopted
by the Brussels Stock Exchanges specified that the board consist of a majority of
outsiders.
In 1999, at least six countries witnessed the issuance of mandates and/or guidelines for
board composition. In Korea, the Code of Best Practice for Corporate Governance, backed
by the Korean Stock Exchange, recommended that financial institutions and large public
corporations have at least three outside directors and gradually increase the ratio of
outsiders to greater than 50%. In Malaysia, a Report on Corporate Governance issued by
the High Level Finance Committee and, in France, the Vienot Report on the Boards of
Directors of Listed Companies in France proposed that one-third of the board comprise
independent outside directors with no fewer than two outsiders. In Mexico, the Code of
Corporate Governance prepared for listed companies recommended that at least 20% of
the board be outsiders. Finally, in Greece, the Principles of Corporate Governance issued
by the Capital Market Commission and, in Brazil, the Code of Best Practice of Corporate

J. Dahya, J.J. McConnell / Journal of Corporate Finance 11 (2005) 37–60 41
Governance issued by the IBGC, recommended that outsiders comprise at least 50% of the
board.
3. Prior studies
As we noted, the prior study most directly related to ours is BPT (1996). They analyzed
969 CEO appointments at 588 large publicly traded US companies over the period 1970–
1988. Of these 969 appointments, 187 were outsiders. After controlling for corporate
performance, firm size, and CEO share ownership, they report a significant positive
correlation between the fraction of outside directors and the likelihood that a new CEO
will be appointed from outside the firm. The apparent conclusion is that adding outside
directors increases the probability that the board will appoint a new CEO from outside the
company.
However, as argued by Hermalin and Weisbach (1998), board composition (i.e., the
split between inside and outside directors) and CEO appointments may be endogenous. If
so, it could be that firms that are more likely to appoint outside CEOs are also more likely
to appoint outside directors. If that is the case, the correlation observed by BPT may be
spurious. If this correlation is spurious, i.e., the CEO selection decision is endogenous,
changes in board composition should have no impact on CEO selection. Suppose, for
example, that firm A optimally has few outside directors (say 20% outsiders) and
optimally chooses its CEO from an internal labor pool, while firm B optimally has many
outside directors (say 80% outsiders) and optimally chooses an outside CEO. If the CEO
selection process is endogenous and if an external force coerces these firms to reverse their
board compositions, and if the boards continue to act optimally in selecting their CEOs,
firm Awill continue to select its CEO internally and firm B will continue to select its CEO
from an external labor pool.
Because the Cadbury Report spurred dramatic changes in the composition of UK
boards, our analysis of UK data provides an opportunity to alleviate the problems that may
arise from the possible endogeneity of board composition and CEO selection. If the
correlation observed by BPT is spurious, we should find no shift in the likelihood that
outside CEOs are appointed in the United Kingdom following the Cadbury Report. That
is, the CEO selection process should be unaffected in firms that are coerced into adding
outside directors. The fraction of outside directors might increase, but board decisions will
be unchanged.
Of course, BPT is not the only study to analyze the relation between board structure and
CEO appointments. As part of their study of corporate performance and CEO turnover in
Japan, Kang and Shivdasani (1995) examine factors that influence the decision by
Japanese companies to appoint an outside CEO. They examine 174 CEO turnover events
over the period 1985–1990. Of these, 18 represent outside appointments. The authors
report that an outside CEO appointment is significantly more likely when the company’s
prior performance has been poor and when stock ownership is concentrated among several
large shareholders. They also report a positive correlation between the presence of one or
more outside directors on the board and the probability of an outside CEO appointment.
However, with p-values ranging from 0.12 to 0.19 in various regression specifications, the

J. Dahya, J.J. McConnell / Journal of Corporate Finance 11 (2005) 37–6042
coefficient of this variable is not significant at traditionally acceptable levels. Of course,
the sample is quite small.1
4. Sample and data sources
We construct an initial sample of 914 companies by selecting every second entry from a
comprehensive set of companies listed on the LSE as of December 1988. For each
company, stock price and accounting data are taken from Datastream for the years 1985–
1988. If such data are not available, the company is dropped from the sample. Ninety-nine
companies were dropped because of insufficient stock price data; 115 were dropped due to
insufficient accounting data. The resulting sample contains 700 companies. For each of
these firms, for each year 1988–1999, we used the Corporate Register and/or annual
filings maintained at Companies House to identify the top manager. We identified the top
manager as the individual holding the title of chief executive officer (CEO) or, if no
individual held the title of CEO, we identified the executive chairman as the top manager.
Henceforth, we refer to the top manager as the CEO.
For each year 1988–1999, we also used the Corporate Register and/or annual filings to
determine the age of the CEO, the size of the board, the number of outside directors, the
total number of shares held by board members, and the total number of shares held by
institutions. A director is considered an outsider if he/she is listed as a ‘‘nonexecutive’’
director, he/she is not related to the company’s controlling family, and he/she was not
employed by the company historically. Among other things, this procedure identified all
changes (i.e., all turnover and, therefore, all appointments) in the top management position
for each company.
We are interested in whether newly appointed CEOs come from within or outside the
company. To make that determination, for each instance in which we identified a turnover/
appointment in the CEO position, we reviewed the company’s prior year board roster in
the Corporate Register and/or the company’s annual filings. If the new CEO was already a
member of the board, we consider this to be an inside appointment. If not, we reviewed
articles in the Extel Weekly News Summaries, the Financial Times, and Macarthy’s News
Information Service to confirm that the new CEO was from outside the company. In this
way, we were able to identify (and confirm) every new CEO as either an inside or an
outside appointment. For certain tests, we repeated this procedure to determine whether the
departing CEO had been an insider or an outsider at the time of his appointment.
1 There is also a substantial literature on CEO turnover and appointments generally, including Coughlan and
Schmidt (1985), Denis and Denis (1995), Gilson (1990), Huson et al. (1998), Klein and Rosenfeld (1988),
Murphy and Zimmerman (1993), Martin and McConnell (1991), Parrino (1997), Warner et al. (1988), and
Weisbach (1988) among others, and on board composition and other board tasks, including Bhagat and Black
(2002), Brickley et al. (1987), Byrd and Hickman (1992), Core et al. (1999), Cotter et al. (1997), Kaplan and
Reishaus (1990), Lee et al. (1992), Wahal et al. (1995), and Yermack (1997) among others. Additionally, our
study complements others that use a specific country’s legal or regulatory regime to examine the relation between
board characteristics and various aspects of corporate governance. These include Bradbury and Mak (2000),
Campbell and Keys (2002), Hanson and Moon (2000); and Mak and Li (2001) among others.
J. Dahya, J.J. McConnell / Journal of Corporate Finance 11 (2005) 37–60 43
We are also interested in the circumstances under which the new CEO was hired. In
particular, we are interested in whether the previous CEO departed his/her position
involuntarily. We classify turnover in the CEO position as ‘‘forced’’ by examining articles
in the Extel Weekly News Summaries, the Financial Times, and Macarthy’s News
Information Service. Turnover is labeled forced when:
(1) a news article states that the executive was ‘‘fired’’;
(2) an article states that the executive ‘‘resigned’’; or
(3) an article indicates that the company was experiencing poor performance.
In addition, for (2) and (3), the executive must be less than 60 years old and no other
article can indicate that the executive took a position elsewhere or cite health or death as
the reason for the executive’s departure.
In later analyses, we are interested in firm size and performance. For these analyses, we
take accounting and stock price data from Datastream. Our measure of firm size is the
book value of assets. We use both accounting earnings and stock returns to measure
performance. To measure stock price performance, we use industry- and size-adjusted
stock returns (ISARs), where ISARs are calculated by subtracting the daily stock returns of
an industry- and size-matched portfolio from the return of the sample company beginning
153 trading days prior to, and ending 3 days prior to, the announcement of the CEO
appointment. To construct the industry- and size-matched portfolio, for each company in
our sample, all other companies with the same Financial Times Industry Classification
(FTIC) code are ranked from largest to smallest according to their equity market values.
The companies are divided into four size portfolios. The differences between the return on
the stock in our sample and the equal-weighted average return of the appropriate industry-
and size-matched portfolio are calculated. The sum of these differences is the ISAR for
that company.
As our measure of accounting performance, we use 3-year average industry-adjusted
return on assets (IAROA). For each year, for each company in the sample, we calculate
ROA as earnings before depreciation, interest and taxes (EBDIT) divided by beginning of
the year total assets. Then, for each firm with the same FTIC as the sample firm, we
calculate ROA in the same way. Next, for each year, for each FTIC group, we determine
the median ROA. IAROA is calculated by subtracting the industry median ROA from the
sample company’s ROA for each of the 3 years prior to a CEO appointment. The average
of these three IAROAs is our measure of accounting performance.
5. Analysis
5.1. CEO appointments and board composition: a first look
As a first-pass analysis, we examine the relationship between CEO appointments and
board composition by stratifying the companies in our sample into deciles according to the
fraction of their boards comprising outside directors. This stratification of the sample is
displayed in Table 1.

Table 1
CEO appointments classified according to composition of the board of directors for a sample of 700 UK
companies over the period 1989–1999 in comparison with CEO appointments for a sample of 969 US companies
over the period 1977–1988
Fraction
of outside
directors
CEO
turnover
Outside CEO
appointments
Outside CEO
appointments
as percent of
all CEO
appointments
Fraction of
outside
directors
CEO
turnover
Outside CEO
appointments
Outside CEO
appointments
as percent of
all CEO
appointments
Turnover and appointments for UK companies Turnover and appointments for US companies
0–0.09 59 1 1.70
z 0.10–0.19 40 1 2.50
z 0.20–0.29 57 4 7.02
z 0.30–0.39 53 7 13.21 0–0.40 35 2 5.71
z 0.40–0.49 48 18 37.50 z 0.40–0.50 54 7 12.96
z 0.50–0.59 94 46 48.94 z 0.50–0.60 109 16 14.68
z 0.60–0.69 73 36 49.32 z 0.60–0.70 198 35 17.68
z 0.70–0.79 29 13 44.83 z 0.70–0.80 253 49 19.37
z 0.80–0.89 48 20 41.68 z 0.80–0.90 261 61 23.37
z 0.90–1.00 22 10 45.45 z 0.90–1.00 59 17 28.81
Total 523 156 Total 969 187
Initial sample of UK companies consists of 914 randomly selected industrial and financial companies listed on the
London Stock Exchange (LSE) as of December 1988. Two hundred fourteen companies were dropped from the
initial sample due to insufficient stock price and accounting data for the years 1985–1988. The final sample
contains 700 companies. For each firm, for each year 1988–1999, the Corporate Register and/or annual filings
maintained at Company’s House were used to identify the CEO and the names of the directors. This procedure
identified 523 changes in the CEO (i.e., CEO turnover and appointments) over the years 1989–1999. A director
is considered an ‘‘outsider’’ if he/she is listed as a nonexecutive director, is not related to the company’s
controlling family, and was not employed by the company historically. If the new CEO was a member of the
board in the prior year, we consider this to be an inside CEO appointment. All others are outside CEO
appointments confirmed by examination of articles in the Extel Weekly News Summaries, the Financial Times,
and Macarthy’s News Information Service. Data for a sample of 969 CEO changes (i.e., CEO turnover and
appointments) at 588 large US firms for the years 1970–1988 are from Borokhovich et al. (1996).
J. Dahya, J.J. McConnell / Journal of Corporate Finance 11 (2005) 37–6044
The table gives the total number of CEO appointments, the number of outside CEO
appointments, and the number of outside CEO appointments as a fraction of the total
number of CEO appointments according to the fraction of the board composed of outside
directors. The primary statistic of interest to us is the percentage of outside CEO appoint-
ments relative to total appointments. The table clearly demonstrates a positive correlation
between the percentage of outside CEO appointments and the fraction of outside directors.
The percentage of outside CEO appointments increases with the fraction of outside
directors, at least up to 70% outside directors. In the range of 0.60–0.70 outside directors,
the percentage of outside CEO appointments reaches a maximum of 49.3%. After 70%
outside directors, the percentage of outside CEO appointments drops off slightly.
Additionally, although 40% of the total number of CEO appointments in our sample
occur in companies for which outside directors comprise less than 0.40 of the board, only
8.0% of outside CEO appointments occur in these firms. Thus, in UK companies in which
inside directors dominate the board, appointment of an outside CEO is rare.

J. Dahya, J.J. McConnell / Journal of Corporate Finance 11 (2005) 37–60 45
For comparison, in Table 1, we present similar data for US CEO appointments taken
from BPT (1996). (Recall their sample encompasses 588 large public companies for the
years 1970–1988). For BPT, however, the number of observations for firms with boards
comprising 0–0.40 outside directors is so few that they compress these deciles into a
single category. Contrary to the United Kingdom, for the United States, the bulk of all
CEO appointments occur in the deciles of companies in which outside directors comprise
more than 0.70 of the board membership. That is, most of the companies in the United
States sample have boards dominated by outside directors.
Like the United Kingdom, in the United States, appointment of outside CEOs is rare in
companies with boards composed of fewer than 0.40 outside directors. Of course, in the
United States, few CEO appointments of any kind occur for boards with fewer than 0.40
outside directors because such companies are relatively rare. A further commonality
between the two sets of data is the positive relationship between the propensity for firms to
appoint outside CEOs and the fraction of outside directors. That is, as the fraction of
outside directors increases from decile to decile, the fraction of outside CEO appointments
increases as well, except at the very upper end of the range for UK companies. As we
document later, in a multivariate context, this apparent drop-off in the propensity to
appoint outside CEOs disappears.
Thus, based on the data so far, the evidence on CEO appointments and board composition
indicates that results from the United States can be generalized to at least one other country.
As we emphasized above, however, this relationship could be spurious due to an
endogenous relationship between CEO appointments and the fraction of outside directors.
5.2. UK board composition and CEO appointments through time
As a possible way to circumvent the potential endogeneity between board composition
and CEO appointments, we focus on an interval surrounding the publication of the
Cadbury Report in December 1992. Publication of the Cadbury Report presents a natural
experiment in which an external force pressured UK companies into increasing the number
of outside directors. Dahya et al. (2002) report that board sizes increased, on average, by
about 1.5 members (from 5.7 to 7.3) and that the fraction of outside directors increased by
about 10% (from 35.3% to 46.0%) over the 4 years following the Cadbury Report (1993–
1996) in comparison with the prior 4 years (1989–1992). They further report a significant
increase in the rate of CEO turnover from before to after publication of the Report, and this
increase in CEO turnover is concentrated among firms that came into compliance with the
recommendations of the Cadbury Committee.
Table 2 reports data on board composition and CEO turnover/appointments by year for
our sample for the period 1989–1999. As shown in the table, the total number of CEO
appointments over this period is 523. On an annual basis, the number of appointments is
relatively stable through time. However, because the number of firms in the sample
declines through time due to mergers, bankruptcies and other delistings, the rate of
turnover/appointments increases through time, especially after 1992.2 Over the 4 years,
2 Our sample begins with 700 companies. By 1999, the number of companies remaining in the sample is 417.
The sample encompasses 5895 firm-years.

Table 2
Number and rate of inside and outside CEO appointments over the period 1989–1999 for a sample of 700 UK companies
All firms Inside CEO appointments Outside CEO appointments
Year Number of
firms at
beginning
of the year
CEO
turnover and
appointments
Rate of
CEO
turnover
Board
size
Average
fraction
of outside
directors
Number Average
fraction
of outside
directors
Number Average
fraction
of outside
directors
Outside CEO
appointments
as percent
of all CEO
appointments
1989 700 49 7.0 5.9 0.35 36 0.32 13 0.43 26.53
1990 662 48 7.3 6.6 0.42 36 0.38 12 0.55 25.00
1991 626 47 7.5 5.6 0.44 34 0.42 13 0.50 27.66
1992 601 45 7.5 6.0 0.49 34 0.47 11 0.56 24.44
1993 578 48 8.3 7.3 0.55 34 0.49 14 0.57 29.17
1994 539 47 8.7 7.2 0.50 32 0.45 15 0.53 31.91
1995 499 48 9.6 7.6 0.50 34 0.48 14 0.54 29.17
1996 477 51 10.7 7.6 0.53 36 0.46 15 0.63 29.41
1997 458 48 10.5 8.0 0.57 32 0.49 16 0.60 33.33
1998 438 46 10.5 7.4 0.60 30 0.49 16 0.66 34.78
1999 417 46 11.0 7.7 0.61 29 0.50 17 0.69 39.16
Total 523 367 156
(Average) (0.46) (0.57)
The sample contains 700 industrial and financial firms listed on the LSE as of December 1988. The sample size declines through time due to takeovers, bankruptcies, and
other delistings. For each firm, for each year 1988–1999, the Corporate Register and/or annual filings maintained at Company’s House were used to gather data on the
identity of the CEO, the name of each director, the size of the board, and the number of outside directors. This procedure identified 523 CEO changes (i.e., turnover and
appointments). The rate of turnover and appointments is the number of appointments during the year divided by the number of companies in the sample at the beginning of
the year. A director is an ‘‘outsider’’ if he/she is listed as a nonexecutive director, is not related to the company’s controlling family, and was not employed by the company
historically. If the new CEO was a member of the board in the prior year, we consider this to be an ‘‘inside’’ CEO appointment. All others are ‘‘outside’’ CEO
appointments confirmed by articles in the Extel Weekly News Summaries, the Financial Times, and Macarthy’s News Information Service. Average fraction of outside
directors is the average of the number of outside directors divided by total directors for each company as of the beginning of each year.
J.Dahya,J.J.
McC
onnell
/JournalofCorporate
Finance
11(2005)37–60
46

J. Dahya, J.J. McConnell / Journal of Corporate Finance 11 (2005) 37–60 47
1989–1992, the average annual rate of CEO turnover/appointments is 7.3%. Over the next
7 years, the average annual rate is 10.1%. Thus, consistent with DMT, the rate of CEO
turnover and, therefore, the rate of CEO appointments increased significantly after 1992
( p-value for the difference = 0.08). Similarly, the average board size increased by about 1.5
members after 1992 (from 6.0 to 7.5) and the fraction of outside directors increased from
about 43% to 55%.
In terms of inside vs. outside CEO appointments, the table demonstrates several
phenomena. First, in those companies that appoint outside CEOs, the fraction of outside
directors is significantly higher than in those companies that appoint inside CEOs (i.e., 57%
vs. 46%). Second, both for companies that appoint outside CEOs and those that appoint
inside CEOs, the fraction of outside directors increases significantly, and by about the same
proportion, from before to after 1992. This result is consistent with CEO appointments and
board composition being endogenous. That is, regardless of whether the companies were
appointing outside or inside CEOs, the fraction of outside directors has increased through
time. For example, by 1999, for those companies that appointed inside CEOs in that year,
the fraction of outside directors (0.50) was about the same as for those firms that appointed
outside CEOs prior to 1992 (0.51). Thus, adding outside directors may not alter the CEO
appointment decision. It may merely change the board composition.
Third, however, according to the last column of the table, the number of outside CEO
appointments as a fraction of all CEO appointments did increase from before to after 1992.
Of the total of 189 CEO appointments over the 4 years 1989–1992, 26% were outsiders.
In comparison, of the 334 CEO appointments over the period 1993–1999, 32% were
outsiders. The p-value for the difference in percentages of outside CEO appointments from
before to after 1992 is 0.03. This result is consistent with an exogenously imposed increase
in outside directors increasing the likelihood of an outside CEO appointment.
According to BPT (1996), in the United States, an outside CEO is significantly more
likely to be appointed when the prior CEO was ‘‘forced’’ from office than when he/she
departed ‘‘voluntarily.’’ To examine whether this effect is present in our data, we replicate
the analysis of Table 2 separately for the set of companies in which the CEO appointments
followed ‘‘forced’’ turnover and for all others. We do not present these results in a table.
Similar to DMT, the rate of CEO turnover increased from before to after 1992, and the
increase was concentrated in the set of companies with forced turnover. That is, the rate of
CEO turnover increased following the Cadbury Report and the increase is due to an
increase in ‘‘forced’’ CEO turnover. Additionally, in those cases where CEO turnover is
forced, the fraction of outside CEO appointments is significantly higher than when CEO
turnover is voluntary (54% vs. 17%, p-value < 0.01). In our subsequent multivariate
analysis, we control for ‘‘forced’’ turnover.
5.3. Adoption of the Cadbury recommendations, board composition, and CEO
appointments
Our analysis of the time series of CEO appointments in Table 2 indicates that the rate of
outside appointments increased following publication of the Cadbury Report. If the Report
did have an impact on CEO appointments, the effect should be most pronounced among
those companies that adopted the Cadbury Committee’s outside director provision. That is,
J. Dahya, J.J. McConnell / Journal of Corporate Finance 11 (2005) 37–6048
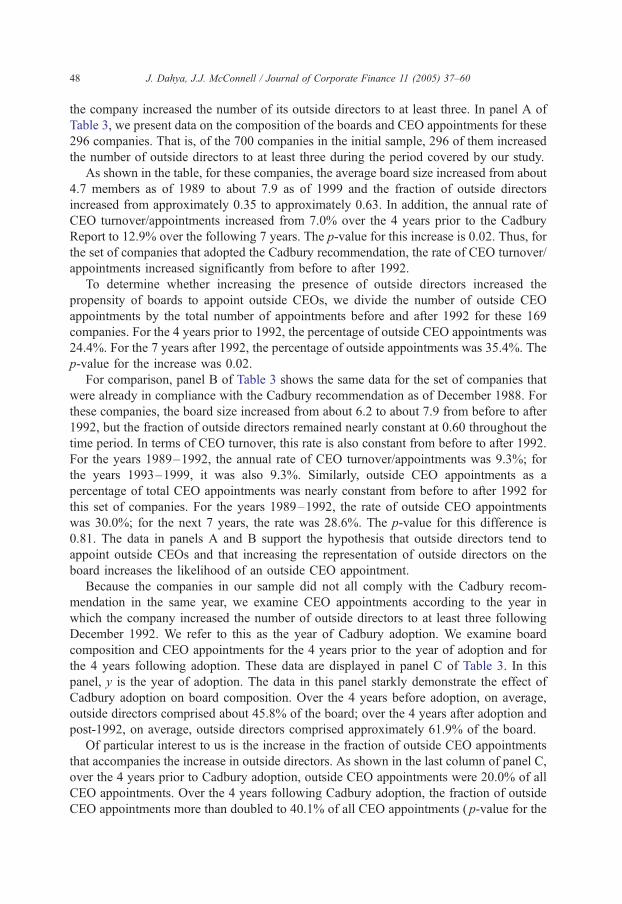
the company increased the number of its outside directors to at least three. In panel A of
Table 3, we present data on the composition of the boards and CEO appointments for these
296 companies. That is, of the 700 companies in the initial sample, 296 of them increased
the number of outside directors to at least three during the period covered by our study.
As shown in the table, for these companies, the average board size increased from about
4.7 members as of 1989 to about 7.9 as of 1999 and the fraction of outside directors
increased from approximately 0.35 to approximately 0.63. In addition, the annual rate of
CEO turnover/appointments increased from 7.0% over the 4 years prior to the Cadbury
Report to 12.9% over the following 7 years. The p-value for this increase is 0.02. Thus, for
the set of companies that adopted the Cadbury recommendation, the rate of CEO turnover/
appointments increased significantly from before to after 1992.
To determine whether increasing the presence of outside directors increased the
propensity of boards to appoint outside CEOs, we divide the number of outside CEO
appointments by the total number of appointments before and after 1992 for these 169
companies. For the 4 years prior to 1992, the percentage of outside CEO appointments was
24.4%. For the 7 years after 1992, the percentage of outside appointments was 35.4%. The
p-value for the increase was 0.02.
For comparison, panel B of Table 3 shows the same data for the set of companies that
were already in compliance with the Cadbury recommendation as of December 1988. For
these companies, the board size increased from about 6.2 to about 7.9 from before to after
1992, but the fraction of outside directors remained nearly constant at 0.60 throughout the
time period. In terms of CEO turnover, this rate is also constant from before to after 1992.
For the years 1989–1992, the annual rate of CEO turnover/appointments was 9.3%; for
the years 1993–1999, it was also 9.3%. Similarly, outside CEO appointments as a
percentage of total CEO appointments was nearly constant from before to after 1992 for
this set of companies. For the years 1989–1992, the rate of outside CEO appointments
was 30.0%; for the next 7 years, the rate was 28.6%. The p-value for this difference is
0.81. The data in panels A and B support the hypothesis that outside directors tend to
appoint outside CEOs and that increasing the representation of outside directors on the
board increases the likelihood of an outside CEO appointment.
Because the companies in our sample did not all comply with the Cadbury recom-
mendation in the same year, we examine CEO appointments according to the year in
which the company increased the number of outside directors to at least three following
December 1992. We refer to this as the year of Cadbury adoption. We examine board
composition and CEO appointments for the 4 years prior to the year of adoption and for
the 4 years following adoption. These data are displayed in panel C of Table 3. In this
panel, y is the year of adoption. The data in this panel starkly demonstrate the effect of
Cadbury adoption on board composition. Over the 4 years before adoption, on average,
outside directors comprised about 45.8% of the board; over the 4 years after adoption and
post-1992, on average, outside directors comprised approximately 61.9% of the board.
Of particular interest to us is the increase in the fraction of outside CEO appointments
that accompanies the increase in outside directors. As shown in the last column of panel C,
over the 4 years prior to Cadbury adoption, outside CEO appointments were 20.0% of all
CEO appointments. Over the 4 years following Cadbury adoption, the fraction of outside
CEO appointments more than doubled to 40.1% of all CEO appointments ( p-value for the

J. Dahya, J.J. McConnell / Journal of Corporate Finance 11 (2005) 37–60 49
difference < 0.01.) This result strongly points to the interpretation that outside board
members are more likely to appoint outside CEOs, and that an increase in outside directors
is likely to affect the CEO appointment decision.
5.4. Multivariate analysis
Other factors, in addition to board composition, are likely to affect the decision of
whether to appoint an inside or outside CEO. For example, the company’s prior
performance, the company’s size, and the concentration of share ownership might
influence the board’s decision. To control for these other factors, we conduct binomial
probit regressions on our sample of 523 CEO appointments.3
In each of our regressions, the dependent variable is an indicator to identify whether the
CEO appointment was an outsider (1) or an insider (0). In the first regression, the
independent variables are the company’s prior performance measured with ISARs as
described above, firm size measured as log of book assets, the number of directors as of
the beginning of the year, the fraction of directors who are outsiders as of the beginning of the
year, the fraction of shares owned by the board as of the beginning of the year, the fraction of
shares owned by institutions as of the beginning of the year, an indicator variable to identify
whether the appointment follows ‘‘forced’’ turnover (1) or not (0), an indicator variable to
identify whether the firm is a financial institution (1) or not (0), and an indicator variable to
identify whether the incumbent CEO was from outside (1) or inside (0) the company.
We include the company’s prior performance because companies that are performing
poorly may be more likely to appoint an outside CEO. We include size because large
companies may have a larger internal labor pool and may, therefore, be more likely to
appoint an inside CEO. We include board size and share ownership because these factors
may directly or indirectly influence the CEO appointment decision. We include an
indicator for forced turnover because our descriptive data indicate that an outside CEO
is more likely to be appointed when his/her predecessor was forced from office. We include
an indicator for financial institutions because a cursory examination of the data indicates
that financial institutions, as a general rule, have a larger fraction of outside directors than
firms in other industries. We include an indicator for whether the predecessor to the newly
appointed CEO was himself an insider or outsider at the time of his appointment. We
include the fraction of outside directors to determine whether the apparent positive
correlation between the fraction of outside directors and the likelihood of appointing an
outside CEO persists after controlling for other factors. Finally, we include the square of
the fraction of outside directors because the descriptive data in Table 1 present the
possibility that the relationship between the probability of an outside CEO appointment
and the fraction of outside directors may decline above a certain level of outside directors.
The results of this regression are presented in the first column of Table 4. According to
this regression, poorly performing companies are more likely to appoint an outside CEO
( p-value = 0.08); companies in which the prior CEO was ‘‘forced’’ from office are more
3 We also conduct bivariate probit regressions. In these regressions, the independent variables have the same
levels of significance as in Table 4. These results are available in tabular form from the authors by request.

Table 3
Number and rate of inside and outside CEO appointments grouped by Cadbury Committee compliance with respect to a minimum of three outside directors over the period
1989–1999 for a sample of 700 UK companies
All firms Inside CEO appointments Outside CEO appointments
Year Number of
firms at
beginning
of the year
CEO
turnover
Rate of
CEO
turnover
Board
size
Average
fraction
of outside
directors
Number Average
fraction
of outside
directors
Number Average
fraction
of outside
directors
Outside CEO
appointments
as percent
of all CEO
appointments
Panel A: CEO appointments for firms that adopted the Cadbury Committee recommendations of at least three outside directors anytime over 1989–1999
1989 296 19 6.4 4.7 0.35 14 0.28 5 0.52 26.32
1990 277 18 6.5 4.7 0.30 14 0.26 4 0.44 22.22
1991 271 20 7.4 4.9 0.37 15 0.30 5 0.47 25.00
1992 264 21 8.0 5.0 0.41 16 0.36 5 0.49 23.81
1993 250 25 10.0 6.3 0.57 17 0.51 8 0.64 32.00
1994 243 27 11.1 7.0 0.62 17 0.55 10 0.68 39.04
1995 233 26 11.2 7.5 0.61 17 0.56 9 0.67 34.62
1996 224 31 13.8 7.8 0.64 20 0.57 11 0.68 35.48
1997 222 32 14.4 8.2 0.65 20 0.53 12 0.69 37.50
1998 217 34 15.7 8.0 0.64 22 0.57 12 0.67 35.29
1999 208 31 14.9 7.9 0.63 20 0.55 11 0.67 35.48
Total 284 192 92
(Average) (0.53) (0.63)
Panel B: CEO appointments for the firms that were always in compliance with the Cadbury Committee recommendations of at least three outside directors over 1989–1999
1989 203 17 8.4 6.3 0.59 12 0.43 5 0.62 29.41
1990 194 18 9.3 6.2 0.64 12 0.47 6 0.60 33.33
1991 184 19 10.3 6.2 0.56 13 0.51 6 0.70 31.58
1992 170 16 9.4 6.0 0.59 12 0.51 4 0.62 25.00
1993 159 16 10.1 6.8 0.62 12 0.54 4 0.68 25.00
1994 147 14 9.5 7.2 0.56 10 0.54 4 0.66 28.57
1995 138 14 10.1 7.9 0.65 10 0.54 4 0.62 28.57
1996 130 13 10.0 7.9 0.55 10 0.59 3 0.65 23.08
J.Dahya,J.J.
McC
onnell
/JournalofCorporate
Finance
11(2005)37–60
50
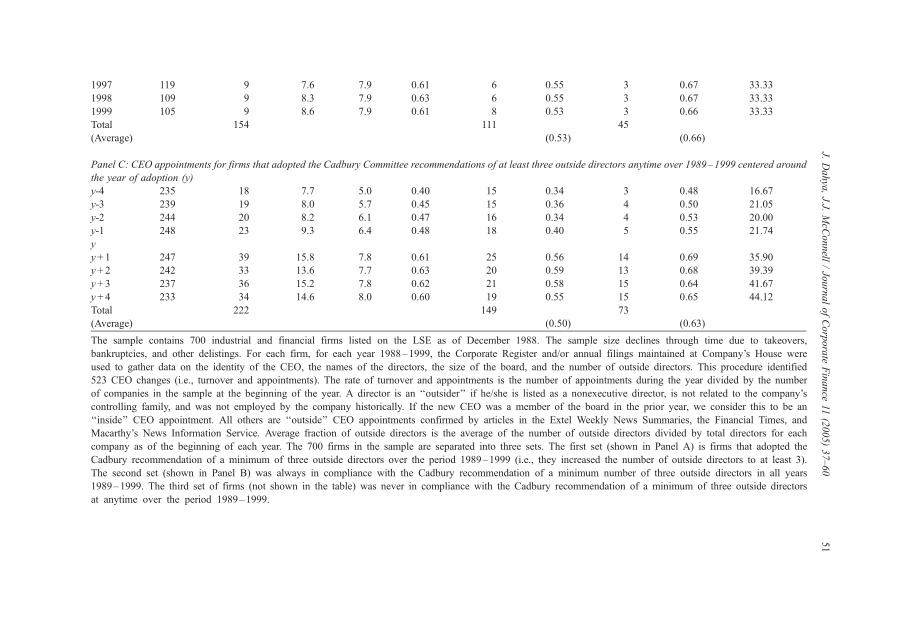
1997 119 9 7.6 7.9 0.61 6 0.55 3 0.67 33.33
1998 109 9 8.3 7.9 0.63 6 0.55 3 0.67 33.33
1999 105 9 8.6 7.9 0.61 8 0.53 3 0.66 33.33
Total 154 111 45
(Average) (0.53) (0.66)
Panel C: CEO appointments for firms that adopted the Cadbury Committee recommendations of at least three outside directors anytime over 1989–1999 centered around
the year of adoption (y)
y-4 235 18 7.7 5.0 0.40 15 0.34 3 0.48 16.67
y-3 239 19 8.0 5.7 0.45 15 0.36 4 0.50 21.05
y-2 244 20 8.2 6.1 0.47 16 0.34 4 0.53 20.00
y-1 248 23 9.3 6.4 0.48 18 0.40 5 0.55 21.74
y
y + 1 247 39 15.8 7.8 0.61 25 0.56 14 0.69 35.90
y + 2 242 33 13.6 7.7 0.63 20 0.59 13 0.68 39.39
y + 3 237 36 15.2 7.8 0.62 21 0.58 15 0.64 41.67
y + 4 233 34 14.6 8.0 0.60 19 0.55 15 0.65 44.12
Total 222 149 73
(Average) (0.50) (0.63)
The sample contains 700 industrial and financial firms listed on the LSE as of December 1988. The sample size declines through time due to takeovers,
bankruptcies, and other delistings. For each firm, for each year 1988–1999, the Corporate Register and/or annual filings maintained at Company’s House were
used to gather data on the identity of the CEO, the names of the directors, the size of the board, and the number of outside directors. This procedure identified
523 CEO changes (i.e., turnover and appointments). The rate of turnover and appointments is the number of appointments during the year divided by the number
of companies in the sample at the beginning of the year. A director is an ‘‘outsider’’ if he/she is listed as a nonexecutive director, is not related to the company’s
controlling family, and was not employed by the company historically. If the new CEO was a member of the board in the prior year, we consider this to be an
‘‘inside’’ CEO appointment. All others are ‘‘outside’’ CEO appointments confirmed by articles in the Extel Weekly News Summaries, the Financial Times, and
Macarthy’s News Information Service. Average fraction of outside directors is the average of the number of outside directors divided by total directors for each
company as of the beginning of each year. The 700 firms in the sample are separated into three sets. The first set (shown in Panel A) is firms that adopted the
Cadbury recommendation of a minimum of three outside directors over the period 1989–1999 (i.e., they increased the number of outside directors to at least 3).
The second set (shown in Panel B) was always in compliance with the Cadbury recommendation of a minimum number of three outside directors in all years
1989–1999. The third set of firms (not shown in the table) was never in compliance with the Cadbury recommendation of a minimum of three outside directors
at anytime over the period 1989–1999.
J.Dahya,J.J.
McC
onnell
/JournalofCorporate
Finance
11(2005)37–60
51

Table 4
Probit regressions of outside CEO appointments for a sample of 523 CEO appointments by 700 UK firms over the
period 1989–1999
Independent variables (i) (ii) (iii) (iv)
Intercept 0.954 (0.414) 0.809 (0.496) 0.736 (0.535) 0.872 (0.456)
Control variables
ISAR (Industry-and
size-adjusted stock return)
� 0.122 (0.070) � 0.124 (0.066) � 0.122 (0.067) � 0.127 (0.065)
Log of book value of assets � 1.021 (0.022) � 1.014 (0.024) � 0.995 (0.024) � 1.035 (0.022)
Indicator for forced CEO turnover 0.745 (0.000) 0.743 (0.000) 0.763 (0.000) 0.765 (0.000)
Indicator for financial institutions � 0.047 (0.774) � 0.043 (0.797) � 0.071 (0.660) � 0.060 (0.708)
Board share ownership � 0.152 (0.600) � 0.167 (0.567) � 0.164 (0.588) � 0.162 (0.584)
Institutional share ownership � 0.607 (0.284) � 0.630 (0.266) � 0.581 (0.316) � 0.623 (0.272)
Board size 0.019 (0.393) 0.015 (0.497) 0.017 (0.442) 0.012 (0.606)
Indicator for origin of
incumbent CEO
� 0.264 (0.168) � 0.265 (0.167) � 0.279 (0.145) � 0.274 (0.152)
Outside director variables
Fraction of outside directors 2.077 (0.046)
Fraction of outside
directors squared
� 0.585 (0.572)
z 0.000–0.299 outside directors 2.741 (0.062) 2.500 (0.063) 2.690 (0.066)
z 0.300–0.499 outside directors 2.390 (0.002) 2.334 (0.004) 2.303 (0.004)
z 0.500–0.799 outside directors 1.881 (0.000) 1.762 (0.000) 1.807 (0.000)
z 0.800–1.000 outside directors 1.732 (0.000) 1.763 (0.000) 1.659 (0.000)
Indicator for Cadbury adoption 0.375 (0.010) 0.078 (0.588)
Log-likelihood � 266.57 � 265.68 � 267.22 � 265.81
Pseudo r2 0.1311 0.1341 0.1290 0.1336
The sample contains 700 industrial and financial firms listed on the LSE as of December 1988. For each firm, for
each year 1988–1999, the Corporate Register and/or annual filings at Company’s House were used to gather data
on the identity of the CEO, the names of the directors, the size of the board, the number of outside directors the
fraction of shares owned by the board and financial institutions, and whether the incumbent CEO had come from
inside or outside the company. This procedure identified 523 CEO appointments. A director is an ‘‘outsider’’ if
he/she is listed as a nonexecutive director, is not related to the company’s controlling family, and not employed by
the company historically. If the new CEO was a member of the board in the prior year, we consider this to be an
‘‘inside’’ CEO appointment. All others are ‘‘outside’’ CEO appointments confirmed by articles in the Extel
Weekly News Summaries, the Financial Times and Macarthy’s News Information Service. The fraction of outside
directors is the number of outside directors divided by total directors for each company as of the beginning of
each year. The dependent variable in the regressions is 1 if an outside CEO is appointed and 0 otherwise. Stock
price and book assets are from Datastream. Industry- and size-adjusted stock returns (ISAR) are calculated by
subtracting the daily stock returns of an industry- and size-matched portfolio from the daily return of the sample
firm beginning 253 days prior to and ending 3 days prior to the announcement of a CEO appointment. Indicator
for forced turnover is 1 when: (a) a news article states that the CEO was ‘‘fired’’, (b) an article states that the CEO
‘‘resigned’’, or (c) an article indicates that the company was experiencing poor performance. In addition, for (b)
and (c), the executive must be less than 60 years old. The Cadbury-adoption indicator is 1 when firms increased
the number of outside directors to at least three over the period 1993–1999. p-value for two-tailed tests are in
parentheses.
J. Dahya, J.J. McConnell / Journal of Corporate Finance 11 (2005) 37–6052
likely to appoint an outside CEO ( p-value < 0.01); and smaller companies are more likely
to appoint outside CEOs ( p-value = 0.02). The coefficient of the incumbent’s origin is
negative, albeit not significant at the 0.10 level—its p-value is 0.17. This hints that, after
controlling for other factors, if the existing CEO is from inside the firm, the next CEO is
slightly more likely to come from outside the firm and vice versa. None of the other

J. Dahya, J.J. McConnell / Journal of Corporate Finance 11 (2005) 37–60 53
control variables even begin to approach significance at any meaningful level (all p-
values>0.28). In each of our subsequent regressions, the p-values of these control
variables, along with that of the incumbent’s origin, are essentially the same as those in
the first regression. Thus, we will not comment further on these variables.
The variables of particular interest, for our purposes, are the fraction of outside directors
and the fraction of outside directors squared. The coefficient of the fraction of outside
directors is positive and significant ( p-value = 0.05). The coefficient of the square of the
fraction of outside directors is mildly negative, but does not approach statistical
significance ( p-value = 0.59).
To explore further the possibility of a nonlinear relationship between the likelihood of
an outside CEO appointment and the fraction of outside directors, we estimate a
piecewise linear regression with four segments: 0.0–0.299, 0.300–0.499, 0.500–
0.799, and 0.800–1.000 for the fraction of outside directors.4 The results of this
regression are given in the second column of Table 4. According to this regression,
after controlling for other factors in a multivariate context, the relationship between the
fraction of outside directors and the probability of an outside CEO appointment is
positive and statistically significant over each of the four line segments. That is, the
likelihood of an outside CEO appointment increases over the entire range as the fraction
of outside directors increases. Because the explanatory power of the regression with the
piecewise specification for the fraction of outside directors is marginally higher than for
the regression with the fraction of outside directors squared, we use this specification in
subsequent analyses.
The estimated positive correlation between the fraction of outside directors and outside
CEO appointments is consistent with BPT (1996) and with the proposition that outside
directors are more likely to appoint outside CEOs. However, as we discussed above, this
result is also consistent with a spurious correlation between CEO appointments and the
fraction of outside directors that derives from an endogenous relationship between the
CEO appointment decision and board composition.
Our third regression aims to control for the possible endogeneity between the fraction
of outside directors and the likelihood of an outside CEO appointment. This regression
includes all of the control variables from the second regression. Additionally, we include
an indicator variable to identify firms that came into compliance with the Cadbury
recommendation following December 1992.5 That is, we include an indicator variable for
the set of companies that increased the number of outside directors to at least three over the
interval January 1993–1999. For these companies, if a CEO appointment occurs after
compliance with this provision of the Cadbury Report, the indicator variable is set equal to
1. For all other appointments, this variable is set to 0.
4 We also experimented with other breakpoints in the regression equation. The regression reported in Table 4
is the one with the greatest explanatory power (i.e., the highest pseudo R2).5 Using December 1992 as the cutoff for Cadbury-coerced outside director appointments probably
understates the effect of the Cadbury Committee on outside board appointments because the Committee was
appointed in May of 1991 and issued a draft report in June of 1992. A number of companies appear to have added
outside directors during 1991 and 1992 in anticipation of the eventual final report.

J. Dahya, J.J. McConnell / Journal of Corporate Finance 11 (2005) 37–6054
For each appointment, we also include the fraction of outside directors. However, for
companies that adopt the Cadbury recommendation (i.e., change their boards to come into
compliance) following 1992, we keep the fraction of outside directors at its preadoption
level. The question we are asking, then, is—does coming into compliance with the
Cadbury Report affect the CEO appointment decision after controlling for what the
composition of the board would have been at its preadoption level? For all other
appointments, we use the fraction of the board composed of outside directors. Further-
more, for CEO appointments by companies that came into compliance during the period
studied, but for which an appointment preceded compliance, we use the fraction of outside
directors on the board as of the CEO appointment date.
The results of this regression are given in the third column of Table 4. The coefficients
for the fractions of outside directors continue to be positive and to have the same levels of
significance as in the prior regression. Additionally, the coefficient of the Cadbury
adoption indicator variable is positive and highly significant ( p-value = 0.01). This result
indicates that companies that alter their boards to become compliant with the Cadbury
Report are significantly more likely to appoint an outside CEO than they would have been
in the absence of this alteration to their boards. Importantly, this result is inconsistent with
the hypothesis that the CEO appointment process and board composition are (completely)
endogenous. That is, these data indicate that this exogenously induced modification to
board composition has altered CEO appointment decisions in the United Kingdom.
One further question that we investigate is whether the movement to three outside
directors is consequential in itself or whether it is the implied increase in the fraction of
outside directors that fundamentally affects the CEO appointment decision. To explore that
question we estimate the final regression in Table 4. This regression is the same as the third
regression except that, for each appointment, we use the fraction of outside directors at the
time of CEO appointment regardless of whether the company adopted the Cadbury
recommendation. In addition, we include the indicator variable to identify firms that
adopted the recommendation post-1992.
As shown in the table, the significance levels for the fraction of outside directors are
similar to those in the second regression, but the significance level of the Cadbury
adoption indicator variable drops to 0.58. This regression indicates that it is not the
appointment of three outside directors that is critical, rather it is the increase in the fraction
of outside directors that is consequential to the appointment decision. Or, to put it
differently, the appointment of three outside directors is likely to have much less effect in a
board with 15 members than in a board with five members.
5.5. Accounting performance
We also estimated each of the regressions in Table 4 with our measure of accounting
performance, IAROA, (as described in Section 4) in place of stock price performance,
ISAR. The levels of significance of the coefficients in these regressions are nearly identical
to those in Table 4.6
6 These results are available in tabular form from the authors by request.

5.6. A different type of endogeneity
Our analysis has considered the possibility that the correlation between the fraction of
outside directors and the likelihood of an outside CEO appointment is spurious due to an
endogeneity in CEO appointment decisions and board composition. However, our results
could be influenced by a different type of endogeneity. For example, suppose that a firm is
performing poorly. Suppose, then, that a decision is made both to add outside directors and
to appoint an outside CEO. In that case, the observed correlation between the addition of
outside directors and the appointment of an outside CEO is spurious. It is not due to any
cause and effect relation between the presence of outside directors and CEO appointments.
Rather, it is due to concurrent decisions to add outside directors and to appoint an outside
CEO neither of which were in response to Cadbury and both of which would have
happened in the absence of Cadbury.
This type of spurious correlation is unlikely to explain our results. First, in conducting
our analysis, we do not consider a CEO appointment to be post-Cadbury adoption unless
the appointment occurred during the year following the calendar year in which the firm
increased the number of outside directors to three or more. Thus, the two events are not
concurrent by construction.
Still, however, it may be that the outside CEO appointments tend to occur with a short
lag following a change in board composition. If so, outside CEO appointments would be
clustered immediately after Cadbury adoption. To evaluate this possibility, we examine the
time series of outside CEO appointments relative to the year in which a company adopted
Cadbury. For the 57 outside CEO appointments that occurred in the 4 years immediately
after the companies adopted Cadbury, 14 occurred during the first calendar year following
the year of adoption, 13 occurred during the second calendar year after adoption, 15
occurred during the third year, and 15 occurred during the fourth year. Over these 4 years,
the number of firms in the sample declines slightly, but the number of outside CEO
appointments remains steady. Thus, postadoption outside CEO appointments were not
clustered shortly after the companies adopted Cadbury. Again, these data are not consistent
with the concurrent appointment of outside directors and an outside CEO, both of which
would have occurred in the absence of Cadbury.
J. Dahya, J.J. McConnell / Journal of Corporate Finance 11 (2005) 37–60 55
6. Stock prices and appointments of CEOs
Our analyses of board composition and CEO appointments indicate that the mandating
of additional outside directors to corporate boards is likely to lead to different board
decisions, or at least different CEO appointment decisions. Whether these decisions will be
better is another question. In this section, we present evidence on that question by
performing an event study in which we examine stock returns around announcements of
appointments of CEOs.
To conduct our event study, we use the market model procedure with market model
parameters estimated using daily stock returns over the interval of 153 trading days
prior to the announcement day through 3 days prior to the announcement day. We
examine excess stock returns over the 2-day interval that encompasses the day on which

J. Dahya, J.J. McConnell / Journal of Corporate Finance 11 (2005) 37–6056
the company issued its press release announcing a CEO appointment and the following
day.
We conduct our event study of CEO appointments with the 523 appointments in our
sample. Announcement dates are taken from Extel Weekly News Summaries. As shown in
panel A of Table 5, for the 156 outside CEO appointments, the 2-day announcement
period average excess stock return is 0.794% with a p-value of 0.01. For the 367 inside
CEO appointments, the average excess stock return is 0.203% with a p-value of 0.20. The
p-value for the difference between the two average excess returns is less than 0.01. Thus,
the stock price reaction to both inside and outside CEO appointments is positive, but the
reaction to outside appointments is significantly greater than the reaction to inside CEO
appointments, and the reaction to inside appointments is not significantly different from
zero. Thus, to the extent that increasing the presence of outside directors increases the
likelihood of outside CEO appointments, coerced changes in board composition that
Table 5
Stock price response to 523 CEO appointments by 700 UK firms over the period 1989–1999
Number Inside CEO
appointments
Number Outside CEO
appointments
Panel A: Stock price response on the announcement of CEO appointments
Appointments 367 0.203 (0.20) 156 0.794 (0.01)
Pre-Cadbury CEO appointments 140 0.219 (0.19) 49 0.781 (0.01)
Post-Cadbury CEO appointments 227 0.187 (0.21) 107 0.803 (0.01)
Departing CEO had been appointed
from inside the firm
319 0.210 (0.19) 127 0.818 (0.01)
Departing CEO had been appointed
from outside the firm
48 0.191 (0.20) 29 0.764 (0.02)
Panel B: Stock price response on the announcement of CEO appointments classified according to likelihood of a
CEO appointment based on the last regression in Table 4
0.00–0.33 (Low probability) 49 0.311 (0.12) 50 1.135 ( < 0.01)
0.34–0.66 (Medium probability) 125 0.207 (0.20) 57 0.784 (0.01)
0.67–1.00 (High probability) 193 0.097 (0.62) 49 0.430 (0.05)
Panel C: Cross-sectional regressions for the 2-day announcement period excess return on the likelihood of a
CEO appointment based on the last regression in Table 4
Regression coefficient ( p-value) 367 � 0.168 (0.29) 156 � 0.435 (0.10)
The sample contains 700 industrial and financial firms listed on the LSE as of December 1988. For each firm, for
each year 1988–1999, the Corporate Register and/or annual filings at Company’s House were used to gather data
on the identity of the CEO, the names of the directors, the size of the board, the number of outside directors, the
fraction of shares owned by the board and financial institutions, and whether the incumbent CEO was from inside
or outside the company. This procedure identified 523 CEO appointments. A director is an ‘‘outsider’’ if he/she is
listed as a nonexecutive director, is not related to the company’s controlling family, and was not employed by the
company historically. If the new CEO was a member of the board in the prior year, we consider this to be an
‘‘inside’’ CEO appointment. All others are ‘‘outside’’ CEO appointments confirmed by articles in the Extel
Weekly News Summaries, the Financial Times and Macarthy’s News Information Service. Stock prices are from
Datastream. Event study stock returns are calculated by subtracting the daily stock returns of the LSE All Share
Index from the daily return of the sample firm 1 day prior to and ending on the announcement day of a CEO
appointment. The likelihood of a CEO appointment is estimated from the final regression in Table 4. p-value for
two-tailed tests are in parentheses.
J. Dahya, J.J. McConnell / Journal of Corporate Finance 11 (2005) 37–60 57
increase the fraction of outside directors appear to be good news for shareholders. That is,
not only do such modifications give rise to different board decisions, the stock price data
indicate that market participants view the decisions as better.
As a refinement of this test, we split the outside appointments into those that occurred
pre-1992 and/or pre-Cadbury adoption (the preadoption set) and those that occurred post-
1992 and post-Cadbury adoption (the postadoption set) and conduct an event study for the
two groups separately. We conduct this analysis because our set of outside CEO appoint-
ments contains some that occurred prior to the Cadbury Report and some that occurred
post-1992, but were not among companies that had recently complied with the Cadbury
Report. Presumably, the CEO appointment decisions by these companies were not altered
by the Cadbury recommendation. They would have occurred anyway. It is possible that the
significant excess return associated with outside appointments is due to those that would
have occurred regardless of the Cadbury Report. As shown in Table 5, the average 2-day
announcement period excess return for the preadoption set is 0.78%; for the postadoption
set, it is 0.80%. Thus, the positive excess return associated with outside CEO appointment
is not confined to those that would have occurred regardless of Cadbury—outside CEO
appointments appear to be good news for shareholders.
We examine one other factor. We split the sample according to the origin of the
departing CEO and the origin of the new CEO. That is, we split the sample into four sets—
those in which the departing CEO and the new CEO were from inside the company (319
observations); those in which the departing CEO and the new CEO were from outside the
company (29 observations); those in which the departing CEO was from outside while his
replacement was from inside (48 observations) and the remainder set (127 observations).
The stock price reactions are positive and significant for outside CEO appointments and
insignificant for inside appointments regardless of the incumbent’s origins.
One well-recognized shortcoming of simple event studies such as this one is that they
do not control for investors’ expectations. For example, it could be that inside appoint-
ments are well anticipated, whereas, outside appointments involve greater uncertainty. In
that case, it could be that inside and outside appointments are viewed equally positively by
market participants, but because inside appointments have been well anticipated, the
observed stock price reaction to such appointments is muted. If we could control for
market expectations, we would expect to see the greatest stock price reaction, either
positive or negative, to appointments that run counter to expectations. That is, suppose
market participants had been expecting an inside CEO appointment, but the company
announces an outside appointment. Then, assuming that an outside appointment is good
news, we would expect a larger and positive stock price reaction relative to the case in
which investors had been expecting an outside appointment and an outside appointment
was announced, although the outside appointment is still good news.
Now consider the opposite case. Suppose market participants had been expecting an
outside appointment, but the firm announces an inside appointment. Again, assuming that
an outside appointment is good news, the stock price response should be lower relative to
the case in which investors had been expecting an inside appointment and an inside
appointment was announced.
To calibrate market expectations, we use the final regression from Table 4 to estimate
the likelihood of an outside CEO appointment for each appointment in our sample. For the
J. Dahya, J.J. McConnell / Journal of Corporate Finance 11 (2005) 37–6058
sample of outside CEO appointments, we group the 2-day announcement period excess
return into three mutually exclusive groups according to the probability of an outside CEO
appointment implied from Table 4. They are (1) low probability: 0.00–0.33, (2) medium
probability: 0.34 and 0.66; and (3) high probability: 0.67–1.00. The event study results for
the corresponding groups of CEO appointments are presented in the last column in panel B
of Table 5. Outside CEO appointments are associated with statistically significant positive
announcement period returns and, importantly, as the probability of an outside appoint-
ment declines, the announcement period excess return becomes larger. That is, the more
unexpected the outside appointment is, the more positive is the stock price response. For
example, when the probability of an outside appointment is 0.67–1.00, the announcement
period excess return is 0.43% ( p-value = 0.05); when the probability of an outside
appointment is 0.00–0.33, the announcement period excess return is 1.135% ( p-val-
ue < 0.01). As regards inside CEO appointments, in no category is the announcement
period return significantly different from 0.
To further explore the relation between market expectations and announcement period
returns, we regress the 2-day announcement period excess returns against the implied
probability of an outside CEO appointment from Table 4. The results of the cross-sectional
regressions are presented in the last column in panel C of Table 5. If outside CEO
appointments are good news, or at least better news than an inside appointment, the
coefficient of this cross-sectional OLS regression should be negative—as it is, with a p-
value of 0.10. Then, for the sample of inside appointments, we perform the same
regression the results of which are given in the middle column of panel C of Table 5.
Again, if outside appointments are good news or, more accurately, if they are less better
news than inside appointments, the coefficient for inside CEO appointments will be
negative—which it is again, but, in this case, the p-value is only 0.29. The regression
results support our interpretation of the event study to mean that investors view outside
CEO appointments as good news.
7. Commentary and conclusions
Over the last decade (and beyond), stock exchanges and governmental bodies have
pushed publicly traded companies to increase the number and fraction of outside directors
on their boards. Specifically, over the period 1993–2000, at least 18 countries have seen
publication of official reports that recommend or mandate either a minimum fraction or a
minimum number of outside directors for public companies and this minimum is
substantially higher than the historical norm in those countries. This movement toward
an increased role for outside directors appears to rest on the twin presumptions that boards
with more outside directors will make different decisions, and that those decisions will be
better, than otherwise would have been the case. Both of these premises are largely
untested.
In this study, we investigate whether an increase in outside directors is likely to
influence one, arguably primary, board decision—the appointment of the company’s
CEO. Our investigation of data from the United Kingdom over a time period that spans
the publication of the Cadbury Report—which radically altered UK board composi-
J. Dahya, J.J. McConnell / Journal of Corporate Finance 11 (2005) 37–60 59
tions—provides a natural experiment to examine the effect of a change in board structure
on board decisions. With a sample of 523 CEO appointments over the period 1989–
1999, we find a significant positive correlation between the likelihood of an outside CEO
appointment and the fraction of outside directors on the board. More importantly, we find
that the likelihood of an outside CEO appointment is significantly higher among those
firms that became compliant with the recommendations of the Cadbury Report. This
result indicates that increasing the representation of outside directors on the board is
likely to influence board decisions, at least as regards the appointment of inside or
outside CEOs.
An equally important question is whether the decisions will be better. We provide
evidence on that question by conducting an event study surrounding announcements of
CEO appointments in our sample. The average 2-day stock price reaction to announce-
ments of outside CEO appointments is significantly greater than the average 2-day stock
price reaction to announcements of inside CEO appointments. Thus, to the extent that
outside directors are more likely to appoint outside CEOs, investors appear to perceive that
boards with substantial outside director representation make better decisions.
Our data appear to indicate that the global movement toward greater outside director
representation will lead to different and, perhaps, better board decisions. Several caveats
are in order. First, our study encompasses only one country. Whether our results can be
generalized globally is an open question. As emphasized by La Porta et al. (1997, 1998)
and Stulz and Williamson (2001), among others, corporate governance systems appear to
differ systematically across countries and cultures. If so, generalizing results from one
political or cultural regime to another may be hazardous. Although our results are
buttressed by an earlier study from the United States, the similar common law origins
of the United Kingdom and the US corporate governance systems must be considered
when applying the results to other countries. As other countries gain experience with their
own mandates for additional outside directors, their data will provide fertile grounds for
further study of the questions examined herein.
Second, our analysis considers only one specific board task. Whether our results can be
generalized to other board decisions is also an open question.
Finally, the results of our analysis of whether decisions by boards with more outside
directors are better (as well as different) are suggestive, but still preliminary. In future
work, we hope to extend our analysis of whether outside directors make better decisions to
encompass other countries and other, more general, measures of corporate performance.
References
Bhagat, S., Black, B., 2002. The non-correlation between board independence and long-term firm performance.
Journal of Corporation Law 27, 232–273.
Borokhovich, K.A., Parrino, R., Trapani, T., 1996. Outside directors and CEO selection. Journal of Financial and
Quantitative Analysis 31, 337–355.
Bradbury, M.E., Mak, Y.T., 2000. Ownership structure, board composition, and the adoption of charter takeover
procedures. Journal of Corporate Finance 6, 165–188.
Brickley, J.A., Coles, J.L., Terry, R.L., 1987. The takeover market, corporate board composition, and ownership
structure: the case of banking. Journal of Law and Economics 30, 161–180.

J. Dahya, J.J. McConnell / Journal of Corporate Finance 11 (2005) 37–6060
Byrd, J.W., Hickman, K.A., 1992. Do outside directors monitor managers? Evidence from tender offer bids.
Journal of Financial Economics 32, 195–221.
Cadbury Report of the Committee on the Financial Aspects of Corporate Governance, Gee Publications, De-
cember 1992, http://www.ecgn.org/ecgn/docs/codes/cadbury.pdf.
Campbell II, T.L., Keys, P.Y., 2002. Corporate governance in South Korea: the Chaebol experience. Journal of
Corporate Finance 8, 373–391.
Core, J.E., Holthausen, R.W., Larcker, D.F., 1999. Corporate governance, CEO compensation, and firm perfor-
mance. Journal of Financial Economics 51, 371–406.
Cotter, J., Shivdasani, A., Zenner, M., 1997. Do independent directors enhance target shareholder wealth during
tender offers? Journal of Financial Economics 43, 195–218.
Coughlan, A.T., Schmidt, R.M., 1985. Executive compensation, management turnover, and firm performance.
Journal of Accounting and Economics 7, 43–66.
Dahya, J., McConnell, J.J., Travlos, N.G., 2002. The Cadbury committee, corporate performance, and top
management turnover. Journal of Finance 57, 461–483.
Denis, D.J., Denis, D.K., 1995. Performance changes following top management dismissals. Journal of Finance 50,
1029–1057.
Gilson, S., 1990. Management turnover and financial distress. Journal of Financial Economics 25, 241–262.
Handbook for Issuers on the Copenhagen Stock Exchange, Corporate Governance in Denmark, December 2001.
Hanson, R.C., Moon, M.H., 2000. Managerial ownership, board structure, and the division of gains in divest-
itures. Journal of Corporate Finance 6, 55–70.
Hermalin, B., Weisbach, M., 1998. Endogenously chosen boards of directors and their monitoring of the CEO.
American Economic Review 88, 96–118.
Huson, M., Parrino, R., Starks, L.T., 1998. Internal monitoring mechanisms and CEO turnover: a long term
perspective.
Kang, J., Shivdasani, A., 1995. Firm performance, corporate governance, and top executive turnover in Japan.
Journal of Financial Economics 38, 29–58.
Kaplan, S.N., Reishaus, D., 1990. Outside directorships and corporate performance. Journal of Financial Eco-
nomics 27, 389–410.
Klein, A., Rosenfeld, J., 1988. Targeted share repurchases and top management changes. Journal of Financial
Economics 20, 493–506.
La Porta, R., Lopez-de-Silanes, F., Shleifer, A., Vishny, R.W., 1997. Legal determinants of external finance.
Journal of Finance 52, 1131–1150.
La Porta, R., Lopez-de-Silanes, F., Shleifer, A., Vishny, R.W., 1998. Law and finance. Journal of Political
Economy 106, 471–518.
Lee, C.I., Rosenstein, S., Rangan, N., Davidson III, W.N., 1992. Board composition and shareholder wealth: the
case of management buyouts. Financial Management 21, 58–72.
Mak, Y.T., Li, Y., 2001. Determinants of corporate ownership and board structure: evidence from Singapore.
Journal of Corporate Finance 7, 235–256.
Martin, K., McConnell, J.J., 1991. Corporate performance, corporate takeovers, and top management turnover.
Journal of Finance 46, 671–687.
Murphy, K.J., Zimmerman, J.L., 1993. Financial performance surrounding CEO turnover. Journal of Accounting
and Economics 16, 273–315.
Parrino, R., 1997. CEO turnover and outside succession: a cross-sectional analysis. Journal of Financial Eco-
nomics 46, 165–197.
Stulz, R.M., Williamson, R., 2001. Culture, openness, and finance.
Wahal, S., Wiles, K.W., Zenner, M., 1995. Who opts out of antitakeover protection? The case of Pennsylvanian’s
SB 1310. Financial Management 24, 22–39.
Warner, J.B., Watts, R.L., Wruck, K.H., 1988. Stock prices and top management changes. Journal of
Financial Economics 20, 461–492.
Weisbach, M., 1988. Outside directors and CEO turnover. Journal of Financial Economics 20, 431–460.
Yermack, D., 1997. Good timing: CEO stock option awards and company news announcements. Journal of
Financial Economics 52, 449–476.