output-only modal identification of a cable-stayed...
TRANSCRIPT

Engineering Structures 30 (2008) 1820–1830www.elsevier.com/locate/engstruct
Output-only modal identification of a cable-stayed bridge using wirelessmonitoring systems
Jian-Huang Wenga, Chin-Hsiung Loha,∗, Jerome P. Lynchb, Kung-Chun Lua,Pei-Yang Linc, Yang Wangd
a Department of Civil Engineering, National Taiwan University, Taipei, Taiwanb Department of Civil & Environmental Engineering, University of Michigan, Ann Arbor, USA
c National Center for Research on Earthquake Engineering, Taipei, Taiwand School of Civil & Environmental Engineering, Georgia Institute of Technology, Atlanta, USA
Received 25 April 2006; received in revised form 21 September 2007; accepted 5 December 2007Available online 15 January 2008
Abstract
The objective of this paper is to present two modal identification methods that extract dynamic characteristics from output-only data setscollected by a low-cost and rapid-to-deploy wireless structural monitoring system installed upon a long-span cable-stayed bridge. Specifically, anextensive program of full-scale ambient vibration testing has been conducted to measure the dynamic response of the 240 m Gi-Lu cable-stayedbridge located in Nantou County, Taiwan. Two different output-only identification methods are used to analyze the set of ambient vibration data:the stochastic subspace identification method (SSI) and the frequency domain decomposition method (FDD). A total of 10 modal frequencies andtheir associated mode shapes are identified from the dynamic interaction between the bridge’s cables and deck vibrations within the frequencyrange of 0–7 Hz. The majority of the modal frequencies observed from recording cable vibrations are also found to be associated with the deckvibrations, implying considerable interaction between the deck and cables.c© 2007 Elsevier Ltd. All rights reserved.
Keywords: Frequency domain decomposition; Stochastic subspace identification; Wireless structural monitoring; Cable-stayed bridge
1. Introduction
A major engineering challenge associated with cable-supported bridges is complete characterization of the dynamicresponse of the bridge when loaded by traffic, wind and earth-quakes. Accurate analysis of both the aerodynamic stability andthe earthquake response of cable-stayed bridges often requiresknowledge of the structure’s dynamic characteristics, includ-ing modal frequencies, mode shapes and modal damping ratios.Conducting full-scale dynamic testing is regarded as one of themost reliable experimental methods available for assessing ac-tual dynamic properties of these complex bridge structures [1].Such tests serve to complement and enhance the developmentof analytical techniques and models that are integral to analy-sis of the structure over its operational life. During the past two
∗ Corresponding author. Tel.: +886 2 2363 1799; fax: +886 2 2362 5044.E-mail address: [email protected] (C.-H. Loh).
0141-0296/$ - see front matter c© 2007 Elsevier Ltd. All rights reserved.doi:10.1016/j.engstruct.2007.12.002
decades, many researchers have conducted full-scale dynamictests on suspension bridges including forced-vibration testing;however, there is comparatively less information available onfull-scale dynamic testing of cable-stayed bridges. Typical ex-amples of full-scale dynamic tests on bridges are provided inthe References [1–4].
A simpler method for the determination of the dynamiccharacteristics of structures is through the use of ambientvibration measurements. In output-only characterization, theambient response of a structure is recorded during ambientinfluence (i.e. without artificial excitation) by means ofhighly-sensitive velocity or acceleration sensing transducers.The concurrent development of novel sensing technologies(e.g., MEMS sensors, wireless sensors) and high-speedcomputing and communication technologies currently allowthe engineering community to measure and evaluate ambientstructural vibrations quickly and accurately. For example,wireless sensors represent an integration of novel sensing

J.-H. Weng et al. / Engineering Structures 30 (2008) 1820–1830 1821
Fig. 1a. Front view and top view of the Gi-Lu cable-stayed bridge. Locations of velocity meter-wireless sensor pairs installed (in vertical and transverse directions,for Test 1 and Test 2, respectively) along the bridge deck for the ambient vibration survey.
Fig. 1b. Installation location of the wireless sensors during Test 3; velocity meters are installed to record the ambient response of the deck and cables simultaneously.
Fig. 2. Overview of the hardware design of a wireless sensor prototype for structural monitoring applications [10].
transducers with computational and wireless communicationelements. Officials responsible for ensuring the long-termperformance and safety of bridges depend upon empiricallyderived vibration characteristics to update analytical bridgemodels so that the chronological change of bridge load-bearing
capacity can be tracked. As such, bridge officials direly need aneconomical means of rapidly deploying sensors on a bridge tocollect ambient response data from which modal informationcan be extracted; wireless sensors represent a transformativetechnology that uniquely meets these needs.

1822 J.-H. Weng et al. / Engineering Structures 30 (2008) 1820–1830
Fig. 3. State diagram detailing time-synchronized communication betweenwireless sensing units and the data server.
The use of wireless communications in lieu of wires within astructural monitoring system was initially proposed by Straserand Kiremidjian [5] as a means of reducing installation costsin large-scale civil structures. In addition, their work illustratedthe freedom a wireless system infrastructure provides includingrapid and reconfigurable installations. Recently, Lynch et al. hasextended their work to include computational microcontrollersin the hardware design of wireless sensors so that varioussystem identification and damage detection algorithms can beembedded for local execution by the sensor [6–8]. To date, ahandful of bridges and buildings have been instrumented withwireless monitoring systems including the Alamosa CanyonBridge (New Mexico), Geumdang Bridge (Korea), WuYuanBridge (China), Voigt Bridge (California) and a historic theaterin Detroit, Michigan [9]. These extensive field studies attest tothe accuracy and reliability of wireless sensors in traditionalstructural monitoring applications.
The purpose of this study is to employ a rapid-to-deploywireless structural monitoring system prototyped by Wang,et al. [10] for monitoring long-span bridges during ambientexcitation conditions. Towards this end, this study will focuson the experimental determination of the dynamic propertiesof the newly retrofitted Gi-Lu cable-stayed bridge (NantouCounty, Taiwan) using ambient vibration responses recordedby a wireless structural monitoring system. The wirelessmonitoring system consists of a distributed network of wirelesssensors in direct communication with a high-performancedata repository where data is stored and analyzed. To extractthe bridge modal characteristics, both the frequency domaindecomposition (FDD) and stochastic subspace identification(SSI) methods were embedded in the central repository toautonomously identify the dynamic properties of the bridge.The paper concludes with a discussion on the results obtainedusing the wireless monitoring system, including observation ofthe interaction between cable and deck vibrations.
2. Ambient vibration measurements
The cable-stayed bridge selected for this study is the Gi-Lu Bridge, located in Nantou County, Taiwan. This bridge
is a modern pre-stressed concrete cable-stayed bridge whichcrosses the Juosheui River. The bridge has a single pylon (witha 58 m height above the deck) and two rows of harped cables(68 cables in total) on each side. The bridge deck consists of abox girder section 2.75 m deep and 24 m wide and is rigidlyconnected to the pylon; the deck spans 120 m on each side ofthe pylon. On September 21, 1999, during the final constructionstages of the Gi-Lu Bridge, a significant earthquake (Chi-ChiEarthquake) with ML = 7.3 struck the central part of Taiwan.Only three kilometers away from the epicenter, Gi-Lu Bridgewas subjected to very strong ground motions resulting in thedamage of several of the bridge’s critical structural elements.Reconstruction work undertaken to repair the bridge damagewas completed at the end of 2004. At that time, the bridgeowner elected to develop an experimentally-calibrated finiteelement model of the bridge so that bridge safety could beverified over the bridge operational lifespan. To accuratelycalibrate the model, an ambient vibration survey was conductedto extract the modal characteristics of the bridge. Subsequentmodel updating was done to minimize the difference betweenthe modal characteristics (e.g. modal frequencies and modeshapes) of the model and those experimentally found.
Instrumentation and data acquisition: To ensure a quick andlow-cost means of collecting the dynamic response of theGi-Lu bridge under ambient excitation conditions, a low-cost wireless monitoring system is used. The instrumentationinstalled in the bridge consisted of the following components:(1) Wireless sensors: twelve wireless sensors each containinga four-channel sensor interface with high-resolution analog-to-digital conversion are used; (2) Transducers: interfacedto each wireless sensor node is a highly-sensitive TokyoSokushin VSE-15 velocity meter whose sensitivity constantis 0.25 V/kine (where 1 kine is equal to 1 cm/s); (3) Datarepository computer: one high-performance laptop computerwith a wireless modem serves as the core of the systemresponsible for triggering the system, archiving recordedresponse data, and autonomously extracting the bridge modalcharacteristics.
Due to the limited number of sensing nodes available(only 12 wireless sensor-velocity meter pairs), the wirelessmonitoring system is reconfigured during testing to achievethree different test configurations: (1) Test 1: Ten wirelesssensor-velocity meter pairs are installed along the bridge deckto record its vertical vibration at locations denoted as V01through V10 as shown in Fig. 1a; (2) Test 2: The ten wirelesssensor-velocity meter pairs used during Test 1 are reoriented torecord the deck’s transverse vibration (denoted as H01 throughH10 in Fig. 1a); (3) Test 3: All twelve wireless sensors areinstalled on one side of the bridge to simultaneously recordthe cables and deck vibrations at sensor location T01 throughT12 (Fig. 1b). Data was sampled at 100 points per secondon each channel to provide good waveform definition. Theanalog voltage output of the velocity meter was convertedto a digital signal with 16-bit resolution by each wirelesssensor. The synchronized time-histories collected by thewireless monitoring system were wirelessly broadcasted to the

J.-H. Weng et al. / Engineering Structures 30 (2008) 1820–1830 1823
Fig. 4. Flow chart of stochastic subspace identification (SSI) technique.
high-performance laptop computer serving as the monitoringsystem’s sole data repository.
Wireless sensors for structural monitoring: A core elementof this study was to assess the capabilities of a low-costwireless structural monitoring system to rapidly collect thedynamic responses of a large-scale civil infrastructure system.A network of wireless sensing units, developed by Wanget al. [10] were installed upon the Gi-Lu Bridge in lieu ofa traditional tethered structural monitoring system which areknown to suffer from high-costs and laborious installations. Thedesign of the wireless sensing unit is optimized for structuralmonitoring applications and includes three major subsystems:the sensing interface, the computational core, and the wirelesscommunication system. The sensing interface is responsiblefor converting analog sensor outputs spanning from 0 to 5 Von four independent channels into 16-bit digital formats. Anysensing transducer can be interfaced to the wireless sensing unit
with accelerometers, strain gages, displacement transducers andvelocity meters all previously interfaced. The digital data is thentransferred to the computational core by a high-speed serialperipheral interface (SPI) port. Abundant external memory(128 kB) is associated with the computational core for localdata storage (up to 64,000 sensor data points can be storedat one time) and analysis. For reliable communication on thewireless channel, the Maxstream XStream wireless modemoperating on the 2.4 GHz wireless band is selected. The outdoorcommunication range of the modem is up to 300 m line-of-sight which is sufficient for most large-scale civil structures.To enhance the range and reliability of communication inthis study, directional antennas (D-link) were attached to eachsensing unit to concentrate the energy associated with thewireless transmission in a concentrated beam pointed towardsthe central data repository. In summary, the hardware profile
1824 J.-H. Weng et al. / Engineering Structures 30 (2008) 1820–1830
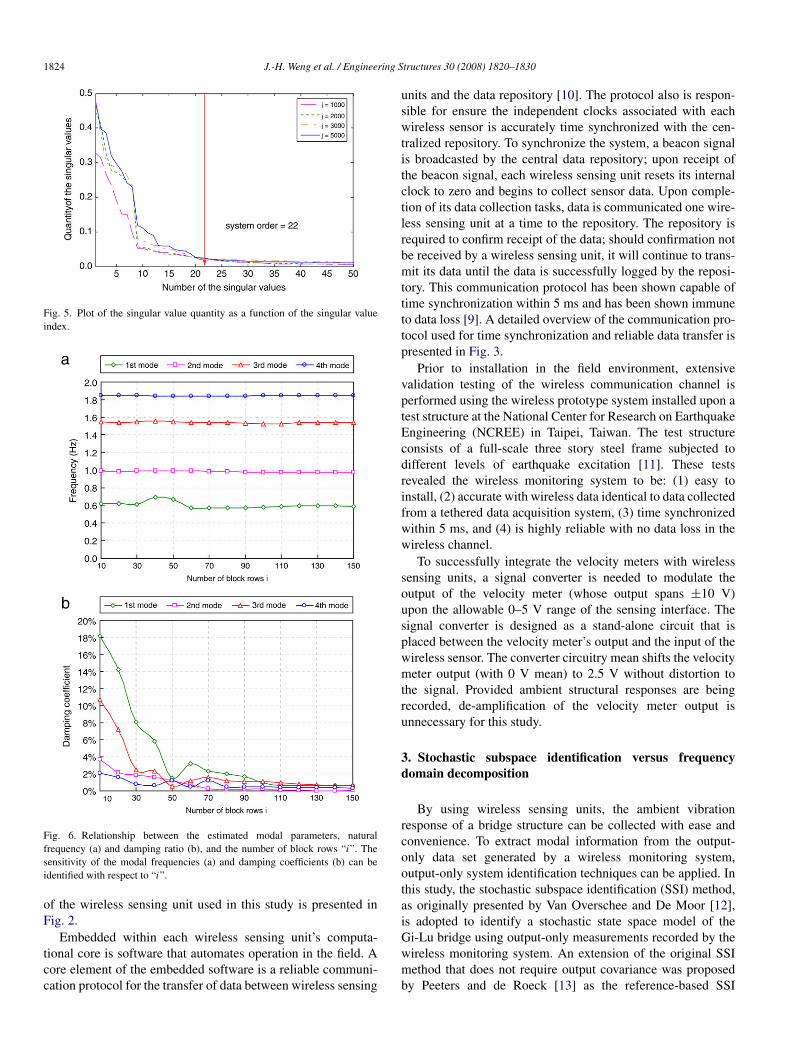
Fig. 5. Plot of the singular value quantity as a function of the singular valueindex.
Fig. 6. Relationship between the estimated modal parameters, naturalfrequency (a) and damping ratio (b), and the number of block rows “i”. Thesensitivity of the modal frequencies (a) and damping coefficients (b) can beidentified with respect to “i”.
of the wireless sensing unit used in this study is presented inFig. 2.
Embedded within each wireless sensing unit’s computa-tional core is software that automates operation in the field. Acore element of the embedded software is a reliable communi-cation protocol for the transfer of data between wireless sensing
units and the data repository [10]. The protocol also is respon-sible for ensure the independent clocks associated with eachwireless sensor is accurately time synchronized with the cen-tralized repository. To synchronize the system, a beacon signalis broadcasted by the central data repository; upon receipt ofthe beacon signal, each wireless sensing unit resets its internalclock to zero and begins to collect sensor data. Upon comple-tion of its data collection tasks, data is communicated one wire-less sensing unit at a time to the repository. The repository isrequired to confirm receipt of the data; should confirmation notbe received by a wireless sensing unit, it will continue to trans-mit its data until the data is successfully logged by the reposi-tory. This communication protocol has been shown capable oftime synchronization within 5 ms and has been shown immuneto data loss [9]. A detailed overview of the communication pro-tocol used for time synchronization and reliable data transfer ispresented in Fig. 3.
Prior to installation in the field environment, extensivevalidation testing of the wireless communication channel isperformed using the wireless prototype system installed upon atest structure at the National Center for Research on EarthquakeEngineering (NCREE) in Taipei, Taiwan. The test structureconsists of a full-scale three story steel frame subjected todifferent levels of earthquake excitation [11]. These testsrevealed the wireless monitoring system to be: (1) easy toinstall, (2) accurate with wireless data identical to data collectedfrom a tethered data acquisition system, (3) time synchronizedwithin 5 ms, and (4) is highly reliable with no data loss in thewireless channel.
To successfully integrate the velocity meters with wirelesssensing units, a signal converter is needed to modulate theoutput of the velocity meter (whose output spans ±10 V)upon the allowable 0–5 V range of the sensing interface. Thesignal converter is designed as a stand-alone circuit that isplaced between the velocity meter’s output and the input of thewireless sensor. The converter circuitry mean shifts the velocitymeter output (with 0 V mean) to 2.5 V without distortion tothe signal. Provided ambient structural responses are beingrecorded, de-amplification of the velocity meter output isunnecessary for this study.
3. Stochastic subspace identification versus frequencydomain decomposition
By using wireless sensing units, the ambient vibrationresponse of a bridge structure can be collected with ease andconvenience. To extract modal information from the output-only data set generated by a wireless monitoring system,output-only system identification techniques can be applied. Inthis study, the stochastic subspace identification (SSI) method,as originally presented by Van Overschee and De Moor [12],is adopted to identify a stochastic state space model of theGi-Lu bridge using output-only measurements recorded by thewireless monitoring system. An extension of the original SSImethod that does not require output covariance was proposedby Peeters and de Roeck [13] as the reference-based SSI

J.-H. Weng et al. / Engineering Structures 30 (2008) 1820–1830 1825
F
ig. 7. Recorded ambient vibration signals (velocity) at sensor location T03, T08, T10 and T12 (Fig. 1b) (during Test-3).method. Interested readers are referenced to [14]; a briefsummary of the method is presented herein:
Stochastic subspace identification: Consider a discrete-timestochastic state-space model:
x sk+1 = Ax s
k + wk
ysk = Cx s
k + vk(1)
where the superscript “s” denoting “stochastic” since thesystem is assumed to be excited by a stochastic component(i.e. broad-band noise). The SSI method is used to identifythe system matrices, A and C , from the system outputmeasurements, ys
k (i.e. ambient vibration measurements). Fig. 4presents the detail procedure for identification of the systemmatrix, A, by the SSI method:
1. Using output measurement data, the Hankel matrix, Y s , canbe constructed:
Y s≡
ys0 ys
1 · · · ysj−1
ys1 ys
2 · · · ysj
· · · · · · · · · · · ·
ysi−1 ys
i · · · ysi+ j−2
ysi ys
i+1 · · · ysi+ j−1
ysi+1 ys
i+2 · · · ysi+ j
· · · · · · · · · · · ·
ys2i−1 ys
2i · · · ys2i+ j−2
≡
[Y s
p
Y sf
]∈ R2li× j (2)
where i is a user-defined index and must be larger than theorder, n, of the system. Since there are only l degrees-of-freedom measured, (in this study, l = 10 or 12 depending uponwhether 10 or 12 measurement locations are used in the threetest setups), the output vector ys
k must contain l rows and thematrix Y s must contain 2li rows. Here, j corresponds to thenumber of columns of the Hankel matrix. To ensure all of ther time samples of the output vector ys
k populate the Hankelmatrix, the number j can be equal to r − 2i + 1. Accordingto the expression of Eq. (2), the Hankel matrix is divided intothe past, Y s
p ∈ Rli× j , and the future, Y sf ∈ Rli× j , parts. For
the reference-based stochastic subspace identification method,the Hankel matrix plays a critically important role in the SSIalgorithm.
2. Row space projections:The orthogonal projection of the row space of the matrix
Y sf ∈ Rli× j on the row space of the matrix Y s
p ∈ Rli× j isdefined as Y s
f /Y sp which can be calculated by the following
formula:
Y sf /Y s
p ≡ Y sf Y sT
p (Y spY sT
p )ĎY sp = Os
i ∈ Rli× j (3)
where “/” denotes the projection operator, T denotes thetranspose operator and Ď denotes the pseudo-inverse operator.The projection operator can also be computed quickly byusing QR-decomposition [13]. QR-decomposition of the block

1826 J.-H. Weng et al. / Engineering Structures 30 (2008) 1820–1830
Hankel matrix (H = RQT ) results in a reduction ofthe computational complexity and memory requirements ofthe SSI implementation by projecting the row space offuture outputs into the row space of the past referenceoutputs. Orthogonal projection relates the Hankel matrix to theobservability matrix; hence, the observability matrix can beestimated by factoring the orthogonal projection of the Hankelmatrix.
3. Singular value decomposition (SVD) of the orthogonalprojection:
In linear algebra, SVD is an important factorization toolused for rectangular real or complex matrices. SVD is used todecompose the orthogonal projection of the Hankel matrix:
Osi = U SV T
=(U1 U2
) (S1 00 S2
) (V T
1V T
2
)≈ U1S1V T
1 . (4)
The matrix U ∈ Rli×li contains a set of orthonormal“output” basis vector directions for Os
i while V ∈ R j× j
contains a set of orthonormal “input” basis vector directionsfor Os
i . The matrix S ∈ Rli× j contains singular values of thedecomposition along its diagonal; here, S is block separatedinto two parts S1 and S2. The smallest singular values in thematrix S are grouped as S2 ∈ R(li−n)×( j−n) and are neglected.In contrast, the largest set of singular values, S1, dominate thesystem and provide a means of assessing the system order.The order, n, is the number of dominant singular values whereS1 ∈ Rnxn . Thus a reduced version of the SVD is describedby the matrices U1 ∈ Rli×n , S1 ∈ Rn×n and V1 ∈ R j×n . Areduced SVD helps to catch the principle components of thesystem and reduce noise effects.
4. Calculate the extended observability matrix, Γi :
Γi = U1S1/21 . (5)
Since the dimension of Γi in Eq. (5) is li × n, it canbe extracted from the reduced order SVD of the orthogonalprojection as described above. The extended observabilitymatrix Γi is defined as:
Γi ≡
C
C AC A2
· · ·
C Ai−1
∈ Rli×n (6)
which contains information on the system matrix, A.
5. Calculate the system parameter matrices A and C from Γi :
A = Γ Ďi Γi (7)
where Γ i ∈ Rl(i−1)×n denotes Γi without the last l rows andΓi ∈ Rl(i−1)×n denotes Γi without the first l rows. The matrixC can be determined from the first l rows of Γi as shown in Eq.(6).
6. Calculate the eigenvalues, λN , and eigenvectors, φλN ∈
Rn×1, of A:
det(A − λN I ) = 0, (A − λN I ) φλN = 0. (8)
Table 1Identified natural frequencies from Test-1 and Test-3 using SSI method
Test-1a
Freq.(Hz)
Test-3a
Freq.(Hz)
R-13Cableb
Dominantfreq. (Hz)
R-27Cableb
Dominantfreq. (Hz)
Note
0.595 0.600 0.600 0.578 1st vertical model freq.0.985 0.975 0.980 0.980 2nd vertical model freq.
1.019 – 1.020 R-27 Cable 1st vibrationfreq.
1.462 – Torsion model freq.1.544 1.539 1.540 1.540 3rd vertical model freq.
1.809 1.806 R-13 cable 1st vibrationfreq.
1.853 1.871 1.860 1.860 4th vertical model freq.2.093 2.029 – 2.027 5th vertical model freq.
R-27 cable 2nd modelfreq.
3.158 – 3.607 3.033 –4.785 – 5.413 4.053 –4.850 – 7.227 5.080 –6.639
The dominant frequencies of cables R-13 and R-27 are also shown.a Identified using stochastic subspace identification method.b Identified directly from the Fourier analysis of measurements.
It should be noted that the eigenvalues of A occur in complexconjugated pairs and the subscript “N” denotes the number ofthese pairs.
7. Determine the frequency ωN and damping coeffi-cient ξN from λN :
ωN =aN
2π∆t(rad/s), ξN =
|bN |√a2
N + b2N
(9)
where
aN =
∣∣∣∣arctan(
Im (λN )
Re (λN )
)∣∣∣∣ , bN = ln(λN ). (10)
8. Determine mode shape ΦN (with corresponding fre-quency ωN ) from C and φλN :
ΦN = CφN . (11)
The elements in the vector, ΦN , are always complexnumbers in practice. It can be imagined that the absolute valueof the complex number is interpreted as the amplitude and theargument as the phase of a sine wave at a given frequency, ωN .
In the SSI method, first, the output data collected from theambient vibration survey is arranged to form the Hankel matrix.Second, the projection theorem is introduced to establish therelation between the extended observability matrix and thematrix corresponding to the orthogonal projection. Finally, theSVD algorithm is used to determine the system matrix, A, fromwhich the dynamic characteristics (ΦN , ωN , ξN ) of the systemcan be identified.
Frequency domain decomposition (FDD) method: A secondmodal estimation method is adopted in this study termed thefrequency domain decomposition (FDD) method [15]. In thisidentification method, the first step is to estimate the power

J.-H. Weng et al. / Engineering Structures 30 (2008) 1820–1830 1827
Fig. 8a. Comparison of the identified bridge deck vertical mode shapes by using the reference-based stochastic subspace identification and frequency domaindecomposition methods.
spectral density (PSD) matrix from the measurements and thendecomposed at ω = ωi by taking the SVD of the matrix:
G yy( jωi ) = Ui SiUTi (12)
where the matrix Ui = [ui1, ui2, . . . , uim] is a matrix holdingthe singular vectors ui j , and Si is a diagonal matrix holdingthe scalar singular values si j . If only the kth mode is presentat the selected frequency, ωi , then there will be only onesingular value in Eq. (12). Thus, the first singular vector ui1
would then serve as an estimate of the kth mode shape, φ =
ui1. To implement the FDD method, some prior knowledgeof the modal frequencies is required; traditional peak-pickingmethods can be adopted using the frequency response functionof the system calculated for each system output. An advantageof the FDD method is that if two modes are closely spaced andcan be identified previously (e.g. using the aforementioned SSImethod), they can be identified based upon multiple singularvalues presented at a selected frequency.
4. Analysis of bridge ambient vibration data: Dynamicproperties of the deck and cables
Using the reference-based stochastic subspace identificationmethod described above, the dynamic characteristics of theGi-Lu cable-stayed bridge are accurately identified from thewireless sensor data collected during field study. Resultsobtained from the wireless monitoring system and applicationof the SSI method are highlighted below:
1. Data analysis using all output measurements from the decksimultaneously:
Integral to implementation of the SSI method are twoparameters that need to be determined a priori. The first isthe number of block rows, i , and the second is the appropriateorder, n, of the system. Both parameters directly influence thestructure of the stochastic output Hankel matrix Y s as it isconstructed from the output data sequences according to i ; areduced version of the Hankel matrix obtained by SVD is alsodetermined according to the order, n. The influence of bothparameters on the corresponding system identification results

1828 J.-H. Weng et al. / Engineering Structures 30 (2008) 1820–1830
Fig. 8b. Comparison of the identified bridge deck mode shapes in the transversedirection by using the reference-based stochastic subspace identification andfrequency domain decomposition methods.
can be explained by the number of block rows, i , affecting theprecision of the SSI method while n corresponds to the numberof structural modes contained by the SSI model. In this study,we start with determining n by giving a fixed value of i while jis varied. In other words, the number of data points, r (equal to2i + j − 1), contained in the output vector, ys
k , varies in tandemwith the value of j selected.
For illustration, a simple case is used to demonstrate how thesystem order is determined. Consider the case where only thevertical response of the bridge deck is measured from the 10wireless sensing units. Fig. 5 plots the quantity of each singularvalue resulting from the decomposition of the projection of thepast on the future outputs of the Hankel matrix as a functionof the number of block columns j . It is clear that the singularvalues rapidly diminish with the singular values stabilizing toa small value at the 22th singular value (s22 = 0.0235). As aresult of this qualitative observation, the order of the systemis determined as n = 22. With the system order determined,the analysis returns to determine the number of block rowsi using a fixed number of sampled data points, r = 5000.To assess if a suitable number of block rows is selected, thesensitivity of the modal frequencies and damping coefficientsare compared as a function of i . Fig. 6 plots the identified modalfrequency and damping coefficient of the first four modes as afunction of i . The variability of the modal frequencies lookssmall but the modal damping coefficients are uncertain andillegitimate when a small number i is used. This figure alsoproves the hypothesis that i is closely related to the precision ofSSI method. Considering the modal frequencies and dampingcoefficients determined for the vertical response of the bridgedeck, the number of block rows is selected as 110 for this case(r = 5000). Furthermore, it should be noticed that the systemorder n is directly linked to the number of modes contained
Table 2Comparison between the identified deck vibration natural frequencies andnumerical model frequencies from simulation
Analytical mode 1stmode
31thmode
64thmode
102thmode
115thmode
Model frequency (Hz) 0.5148 1.0505 1.4457 1.8940 2.0378Identified mode (fromAmbient Data)
1stmode
2ndmode
3rdmode
4stmode
5thmode
Model frequency (Hz) 0.595 0.985 1.544 1.853 2.093
in the SSI model. In general, the number of true structuralmodes identified will not exceed half the number of modescontained in the SSI model. As a result, it is important to notethat selection of an unwarranted large system order withoutexamination on regulation will increase the number of modesbut result in many unreliable “noise” modes.
Fig. 7 shows typical velocity time histories recorded onthe Gi-Lu bridge deck and cables during ambient excitation(recorded during Test 3). Using time history data collectedduring Test 1 and 3, the modal frequencies of the bridgedetermined by the high-performance data repository executingthe reference-based SSI method are tabulated in Table 1. Inaddition, the first ten bridge deck mode shapes determined bythe SSI method during Test 1 are shown in Fig. 8a. Using theFDD method (using the specific frequency identified from theSSI method), a second set of identified mode shapes of thebridge are determined and plotted on the same figure (Fig. 8a)for comparison. The estimated mode shapes of the bridge deckusing both methods are consistent. Using the time history datacollected during Test 2, the identified mode shapes of the bridgedeck in the transverse direction are also shown in Fig. 8b.Again, excellent agreement between SSI- and FDD-derivedmode shapes is evident.
2. Data analysis from the interaction between deck and cablevibration:
The SSI method is also applied to the data collected duringthe Test 3 setup. The identified dominant frequencies fromthis data set are tabulated in Table 1. After data has beencollected, Fourier analysis is applied on the same data set off-line. Fig. 9(a) and Fig. 9(b) plot the Fourier amplitude spectraof both the horizontal and vertical ambient vibration of the twoinstrumented bridge cables (R13 is a short cable and R27 isa long cable). From the Fourier amplitude spectrum of cablevibration data, there are several dominant frequencies in thelower frequency range which belong to the deck vibrationmodes and not the cable itself. This can be better observed fromFig. 8(c) where the Fourier amplitude spectrum of the cablevibration data and the deck vibration data are plotted on thesame graph. By comparing the identified dominant frequenciesusing the SSI and off-line Fourier methods, one can clearlyobserve that the close interaction between the deck and cablevibrations, particularly in the lower frequency range (0–2 Hz).
3. Model updating of a finite element model of the Gi-LuBridge:
Motivation of the use of a wireless monitoring system isits ability to be rapidly deployed by bridge owners for low-cost yet accurate assessment of bridge modal properties. Such

J.-H. Weng et al. / Engineering Structures 30 (2008) 1820–1830 1829
Fig. 9. The Fourier amplitude spectrum of cable vertical and horizontal vibration data (Fig. 9(a) for cable R-27 and Fig. 9(b) for cable R-13). The number in the boxis the identified dominant frequency of cable. Comparison on the Fourier amplitude spectrum of cable vibration and deck vertical vibration is shown in Fig. 9(c).
properties are integral to updating finite element models usedby engineers to assess the condition of the structure overits operational life. Toward this end, an analytical model ofthe Gi-Lu Bridge had been developed using a MATLAB-based computer program [16]. The code includes the use oftraditional beam elements for the bridge structure and nonlinearbeam elements to represent cables with sag and pre-tensionforces. After updating the analytical model, the first calculatedfundamental frequency of the bridge model is 0.5148 Hz whichcorresponds to the deck’s first vertical vibration mode. Table 2shows the comparison between the identified deck vibrationfrequencies using ambient vibration data collected during fieldstudy and the numerical results of the updated model. Excellent
results are obtained with good agreement evident between thenumerical model and the test data.
5. Conclusions
The purpose of this paper is to conduct an ambientvibration survey of a long-span cable-stayed bridge and todevelop a systematic method for the extraction of the dynamiccharacteristics of the bridge using data collected by a novelwireless monitoring system. The following conclusions aredrawn from the full-scale measurements made on the Gi-LuBridge:
1. The wireless sensing units were used in lieu of morecostly tethered data acquisition systems. Less effort and

1830 J.-H. Weng et al. / Engineering Structures 30 (2008) 1820–1830
man-power were required during the installation of thewireless monitoring system rendering it as ideally suitedfor rapid short-term field studies. Because the wirelesscommunication range in the open field can reach up to 300m, it was possible to successfully collect data from at least 10sensors (in this study) simultaneously with a sampling rateof 100 Hz. During data collection, the wireless monitoringsystem experienced no data loss as a result of a highly-robustcommunication protocol.
2. The measurement of structural response to ambient levelsof wind and traffic has proved to be an effective meansof identifying the dynamic properties of a full-scalecable-stayed bridge. The dynamic properties that havebeen identified from these measured responses are modalfrequencies, mode shapes and estimates of modal dampingratios.
3. To autonomously extract the dynamic characteristics ofthe bridge from structural response time histories, twodifferent approaches were used: the SSI method and theFDD method. Detail description on the time domaindynamic characteristic identification using multiple outputidentification (SSI method) can extract the mode shapedirectly. The SSI method can provide a good estimation ofthe number of modes observed in the structure based onsingular values of the Hankel matrix projection. On the otherhand, the FDD method can only be applied in the frequencydomain if the dominant frequencies are determineda priori.
4. The results of this test have provided conclusive evidence ofthe complex dynamic behavior of the bridge. The dynamicresponse of the cable-stayed bridge is characterized bythe presence of many closely spaced, coupled modes. Theanalytical results of this cable-stayed bridge had beenstudied before [16]. For most modes, the analytical and theexperimental modal frequencies and mode shapes comparequite well. Based on the analysis of ambient vibrationdata, it is evident that the vertical vibration of the bridgedeck is tightly coupled with the cable vibrations within thefrequency range of 0–3 Hz.
5. In order to identify the coupling effect between the bridgedeck and cables, different instrumentation architecturesare adopted (specifically, Test 1, Test 2 and Test 3 inthis study). The stochastic subspace identification methodprovides a very effective way to identify the modeshapes of the structure through the spatially distributedsensors. It can compress the data while preserving vibrationinformation and also eliminate uncorrelated noise. Througha comparison of the results corresponding to different testsetups, separation of dominant frequencies between thebridge deck and cable can be easily identified. As for thedamping ratio estimation, the first vibration mode of thedeck had a damping ratio of 2.5% on average (dependsupon the different sensor locations); the damping values forhigher modes are less than 1.0%. More detailed study on
the estimation of accurate damping ratios is needed in futureresearch.
Acknowledgements
The authors wish to express their thanks to Central WeatherBureau (MOTC-CWB-94-E-13) as well as National ScienceCouncil (NSC95-2221-E-002-311) for the support of thisresearch. The authors wish to thank Mr. Chia-Ming Changfor his assistance to provide the analytical result of the bridgewhich is referenced in companion papers.
References
[1] Ko JM, Sun ZG, Ni YQ. Multi-stage identification scheme for detectingdamage in cable-stayed Kap Shui Mun Bridge. Engineering Structures2002;24(7):857–68.
[2] Ozkan E, Main J, Jones NP. Long-term measurements on a cable-stayedbridge. IMAC-paper 2001.
[3] He X, Moaveni B, Conte JP, Elgamal A, Masri SF, Caffrey JP. et al.System identification of New Carquinez Bridge using ambient vibrationdata. In: Proc. of int. conf. on experimental vibration analysis for civilengineering structures. 2005. p. 26–28.
[4] Wenzel H, Pichler D. Ambient vibration monitoring. John Wiley & Sons,Ltd; 2005.
[5] Straser EG, Kiremidjian AS. A modular, wireless damage monitoringsystem for structure. Report no.128, Stanford (CA): John A. BlumeEarthquake Center, CE Department, Stanford University; 1998.
[6] Lynch JP, Sundararajan A, Law KH, Kiremidjian AS, Carryer E.Embedding damage detection algorithms in a wireless sensing unit foroperational power efficiency. Smart Materials and Structures 2004;13(4):800–10.
[7] Lynch JP, Sundararajan A, Law KH, Kiremidjian AS, Kenny TW,Carryer E. Embedment of structural monitoring algorithms in a wirelesssensing unit. Structural Engineering and Mechanics 2003;15(3):285–97.
[8] Lynch JP. An overview of wireless structural health monitoring for civilstructures. Philosophical Transactions of the Royal Society of London.Series A, Mathematical and Physical Sciences 2007;365(1851):345–72.
[9] Lynch JP, Wang Y, Loh K, Yi JH, Yun CB. Performance monitoring ofthe Geumdang bridge using a dense network of high-resolution wirelesssensors. Smart Materials and Structures 2006;15(6):1561–75.
[10] Wang Y, Lynch JP, Law KH. A wireless structural health monitoringsystem with multithreaded sensing devices: Design and validation.Structure and Infrastructure Engineering 2007;3(2):103–20.
[11] Lynch JP, Wang Y, Lu KC, Hou TC, Loh CH. Post-seismic damageassessment of steel structures instrumented with self-interrogatingwireless sensors. In: Proc. of 8-th US national conf. on earthquakeengineering, paper no. 1390. 2006.
[12] Van Overschee P, De Moor B. Subspace algorithm for the stochasticidentification problem. Automatica 1993;29(3):649–60.
[13] Peeters B, De Roeck G. Reference-based stochastic subspace identifica-tion for output-only modal analysis. Mechanical Systems and Signal Pro-cessing 1999;13(6):855–78.
[14] Van Overschee P, De Moor B. Subspace identification for linear system:theory-implementation-applications. Dordrecht (Netherlands): KluwerAcademic Publishers; 1996.
[15] Brincker R, Zhang L, Anderson P. Modal identification of output-onlysystems using frequency domain decomposition. Smart Materials andStructures 2001;10(3):441–5.
[16] Loh CH, Chang CM. MATLAB-based seismic response control ofa cable-stayed bridge: Cable vibration. Structural Control and HealthMonitoring 2007;14(1):109–43.