outlook for china’s onshore market...5 4-1. outlook for the chinese yuan exchange market forecast...
TRANSCRIPT

Outlook for China’s Onshore MarketApril, 2019
Treasury Department
Mizuho Bank (China), Ltd.
Copyright (c) Mizuho Bank, Ltd. All Rights Reserved.

1
1-1. National People's Congress: Target growth rate for 2019 set at 6‒6.5%
Source: Compiled based on Bloomberg data and various media reports
On March 5, the second session of the 13th National People's Congress opened in Beijing. At the beginning of the session, Chinese Premier Li Keqiang announced inthe government work report that the target economic growth rate for 2019 had been set at "6‒6.5%" with downward revision from the previous year's goal, which was“around 6.5%.” The target rate was revised downward for the first time in two years due to the fact that the annual GDP for 2018 recorded the lowest growth rate in 28years, at 6.6%, while the sense of uncertainty persists in domestic and foreign political conditions. The lower end of the growth rate fluctuation band was set at thelowest rate in 30 years.Even though the growth rate outlook was revised downward in the government work report released this time, the focus of the session was the reinforcement ofeconomic stimulus measures for the purpose of doubling the total GDP by 2020 from that of 10 years ago.Including the growth rate estimate of the International Monetary Fund (IMF), the majority of such estimates for China in 2019 sat at 6.2%. Under such a condition, thequestion is: would China be able to achieve the goal of doubling the GDP (maintaining an annual growth rate of 6.1%)? Market participants remain attentive of thepolicy measures to be taken by the Chinese monetary authorities in this difficult situation, with concerns over the outcome of the trade negotiations between the U.S.and China, as well as the deterioration of domestic business confidence.
Government target for 2019 Growth rate required to achieve the goal of doubling the GDP
46,953
93,906
0.0
2.0
4.0
6.0
8.0
10.0
12.0
0
10,000
20,000
30,000
40,000
50,000
60,000
70,000
80,000
90,000
100,000
10 11 12 13 14 15 16 17 18 19 20
実質GDP(左目盛) 実質GDP成長率
(Year)
(CNY billion) (Y-o-y, %)Growth rate required to double the GDP of 2010 in 2020Average 2019–2020: +6.1%
Real GDP growth rate Real GDP (left axis)2019 2018
Target Result Target
GDP 6-6.5% 6.60% Approx. 6.5%
CPI 3.00% 2.10% 3.00%
M2 na 8.10% na
Fiscal deficit as percentage of GDP 2.80% 2.60% 2.60%
Tax cuts and other decrease in revenues 2.0 trillion yuan 1.1 trillion yuan 1.3 trillion yuan
Number of new employees in urban areas 11 million 13.6 million 11 million
Unemployment ratio in urban areas Around 5.5% 4.90% Below 5.5%
Net increase in local governments' special bonds 2.15 trillion yuan 1.41 trillion yuan 1.35 trillion yuan
Fiscal expenditures 23 trillion yuan(Yoy +6.5%) 22.1 trillion yuan 21 trillion yuan
Infrastructure investment expenditures (in the budget of the central government)
577.6 billion yuan na 53.76 billion yuan

2.375 2.625 2.625 2.7501.5
2.5
3.5
4.5
2018 2019 2020 2021 2022
(%)
Median
2Source: Compiled based on Bloomberg data and various media reports
1-2. US monetary policy: FOMC lowered policy interest rate outlook without any interest rate hike expected for 2019
Interest rate outlook by the FOMC monetary policy committee (as of March)
Probability of an interest rate hike at the FOMC meeting in 2019U.S. dollar index and the U.S. interest rate
Key points of the FOMC statement for the March 19 and 20 meeting
Regarding the current economic conditions, “growth of economic activity has slowed from its solid rate in the fourth quarter”, stating that economic activities have slowed from their steady pace in the fourth quarter of 2018. “In light of global economic and financial developments and muted inflation pressures, the Committee will be patient as it determines what future adjustments to the target range for the federal funds rate may be appropriate to support these outcomes.”In the appendix released at the same time, the FOMC announced its decision to halve the reduction of U.S. treasury bills from May to end the reduction itself at the end of September. Thereafter, mortgage-backed securities (MBS) will be reduced, while U.S. treasury bills will be increased in order to maintain the overall holding.
長期
At the Federal Open Market Committee (FOMC) meeting held on March 19 and 20 in the U.S., the policy interest rate was maintained at 2.25‒2.50%,as had been anticipated in the market. The policy interest rate outlook was revised downward from two expected interest rate hikes in 2019 to none,showing an intention not to raise the interest rate before the end of 2019. With regard to balance sheet reduction, the FOMC announced its plan tostart slowing down the reduction from May. The reduction in U.S. treasury bills will be reduced from the maximum USD 30 billion monthly to USD 15billion, to discontinue the reduction at the end of September.With regard to the economic outlook, the growth rate for 2019 was revised downward from 2.3% to 2.1%, for 2020, from 2.0% to 1.9%. Furthermore,the inflation outlook and the expected unemployment rate were also revised downward, showing a slowdown in economic growth, in general.In response to this outcome, the U.S. dollar interest rates fell, and market participants have been selling the U.S. dollar, leading the U.S. dollar indexto fall. However, the FOMC expects one interest rate hike in 2020. Thus, if the economy slows down further in the times ahead, it is possible for theFOMC to go back on its decision on interest rate hikes, i.e., being more dovish. Market participants should thus remain cautious about thedepreciation of the U.S. interest rates and U.S. dollar-selling resulting from an even more dovish monetary policy.
± 0bp (0 time) +25bp (1 time) ±0bp (0 time)
2.30
2.50
2.70
2.90
3.10
3.30
88
90
92
94
96
98
Jan-18 Apr-18 Jul-18 Oct-18 Jan-19
(%)
ドルインデックス(左軸)米10年債利回り(右軸)
0%
20%
40%
60%
80%
100%
Sep-18 Oct-18 Nov-18 Dec-18 Jan-19 Feb-19
Probability of an interest rate hike
Probability of an interest cutProbability of
no changeUSD index (left axis)10-year U.S. government bond (right axis)
Long-term

6.2
6.3
6.4
6.5
6.6
6.7
6.8
6.9
7.0
Apr. Jul. Oct. Jan. Apr. Jul. Oct. Jan. Apr. Jul. Oct. Jan.
June 15 U.S. announced an additional customs duty worth USD 50billion against China.
2. USD/CNY exchange market (From April 2016)
Source: Bloomberg
20182017
Period: April 1, 2016 to March 31, 2019USD/CNY exchange rate: CNY 6.2662 to 6.9740
January 4 Following the sharp appreciation of the offshore Chinese yuan, the onshore Chinese yuan also appreciated against the U.S. dollar.
May 24 The downgrading of the rating of Chinese government bonds by Moody’s.May 26 The “counter-cyclical factor” was introduced in order to prevent the Chinese yuan from depreciating further.
June 24Risk-averse sentimentgrew in the market as a result of the Brexit referendum.
May 18 The expectation of the U.S. interest ratehikes was enhanced in the minute ofthe U.S. FOMC meeting.
September 8 The regulations on the foreign risk reserves have been virtually abolished.
November 9 The U.S. presidential election.November 10 The U.S. dollar/Chinese yuan exchange rate exceeded CNY 6.80 for the first time since September 2010.The Chinese yuan continued to depreciate because of the uptrend in the U.S. dollar exchange market.
2016
Capital outflow increased after the “China Shock,” leading the Chinese yuan to depreciate
Control over the depreciation
of the Chinese yuan throughtightened regulation by the
Chinese authorities
Deregulation thanks tothe robust Chinese
yuan market
Yuan depreciationdue to the trade
issues between theU.S. and China
January 9 The Chinese monetary authoritiesdiscontinued the use of their “counter-cyclical factor.”
June 24The deposit reserverequirement ratio was cut.
August 3 Re-introduction of the foreign currency risk reserve system
August 24 Re-introduction of the “counter-cyclical factor”
October 1The Chineseyuan wasincluded in theSDR currency basket.
3
December 1In the dialogue held between the U.S. and China during a summit meeting, it was agreed that the introduction of the customs duty against China in 2019 would be postponed by 90 days.
February 24The U.S. postponed the imposition of the additional customs duty against China.
With progress in the trade negotiations, the Chinese yuan is
to appreciate

5.4
5.6
5.8
6.0
6.2
6.4
6.6
6.8
7.090
95
100
105
110
115
120
125
Apr. Jul. Oct. Jan. Apr. Jul. Oct. Jan. Apr. Jul. Oct. Jan.
ドル/円(左軸)
円/人民元(右軸・反転)
USD/JPY (left axis)
JPY/CNY (right axis, inverted)
3. JPY/CNY exchange market (From April 2016)
Source: Bloomberg
January 20Inauguration of U.S.President Donald Trump
20182017
Period: April 1, 2016 to March 31, 2019JPY/CNY exchange rate: CNY 5.7080 to 6.6515
June 24Risk-averse sentiment grew in the marketas a result of the Brexit referendum.
September 21The BOJ decided to Introduce additional measures of monetary easing (yield curve control and overshooting commitment).
November 9The U.S. presidential election
December 14The interest rate was raised in the U.S.
March 15 andJune 14The interest rate was raised in the U.S.
December 13The interest rate was raised in the U.S.
March 21The interest rate was raised in the U.S.
Risk-averse sentiment in themarket grew due to the “China
Shock” as well as the outcome ofthe Brexit referendum
New government underPresident Donald Trump &
the U.S. interest ratesappreciated, leading to the
appreciation of the U.S. dollar
End of the boom afterthe establishment of the
Trump administration
Geopolitical risks grewsurrounding the
situation in North Korea
2016
Decision on thereduction on the
ECB asset purchasing
program
U.S. interest rate appreciation ⇒Depreciation of global stock
prices
Outbreak of tradeproblem
June 13The interest rate wasraised in the U.S. Thenumber of expectedpolicy interest rate hikesin the U.S. in 2018 wasrevised from three to four.
July 29Although the BOJ decided to introduce additional measures of monetary easing, the scale was smaller than the market expected.The second quarter GDP of the U.S. turned out to be weaker than the market expected.
July 31The Bank of Japan introduced forward guidance, loosening the control of the yield curve.
4
March 20Expected policy interest rate hikes in the U.S. in 2019: Cut from twice to none; decision to discontinue balance sheet reduction

5
4-1. Outlook for the Chinese yuan exchange market
Forecast by Mizuho Bank (China), Ltd.
The figures in parentheses are forecasts for the closing rate of each quarter.
* Outlook for major currencies
107 ~ 112 105 ~ 110 102 ~ 108 100 ~ 107 98 ~ 106
1.11 ~ 1.16 1.12 ~ 1.17 1.12 ~ 1.18 1.13 ~ 1.19 1.14 ~ 1.20
121 ~ 127 120 ~ 127 119 ~ 126 118 ~ 126 116 ~ 125EUR/JPY(123) (123) (122) (119) (118)
EUR/USD(1.14) (1.15) (1.16) (1.17) (1.18)
USD/JPY(108) (107) (105) (102) (100)
2019年 7~9月 10~12月 2020年 4~6月4~6月 1~3月
6.50 ~ 6.90 6.50 ~ 6.90 6.45 ~ 6.85 6.45 ~ 6.85 6.40 ~ 6.80
5.80 ~ 6.45 5.91 ~ 6.57 5.97 ~ 6.72 6.03 ~ 6.85 6.04 ~ 6.94
15.51 ~ 17.23 15.22 ~ 16.92 14.89 ~ 16.74 14.60 ~ 16.59 14.41 ~ 16.56
7.22 ~ 8.00 7.28 ~ 8.07 7.22 ~ 8.08 7.29 ~ 8.15 7.30 ~ 8.16
(6.60)
2019年7~9月 10~12月
2020年4~6月4~6月 1~3月
USD/CNY(6.73) (6.70) (6.68) (6.65)
(15.2)
100JPY/CNY(6.23) (6.26) (6.36) (6.52) (6.60)
CNY/JPY(16.0) (16.0) (15.7) (15.3)
EUR/CNY(7.67) (7.71) (7.75) (7.78) (7.79)
April to JuneApril to June2019
July to September
October to December
January to March 2020
April to JuneApril to June2019
July to September
October to December
January to March 2020
6
4-2. Outlook for the Chinese yuan exchange market: Summary
Chineseyuan
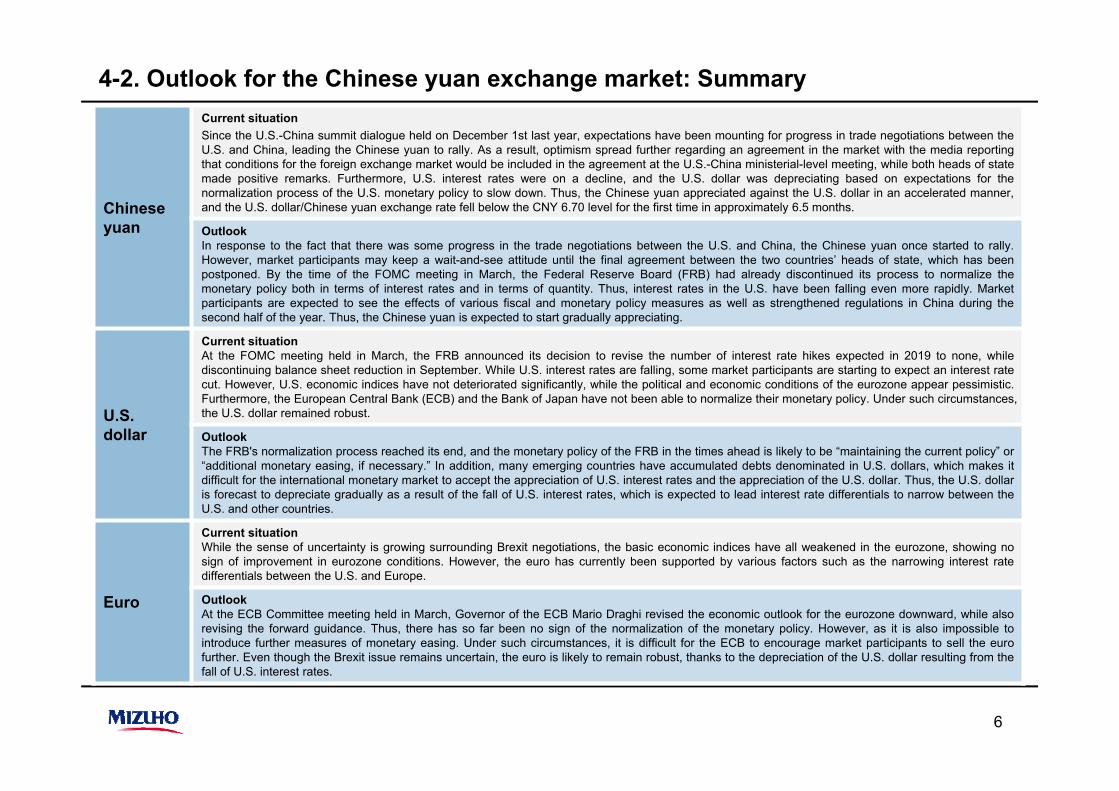
Current situationSince the U.S.-China summit dialogue held on December 1st last year, expectations have been mounting for progress in trade negotiations between theU.S. and China, leading the Chinese yuan to rally. As a result, optimism spread further regarding an agreement in the market with the media reportingthat conditions for the foreign exchange market would be included in the agreement at the U.S.-China ministerial-level meeting, while both heads of statemade positive remarks. Furthermore, U.S. interest rates were on a decline, and the U.S. dollar was depreciating based on expectations for thenormalization process of the U.S. monetary policy to slow down. Thus, the Chinese yuan appreciated against the U.S. dollar in an accelerated manner,and the U.S. dollar/Chinese yuan exchange rate fell below the CNY 6.70 level for the first time in approximately 6.5 months.
OutlookIn response to the fact that there was some progress in the trade negotiations between the U.S. and China, the Chinese yuan once started to rally.However, market participants may keep a wait-and-see attitude until the final agreement between the two countries’ heads of state, which has beenpostponed. By the time of the FOMC meeting in March, the Federal Reserve Board (FRB) had already discontinued its process to normalize themonetary policy both in terms of interest rates and in terms of quantity. Thus, interest rates in the U.S. have been falling even more rapidly. Marketparticipants are expected to see the effects of various fiscal and monetary policy measures as well as strengthened regulations in China during thesecond half of the year. Thus, the Chinese yuan is expected to start gradually appreciating.
U.S.dollar
Current situationAt the FOMC meeting held in March, the FRB announced its decision to revise the number of interest rate hikes expected in 2019 to none, whilediscontinuing balance sheet reduction in September. While U.S. interest rates are falling, some market participants are starting to expect an interest ratecut. However, U.S. economic indices have not deteriorated significantly, while the political and economic conditions of the eurozone appear pessimistic.Furthermore, the European Central Bank (ECB) and the Bank of Japan have not been able to normalize their monetary policy. Under such circumstances,the U.S. dollar remained robust.
OutlookThe FRB's normalization process reached its end, and the monetary policy of the FRB in the times ahead is likely to be “maintaining the current policy” or“additional monetary easing, if necessary.” In addition, many emerging countries have accumulated debts denominated in U.S. dollars, which makes itdifficult for the international monetary market to accept the appreciation of U.S. interest rates and the appreciation of the U.S. dollar. Thus, the U.S. dollaris forecast to depreciate gradually as a result of the fall of U.S. interest rates, which is expected to lead interest rate differentials to narrow between theU.S. and other countries.
Euro
Current situationWhile the sense of uncertainty is growing surrounding Brexit negotiations, the basic economic indices have all weakened in the eurozone, showing nosign of improvement in eurozone conditions. However, the euro has currently been supported by various factors such as the narrowing interest ratedifferentials between the U.S. and Europe.
OutlookAt the ECB Committee meeting held in March, Governor of the ECB Mario Draghi revised the economic outlook for the eurozone downward, while alsorevising the forward guidance. Thus, there has so far been no sign of the normalization of the monetary policy. However, as it is also impossible tointroduce further measures of monetary easing. Under such circumstances, it is difficult for the ECB to encourage market participants to sell the eurofurther. Even though the Brexit issue remains uncertain, the euro is likely to remain robust, thanks to the depreciation of the U.S. dollar resulting from thefall of U.S. interest rates.

5. Trends in the Chinese yuan interest rate market
Source: Bloomberg
1
1.5
2
2.5
3
3.5
4
4.5
5
5.5
Apr-16 Jul-16 Oct-16 Jan-17 Apr-17 Jul-17 Oct-17 Jan-18 Apr-18 Jul-18 Oct-18 Jan-19
O/N SHIBOR
1W SHIBOR
3M SHIBOR
CDB2Y
CDB3Y
Growth support Focus on the “control of asset bubbles” and the “prevention of financial crisis”
The Medium-term lending facility (MLF), Standing Lending Facility
(SLF), and reverse repo rate were raised.
RRR cut
Slight change in monetary
policy toward monetary
easing
7
8
Source:Bloomberg
Category Economic index Month Result Previous Comment
Economic growth
GDP(year-on-year) 2019/1Q 6.40% 6.40%
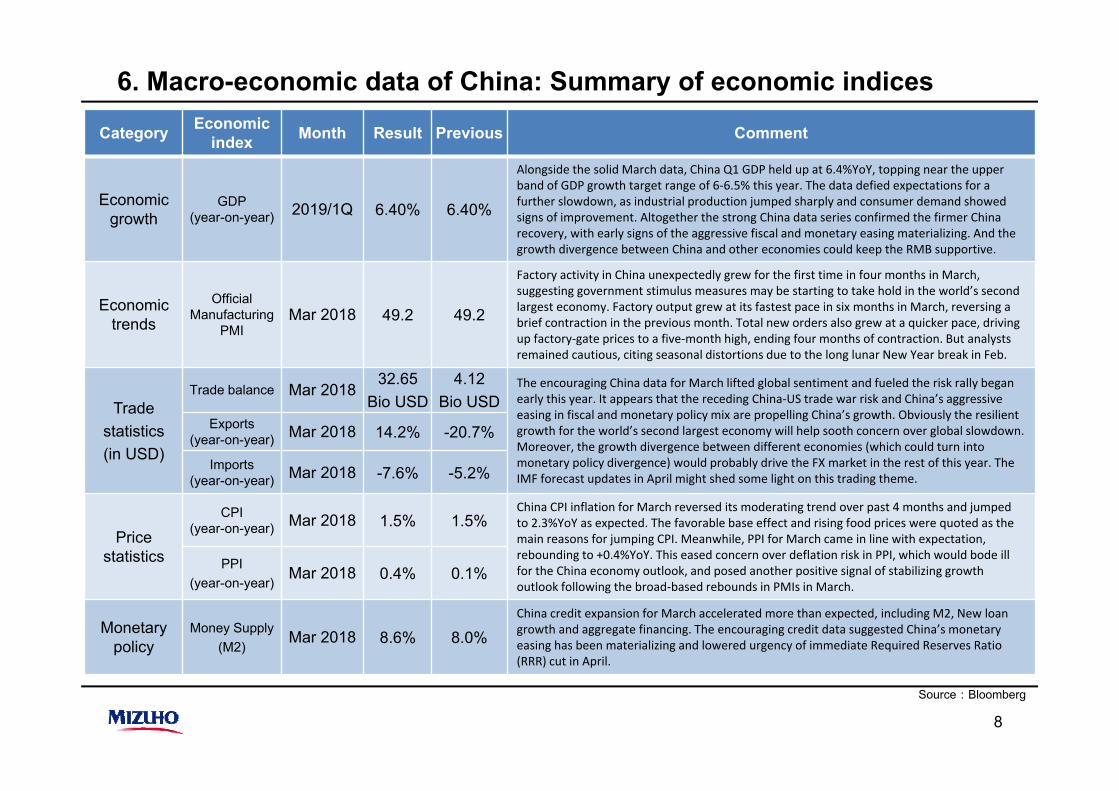
Alongside the solid March data, China Q1 GDP held up at 6.4%YoY, topping near the upper band of GDP growth target range of 6-6.5% this year. The data defied expectations for a further slowdown, as industrial production jumped sharply and consumer demand showed signs of improvement. Altogether the strong China data series confirmed the firmer China recovery, with early signs of the aggressive fiscal and monetary easing materializing. And the growth divergence between China and other economies could keep the RMB supportive.
Economic trends
OfficialManufacturing
PMIMar 2018 49.2 49.2
Factory activity in China unexpectedly grew for the first time in four months in March, suggesting government stimulus measures may be starting to take hold in the world’s second largest economy. Factory output grew at its fastest pace in six months in March, reversing a brief contraction in the previous month. Total new orders also grew at a quicker pace, driving up factory-gate prices to a five-month high, ending four months of contraction. But analysts remained cautious, citing seasonal distortions due to the long lunar New Year break in Feb.
Tradestatistics(in USD)
Trade balance Mar 201832.65
Bio USD4.12
Bio USDThe encouraging China data for March lifted global sentiment and fueled the risk rally began early this year. It appears that the receding China-US trade war risk and China’s aggressive easing in fiscal and monetary policy mix are propelling China’s growth. Obviously the resilient growth for the world’s second largest economy will help sooth concern over global slowdown. Moreover, the growth divergence between different economies (which could turn into monetary policy divergence) would probably drive the FX market in the rest of this year. The IMF forecast updates in April might shed some light on this trading theme.
Exports (year-on-year) Mar 2018 14.2% -20.7%
Imports(year-on-year) Mar 2018 -7.6% -5.2%
Pricestatistics
CPI(year-on-year) Mar 2018 1.5% 1.5%
China CPI inflation for March reversed its moderating trend over past 4 months and jumped to 2.3%YoY as expected. The favorable base effect and rising food prices were quoted as the main reasons for jumping CPI. Meanwhile, PPI for March came in line with expectation, rebounding to +0.4%YoY. This eased concern over deflation risk in PPI, which would bode ill for the China economy outlook, and posed another positive signal of stabilizing growth outlook following the broad-based rebounds in PMIs in March.
PPI(year-on-year)
Mar 2018 0.4% 0.1%
Monetarypolicy
Money Supply(M2)
Mar 2018 8.6% 8.0%China credit expansion for March accelerated more than expected, including M2, New loan growth and aggregate financing. The encouraging credit data suggested China’s monetary easing has been materializing and lowered urgency of immediate Required Reserves Ratio (RRR) cut in April.
6. Macro-economic data of China: Summary of economic indices

7. Upcoming key events
Source: Bloomberg
9
○China ○U.S. 〇EuropeDate Indices and events Date Indices and events Date Country Indices and events
April 7 Foreign currency reserves April 1 Retail sales (Feb.) April 1 EU Markit Eurozone Manufacturing PMI April 10 to 15 Money supply M2 ISM Manufacturing Index Germany Markit Germany Manufacturing PMI
April 11 CPI April 3 ISM Non-Manufacturing Index April 3 EU Euro area retail salesPPI April 5 Employment statistics April 10 EU ECB Governing Council
April 12 Trade statistics April 10 CPI April 16 Germany ZEW Indicator of Economic Sentiment April 17 GDP April 11 PPI April 23 EU Consumer Confidence Index
Industrial production April 16 Industrial production April 24 Germany IFO Business Climate IndexRetail sales April 17 Trade balance
April 30 Non-Manufacturing PMI Aprili 18 Markit U.S. Manufacturing PMI Manufacturing PMI Retail sales (Mar.)
April 23 New home salesApril 26 GDP
○ Japan April 30 Consumer Confidence IndexDate Indices and events April 30 to May 1 FOMC
April 17 Trade statisticsApril 19 CPI
April 24 to 25 Monetary Policy Meeting of BOJ
April 26 Unemployment ratio, effective opening-to-application ratioIndustrial production

95
100
105
110
115
120
125
Apr. Jul. Oct. Jan. Apr. Jul. Oct. Jan. Apr. Jul. Oct. Jan.
July 31The Bank of Japan introduced forward guidance, loosening the control of the yield curve.
March 21The interest rate was raised in the U.S.
June 13The interest rate was raised in the U.S.The number of expected policy interest rate hikes in the U.S. in 2018 was revised from three to four.
March 20Expected policy interest rate hikes in the U.S. in 2019: Cut from twice to none; decision to discontinue balance sheet reduction
January 20Inauguration of U.S. President Donald Trump
April 28The BOJunexpectedlydecided tomaintain theexistingmonetarypolicy.
June 24There was a rapid appreciation of the Japanese yen caused by risk-averse sentiment in the market,resulting from the Brexit.
July 8 and August 5The employment statistics of the U.S. turned out to be significantly stronger than expected.
2017
Reference (1): Global market: USD/JPY exchange market (From April 2016)
Period: April 1, 2016 to March 31, 2019USD/JPY exchange rate: JPY 99.89 to 118.18
Source: Bloomberg
2018
April 23As a result of the first round of voting in the French presidential election, the second round was between Emmanuel Macron and Marine Le Pen. Finally, Macron was elected French president.
May 17Risk-averse sentiment grew further in the market due to President Trump’s problems regarding Russia.
June 14Interest rate hike in the U.S.Announcement ofthe plan to reducethe balance sheet
September 21The FOMC maintained its outlook for an interest rate hike before the end of the year.
December 13The FOMC raised theinterest rate by 25 basispoints. The outlook forthree interest rate hikes in 2018 was maintained.
September 21The BOJ decided to introduce additional measures of monetaryeasing (yield curve control and overshootingcommitment).
December 14The interest rate was raised in the U.S.
November 9Against market expectations, Donald Trump was elected as the next U.S. President.
March 15The interest rate wasraised in the U.S.
2016
10

1.03
1.08
1.13
1.18
1.23
Apr. Jul. Oct. Jan. Apr. Jul. Oct. Jan. Apr. Jul. Oct. Jan.2017
Reference (2): Global market: EUR/USD exchange market (From April 2016)
Period: April 1, 2016 to March 31, 2019EUR/USD exchange rate: USD 1.0388 to 1.2555
Source: Bloomberg
2018
April 23As a result of the first round of voting in the French presidential election, the second round was between Emmanuel Macron and Marine Le Pen. Finally, Macron was elected French president.
May 17The U.S. dollar depreciated due to President Trump’s problems regarding Russia.
June 14Interest rate hike in the U.S.Announcement of the plan to reduce the balance sheet
September 25Angela Merkel won the election for Chancellor of Germany.November 9
Against market expectations,Donald Trump waselected as the nextU.S. President.
March 29The U.K. gave official notification of withdrawal from the EU.
October 4The media reported that the ECB slowed down asset purchase (tapering).→ The report was denied thereafter.
July 8 and August 5The employment statistics of the U.S. turned out to be significantly stronger than expected.
December 8Decision to extend the bond purchasing program
June 24Pressure tosell the euro strengthened, due to the Brexit.
October 26The ECB Committee decided to cut asset purchasing in half.
June 27ECB governor Mario Draghi made a hawkish remark, stating “the deflationary forces were replaced by reflationary ones” and “the factors controlling inflation are all temporary ones.”
April 17German economic indices remained weak, and expectations for an interest rate hike by the ECB were lowered.
June 15The ECB Committee announced its decision to keep a negative interest rate until summer 2019.
11
4.5
5.5
6.5
7.5
8.5
9.5
05 06 07 08 09 10 11 12 13 14 15 16 17 18 19
6.0
6.5
7.0
7.5
8.0
8.5
05 06 07 08 09 10 11 12 13 14 15 16 17 18 19
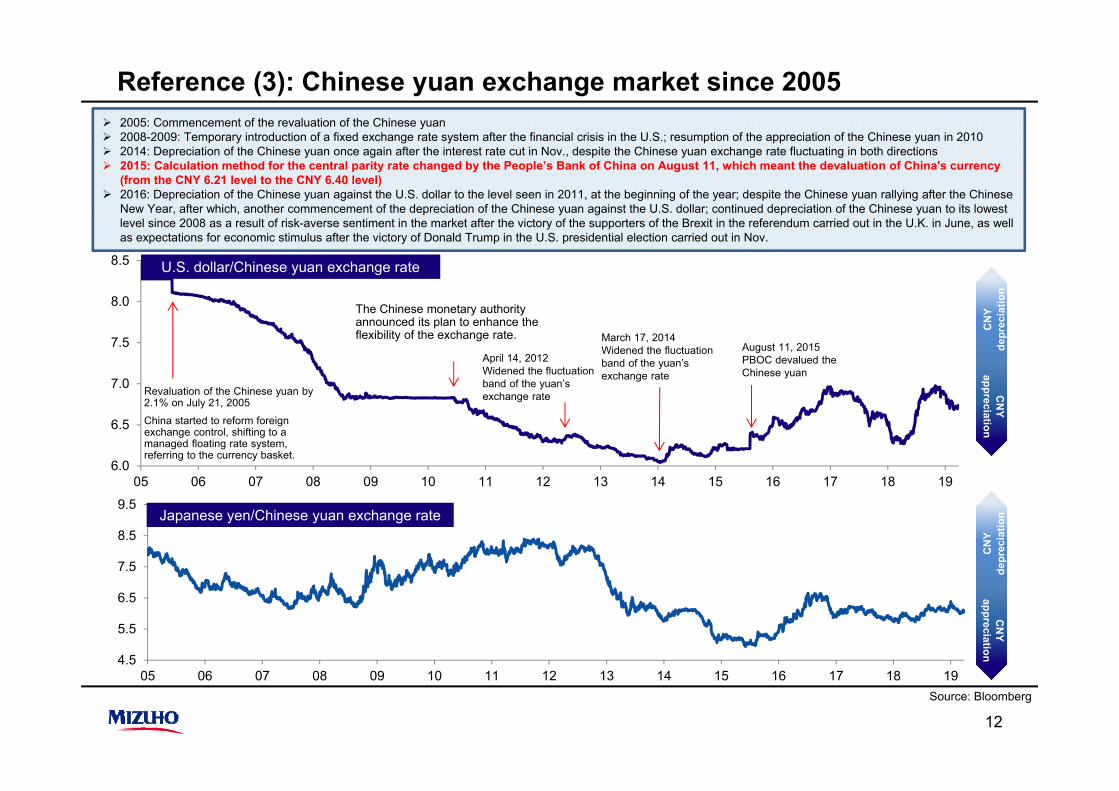
Revaluation of the Chinese yuan by 2.1% on July 21, 2005
China started to reform foreign exchange control, shifting to a managed floating rate system, referring to the currency basket.
The Chinese monetary authority announced its plan to enhance the flexibility of the exchange rate.
August 11, 2015PBOC devalued the Chinese yuan
March 17, 2014Widened the fluctuation band of the yuan’s exchange rate
April 14, 2012Widened the fluctuation band of the yuan’s exchange rate
U.S. dollar/Chinese yuan exchange rate
Japanese yen/Chinese yuan exchange rate
2005: Commencement of the revaluation of the Chinese yuan2008-2009: Temporary introduction of a fixed exchange rate system after the financial crisis in the U.S.; resumption of the appreciation of the Chinese yuan in 20102014: Depreciation of the Chinese yuan once again after the interest rate cut in Nov., despite the Chinese yuan exchange rate fluctuating in both directions2015: Calculation method for the central parity rate changed by the People’s Bank of China on August 11, which meant the devaluation of China's currency (from the CNY 6.21 level to the CNY 6.40 level)2016: Depreciation of the Chinese yuan against the U.S. dollar to the level seen in 2011, at the beginning of the year; despite the Chinese yuan rallying after the Chinese New Year, after which, another commencement of the depreciation of the Chinese yuan against the U.S. dollar; continued depreciation of the Chinese yuan to its lowest level since 2008 as a result of risk-averse sentiment in the market after the victory of the supporters of the Brexit in the referendum carried out in the U.K. in June, as well as expectations for economic stimulus after the victory of Donald Trump in the U.S. presidential election carried out in Nov.
Reference (3): Chinese yuan exchange market since 2005
Source: Bloomberg
12
CN
Yde
prec
iatio
n
CN
Yappreciation
CN
Yde
prec
iatio
n
CN
Yappreciation

13
Inquiries regarding this document should be addressed to:Customer Team, Treasury Department, Mizuho Bank (China), Ltd.(Tel: 86-21-3855-8888)
All information included in this proposal should not be regarded as any legal, accounting ortaxation advice from Mizuho. No person should rely on the contents of such informationwithout obtaining prior advice from any qualified professional expert's) in each relevant sector.If Mizuho’s service under this proposal calls for specific professional advice or service, clientshall seek independent professional expert(s)’ help. Alternatively, if Mizuho’s assistance isrequired for referral of relevant expert(s), there is no extra referral fee for such referral andMizuho is not liable for the advice or service given by such expert(s). All information includedin this proposal is strictly exclusive for Mizuho's clients' internal use only. No disclosure to anythird party from clients should be allowed.All rights reserved. No part of content of this proposal may be reproduced or copied in anyform or by any means. Mizuho disclaims all and any liability and responsibility to any personupon correctness, reliability and completeness of the whole or any part of the contents of thisproposal. No assurance on the acquisition of approval for any permit application is included.The services provided by any member of the Mizuho Financial Group are subject to applicablelaws, regulations and supervision of applicable regulatory authorities’ in the jurisdictions wherethe services are provided.
Notice and Contact Information Regarding This Document