outlook for airline markets and industry performance - · pdf file ·...
TRANSCRIPT

Outlook for airline
markets and industry
performance
June 2016
Brian Pearce
Chief Economist
International Air Transport Association

The already weak economic cycle is slowing
www.iata.org/economics 2 Source: Netherlands CPB, Markit
30
35
40
45
50
55
60
65
70
-20%
-15%
-10%
-5%
0%
5%
10%
15%
20%
2004 2005 2006 2007 2008 2009 2010 2011 2012 2013 2014 2015 2016
Co
nfi
den
ce in
dex
. 5
0 =
no
ch
ange
% c
han
ge o
ver
pre
vio
us
year
Global economic cycle indicators
International trade growth
Industrial production growth
Business confidence

Now both developed and emerging economies weaker
www.iata.org/economics 3 Source: IATA Economics using Markit data
35
40
45
50
55
60
2006 2007 2008 2009 2010 2011 2012 2013 2014 2015 2016
PM
I, 5
0 =
no
ch
ange
Business confidence
Developed economies
Emerging economies

Globalization is still paused
www.iata.org/economics 4 Sources: IATA, Netherlands CPB, OECD-WTO TiVA database
30
32
34
36
38
40
42
44
46
48
50
52
50
60
70
80
90
100
110
120
1995 1997 1999 2001 2003 2005 2007 2009 2011 2013 2015
Index (Oct 2008=100)
World trade/IP ratio vs. measure of global supply chainsShare (%)
World trade/IP ratio
Ratio of foreign value added to domestic value added in world gross exports

International trade growth has slowed to a stop
www.iata.org/economics 5 Source: IATA using Netherlands CPB data
-20%
-15%
-10%
-5%
0%
5%
10%
15%
20%
2006 2007 2008 2009 2010 2011 2012 2013 2014 2015 2016
Ch
ange
ove
r p
revi
ou
s ye
ar
Contributions to growth in international trade volumes
Emerging economies contribution
Advanced economies contribution

So cargo is weak…but air travel is still booming
Source: ICAO, IATA
Passenger RPKs
www.iata.org/economics 5
2,000
3,000
4,000
5,000
6,000
7,000
80
130
180
230
280
1995 1997 1999 2001 2003 2005 2007 2009 2011 2013 2015
RP
Ks
bill
ion
FTK
s b
illio
n
Air travel and cargo volumes
Cargo FTKs
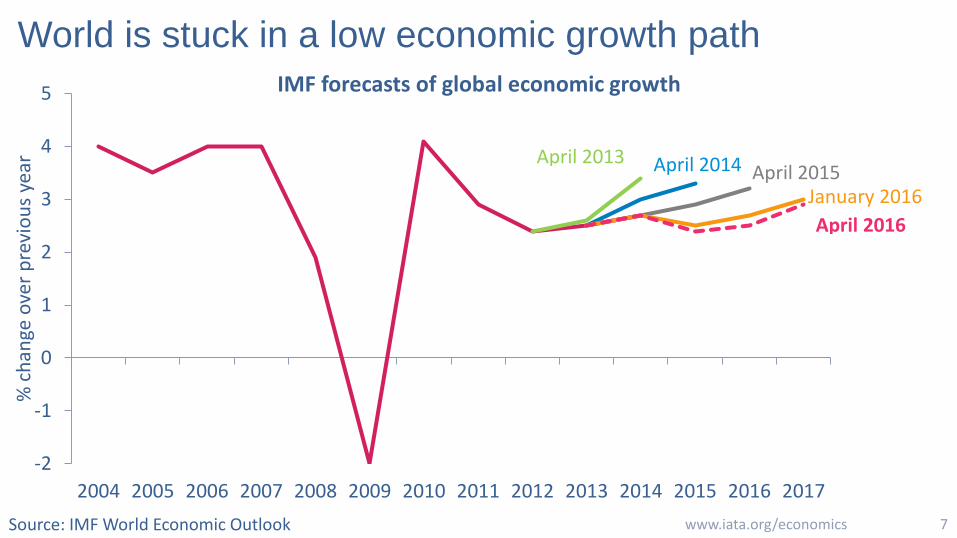
World is stuck in a low economic growth path
www.iata.org/economics 7 Source: IMF World Economic Outlook
-2
-1
0
1
2
3
4
5
2004 2005 2006 2007 2008 2009 2010 2011 2012 2013 2014 2015 2016 2017
% c
han
ge o
ver
pre
vio
us
year
IMF forecasts of global economic growth
April 2016
January 2016April 2015April 2014April 2013

Yet air travel growth has remained strong
www.iata.org/economics 8 Source: IATA Economic Performance of the Airline Industry
-2
0
2
4
6
8
10
2005 2006 2007 2008 2009 2010 2011 2012 2013 2014 2015 2016 2017
% c
han
ge o
ver
pre
vio
us
year
IATA forecasts of global RPK growth
Dec 2012Dec 2013
Dec 2015Dec 2014

Cargo revenues significantly lag passenger business
www.iata.org/economics 9 Source: ICAO, IATA
30
40
50
60
70
80
90
200
250
300
350
400
450
500
550
600
2000 2002 2004 2006 2008 2010 2012 2014 2016
US
$ b
illio
n
US
$ b
illio
n
Revenues from passengers and cargo
Passenger revenue
Cargo revenue
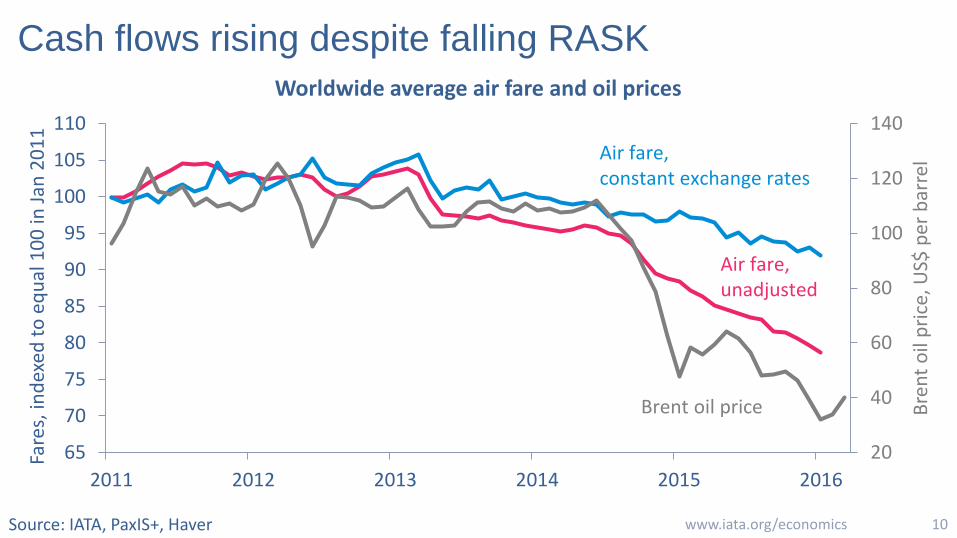
Cash flows rising despite falling RASK
www.iata.org/economics 10 Source: IATA, PaxIS+, Haver
20
40
60
80
100
120
140
65
70
75
80
85
90
95
100
105
110
2011 2012 2013 2014 2015 2016
Bre
nt
oil
pri
ce, U
S$ p
er b
arre
l
Fare
s, in
dex
ed t
o e
qu
al 1
00
in J
an 2
01
1
Worldwide average air fare and oil prices
Air fare, constant exchange rates
Air fare,unadjusted
Brent oil price

Widening asset utilization gap driving returns
www.iata.org/economics 11 Source: ICAO, IATA
58
60
62
64
66
68
2000 2002 2004 2006 2008 2010 2012 2014 2016
% A
TKs
Breakeven and achieved weight load factor
Achieved LF
Breakeven LF
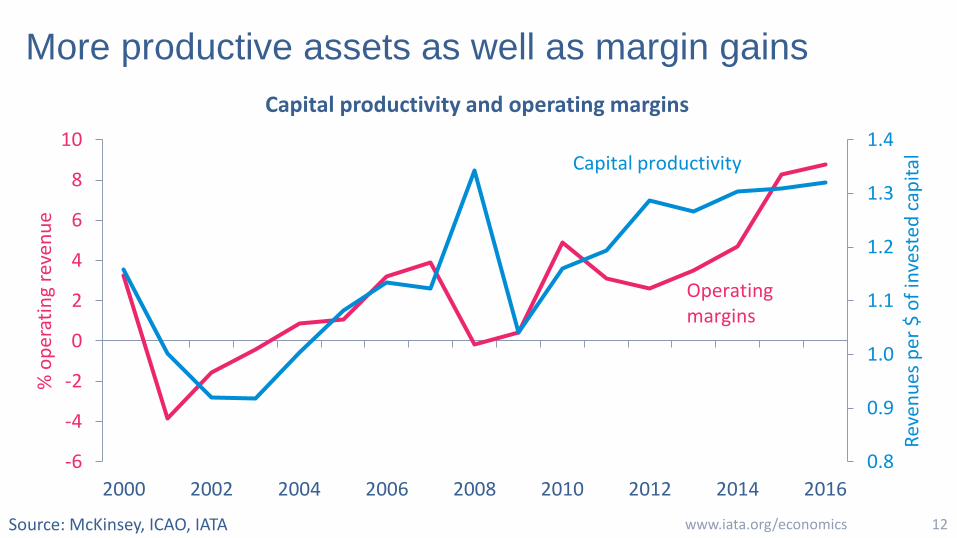
More productive assets as well as margin gains
www.iata.org/economics 12 Source: McKinsey, ICAO, IATA
0.8
0.9
1.0
1.1
1.2
1.3
1.4
-6
-4
-2
0
2
4
6
8
10
2000 2002 2004 2006 2008 2010 2012 2014 2016
Rev
enu
es p
er $
of
inve
sted
cap
ital
% o
per
atin
g re
ven
ue
Capital productivity and operating margins
Operating margins
Capital productivity

Return on airline capital now rising in most regions
www.iata.org/economics 13 Source: IATA calculations from The Airline Analyst
0%
2%
4%
6%
8%
10%
12%
14%
16%
2010 2011 2012 2013 2014 2015
% o
f in
vest
ed c
apit
al
Return on invested capital by region
North America
Europe
Asia Pacific
Latin America

Better performance is spread more widely now
www.iata.org/economics 14 Source: IATA calculations from The Airline Analyst
-15%
-10%
-5%
0%
5%
10%
15%
20%
25%
30%
35%
40%
ROIC in 2015 by region and airline
North America Europe Asia PacificMiddle East
Latin America
Africa
Average cost of capital

Balance sheets improved except in L America
www.iata.org/economics 15 Source: IATA calculations from The Airline Analyst
2.0
2.5
3.0
3.5
4.0
4.5
5.0
5.5
6.0
6.5
7.0
2011 2012 2013 2014 2015
Ad
just
ed n
et d
ebt/
EBIT
DA
R
Adjusted net debt/EBITDAR by region
North America
Europe
Asia Pacific
Latin America

We forecast a 2nd year of above WACC returns
Source: McKinsey, IATA 16 www.iata.org/economics
0.0
2.0
4.0
6.0
8.0
10.0
12.0
1994 1996 1998 2000 2002 2004 2006 2008 2010 2012 2014 2016
% o
f in
vest
ed c
apit
alReturn on capital invested in airlines
Cost of capital (WACC)
Return on capital (ROIC)
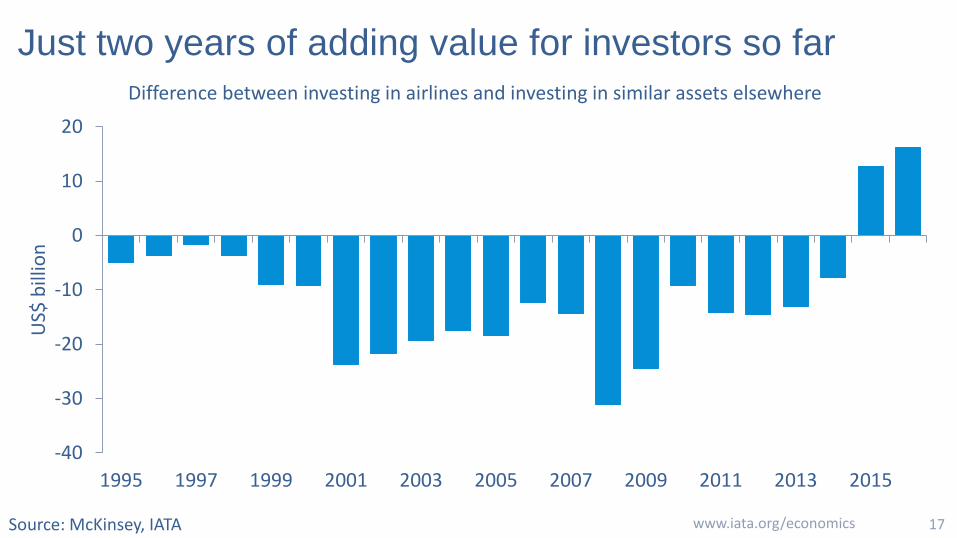
Just two years of adding value for investors so far
www.iata.org/economics 17 Source: McKinsey, IATA
-40
-30
-20
-10
0
10
20
1995 1997 1999 2001 2003 2005 2007 2009 2011 2013 2015
US$
bill
ion
Difference between investing in airlines and investing in similar assets elsewhere

Net post-tax profits of $39.4 billion forecast this year
www.iata.org/economics 18 Source: ICAO, IATA
-40
-30
-20
-10
0
10
20
30
40
-10.0
-8.0
-6.0
-4.0
-2.0
0.0
2.0
4.0
6.0
8.0
10.0
2000 2002 2004 2006 2008 2010 2012 2014 2016
US$
bill
ion
% r
even
ues
Global commercial airline profitability
Net post-tax
EBIT margin

Driven largely by N America, but also Europe & Asia
www.iata.org/economics 19 Source: ICAO, IATA
-10
0
10
20
30
40
50
2010 2011 2012 2013 2014 2015 2016
US$
bill
ion
Net post-tax profit by region
Africa
L America
Middle East
Asia Pacific
Europe
N America
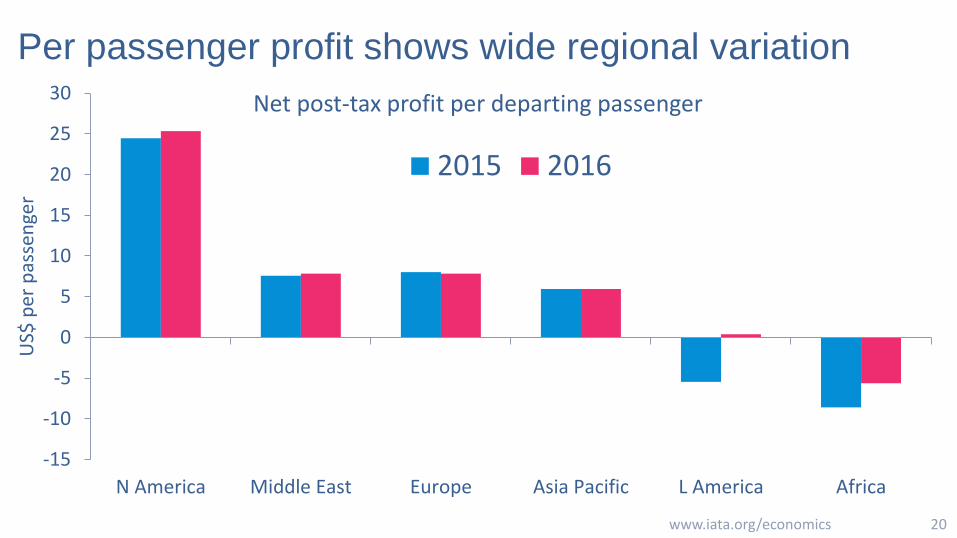
Per passenger profit shows wide regional variation
www.iata.org/economics 20
-15
-10
-5
0
5
10
15
20
25
30
N America Middle East Europe Asia Pacific L America Africa
US$
per
pas
sen
ger
Net post-tax profit per departing passenger
2015 2016

Net profit margins show a rather narrower variation
www.iata.org/economics 21
-10%
-5%
0%
5%
10%
15%
N America Europe Asia Pacific Midle East L America Africa
Net post-tax profit margins
2015 2016