outline of the lab - iowa state...
TRANSCRIPT

1
Steady State Metabolic Modeling Homework In this lab we will use the application CellNetAnalyzer (CNA) to model metabolic pathways in E. coli and M. tuberculosis. This lab is a revised version from a lab presented a Broad Institute in Jan, 2007.
Outline of the Lab • Introduction to CNA • Simulating different nutrient conditions - E. coli • Knockout viability analysis - E. coli using both flux balance analysis and
elementary modes. • Knockout analysis to predict drug targets - M. tuberculosis
► All commands and actions are indicated as highlighted yellow steps CellNetAnalyzer and MatLab commands are in Courier Font
Introduction to Cell Net Analyzer (CNA)
Starting CNA ►Start Matlab Note: before the next step the MatLab current directory must be set to the directory in which CNA is installed. ►type “startcna” in the MatLab command window ►Click the OK button in the red CNA window The red CNA window will disappear, and the CNA Network Properties window will appear.
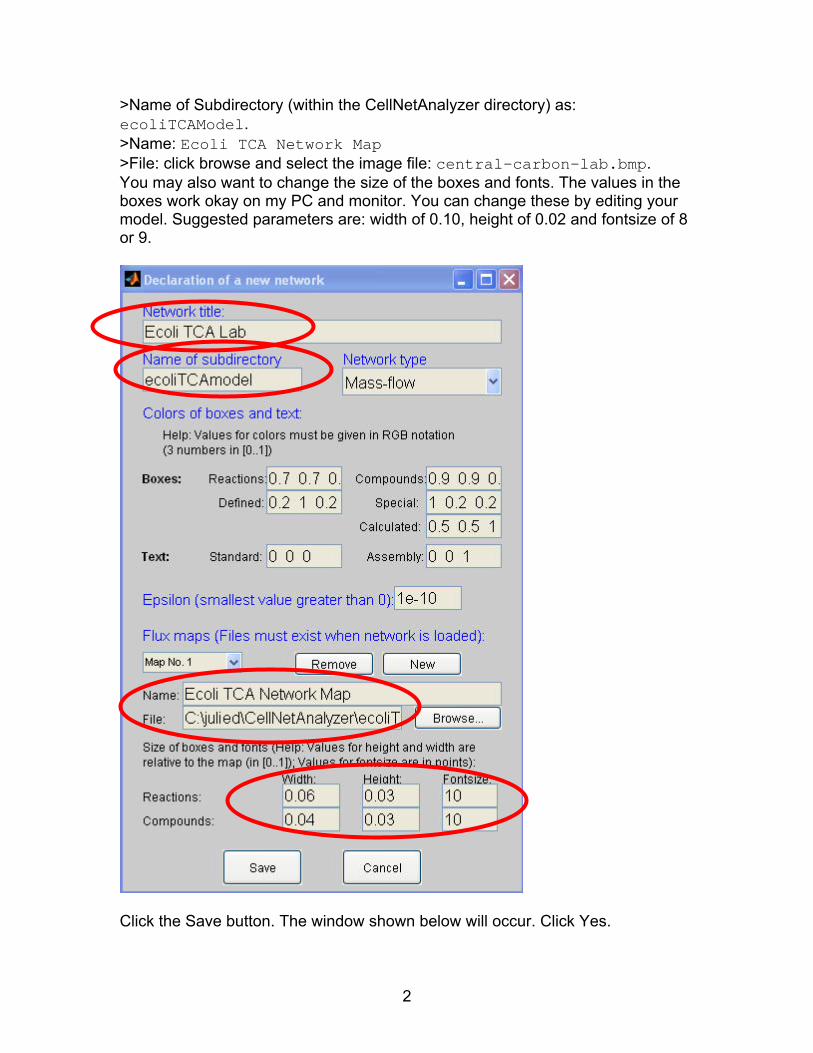
Load the Ecoli TCA model The next step is to load the TCA model into the Cell Net Analyzer program. Download the zip file with the ecoliTCAmodel. Unzip the directory into the CellNetAnalyzer folder. Click the “New” button on the Network Projects window. The box shown on the next page will appear. Fill in the circled fields as specified below: >Network Title box with: Ecoli TCA Lab
2
>Name of Subdirectory (within the CellNetAnalyzer directory) as: ecoliTCAModel. >Name: Ecoli TCA Network Map >File: click browse and select the image file: central-carbon-lab.bmp. You may also want to change the size of the boxes and fonts. The values in the boxes work okay on my PC and monitor. You can change these by editing your model. Suggested parameters are: width of 0.10, height of 0.02 and fontsize of 8 or 9.
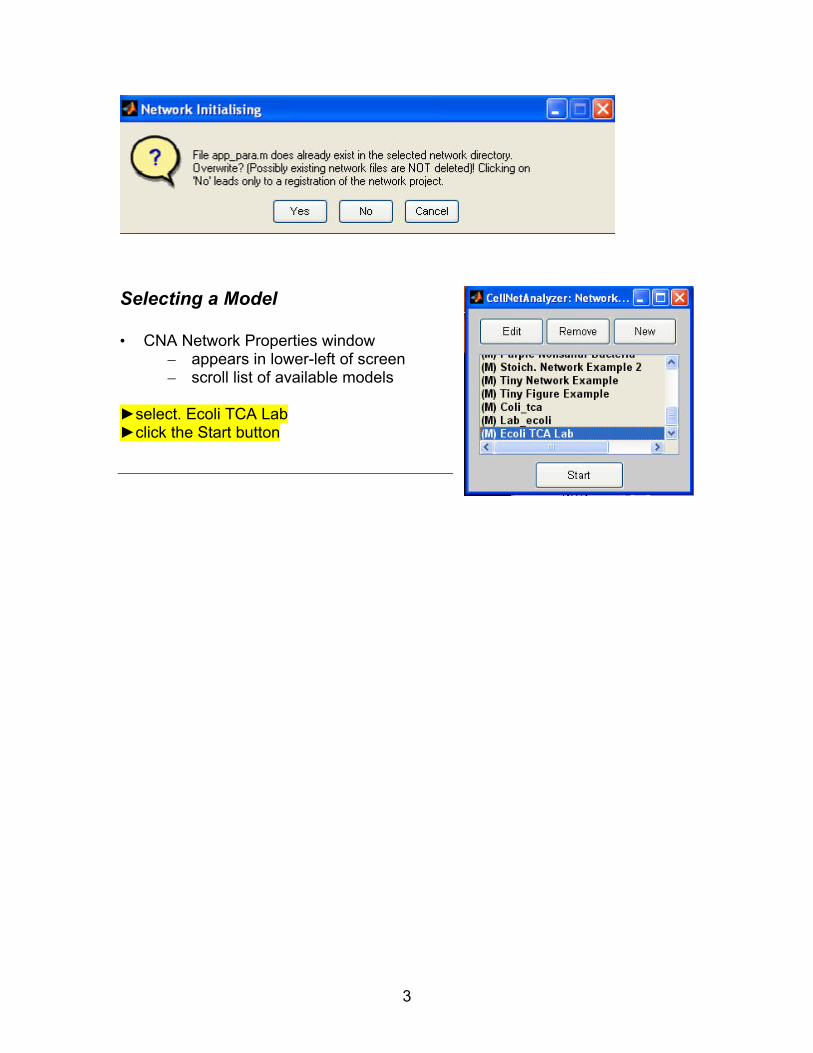
Click the Save button. The window shown below will occur. Click Yes.
3
Selecting a Model • CNA Network Properties window
– appears in lower-left of screen – scroll list of available models
►select. Ecoli TCA Lab ►click the Start button
4
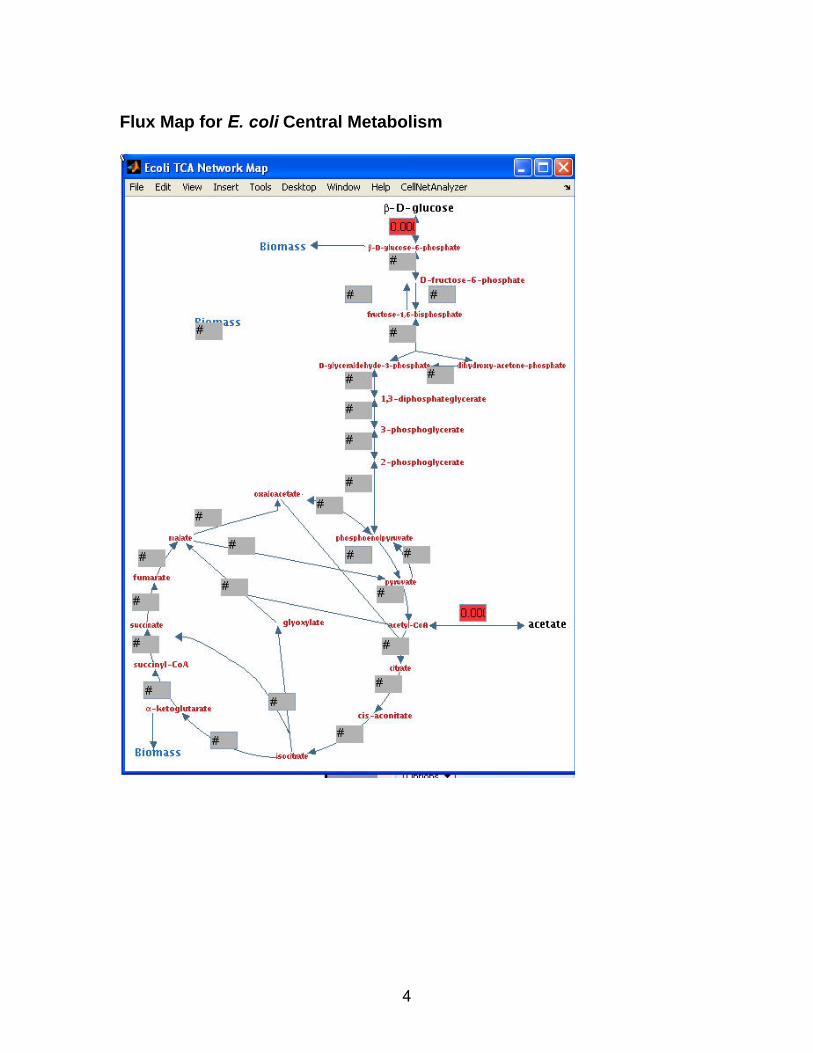
Flux Map for E. coli Central Metabolism

5
Conventions used in this model This is a model of glycolysis, gluconeogenesis and the TCA cycle in E coli.
• Metabolites o Metabolites are represented by text names.
We use the following color fonts in our lab models. Black Font– nutrient sources: (glucose, acetate in this model Red Font– intermediate metabolites Blue Font– “end product” metabolite: (Biomass in this model)
• Reactions o Reactions are represented by arrows between substrate and
product metabolites reactions with 2 arrow heads are reversible arrow heads for irreversible reactions point to the product
metabolite o Boxes are used to display and set values related to reactions.
(corresponding CellNetAnalyzer menu items are listed below) Reaction name
• Show names of network elements Minimum and Maximum Flux Values
• Show Constraints • Set Constraints
Flux Values • the red boxes indicate values that have been
initialized to 0 • Flux Optimization
o More about Boxes Boxes with a 3-D appearance allow users to set and change
values “Flat” Boxes are display values, but cannot be edited Boxes appear red if they have an initial value of 0.0 Boxes display a “#” to indicate an uninitialized value.

6
Performing CNA Commands►
Displaying information about the model • We will mostly use commands from the CellNetAnalyzer menu on top
right of the Flux Map window • We use “ ” to indicate selection of a submenu
Show the reaction equations ►CellNetAnalyzer Show all reaction equations • Result appears in MatLab window
• The names of reactions (e.g. AcCoA::Ac) appear after the reaction number.
• Reversible reactions are indicated with the symbols <==> • Reversible reactions are represented as a single reaction, not a pair of
reactions, reaction fluxes can therefore be negative. • The Biomass metabolites are α-ketoglutarate and glucose-6-phosphate.

7
Show the reaction names
►Select CellNetAnalyzer • Show names of Network Elements • The names of reactions will appear in the boxes in the Flux Map • Note: the command uses the general term “Network Elements” because
some models can display the names of compounds or signaling pathway elements.
Clearing the reaction box values ►CellNetAnalyzer Scenario... Clear all values • Failing to clear values will cause errors – this is a “feature” of CNA • Network map boxes show “#” when cleared • You will need to Clear all values every time before setting up an
optimization or computing extreme pathways

8
Computing Extreme Pathways/Elementary Modes ►CellNetAnalyzer Scenario... Clear all values ►CellNetAnalyzer Elementary modes and pathway analysis • Compute modes ►Click “Start Computation” in pop-up window • The pop-up “Elementary modes” window allows several options • The “Next” or “Previous” buttons are used to cycle through the
elementary modes • The “Jump” button is used to go to a specific elementary modes ►Click the Jump button ►In the pop-up window type 13, and click the OK button
• Boxes in network map appear blue for the
current elementary mode • Numbers indicate relative flux values (e.g. a
flux is twice another flux)
Elementary Mode 13 Uptake Glucose, excrete Acetate. Note that one unit of glucose produces 2 units of acetate. Also, since the sign of all the reactions is positive, the forward direction of the reaction involving acetate is from acetyl-CoA to acetate. Therefore when we simulate acetate uptake, we will require a negative flux.

9
Show the Constraints ►CellNetAnalyzer Show constraints • Results appear in network map boxes
– Triplet [Coef Min flux Max flux] – Coefficient in objective function – Minimum flux
• Negative for reversible reactions • CNA restriction – non-positive
– Maximum flux • Can be infinite (Inf)
We have set the objective function and the minimum and maximum constraints for this model. Some of the constraints in this model are taken from experimental values, but the constraints of 100 and -100 are somewhat arbitrary. The coefficient of the objective function for the Biomass reaction is -1. This indicates that this model will maximize the amount of biomass produced. The coefficient of the objective function is 0 for all the other reactions. Setting appropriate constraints and an appropriate objective function is an important part of model building.
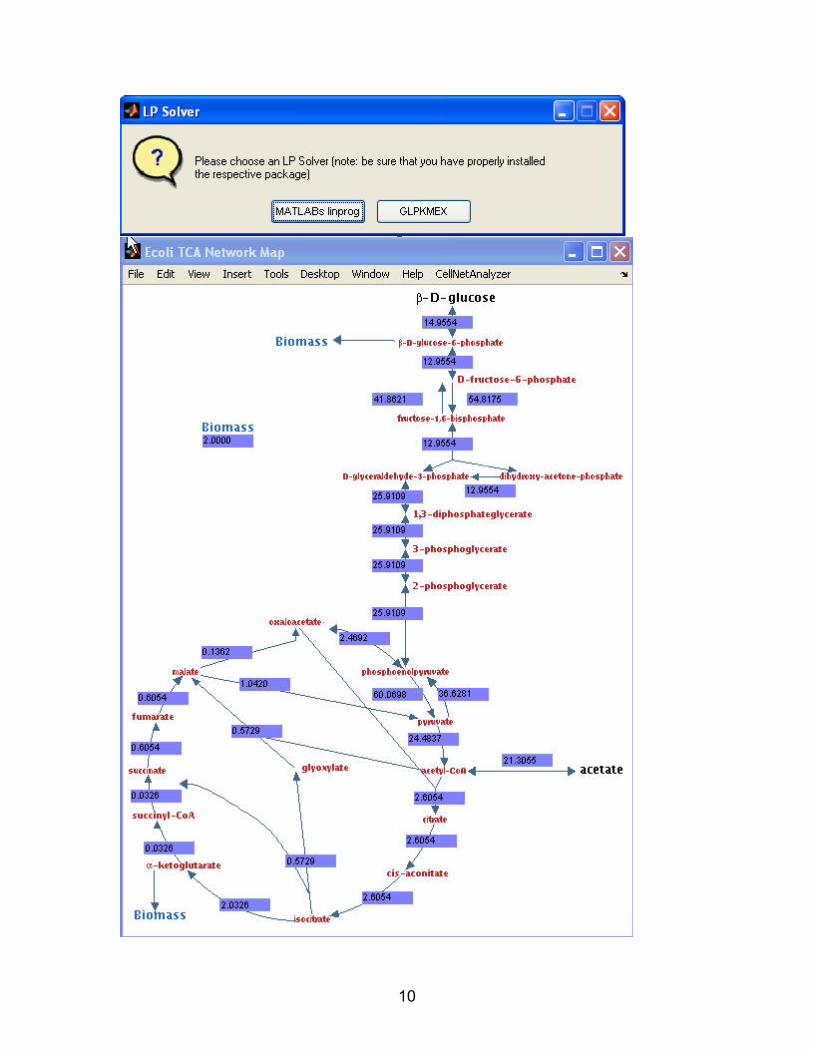
Flux Optimization ►CellNetAnalyzer Scenario... Clear all values ►CellNetAnalyzer Flux Optimization Matlab will ask you to select a linear programming package, selectMATLABs linprog option.
Min Flux Max Flux
Coef. In Obj. Function
10
11
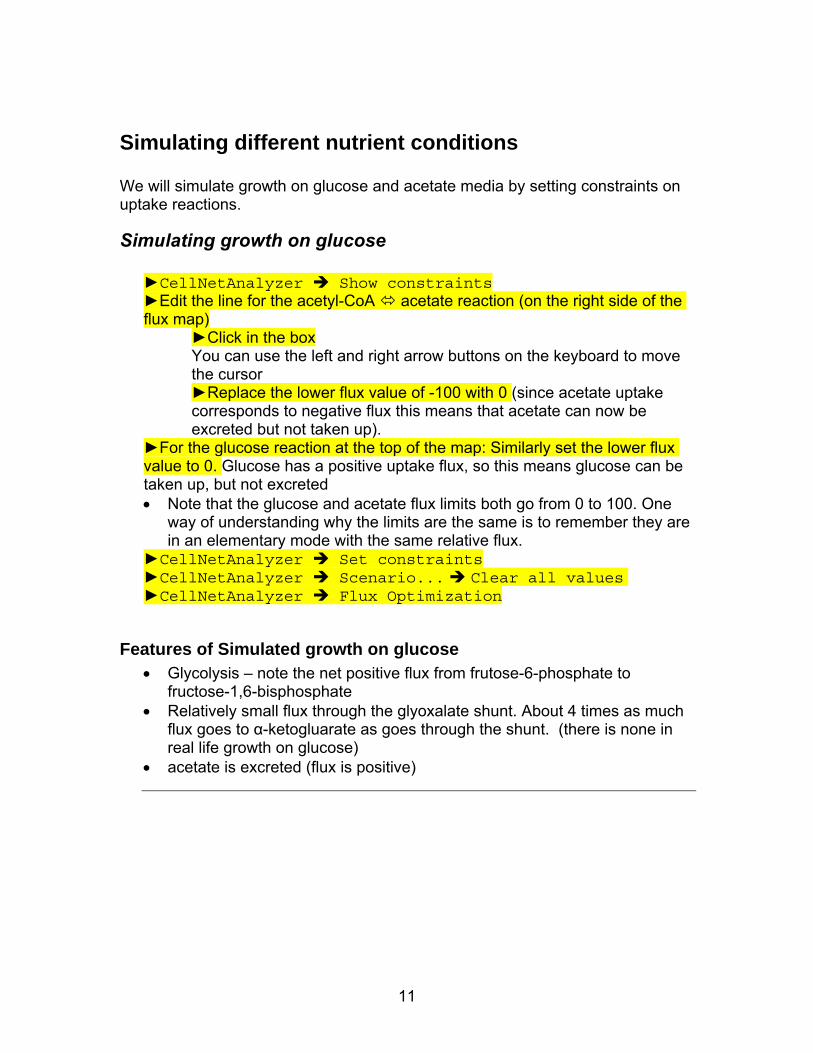
Simulating different nutrient conditions We will simulate growth on glucose and acetate media by setting constraints on uptake reactions.
Simulating growth on glucose ►CellNetAnalyzer Show constraints ►Edit the line for the acetyl-CoA acetate reaction (on the right side of the flux map)
►Click in the box You can use the left and right arrow buttons on the keyboard to move the cursor ►Replace the lower flux value of -100 with 0 (since acetate uptake corresponds to negative flux this means that acetate can now be excreted but not taken up).
►For the glucose reaction at the top of the map: Similarly set the lower flux value to 0. Glucose has a positive uptake flux, so this means glucose can be taken up, but not excreted • Note that the glucose and acetate flux limits both go from 0 to 100. One
way of understanding why the limits are the same is to remember they are in an elementary mode with the same relative flux.
►CellNetAnalyzer Set constraints ►CellNetAnalyzer Scenario... Clear all values ►CellNetAnalyzer Flux Optimization
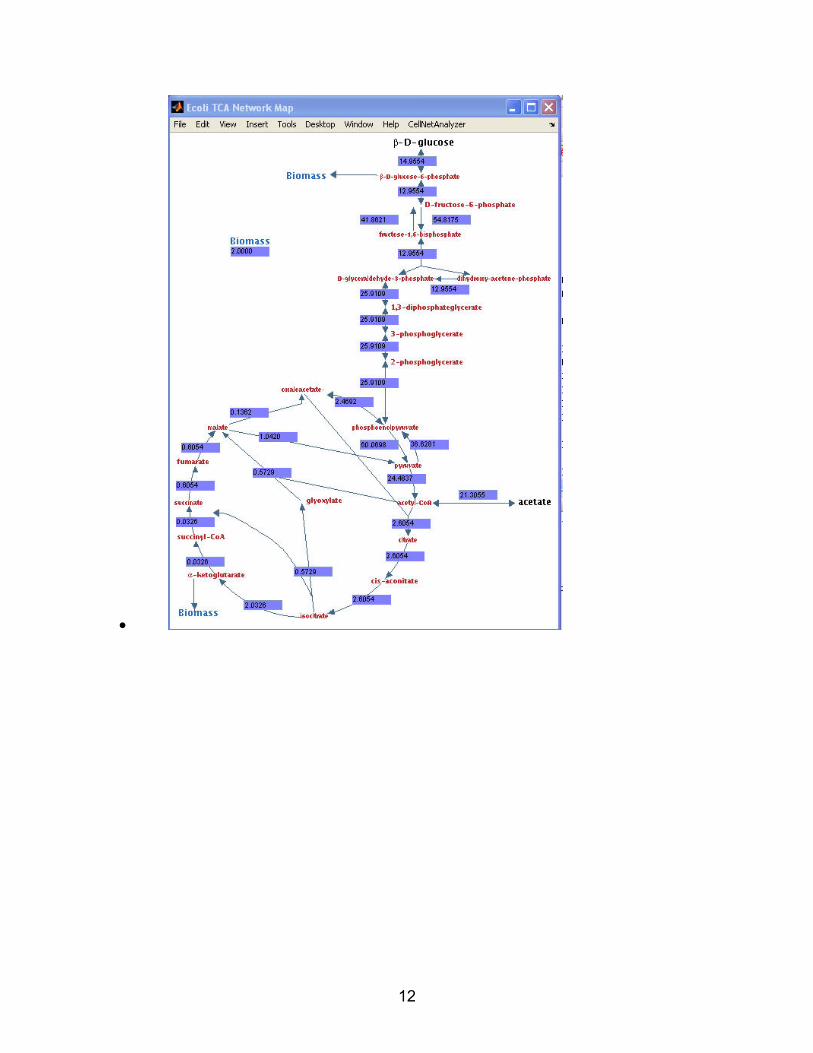
Features of Simulated growth on glucose • Glycolysis – note the net positive flux from frutose-6-phosphate to
fructose-1,6-bisphosphate • Relatively small flux through the glyoxalate shunt. About 4 times as much
flux goes to α-ketogluarate as goes through the shunt. (there is none in real life growth on glucose)
• acetate is excreted (flux is positive)
12
•
13
Problem 1. Simulate growth on acetate. This means that you need to set the flux constraints to force acetate and stop glucose uptake. Start filling out the table below and discuss the difference in biological system. For example, what happens and the glyoxalate shunt? What are the contributions to the total biomass from both sources? What is excreted? Use this table to keep track of the results of your optimizations Enter the amount of biomass produced for growing on glucose and acetate respectively for wild-type Ecoli. Glucose Acetate Wild-type ICit::Glyox k.o. ICit::alKG k.o.
Problem 2. Exploring Knockout Viability for growth on Glucose and Acetate To simulate a knockout, we will set a reaction flux value to 0. This is a different technique than setting the flux limits. Although it is valid in Flux Balance Analysis to set both the minimum and maximum flux limits to 0, the CNA user interface does not allow this.
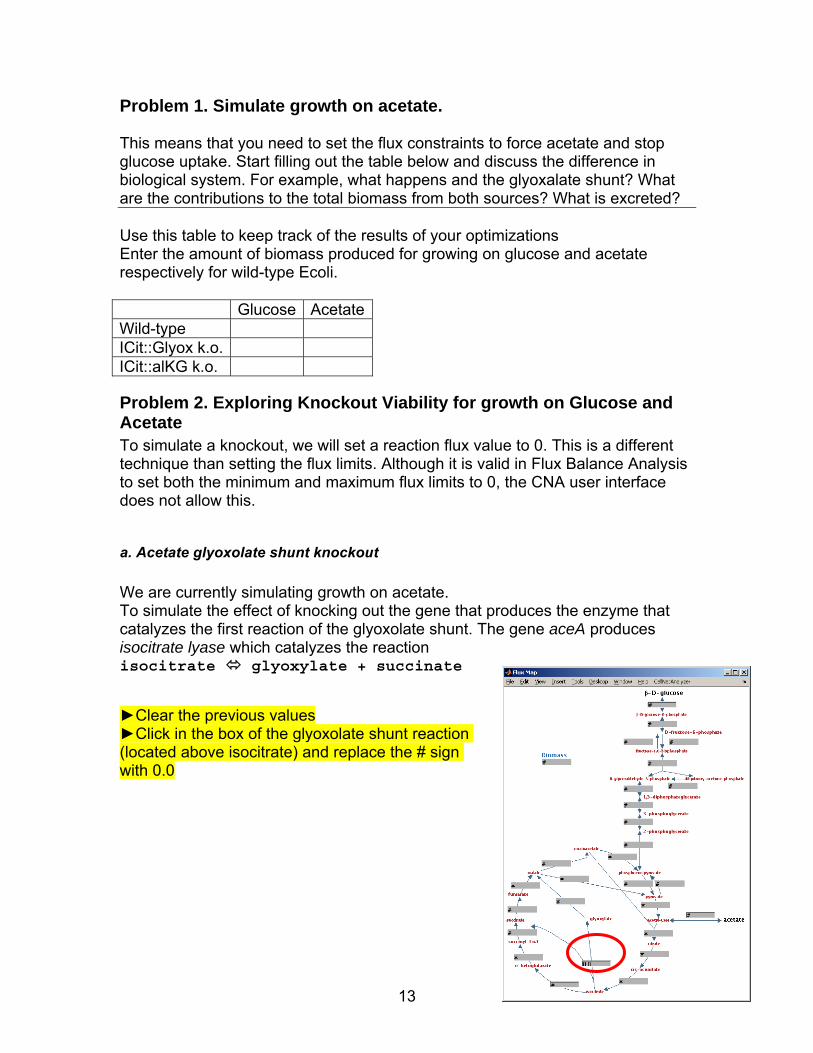
a. Acetate glyoxolate shunt knockout We are currently simulating growth on acetate. To simulate the effect of knocking out the gene that produces the enzyme that catalyzes the first reaction of the glyoxolate shunt. The gene aceA produces isocitrate lyase which catalyzes the reaction isocitrate glyoxylate + succinate ►Clear the previous values ►Click in the box of the glyoxolate shunt reaction (located above isocitrate) and replace the # sign with 0.0
14
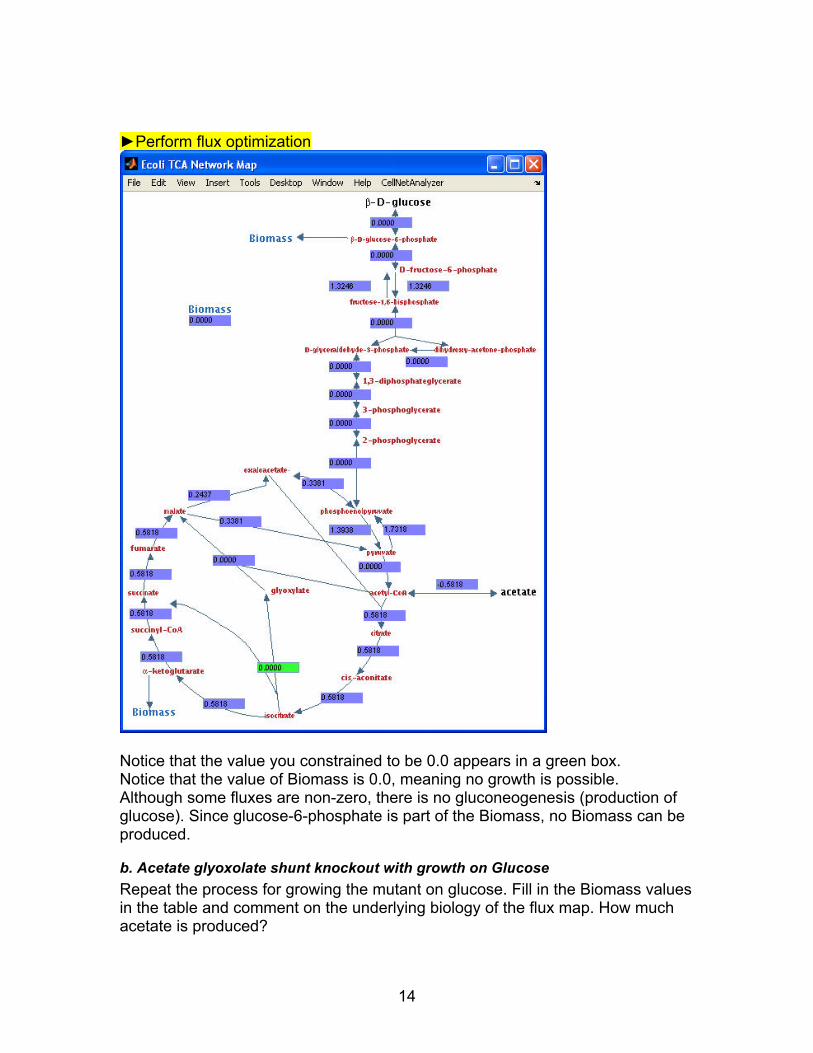
►Perform flux optimization
Notice that the value you constrained to be 0.0 appears in a green box. Notice that the value of Biomass is 0.0, meaning no growth is possible. Although some fluxes are non-zero, there is no gluconeogenesis (production of glucose). Since glucose-6-phosphate is part of the Biomass, no Biomass can be produced.
b. Acetate glyoxolate shunt knockout with growth on Glucose Repeat the process for growing the mutant on glucose. Fill in the Biomass values in the table and comment on the underlying biology of the flux map. How much acetate is produced?
15
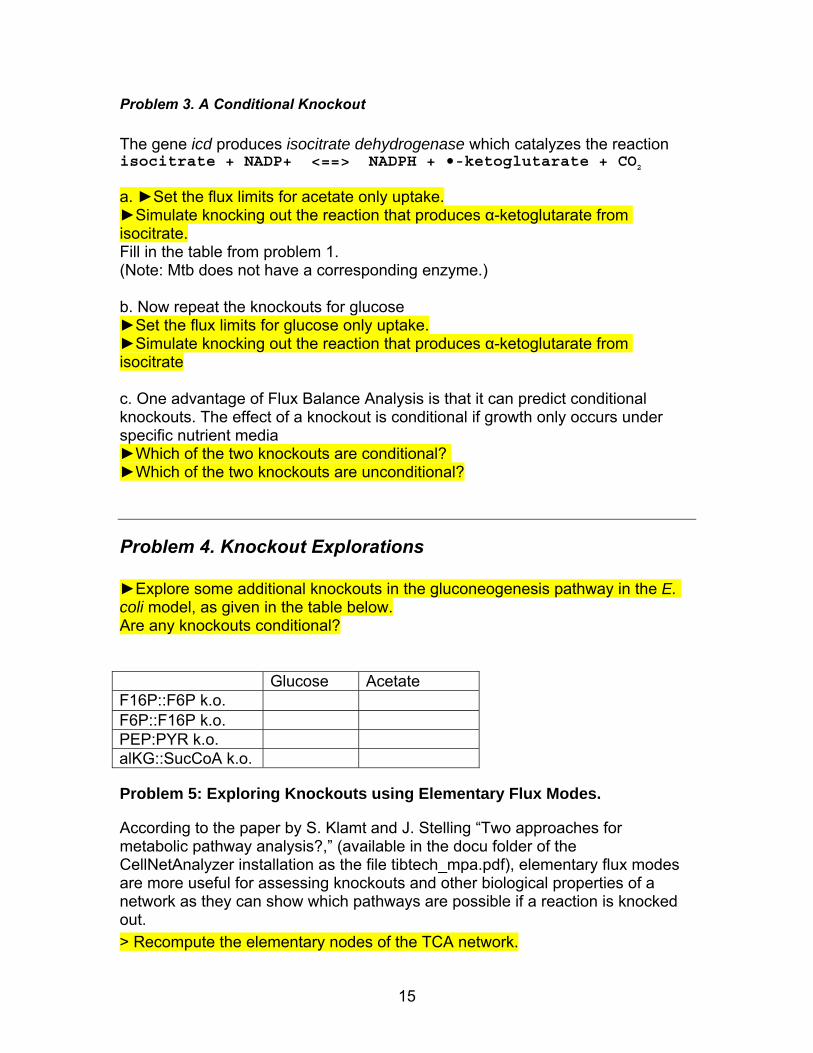
Problem 3. A Conditional Knockout The gene icd produces isocitrate dehydrogenase which catalyzes the reaction isocitrate + NADP+ <==> NADPH + •-ketoglutarate + CO2
a. ►Set the flux limits for acetate only uptake. ►Simulate knocking out the reaction that produces α-ketoglutarate from isocitrate. Fill in the table from problem 1. (Note: Mtb does not have a corresponding enzyme.) b. Now repeat the knockouts for glucose ►Set the flux limits for glucose only uptake. ►Simulate knocking out the reaction that produces α-ketoglutarate from isocitrate c. One advantage of Flux Balance Analysis is that it can predict conditional knockouts. The effect of a knockout is conditional if growth only occurs under specific nutrient media ►Which of the two knockouts are conditional? ►Which of the two knockouts are unconditional?
Problem 4. Knockout Explorations ►Explore some additional knockouts in the gluconeogenesis pathway in the E. coli model, as given in the table below. Are any knockouts conditional? Glucose Acetate F16P::F6P k.o. F6P::F16P k.o. PEP:PYR k.o. alKG::SucCoA k.o.
Problem 5: Exploring Knockouts using Elementary Flux Modes.
According to the paper by S. Klamt and J. Stelling “Two approaches for metabolic pathway analysis?,” (available in the docu folder of the CellNetAnalyzer installation as the file tibtech_mpa.pdf), elementary flux modes are more useful for assessing knockouts and other biological properties of a network as they can show which pathways are possible if a reaction is knocked out. > Recompute the elementary nodes of the TCA network.
16
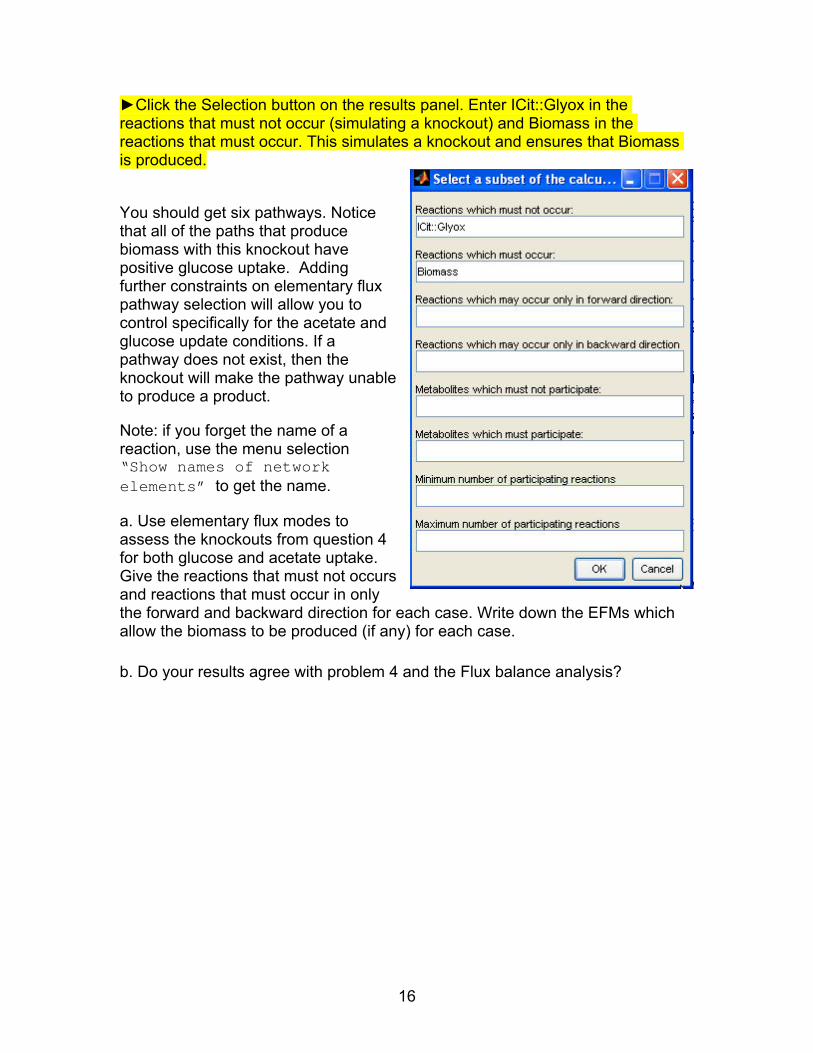
►Click the Selection button on the results panel. Enter ICit::Glyox in the reactions that must not occur (simulating a knockout) and Biomass in the reactions that must occur. This simulates a knockout and ensures that Biomass is produced.
You should get six pathways. Notice that all of the paths that produce biomass with this knockout have positive glucose uptake. Adding further constraints on elementary flux pathway selection will allow you to control specifically for the acetate and glucose update conditions. If a pathway does not exist, then the knockout will make the pathway unable to produce a product.
Note: if you forget the name of a reaction, use the menu selection “Show names of network elements” to get the name.
a. Use elementary flux modes to assess the knockouts from question 4 for both glucose and acetate uptake. Give the reactions that must not occurs and reactions that must occur in only the forward and backward direction for each case. Write down the EFMs which allow the biomass to be produced (if any) for each case. b. Do your results agree with problem 4 and the Flux balance analysis?

17
Problem 6. TB Mycolic Acid Model We will use a knockout to mimic the effect of isoniazid, an anti-TB agent, and explore the effect of other knockouts
About the model This is a more complex, realistic model from Raman K, Rajagopalan P, Chandra N: Flux balance analysis of mycolic Acid pathway: targets for anti-tubercular drugs. PLoS Comput Biol 2005, 1(5):e46. • Close current model. • Start a new model just as before, set the parameters as shown. • DO NOT run the elementary mode analysis with this model. It will either crash Matlab or terminate when too many modes are found. ►File• Close or just close Flux Map Window ►In the CNA Network Projects Window Select “New”, fill in the fields as shown, press Save as before.
Features of the Mycolic Acid Model • The inputs are AccB, biotin, coenzyme A, and apo-AcpM • The cycles in parts B and C of the picture are needed to build the long
carbon chained precursors of the mycolic acids
18
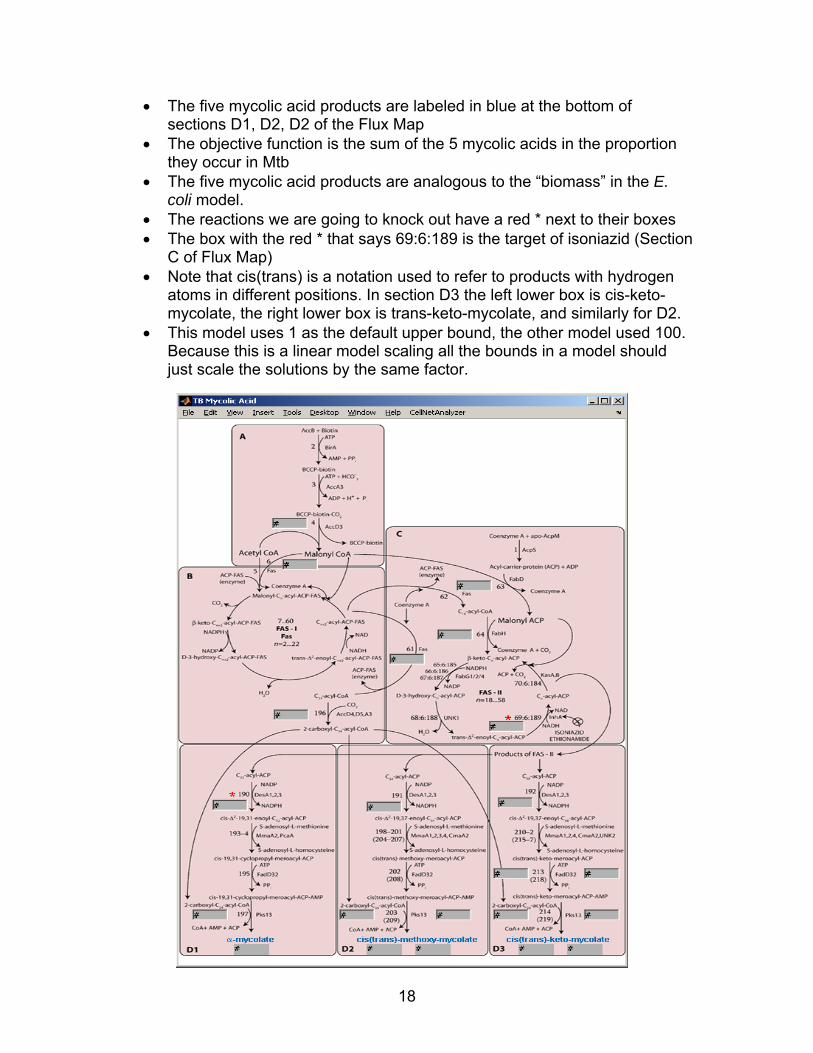
• The five mycolic acid products are labeled in blue at the bottom of sections D1, D2, D2 of the Flux Map
• The objective function is the sum of the 5 mycolic acids in the proportion they occur in Mtb
• The five mycolic acid products are analogous to the “biomass” in the E. coli model.
• The reactions we are going to knock out have a red * next to their boxes • The box with the red * that says 69:6:189 is the target of isoniazid (Section
C of Flux Map) • Note that cis(trans) is a notation used to refer to products with hydrogen
atoms in different positions. In section D3 the left lower box is cis-keto-mycolate, the right lower box is trans-keto-mycolate, and similarly for D2.
• This model uses 1 as the default upper bound, the other model used 100. Because this is a linear model scaling all the bounds in a model should just scale the solutions by the same factor.
19
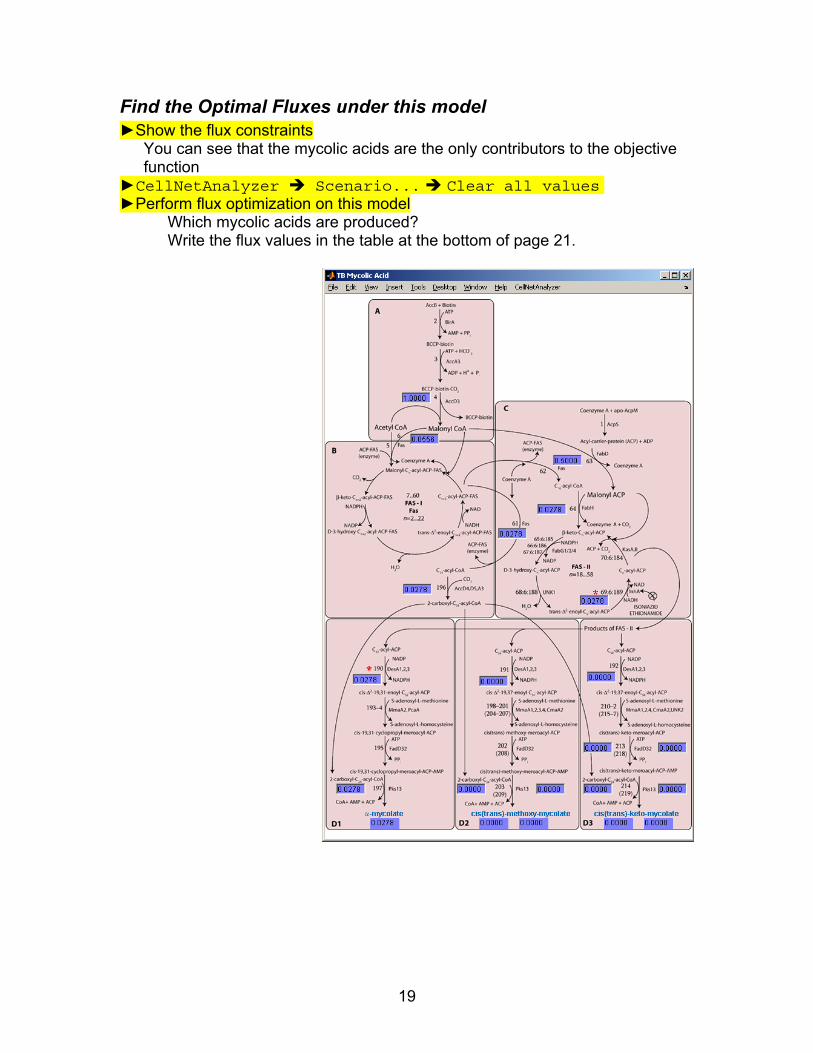
Find the Optimal Fluxes under this model ►Show the flux constraints
You can see that the mycolic acids are the only contributors to the objective function
►CellNetAnalyzer Scenario... Clear all values ►Perform flux optimization on this model Which mycolic acids are produced?
Write the flux values in the table at the bottom of page 21.
20
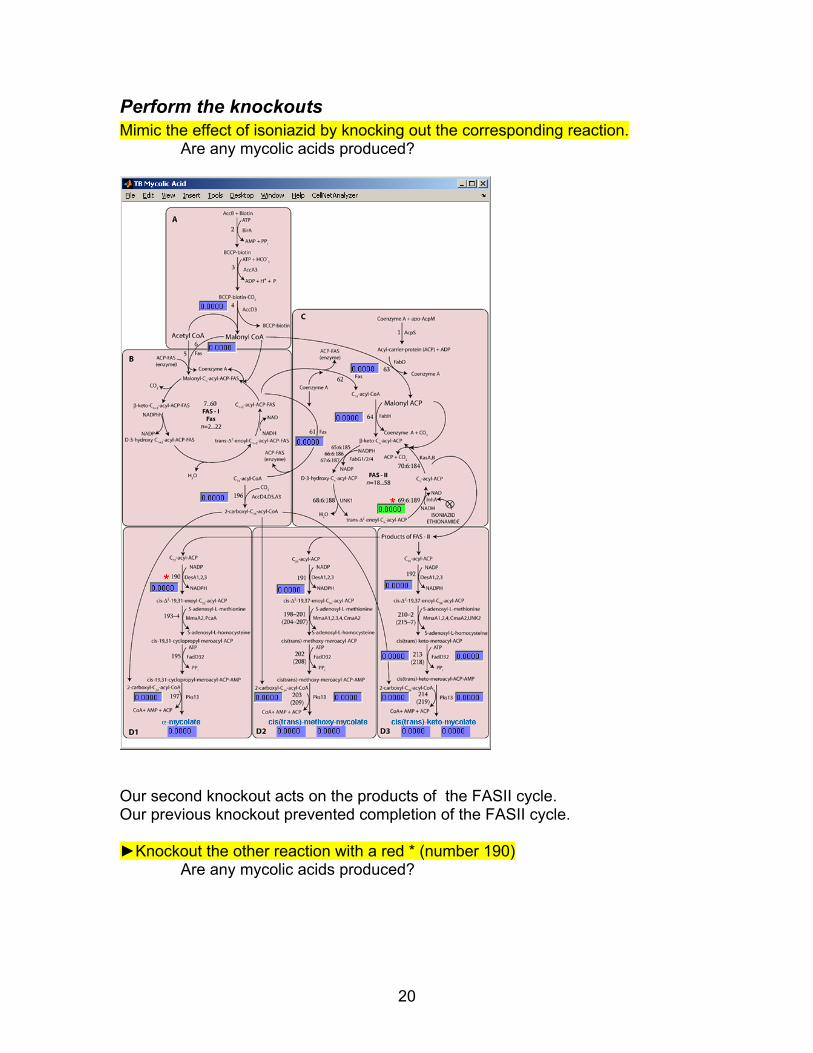
Perform the knockouts Mimic the effect of isoniazid by knocking out the corresponding reaction. Are any mycolic acids produced?
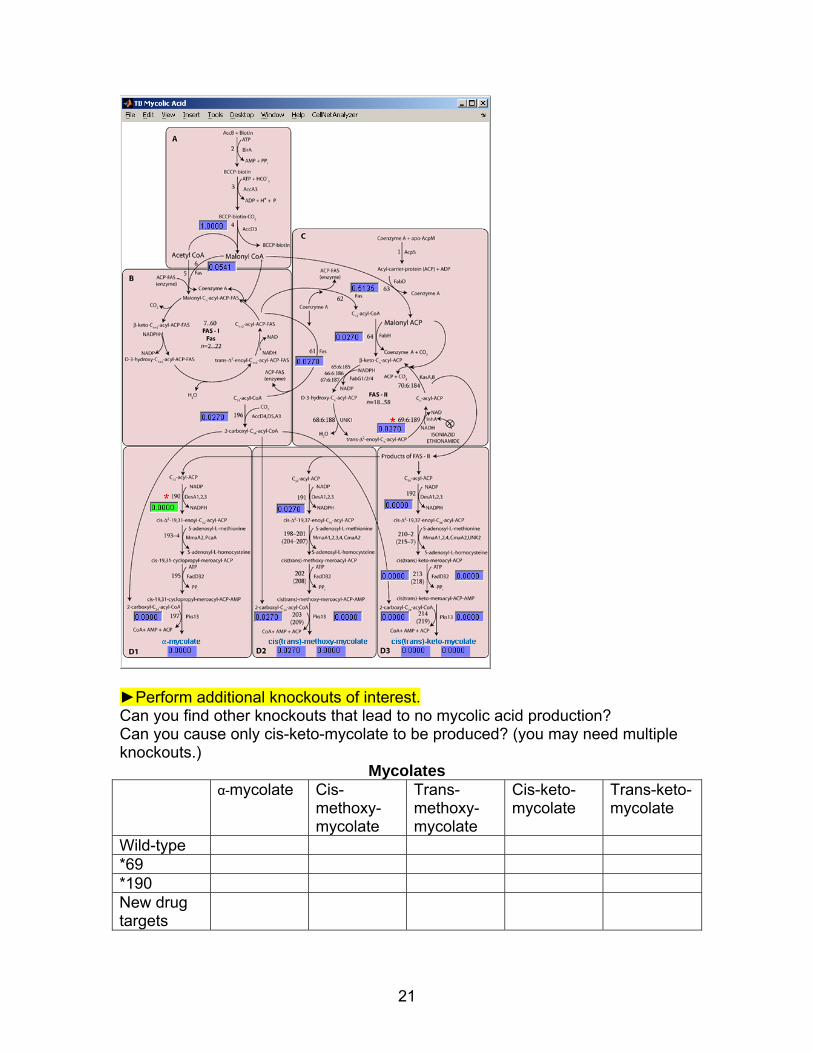
Our second knockout acts on the products of the FASII cycle. Our previous knockout prevented completion of the FASII cycle. ►Knockout the other reaction with a red * (number 190) Are any mycolic acids produced?
21
►Perform additional knockouts of interest. Can you find other knockouts that lead to no mycolic acid production? Can you cause only cis-keto-mycolate to be produced? (you may need multiple knockouts.)
Mycolates α-mycolate Cis-
methoxy-mycolate
Trans-methoxy-mycolate
Cis-keto-mycolate
Trans-keto-mycolate
Wild-type *69 *190 New drug targets