outline of consolidated results for the first half of ... · ・automobile sales 3.1 ......
TRANSCRIPT
Outline of Consolidated Results forthe First Half of FY2016(Year ending March 31, 2017)
1
November 4, 2016

Contents
1. Outline of Consolidated Results for the First Half of FY2016
2. Revision of Full-Year Consolidated Forecast for FY2016
3. Achieving Our Long-Term Business Plan
4. Supplementary Materials on Financial Results
5. Another Supplementary Materials
P.3
P.10
P.13
P.25
P.36
2

1. Outline of Consolidated Results for the First Half of FY2016
3

MetalsGlobal Parts & LogisticsAutomotiveMachinery, Energy & ProjectChemicals & ElectronicsFood & Consumer Services
▲14%▲614.7
Outline of Consolidated Results for the First Half of FY2016 (Net Sales) (Billion yen)
<Reasons for Y o Y Change in Net Sales>
Segments Change Main factors behind year -on-year change
Metals ▲123.8 Lower sales due to lower market price
Global Parts & Logistics ▲39.1
Lower sales due to forex effect despitehigher sales due to increase in automotivecomponents handled overseas
Automotive ▲84.3
Lower sales due to decrease in export byToyota Tsusho Corporation as well as decrease in trading volume handled by overseas auto dealership
Machinery, Energy& Project ▲161.3
Lower sales due to lower market value of petroleum and decrease in trading volume ofautomobile related facilities
Chemicals & Electronics ▲146.5 Lower sales due to decrease in trading
volume of electronics-related products
Food & ConsumerServices ※
▲59.8Lower sales due to decrease in trading volume of grain handled overseas
943.1
498.8
646.1
914.2
288.9
4,284
991.1
Y o Y
4
3,669.3
819.3
459.7
561.8
752.9
844.6
229.1
FY2015
1H
FY2016
1H
※ Effective April 1,2016,the Food & Agribusiness Division and the ConsumerProducts & Services Division have been integrated in the Food & Consumer Services Division. In line withthis, net sales and operating income forthe six months ended Sep. 30,2015have been recast to reflect this change.

MetalsGlobal Parts & LogisticsAutomotiveMachinery, Energy & ProjectChemicals & ElectronicsFood & Consumer Services
Outline of Consolidated Results for the First Half ofFY2016 (Operating Income)
19.7
11.2
15.7
10.1
4.1
66.4
11.2
▲11%▲7.2
Y o Y
5
14.2
7.7
12.0
7.8
16.6
4.4
59.2
FY2015
1H
FY2016
1H
<Reasons for Y o Y Change in Operating Income>
Segments Change Main factors behind year-on-year change
Metals ▲5.5Effect of lower market value and offsettingforeign exchange gains/losses included in non-operating category
Global Parts & Logistics ▲3.5 Offsetting foreign exchange gains/losses
included in non-operating category
Automotive ▲3.7
Lower operating income to decrease in export by Toyota Tsusho Corporation as well as decreasein trading volume handled by overseas auto dealership
Machinery, Energy & Project ▲2.3
Lower sales due to lower market value of petroleum products and decrease in trading volumeof automobile related facilities
Chemicals & Electronics 5.4 Increased due to effect of loss on valuation of
inventories in previous year
Food & consumerServices 0.3 Increased due to decrease in amortization of
Tomen Corporation merger goodwill
(Billion yen)

FY20151H
FY20161H
Forex Effect・ Forex translation
effect ▲6.9・ Offsetting forex
losses ▲11.5
Non-recurringFactors
Loss on valuation ofinventories from previous fiscal year +6.2・Aluminum premium +1.8 ▲20・Decrease in allowancefor doubtful receivablesin Venezuela +1.7
Completion ofMerger GoodwillAmortization・ Influence of mergergoodwill amortizationfrom previous fiscal year +7.2
Demand/TradingVolume, Others
・ Automobile sales ▲3.1・ Electric related
subsidiaries ▲2.6
Forex EffectNon-recurring
Factors▲18.4
+9.7
+7.2 ▲5.7
▲7.2
66.4
59.2
6
Reference: Toyota Automobile ProductionUnits: thousands FY2015 1H FY2016 1H Change
Japan 1,561 1,584 23
Overseas 2,872 2,917 45
Total 4,433 4,501 68
(Billion yen)
Reasons for Changes in First Half of FY2016 (Operating Income)
Completion ofMerger Goodwill
AmortizationDemand/TradingVolume, Others

2016/3上期
2017/3上期
2016/3上期
2017/3上期
2Q
1Q
+24%+16.1
7
【Ordinary Income】 +16.1Ordinary Income increased due to higher Share of profit of entitles accounted for using equity methodmainly in Metals division.【Net Income (Attributable to owners of the parent)】 +18.3Net income increased due to loss of cancellation of contract, decrease in loss on valuation of investment securities and investments in capital in which recorded in first half of FY2015.
213
189
+77%+18.3
Ordinary Income
Net incomeNet Income(Attributable to owners of the Parent)
82.566.4
42.0
23.7
35.4
39.131.0
43.3 10.8
12.9 21.3
20.6 2Q
1Q
FY20151H
FY20161H
FY2015 1H
FY20161H
(Billion yen)
Outline of Consolidated Results for FY2016 of 1H (Ordinary Income and Net Income Attributable to Owners of the Parent )

Long-term Liabilities
1,148.9
Long-term Liabilities
1,159.1
Balance Sheets
Mar. 31, 2016
CurrentAssets2,425.8
Fixed Assets1,526.2
Current Liabilities
1,737.1
Sep. 30, 2016
Fixed Assets1,413.2
Current Liabilities
1,562.1
Net Assets961.2
Mar. 31,2016
Sep. 30,2016 Change
Total Assets 3,952.1 3,672.3 ▲279.8
Net Worth 888.6 812.9 ▲75.7
Net Worth Ratio (%) 22 22 ▲0
Net Interest-bearing Debt 1,102.7 1,006.1 ▲96.6
Net DER (times) 1.24 1.24 ▲0
Current Ratio (%) 140 145 5
Net Assets1,055.7
8
CurrentAssets2,259.1
(Billion yen)

Net cash provided by operating activities 109.5
IBIT+DA 78.7Amortization expense 47.6Working capital 36.9
Cash Flows
73.0
▲94.1
Net cash provided by operating activitiesNet cash used in investing activitiesFree cash flow
Net cash provided by operating activities 73.0
IBIT+DA 51.3Amortization expense 56.0Working capital ▲3.8
FY2015 1H FY2016 1H
Net cash used in investing activities ▲94.1Automotive-related ▲31.4Grain business ▲27.5Electric power business ▲25.0Africa business ▲5.0
Net cash used in investing activities ▲40.3Automotive productions ▲10.3Automotive sales ▲7.4Electric power business ▲8.6Africa business ▲6.2
9
109.5
▲40.3
69.2
(Billion yen)
▲21.1

2. Revision of Full-Year ConsolidatedForecast for FY2016
10

11
Assumptions of Revised Full-Year ConsolidatedForecast for FY2016
Benchmark FY2015 ActualFY2016
originally planned
1H of the modification
Exchange rateYEN / USD 120 105 100
YEN / EUR 133 120 110
Toyota Motor’s
Automotive production
Units: million units
893 900
(Full year of the revised forecast)
918

FY2016 Revised Full-Year Forecast and Dividends
FY20161H Results
FY2016 Original Initial
Forecast
3,669.37,300.0Net sales
Operating income 59.2144.0
Ordinary income 82.5150.0
Net income(Attributable to
owners of the parent)42.070.0
(Billion yen)
Progress Rate from Revised Forecast (%)
50%
46%
55%
60%
12
FY2016 Revised Forecast
7,300.0
130.0
150.0
70.0
Revision
0.0
-14.0
0.0
0.0
Cash dividends per share (yen) 62 62 0.0
Revised operating income downward due to revision of assumed exchange rates and economic downturn in emerging countries. However the original forecast for net income is unchanged because of improvement in non-operating income.
Original Initial forecast for cash dividends per share is unchanged.

3. Achieving Our Long-Term Business Plan
13

14
Achieving Our Long-Term Business Plan: Core Domains and Africa Strategy
AfricaThree Domains
Life &Community
Resources &Environment
Mobility

Region 2016 2027 Change
North America 21.25 22.18 4%
Europe 16.46 17.50 6%
China 25.20 32.78 30%
Asia & Oceania 4.46 5.48 23%
India 3.60 5.26 46%
Africa 1.39 1.83 32%
South America 4.42 5.85 32%
Global 90.53 106.98 18%
15
MobilityGlobal Automotive Sales Forecast and TTC Automotive Trends
Automotive Sales Forecast (Million units)
Source: FOURIN, “Automotive Industry Yearbook 2016”
Mobility
Automotive Production Automotive Sales
• Exhaust regulations• Fuel economy
regulations• Weight reduction• New autonomous
driving technologies
• Various Changes in car ownership styles.(car sharing, etc.)⇒ Difficulty increase in
car ownership
• Increased demand for conventional cars
• Increased desire to purchase automotive due to growing middle class
Developed C
ountriesEm
erging Countries
• Enhanced automotive lineup

16
Mobility
Increase in production of conventional cars
Establish low-cost operations
Technology is advancing rapidly in the automotive industry.
• More powerful automotive electronics• Established NEXTY Electronics Corp.• Developed vehicle software with Denso Corp.• Operating data analysis (vehicle platoon
verification)
Improved functions and proposal capabilities Expand other auto
makes
Response to Environment Autonomous Driving, Computerization & Electronics
• New Suzuki plant in Gujarat (250 thousand units)• New Toyota Mexico plant (190 thousand units)
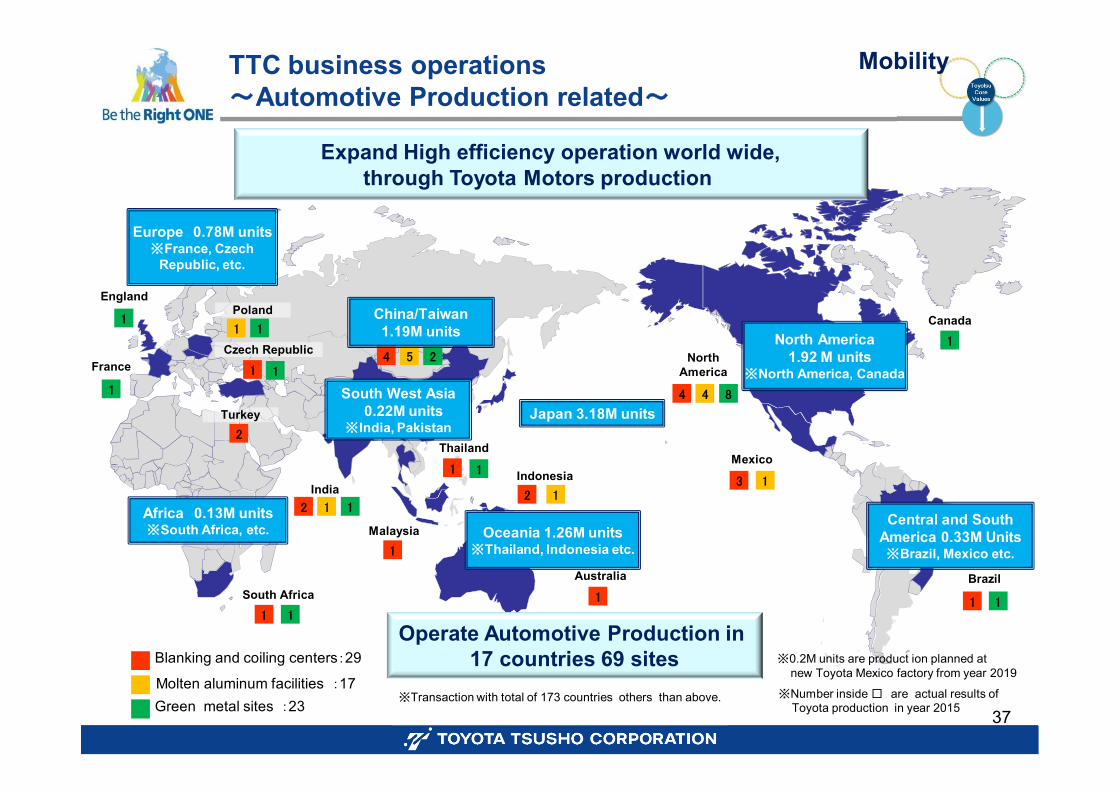
Operates automotive production business with 69 bases in 17 countries.
ToyotsuCore Values
ToyotsuCore Values
Measures in Response to AutomotiveProduction Trends
• Develop and consistently supply lithium• Produce hydrogen and develop infrastructure • Develop new materials: carbon fiber recycling

17
Mobility
Incorporatecustomer needs from sales outside the Group
Aged vehicles,imported used
vehicles
Cycle created from Toyota-Tsusho Group’s sales network
New & used vehicles
ToyotsuCore Values
Return flow
Measures in Response to Automotive Sales Trends
Develop the distributor and dealership businesses, concentrate on next-generation vehicles and create related service businesses
Operations in 84 countries (distributors in 68 countries, dealers in 22 countries)
Small-scale production
Proprietary Sales
Non-proprietary Sales
Services
Used Vehicles
Parts
Parts
Finance and
Insurance
Finance and
Insurance Parts
Services Services
Trade-ins
Usedvehicles
New vehicles
Usedvehicles
Accessories Accessories

ToyotsuCore
Values18
ToyotsuCore
Values
Strategy in Electronics Business
Platoon demonstration of autonomous driving truck
Development, design, and validation for Powertrain controlsystems and Software Joint development
with Denso Corp.
Received R&D and demonstration projects publicly tendered by the Ministry of Economy, Trade and Industry
Established NEXTY Electronics Corporation
Expand products -lineup
Differentiate by enhancing quality and technological capabilities
Contributes to creating a safe and secure energy-savingsociety
Development & improvement of automotive software incorporated
in semiconductors
18
Life & Community
Launched as No.1 global Automotive electronics company

19
ToyotsuCore
Values
Japan: Further expand the wind power business Overseas: Accelerate expansion of wind and solar power business Structure a business strategy to address amended feed-in tariff
scheme and electricity market liberalization
19
Resource & Environment
Renewable energy
Contribute to a sustainable global society by supplyingelectric power
Establish and expand a stable earnings base by building a strong
asset portfolioPower generation business
in N. America4,155MW
Power generation business
in Asia1,911MWThermal
power
Eurus Energy2,854MW
No. 1 share of wind power business in Japan In-house development, construction and
operation Ability to create projects, including funding
Expansion in Electric Power Business

(U.S. dollars)
Sources: World Bank, “Annual Report 2016” and African Development Bank Group, “Africa in 50 Years Time 2011”
Increase in personal
consumption
(%)
Growth Potential in Africa
20
Increase in national income
Increase in middle class
Per Capital Gross National Income in Africa Trend in Africa’s Emerging Middle Class
Africa
Spending: Middle class – Over USD 4 ; Poverty – USD 1.25-2.0 Extreme poverty – Under USD 1.25
504
1,280
1,627
0
200
400
600
800
1,000
1,200
1,400
1,600
1,800
2000 2010 2011~2015
44.15 42.25
40.01
37.77 35.52 33.28
16.70 17.71 17.31 16.90 16.50 16.09
34.32 33.44 35.60
37.76 39.91 42.07
0
10
20
30
40
50
2010 2020 2030 2040 2050 2060
Extreme poverty Poverty Middle class
Z
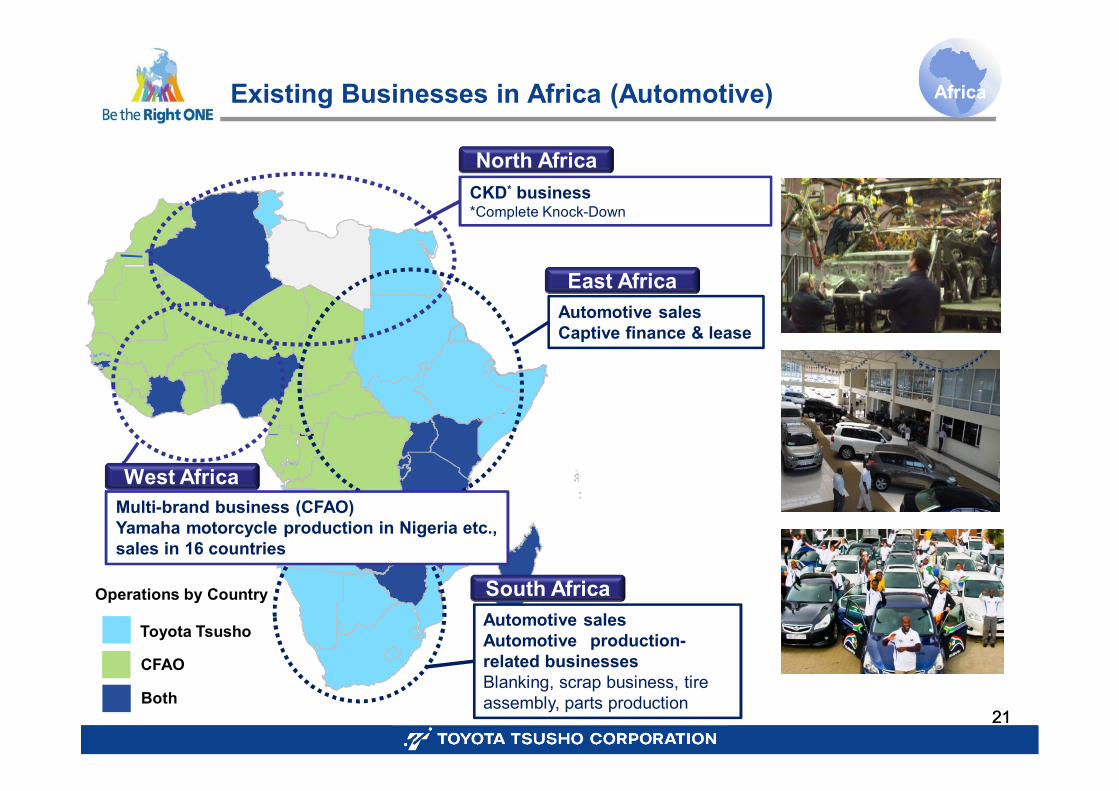
Existing Businesses in Africa (Automotive)
CKD* business*Complete Knock-Down
Automotive salesCaptive finance & lease
Automotive salesAutomotive production-related businessesBlanking, scrap business, tire assembly, parts production
Multi-brand business (CFAO)Yamaha motorcycle production in Nigeria etc., sales in 16 countries
CFAO
Toyota Tsusho
Both2121
Africa
South Africa
East Africa
North Africa
West Africa
Operations by Country

East Africa
North Africa
South Africa
West Africa
Existing Businesses in Africa (Non-Automotive)
2222
Africa
Offshore gas field drilling and rig chartering businessesElectric Power EPC
Geothermal power businessPort of Mombasa development & crane PJAgriculture & construction equipment salesChemicals (fertilizer)
Prepare land to grow, process and sell guar beans (Zambia)
Pharmaceutical salesHeineken beer production & salesPlastic product manufacturing & salesL'Oréal product manufacturing & salesMakita product sales
CFAO
Toyota Tsusho
Both

23
Take on New Challenges in African Markets
CFAO StrengthsToyota Tsusho Strengths Automobile
distributor business
Power & infrastructure businesses
Retail business FMCG production Pharmaceutical
business New automotive sales
Africa
Retail related Heineken beer
production and sales (cross development)
e-commerce business
(Rwanda)◎ Traffic congestion system verification
test (Kenya)◎ Kenya Vision 2030 extended
collaboration◎ Fertilizer production and sales◎ Medical businesses using ICT
Investment in companies◎ Nairobi Airport New Terminal◎ Geothermal power area development (Ethiopia)◎ Geothermal power area development◎ Textile machinery industry development
◎ TICAD MOU.
Become a leading company in Africa through synergy
Expand automotive sales network and services (improvement and safety)
Strengthen direct sales by centralizing inventory
Build automotive-related businesses
◎ Establish an integrated transport company for completed automobiles with Bollore of France and Nippon Yusen
CKD production with Yamaha
Mobility Domain
シナジーSynergy

Strengthen our earnings foundation and take on challenges in three domains
Automotive electronics and power generation businessesExpanded in markets where we can leverage our strengths
Created new businesses in Africa
Increase returns on investment by rigorously employing quantitative benchmarks
Selectivity driven by rigorous internal investment criteria
Promoted scrap and build in existing projects
Strengthen cash flow management
Reduced working capital employed (improved operating cash flow)
Kept investment within the cash flow of each operating division
Investment Policy
Financial Policy
Achieving Our Long-Term Business Plan
Management Strategy
24
The First Half of FY2016 in Retrospect
4. Supplementary Materials on Financial Results
25
FY20151H
FY20161H
14.2
▲6.0
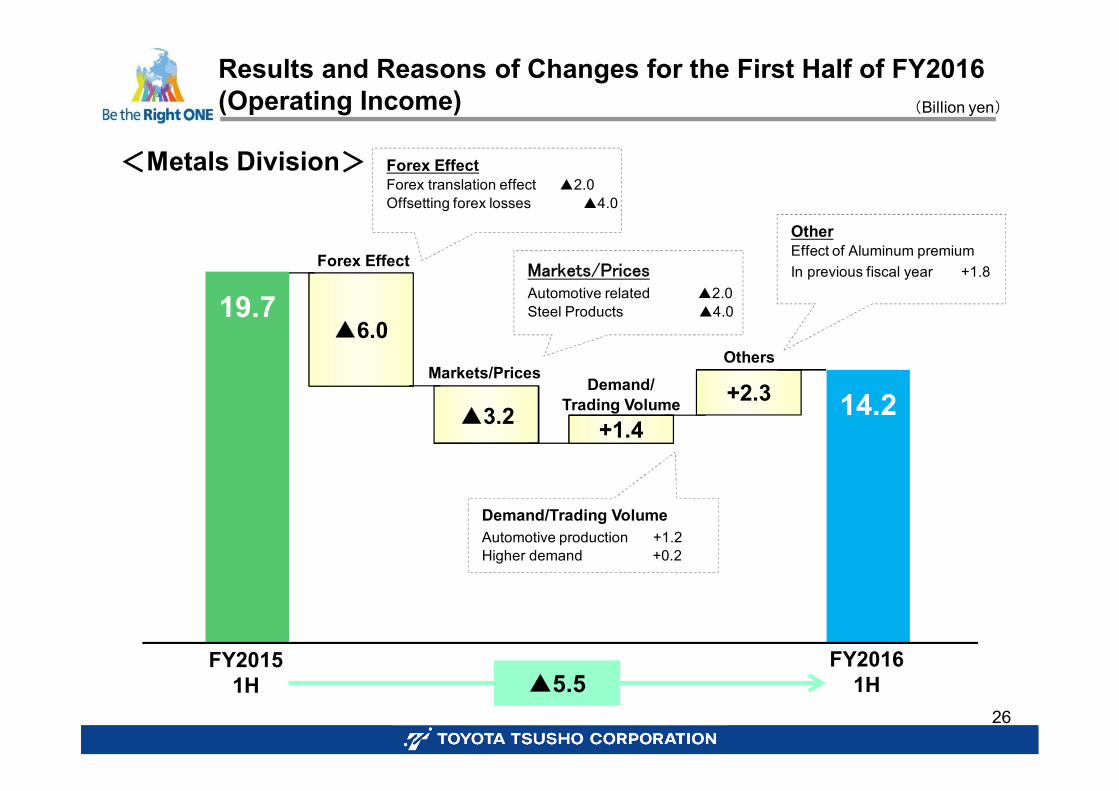
Results and Reasons of Changes for the First Half of FY2016(Operating Income)
Forex Effect
Demand/Trading Volume +2.3
Markets/PricesOthers
Forex EffectForex translation effect ▲2.0Offsetting forex losses ▲4.0
OtherEffect of Aluminum premium In previous fiscal year +1.8
<Metals Division>
Demand/Trading VolumeAutomotive production +1.2Higher demand +0.2
▲3.2
19.7
▲5.526
+1.4
(Billion yen)
Markets/PricesAutomotive related ▲2.0Steel Products ▲4.0

FY20151H
FY20161H
▲5.5
Forex EffectAllowance for DoubtfulReceivables
Forex EffectForex translation effect ▲1.5Offsetting forex losses ▲4.0
<Global Parts & Logistics Division>
+1.6
Demand/Trading Volume
+0.4
Allowance for Doubtful ReceivablesReceivable in Venezuela +0.4
▲3.527
11.2
7.7
(Billion yen)
Results and Reasons of Changes for the First Half of FY2016(Operating Income)

▲3.1
Forex EffectDemand/
Trading Volume Completion ofMerger Goodwill
AmortizationOthers
Forex EffectForex translation effect ▲2.5
Other
Angola functional currency change +1.2Newly consolidatedSubsidiaries +0.1
<Automotive Division>
Allowance for Doubtful ReceivablesReceivable in Venezuela +1.0Others ▲0.6
Demand/Trading VolumeRetails (CFAO・Africa・South Pacific Regions, etc.) ▲2.1Exports ▲1.0
+1.3Allowancefor DoubtfulReceivables
+0.4
▲2.5
+0.2 12.0
▲3.728
15.7
FY20151H
FY20161H
(Billion yen)
Results and Reasons of Changes for the First Half of FY2016(Operating Income)

▲1.1
Forex Effect
Demand/Trading Volume Others
Forex EffectForex translation effect ▲0.2Offsetting forex losses ▲2.0
Demand/Trading VolumeRenewable energy +2.5Automotive machinery ▲2.7Petroleum Products ▲1.3
<Machinery, Energy & Project Division>
7.8
Completion ofMerger Goodwill
Amortization
▲2.329
+0.2
10.1 ▲2.2
+0.8
(Billion yen)
FY20151H
FY20161H
Results and Reasons of Changes for the First Half of FY2016(Operating Income)
OtherAllowance for Doubtful
Receivable in Venezuela +0.1

Markets/Prices
▲3.0
Forex Effect
+6.6
Fiscal PeriodAlignment
OthersForex EffectForex translation effect ▲1.0Offsetting forex losses ▲2.0
OthersLoss on valuation of inventories in pervious year
+6.2
<Chemicals & Electronics Division>
Fiscal Period AlignmentAlignment of Elematec infiscal period ▲0.3
Demand/Trading VolumeElectronic subsidiaries ▲2.6Toyotsu Chemiplas Corp. etc. +1.2
Demand/Trading Volume
+3.8
Completion ofMerger Goodwill
Amortization
+5.430
▲0.3▲0.3▲1.4
11.2
16.6
(Billion yen)
FY20151H
FY20161H
Results and Reasons of Changes for the First Half of FY2016(Operating Income)

▲2.6
Forex EffectDemand/
Trading Volume Others
Forex EffectForex translation effect ▲0.3Offsetting forex losses +0.5
OthersM&A-related expenses in pervious year +0.4
< Food & Consumer Services Division >
Markets/Prices
+0.2
Completion ofMerger Goodwill
Amortization
4.4
+0.3
4.1
31
+2.0
+0.3
+0.4
(Billion yen)
FY20151H
FY20161H
Results and Reasons of Changes for the First Half of FY2016(Operating Income)
Demand/Trading Volumedecrease in trading volume ofgrain handled overseas

CFAO Financial Results (Net Income)
Business CategoryFY 2015 FY 2016 1 Half
Change1Q 2Q 1 Half 1Q 2Q 1 Half
Equipment&
services
Automotive,Equipment &
Services846.4 837.4 ▲9.0
Technologies 32.9 39.0 6.1
Sub-total 437.0 442.4 879.4 417.3 459.0 876.3 ▲3.1
Healthcare Healthcare 323.4 305.0 628.5 321.0 316.7 637.7 9.2
ConsumerGoods
Beverages 110.2 104.1 ▲6.1
Food, Hygiene & Convenience 58.1 38.7 ▲19.4
Retail 0.0 17.2 17.2
Sub-total 84.6 83.8 168.3 83.6 76.6 160.2 ▲8.1
Total 845.0 831.2 1,676.2 822.0 852.2 1,674.2 ▲2.0
32
(Million euros)

33
CFAO Results (Operating Income & Net Income)
Business 2015 1H 2016 1H YoY Reasons for YoY Change
Equipment&
services60.4 55.6 -4.8
Maghreb
• Market contraction & import regulations (Algeria)
• Terminate of Isuzu distribution• Reduced product competitiveness of GM cars
West Africa
• Mixed results – strong countries / weak countries (mainly resource producing countries)
• Reduced profitability due to continuous strong yen
EastAfrica
• Weaker economies• VW sales trended downward
Over-
seas • Strength in Vietnam
Healthcare 48.7 49.5 +0.8
Consumergoods 26.4 8.2 -18.2
• Beer business (intensified competition in Congo, increase in new plant construction costs in Ivory Coast)
• Retail business (new store opening costs)
Holding -15.7 -13.3 +2.4
Operating income 119.9 100.0 -19.9
(Million euros)
Net income 43.1 36.9 -6.2

Solar and wind power business(Eurus)
Progress of Investment Plan
Mobility Develop dealer network(CFAO, etc.) Production-related facilities
in North America
Resources &Environment
Investment through the First Half of FY2016
Main Projects Amount
Cash generated by asset sales, etc.
Cash used for investment
計 615Life & Community
Pharmaceutical retail business(CFAO)
34
(Billion yen)
1Q ▲12.92Q ▲11.8
▲24.7
1Q ▲5.12Q ▲10.4
▲15.5
1Q ▲4.32Q ▲4.9
▲9.2
▲49.4
9.0
▲40.4

Metal
Global Parts & Logistics
Automotive
Machinery, Energy & Project
Chemicals & Electronics
Food & Consumer
▲10%▲14.0
Revision of forecast for the Fiscal Year Ending March 2017 (Operating Income)
<Main reasons for downward revision in operatingincome >
Segments Change Main factors
Metal ▲6.5 Forex effect / Lower market value of the Nonferrous metals business
Global Parts & Logistics ▲2.5 Forex effect
Automotive ▲5.0 Market down turn emerging nations
Machinery, Energy & Project
▲4.0 decrease in trading volume of automotivemachinery
Chemicals & Electronics 0 As Original plan
Food & ConsumerServices
▲1.0 Due to down turn of beverage business
40.0
20.0
26.0
23.0
10.0
144.0
35.0
FY2016Original Plan
FY2016Revision of Plan
Original Plan Ratio
35
130.0
33.5
17.5
21.0
19.0
35.0
9.0
(Billion yen)

4. Another Supplementary Materials
36
※Transaction with total of 173 countries others than above.
TTC business operations~Automotive Production related~
37
Mobility
Blanking and coiling centers:29
Molten aluminum facilities :17Green metal sites :23
England
France
Poland
Czech Republic
Turkey
India
Malaysia
South Africa
Thailand
Indonesia
Australia
China
NorthAmerica
Mexico
Canada
Brazil
1
111
1 1
2
1
1
1
1 1
1 1
2 13 1
1 1
4 4 8
2 1 1
4 5 2
Europe 0.78M units※France, Czech
Republic, etc.
Africa 0.13M units※South Africa, etc. Oceania 1.26M units
※Thailand, Indonesia etc.
China/Taiwan1.19M units North America
1.92 M units※North America, Canada
Japan 3.18M units
Central and South America 0.33M Units※Brazil, Mexico etc.
South West Asia0.22M units
※India, Pakistan
※Number inside □ are actual results of Toyota production in year 2015
※0.2M units are product ion planned atnew Toyota Mexico factory from year 2019
Expand High efficiency operation world wide,through Toyota Motors production
Operate Automotive Production in 17 countries 69 sites

countries in operational presence (84)
※In addition to above, business contacts exist in 173 countries in total
Established regional headquarters worldwide to expand new markets and sales network
Caribbean(TTAI)
Oceania(TTSPH)
East Africa(TTEA)
West Africa(CFAO)
Middle East(TAME)
China(TTCC)
Japan(TTC)
Distributor(addition with dealer included )
68 countries
Dealer 22 countries
South Africa(TTAF)
38
Mobility
Asia(TTAP)
Regional head quarters
Sub-regional management bases
TTC business operations ~Automotive sales related~

About NEXTY Electronics Corporation
・Semiconductors,Electronics components・Development of embedded software
・Planning and developing information technology infrastructure・ autonomous car・Telematics・ ITS
Toyota Tsusho
Investment ratio50.1%
Investment ratio57%
Corporatename NEXTY Electronics Corporation
Establishment April 1, 2017
Paid in Capital 5.611 billion yen
Head Offices Tokyo and Nagoya, Japan
RepresentativeDirector
Representative Director and ChairmanTakashi IshibashiRepresentative Director and PresidentAtsushi Aoki
Services and Products
・Semiconductors, Sales of electronicsproducts ・Development of embedded software・Development of own products etc.
Revenue approx. 460.0 billion yen
Number of employees Consolidated: approx. 2,000
Offices Domestic 11sites, Overseas 34 sites
New company nameNEXTY Electronics Corporation
TomenElectronics
Toyota TsushoElectronics
Toyota TsushoOverseas subsidiary
Device Division
TomenDevices(TSE) 1st Section
Elematic(TSE) 1st Section
Chemical and Electronics
Division
ICT SolutionSBU
Electronics DeviceSBU
39
Life & Community
Electronics business (approx.1trillion yen)

Electric Power Business
Project Country Year of Operation Capacity(MW) Investment
Ratio(%) Fuel
Oyster Creek U.S.A 1994 440 50.0 Natural Gas
Goreway CANADA 2009 875 50.0 Natural Gas
Shore U.S.A 2016 720 31.25 Natural Gas
St. Charles (under construction) U.S.A 2017 (Plans) 720 25.0 Natural Gas
Salem Harbor (under construction) U.S.A 2017(Plans) 700 12.5 Natural Gas
St. Joseph (under construction) U.S.A 2018(Plans) 700 20.0 Natural Gas
Total in North America 4,155
Philippine (Western Midanao, Southern Philippines, Sarangani) - Existing 260 -
Heavy oil / coal
Pakistan (Kohinoor, Gul Ahmed) - Existing 251 - Heavy oil
Thailand (Ratchaburi) - Existing 1,400 - Natural Gas
Total in Asia 1,911
Japan Asia / Oceania U.S.A. Europe Total
In Operation Wind Power 648 228 666 864 2,406
Solar Power 237 4 45 - 286
Under Construction
Wind Power 124 - - - 124
Solar Power 10 - 28 - 38
Total 1,019 232 739 864 2,854
North America / Asia electric power
Eurus Energy
40

© 2013
Inquiries:
Investor Relations Group
E-mail [email protected]
Tokyo Head Office
TEL +81-3-4306-8201
FAX +81-3-4306-8818
◆ This presentation contains “forward-looking statements” about the strategies and plans of Toyota Tsusho Corporation and its Groupcompanies that are not historical facts. These forward-looking statements are subject to a number of risks and uncertainties that couldcause the Group’s actual or implied operating environment, performance, results, financial position, etc. to differ materially from theinformation presented here, which is based on assumptions and beliefs in light of information currently available to the management atthe time of publication. The Group assumes no obligation to update or correct these forward-looking statements.
◆ This presentation is not intended to solicit, offer, sell or market securities, and should not be the sole basis for making investment andother decisions.
41