out-of-the-money ceos: private control premium and option
TRANSCRIPT

Out-of-the-Money CEOs: Private ControlPremium and Option Exercises
Vyacheslav FosCarroll School of Management, Boston College, USA
Wei JiangGraduate School of Business, Columbia University, USA
When a proxy contest is looming, the rate at which CEOs exercise options to sell (hold) theresulting shares slows down by 80% (accelerates by 60%), consistent with their desire tomaintain or strengthen voting rights when facing challenges. Such deviations are closelyaligned with features unique to proxy contests, such as the record dates and nominationstatus, and are more pronounced when the private benefits are higher or when the votingrights are more crucial. The distortions suggest that incumbents value their stocks higherthan the market price when voting rights are valuable for defending control. (JEL G32,G34, G38)
Received June 3, 2014; accepted August 11, 2015 by Editor David Denis.
On August 13, 2010, Leonard Riggio, Chairman of the Board and former CEOof the NewYork-based bookseller Barnes & Noble, Inc. (ticker: BKS) exercisedhis option to acquire 990,740 shares at a price of $16.96 a piece. The stock’sclosing price on that day was $14.46, and the daily high was $15.00. That is,Riggio paid a premium of at least $1.96 for each share, or 13.1% over the thenmarket value, for the purchase. Moreover, the expiration date of this optionpackage was 8 months away. Why? Apparently the company was facing aproxy battle from Ronald Burkle, an activist investor. Riggio was one of the
We have benefited from discussions with Patrick Bolton, Darrell Duffie, Gur Huberman, Robert Jackson, DirkJenter, Oguzhan Karakas, Jonathan Milian, Josh Mitts, Kevin Murphy, Lalitha Naveen, Suresh Sundaresen, andseminar/conference participants at Booth, Boston College, Cambridge, Cass, Columbia, Indiana, Irvine, Iowa,Maryland, Oxford, Rice, Stanford, Stern, UIUC, Wharton, the AFA, the ASU Winter Finance conference, the7th Annual Academic Conference on Corporate Governance (at LeBow College of Business), and the NBERLaw and Economics Conference. We thank David Denis (Editor) and an anonymous referee for detailed andconstructive comments and guidance. We are grateful to Nicholas Panos from the SEC for educating us on theinstitutional details related to this study. We also thank Joseph Abadi, Like Chen, Danning Du, Ye Li, Yujia Liu,and Fanyu Que for excellent research assistantship. Wei Jiang acknowledges financial support from ColumbiaBusiness School in the form of regular faculty research funding and faculty summer research support. VyacheslavFos acknowledges financial support from University of Illinois and Boston College in the form of regular facultyresearch funding and faculty summer research support. Such research support does not affect the views expressedin the paper. Supplementary data can be found on The Review of Financial Studies web site. Send correspondenceto Wei Jiang, Graduate School of Business, Columbia University, 3022 Broadway, Uris Hall 803, New York, NY10027; telephone: (212)854-9002. E-mail: [email protected].
© The Author 2015. Published by Oxford University Press on behalf of The Society for Financial Studies.All rights reserved. For Permissions, please e-mail: [email protected]:10.1093/rfs/hhv068 Advance Access publication November 14, 2015
at Colum
bia University L
ibraries on June 27, 2016http://rfs.oxfordjournals.org/
Dow
nloaded from

The Review of Financial Studies / v 29 n 6 2016
current directors up for reelection, and the extra 1.7% of the votes could matterin proxy contest that everyone anticipated to be close.1
The anecdote exposes an intriguing phenomenon: The option-exercisebehavior of CEOs (or other insiders with control power) could be affected by adesire to maintain control, which in turn reflects a “private control premium.”Such a premium is broadly defined as the incremental value of shares to aninsider relative to the value public investors assign to the shares when theshares carry the voting rights needed to reinforce control. Based on Riggio’saction, we can infer that his willingness to pay (i.e., his private valuation) forthe marginal share was at least $16.96, whereas the market valued the stockno more than $15.00 on that day, and around $15.00 in the following days,presumably after digesting the public disclosure of Riggio’s share acquisition.Therefore, the 13.1% premium Riggio paid over the market price reflects thelower bound of the valuation wedge between an insider and public investors.
The case described above might appear extreme, but it exemplifies howchallenges to control distort insiders’ option-exercise behavior because theydrive a spread between the firm’s valuation to insiders and outsiders. A proxycontest reveals that at least some shareholders consider the incumbent CEOsor directors to be “out of the money (OTM)” (i.e., their value to the firm islower than what they cost the firm). As such, the OTM CEOs may exercisevested options (including in-the-money options) in a way that differs fromwhat the benchmark models that do not account for a private control premiumwould predict. The emergence of a proxy contest, usually after more moderateand negotiations-based forms of activism failed to accomplish a resolution,indicates that the voting powers of the two opponents are similar ex ante. Hence,changes in insider ownership via option exercises are, a priori, a meaningfulsupplement to other tactics the incumbents deploy to enhance voting power orto influence voting outcomes.
Indeed, after controlling for the standard variables that prior literature hasshown to affect early exercises of insider options, we find that the presence ofproxy contests reduces the frequency of exercise-and-sell transactions by 80%,and increases the frequency of exercise-and-hold transactions by about 60%.These phenomena represent two sides of the same coin: Because she valuesthe shares higher than the market, an insider is less willing to sell shares at themarket price, keeping other motives such as liquidity needs and diversificationconstant. On the other side, the insider is more likely to exercise the optionwith the intention to hold the shares because the voting rights are equivalent toa lumpy dividend. If the difference in valuation is high enough, an insider mayeven exercise options that are OTM relative to the market price (but presumablystill in-the-money relative to his private valuation), as Riggio did, if there areno easier ways to acquire the shares promptly.
1 Riggio held a 29.9% stake in the company, including vested options; Burkle was the second largest shareholderwith a 19.2% stake.
1550
at Colum
bia University L
ibraries on June 27, 2016http://rfs.oxfordjournals.org/
Dow
nloaded from

Out-of-the-Money CEOs: Private Control Premium and Option Exercises
A battery of tests affirm the connection between proxy contests andabnormalities in CEO exercise behavior. First, we show that the demonstrateddeviations from normal exercises are indeed driven by circumstances(i.e., proxy contests) rather than by unobserved firm or CEO characteristics(such as CEO overconfidence2).
Next, we explore within- and cross-firm heterogeneity based on twopredetermined (and hence exogenous) institutional arrangements that areunique to the proxy process: the record date (the date used to determine whichshareholders are entitled to voting rights) and the term of a staggered board.First, we show that deceleration (acceleration) of exercise and sell (exerciseand hold) is more pronounced before the first record date of a proxy season.Moreover, the unusually high rates of exercise and hold by CEOs stop mostlyat the record date, while the unusually low rates of exercise and sell continuebeyond that point but in decreasing magnitude until resolution. Thus, CEOsattempt to gain additional votes just in time, and to maintain the option to acquiremore voting rights as long as the proxy contest is still looming. Second, to theextent that nominated directors suffer more negative career outcomes fromproxy contests (Fos and Tsoutsoura 2014), we find that nominated directorsare more eager to preserve voting rights to defend their own board seats (asopposed to those of their fellow directors).
We then affirm that CEOs are indeed more likely to refrain from exerciseand sell to preserve their voting power when such additional voting poweris deemed more important, and when the private benefits endangered bythe contest are larger. We proxy for the importance of incremental votingrights using both ex ante measures (whether the market responds positivelyto the announced proxy contest and whether proxy advisory firms endorsedissidents) and two ex post measures (whether the announced contest goesinto the voting stage rather than being settled/withdrawn and whether theshareholder meeting is delayed). We proxy for the size of private benefits withthe standard “entrenchment index” (Bebchuk, Cohen, and Ferrell 2009), aswell as the residual CEO compensation from a standard prediction model. Allresults are highly consistent with the hypothesis.
Last, we conduct the first systematic analysis of OTM option exercises byinsiders. We find that the presence of a proxy contest during the current yeartriples the probability of OTM exercises. In fact, the occurrence of a proxycontest is the single most powerful explanatory variable for OTM exercisesamong the usual list of variables reflecting firm and CEO characteristics andwhen including CEO/firm fixed effects. To the extent that a valuation wedgebetween the insider and the outside market is a necessary condition for OTMexercises to occur in a rational model, such extreme deviations from normality
2 Malmendier and Tate (2005a, b) argue that overconfident CEOs are reluctant to exercise and sell—a patternobservationally equivalent to their behavior when facing proxy contests.
1551
at Colum
bia University L
ibraries on June 27, 2016http://rfs.oxfordjournals.org/
Dow
nloaded from

The Review of Financial Studies / v 29 n 6 2016
provide an informative testing case for the valuation wedge between the insidersand the market when control is contested.
Our paper extends the literature on the private value of corporate control andthe value of voting rights.3 The earlier studies mostly attempt to identify thevalue of control to a marginal trader in the market, who tends to be small andmay not bear a direct relation to the value of control to insiders. In comparison,this study focuses on the private value accruing to agents in control that isincremental to the “fair market value,” where the latter could already includethe value of voting rights to outside shareholders. Calibrated to option valuationmodels, the abnormal patterns suggest that insiders facing control challengesvalue the marginal shares above the market price by 5% to 10%.
It is an immediate goal of the study to expand our understanding of themotives underlying option exercises by executives. A full understanding ofCEOs’motivations for exercising option grants is crucial in any effort to designefficient incentive schemes given the importance of option grants in executivecompensation.4 Prior work has explored the diversification motive based onthe utility theory (e.g., Huddart and Lang 1996; Carpenter 1998; Huddart andLang 2003; Hall and Murphy 2002; Carpenter, Stanton, and Wallace 2010),behavioral factors such as CEO overconfidence (Heath, Huddart, and Lang1999; Malmendier and Tate 2005a,b), and inside information about futurestock returns (Carpenter and Remmers 2001; Bartov and Mohanram 2004;Cicero 2009). Work by Klein and Maug (2011) and Carpenter, Stanton, andWallace (2014) conducted a thorough empirical study nesting all of thesehypotheses. However, none of these earlier studies has considered the effectof private benefits of control either theoretically or empirically, even thoughoption compensation is meant to be an important mechanism for aligning theexecutives’ interests with those of shareholders.
More generally, our study sheds light on how far insiders are willing to go tomaintain control, and on the role that insider ownership could potentially play asa defensive tactic against control challenges.5 Importantly, we show that CEOsare more likely to distort their exercise behavior when their firms already deploystrong defenses (e.g., staggered boards) and insiders already resort to alternativetactics (e.g., postponing shareholder meetings). The combined evidence thus
3 Several studies have estimated the value of voting rights in the United States using dual class shares (Lease,McConnell, and Mikkelson 1983; Zingales 1995; Nenova 2003), controlling block sales (Barclay and Holderness1989; Albuquerque and Schroth 2010), security lending (Christoffersen et al. 2007; Aggarwal, Saffi, and Sturgess2012), and put-call-parity violations (Kalay, Karakas, and Pant 2014). International evidence also abounds (Levy1983; Zingales 1994; Dyck and Zingales 2004; Hauser and Lauterbach 2004).
4 Data from Execucomp indicate that option grants accounted for about half of total CEO compensation in the1990s and early 2000s. The percentage decreased in the mid-2000s, but continued to be significant at about onequarter in 2011. See Frydman and Jenter (2009) for a review on CEO compensation.
5 Distorting option exercises to preserve/obtain more voting rights naturally mirrors findings in earlier studies(Cheng, Nagar, and Rajan 2004; Rauh 2006) that insider and employee ownership dropped after the validationof state-law takeover defenses.
1552
at Colum
bia University L
ibraries on June 27, 2016http://rfs.oxfordjournals.org/
Dow
nloaded from

Out-of-the-Money CEOs: Private Control Premium and Option Exercises
supports the view that aggressive shareholder activism serves an important rolein market-based corporate governance.
1. Hypotheses Development
1.1 General setup: Valuation of stocks and optionsWe follow the standard settings and notations. A CEO receives packages ofAmerican call options on the firm’s stock as a form of compensation. St isstock price at time t , T is the expiration date of the option, X is the exerciseprice of the option, and C(St ,T −t,X) is the value of the option. Under theseassumptions and in a perfect market, it is not profitable to exercise the optionbefore maturity. Thus, the value of the option is equal to the value of a Europeancall with the same parameters if the stock pays no dividends.
Under more realistic assumptions fitted to the CEO (or other key insidersin the firm), a CEO should exercise options before expiration when they aresufficiently in the money (Detemple and Sundaresan 1999; Hall and Murphy2002; Sircar and Xiong 2007). Factors contributing to early exercise includeCEOs’ lack of diversification because of concentrated exposure in their owncompanies, and their inability to reduce exposure by selling options directly. Wetake the optimal exercise behavior with no private control premium as given.
We now introduce proxy contests and isolate their incremental effect onoption exercises. In a proxy contest, dissident shareholders challenge incumbentcontrol by seeking the right to vote other shareholders’ shares in favor of thedirectors nominated by the dissident group. When the control of a firm is undercontest, there might be a date τ by which an extra share of ownership increasesthe CEO’s additional control premium by the amount b. Consider the followingsituation: By staying in her position, a CEO derives private benefits of controlequivalent to a pecuniary benefit of B.6 When her control is contested andthe outcome depends on shareholder votes, then additional shares held couldincrease the probability that the incumbents win the proxy contest and thusretain control by λ. Under such parameterization, b is just proportional to λB.The date τ naturally corresponds to the record date for shareholder voting, butis not necessarily limited to a particular fixed date. This is because a proxycontest often lasts beyond the first set meeting date (Kalay, Karakas, and Pant2014), and because a proxy contest represents only one type of challenge to anincumbent’s control.
Under this scenario, the insider’s valuation of the stock is higher than themarket price (which is the value of the stock to the marginal trader) by amountb. Note that stock price St may already embed a control premium as perceivedby outside blockholders (Barclay and Holderness 1989; Dyck and Zingales2004) or the marginal trader in the market for whom the value of votes
6 We interpret private benefits broadly to include both financial (e.g., high compensation and perks) and nonfinancial(e.g., stature and the satisfaction from carrying out one’s own agenda) gains.
1553
at Colum
bia University L
ibraries on June 27, 2016http://rfs.oxfordjournals.org/
Dow
nloaded from

The Review of Financial Studies / v 29 n 6 2016
may also increase when control is under contest (Kalay, Karakas, and Pant2014; Aggarwal, Saffi, and Sturgess 2012). Hence b is the incremental controlpremium accruing to the incumbent relative to the outsiders. This leads to ourCondition 1.
Condition 1. The CEO’s valuation of the stock is S∗t =St +b, where b>0 and
is the marginal per-share value the insider assigns as the private benefits ofcontrol.
Moreover, there is a strictly positive probability 0<η≤1 that the insider isrestricted from trading shares of the company in the open market (see Section1.3 for justification). This becomes our Condition 2.
Condition 2. The insider is restricted from purchasing shares of the stock in theopen market around date τ with a positive probability η. However, the insideris not restricted from exercising her vested options.
1.2 Hypotheses about early exercisesPrivate benefits of control affect a CEO’s incentive to exercise options beforematurity. We consider two types of early exercise: an early exercise with anintention to sell the resulting shares and an early exercise with an intention tohold the resulting shares. We relegate the formal proofs to the Appendix, butexplain the intuitions as follows.
Hypothesis 1. When control is contested, a CEO who enjoys private benefitsof control is less likely to exercise an option and sell stock.
The primary intuition underlying Hypothesis 1 is that a CEO will not find itprofitable to sell the shares at the market price if his personal valuation of thestock exceeds the market price (Condition 1).
Hypothesis 2. A CEO who enjoys private benefits of control is more likelyto exercise an option with an intention to hold the stock before date τ (whenvoting rights are needed) if τ <T (the maturity date).
Hypothesis 2 suggests that if a CEO expects to receive a payoff in theform of voting rights that help to maintain private benefits of control, sheis more likely to exercise the option early to hold the stock. The intuition hereis similar to that associated with exercising an option before a dividend recorddate.
Finally, if the private benefit b is large enough, then an OTM option relative tothe market price St may become in the money relative to S∗
t . Thus Hypothesis 2could be extended to OTM exercises when insider trading restrictions preventthe CEO from transacting directly in the market.
1554
at Colum
bia University L
ibraries on June 27, 2016http://rfs.oxfordjournals.org/
Dow
nloaded from
Out-of-the-Money CEOs: Private Control Premium and Option Exercises
Hypothesis 3. A CEO might exercise a call option out of the money whencontrol is contested. Moreover, such exercise should happen either at optionmaturity T or right before date τ (when voting rights are needed).
1.3 Institutional backgroundThe law and rules regarding insiders’transactions in stocks and options producethe two necessary elements underlying our hypotheses. First, insiders may facetrading restrictions when a proxy contest is under way. Second, deviationsfrom the normal course of option exercises are not subject to the samerestrictions.
The two legal pillars governing insider trading are Section 16 of the SecuritiesExchangeAct of 1934 (and various amendments) and SEC Rule 10b-5. The lawprohibits anyone from trading while “aware” of material nonpublic information.Insiders thus face various restrictions during informationally sensitive periods,such as earnings announcements or events of material importance (e.g., M&As).Although proxy contests do not usually entail strict “black-out” periods, insidersface potential legal risk if their transactions (those that were not precommitted)cause or coincide with imminent significant stock price movements. Therefore,it is reasonable to assume that insiders face trading restrictions they would notface in times of “peace,” as stated in Condition 2 in Section 1.1.
In contrast, Section 16 provides lenient exemptions for transactions thatinvolve grants or awards. Specifically, option exercises initiated by insidersare exempt from the rule as long as the exercise is not “cashless” and is notaccompanied by an imminent sale of shares. Therefore, insiders can accelerateoption exercises to acquire additional shares even while possessing sensitiveinformation, corresponding to the second part of Condition 1 in Section 1.1.7 Inaddition, the “Safe Harbor” included in Rule 10b-5 allows an insider to cancel aplanned trade (usually a sell), even when possessing inside information, withoutit constituting insider trading, allowing insiders to suspend an option exerciseand sell that was part of a pre-committed plan during proxy contests withoutincurring additional legal liability.8
2. Option Exercises and Proxy Contests: Evidence
2.1 Data overviewWe build our sample from five main data sources. First, information about CEOoptions and exercises comes from the Thomson Reuters Insider Filings Data(TIF), accessible through WRDS. The data source captures all U.S. insider
7 The rationale behind the exemption is that shares acquired because of option exercises are purchased from acorporation as opposed to the shareholding public.
8 The Safe Harbor clause reflects the U.S. Supreme Court’s holding that there can be no liability for insider tradingwithout an actual securities transaction.
1555
at Colum
bia University L
ibraries on June 27, 2016http://rfs.oxfordjournals.org/
Dow
nloaded from

The Review of Financial Studies / v 29 n 6 2016
trading activities as reported on Forms 3, 4, 5, and 144, especially Form 4.9
Because of the coverage of the TIF database, we restrict our sample to 1996and beyond.
For our research, we focus exclusively on CEOs, and the unit of analysis isan option package belonging to a CEO in a given month between vesting andexpiration. The construction of the data follows primarily the methods of Kleinand Maug (2011). We include the following derivative securities as “options”:Employee stock options (TIF coding: EMPO), non-qualified stock options(NONQ), warrants (WT), call options (CALL), rights (RGHTS), incentivestock options (ISO), directors’ stock options (DIRO), and convertible preferredstocks (CVP). An option package is defined as options awarded to a CEO withthe same vesting and expiration dates. For all 14,014 option packages vestedbetween 1995 and early 2013, we track their exercise status from the vestingdate to the date of exercise, expiration, or the end of the sample period (January2013).
An option exercise is defined as an exercise of at least a quarter of an optionpackage, but the results are not sensitive to the exact magnitude chosen.10
The end date of a package (or the exit date in the hazard analysis) is eitherthe first date of an exhaustive exercise, the date of expiration, or the lastmonth of our sample period if the package remains available at that time (thecensoring date in the hazard analysis). This results in 997,034 observations atthe option package-month level. The average in-sample duration of an optionpackage is about 71 months. Importantly, we distinguish two purposes foroption exercises: we divide Exercise into Exercise&sell and Exercise&hold.Exercise&sell is defined as an exercise followed by a sale of at least 25% ofthe initial number of shares within the ensuing three months. Again, resultsare consistent if we alter the 25% filter used in our “sale” classification. Thesecond variable, Exercise&hold, is an exercise that is not followed by such asale. Unconditionally, the probability of exercise and sell at the package-monthlevel is 0.46%, and that of exercise and hold is 0.28%. Both are on par withprobabilities reported in Cicero (2009).
Second, information about the key independent variable of interest, proxycontests, was hand-collected from SEC filings—PREC14C (a preliminaryproxy statement in connection with contested solicitations) and DEFC14A (adefinitive proxy statement in connection with contested solicitations)—fromEDGAR. These data are updated from Fos (2015), which contains more detailsabout the institutional background of proxy contests, as well as the constructionof the event variables. There are 1,029 announced proxy contests between 1996
9 Form 3 records initial beneficial ownership for all officers. Form 4 reports changes in an insider’s ownershipposition because of purchase, sale, option grant/exercise, gift, or any other transactions. Form 5 is the annualstatement of changes in beneficial ownership and includes exempt transactions not required on Form 4. Finally,Form 144 reports proposed sales of restricted stock.
10 Supplementary Table A1 reports the main results classifying option exercises as any exercise of 100 shares ormore. The results are similar to those in Table 3 and Table 7.
1556
at Colum
bia University L
ibraries on June 27, 2016http://rfs.oxfordjournals.org/
Dow
nloaded from

Out-of-the-Money CEOs: Private Control Premium and Option Exercises
Figure 1Cumulative abnormal returns around proxy contestsThis chart plots the cumulative abnormal returns from the four-factor (market, size, book-to-market, andmomentum) model from 24 months before the announcement of a proxy contest to 24 months after.
and 2012, with annual frequency ranging from 33 (in 1996) to 89 (in 2008). Weconstruct a dummy variable Contest, equal to one if there was a proxy contestannouncement during the current or past 12 months. In a given year, an averageof 0.62% of the public firms in our sample are targets of proxy contests.
Among the dissidents, a slight majority (56%) are hedge funds. The nextbiggest players are individual shareholders (20%) and corporations (12%).The widespread adoption of antitakeover provisions and the enactment ofstate-level antitakeover laws sheltering management have increased the costof hostile tender offers and have therefore contributed to the decrease in thefrequency of hostile tender offers (Karpoff and Malatesta 1989; Bertrand andMullainathan 2003; Cremers and Ferrell 2014). In contrast, the 1992 proxyreform, which allowed independent shareholders to engage in communicationmore freely without heightened legal risk, played an important role in theincreasing frequency of proxy contests (Sharara and Hoke-Witherspoon 1993;Bradley et al. 2010; Fos 2015).
Figure 1 demonstrates the stock–return dynamics of firms targeted byproxy contests from 24 months before the announcement of the contest to24 months afterward,11 and reveals three important patterns: First, target firmssignificantly underperform during the 2 years before the proxy contest by about10 percentage points in risk-adjusted returns. Second, the stock price jumps upby 5–6 percentage points upon the announcement of the proxy contest. Third,there is no significant postannouncement drift in either direction. In other words,
11 The cumulative abnormal returns are computed as cumulative alphas from four-factor (market, size,book-to-market ratio, and momentum) models using 73 monthly observations (or as many observations asare available) centered on the announcement date.
1557
at Colum
bia University L
ibraries on June 27, 2016http://rfs.oxfordjournals.org/
Dow
nloaded from

The Review of Financial Studies / v 29 n 6 2016
the market’s assessment of the effect (positive on average) of proxy contests onthe target firms upon announcement is unbiased. Given that we are analyzingpostannouncement CEO option exercises, the absence of a return drift indicatesthat any exercise motive based on anticipated future returns is not justified bythe ex post realization of the returns.
Third, the transactions from TIF are matched to the CRSP/Compustat mergeddatabases for standard stock- and company-level information. The followingvariables are imputed at the monthly level using the value as of the close of theprior fiscal year: Market cap, the market capitalization of a company (whichenters regressions in log value); Book/market, the book-to-market ratio ofequity; Growth, the average annual sales growth for the last 3 years (or for asmany years as are available during the 3-year period); Idiosyncratic vol is thestock’s annualized residual return from a regression of daily stock returns onthe Fama-French three factors; Dividend yld is the ratio of common dividendsto market capitalization; Dividend record month is a dummy variable equal toone if the month contains a dividend record date; and Illiquidity is the Amihud(2002) illiquidity measure, or the yearly average of the daily square root of(Price×Volume)/|Return|. The following variable is recorded at the monthlylevel: Stock ret is the 12-month stock return on the monthly rolling windowusing data from the past 12 months.
Two additional variables are included because they were identified byKlein and Maug (2011) as important determinants of CEO option exercises.Earnings month is a dummy variable equal to one if the firm announces quar-terly earnings during the month. Corporate insiders are restricted from tradingstocks during some informationally sensitive time windows (“black-out peri-ods”), of which an earnings announcement is a premier example. New grant is adummy variable equal to one if the CEO receives new option or stock grants inthe month.ACEO who targets a particular level of company exposure should bemotivated to exercise and sell some vested options upon receiving new grants.
Fourth, we match our sample to the Execucomp database to retrieve andconstruct CEO characteristics, compensation, and wealth, because some ofthese variables serve as proxies for the CEO’s risk aversion and incentivesto diversify. This granular information comes at the cost of losing aboutthree quarters of the sample. More specifically, we construct the followingvariables at the annual frequency (and impute them to the monthly frequency):CEO tot wealth is a proxy for the CEO’s total wealth, which is estimatedusing the procedure pioneered by Dittmann and Maug (2007) based on theprevious years’ compensation reported in Execucomp; % CEO wealth in firmis the percentage of total wealth that is in the form of unsold shares andunexercised options (including both vested and unvested); CEO age is the ageof the CEO. Finally, % Own top 5 is the percentage of outstanding shares heldby the top–five executives.
Finally, we obtain data on takeover defenses from RiskMetrics to analyzeinteraction between option exercises and managerial entrenchment. We
1558
at Colum
bia University L
ibraries on June 27, 2016http://rfs.oxfordjournals.org/
Dow
nloaded from
Out-of-the-Money CEOs: Private Control Premium and Option Exercises
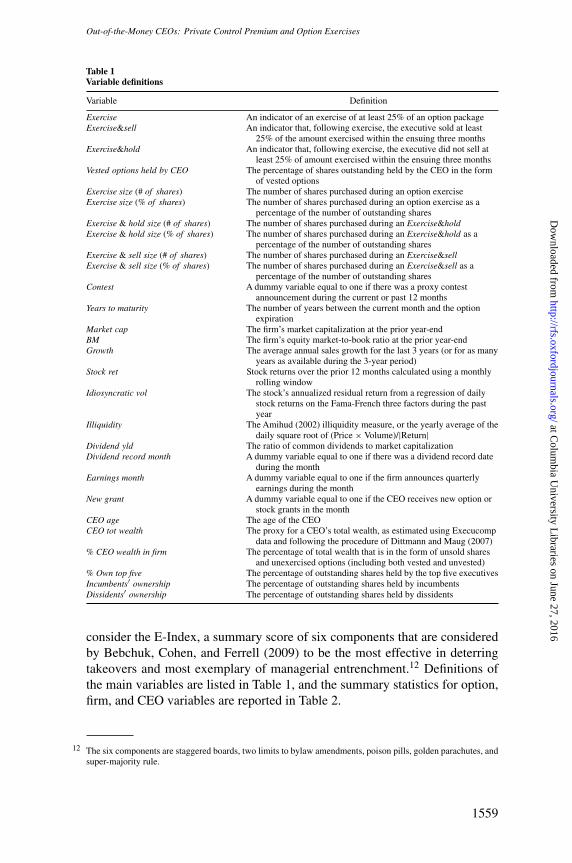
Table 1Variable definitions
Variable Definition
Exercise An indicator of an exercise of at least 25% of an option packageExercise&sell An indicator that, following exercise, the executive sold at least
25% of the amount exercised within the ensuing three monthsExercise&hold An indicator that, following exercise, the executive did not sell at
least 25% of amount exercised within the ensuing three monthsVested options held by CEO The percentage of shares outstanding held by the CEO in the form
of vested optionsExercise size (# of shares) The number of shares purchased during an option exerciseExercise size (% of shares) The number of shares purchased during an option exercise as a
percentage of the number of outstanding sharesExercise & hold size (# of shares) The number of shares purchased during an Exercise&holdExercise & hold size (% of shares) The number of shares purchased during an Exercise&hold as a
percentage of the number of outstanding sharesExercise & sell size (# of shares) The number of shares purchased during an Exercise&sellExercise & sell size (% of shares) The number of shares purchased during an Exercise&sell as a
percentage of the number of outstanding sharesContest A dummy variable equal to one if there was a proxy contest
announcement during the current or past 12 monthsYears to maturity The number of years between the current month and the option
expirationMarket cap The firm’s market capitalization at the prior year-endBM The firm’s equity market-to-book ratio at the prior year-endGrowth The average annual sales growth for the last 3 years (or for as many
years as available during the 3-year period)Stock ret Stock returns over the prior 12 months calculated using a monthly
rolling windowIdiosyncratic vol The stock’s annualized residual return from a regression of daily
stock returns on the Fama-French three factors during the pastyear
Illiquidity The Amihud (2002) illiquidity measure, or the yearly average of thedaily square root of (Price × Volume)/|Return|
Dividend yld The ratio of common dividends to market capitalizationDividend record month A dummy variable equal to one if there was a dividend record date
during the monthEarnings month A dummy variable equal to one if the firm announces quarterly
earnings during the monthNew grant A dummy variable equal to one if the CEO receives new option or
stock grants in the monthCEO age The age of the CEOCEO tot wealth The proxy for a CEO’s total wealth, as estimated using Execucomp
data and following the procedure of Dittmann and Maug (2007)% CEO wealth in firm The percentage of total wealth that is in the form of unsold shares
and unexercised options (including both vested and unvested)% Own top five The percentage of outstanding shares held by the top five executivesIncumbents′ ownership The percentage of outstanding shares held by incumbentsDissidents′ ownership The percentage of outstanding shares held by dissidents
consider the E-Index, a summary score of six components that are consideredby Bebchuk, Cohen, and Ferrell (2009) to be the most effective in deterringtakeovers and most exemplary of managerial entrenchment.12 Definitions ofthe main variables are listed in Table 1, and the summary statistics for option,firm, and CEO variables are reported in Table 2.
12 The six components are staggered boards, two limits to bylaw amendments, poison pills, golden parachutes, andsuper-majority rule.
1559
at Colum
bia University L
ibraries on June 27, 2016http://rfs.oxfordjournals.org/
Dow
nloaded from

The Review of Financial Studies / v 29 n 6 2016
Table 2Summary statistics
Mean Std dev Min 25% Median 75% Max(50%)
(1) (2) (3) (4) (5) (6) (7)
A. Full sample
Exercise & sell 0.0046 0.0679 0.0 0.0 0.0 0.0 1.0Exercise & hold 0.0027 0.0524 0.0 0.0 0.0 0.0 1.0Vested options held by CEO 0.0179 0.0439 0.0000 0.0016 0.0055 0.0181 0.1746Exercise size (# of shares) 104,004 345,222 334 12,900 35,000 96,000 1,445,000Exercise size (% of shares) 0.0037 0.0120 0.0000 0.0003 0.0009 0.0028 0.0812Exercise & hold size (# of shares) 130,615 482,120 334 10,000 30,000 100,000 1,445,000Exercise & hold size (% of shares) 0.0066 0.0193 0.0000 0.0004 0.0016 0.0052 0.0812Exercise & sell size (# of shares) 93,286 270,561 1,626 15,000 37,189 93,724 984,048Exercise & sell size (% of shares) 0.0025 0.0069 0.0000 0.0003 0.0008 0.0022 0.0201Contest 0.0042 0.0648 0.0 0.0 0.0 0.0 1.0Years to maturity 3.94 2.62 0.00 1.75 3.67 5.92 18.00Market cap ($ mil) 4,180 11,129 8 184 705 2,672 80,829BM 0.51 0.41 −0.12 0.25 0.42 0.66 2.45Growth 0.20 0.35 −0.31 0.04 0.12 0.24 2.30Stock ret 0.14 0.60 −0.84 −0.20 0.04 0.32 3.20Idio volatility 0.45 0.26 0.13 0.26 0.37 0.56 1.47Illiquidity 0.33 0.36 0.01 0.04 0.16 0.61 2.07Dividend yld 0.02 0.04 0.00 0.00 0.00 0.03 0.23Dividend record month 0.12 0.33 0.00 0.00 0.00 0.00 1.00Earnings month 0.33 0.47 0.00 0.00 0.00 1.00 1.00New grant 0.01 0.09 0.00 0.00 0.00 0.00 1.00
B. Execucomp sample
CEO age 55.26 6.79 29.00 51.00 55.00 60.00 89.00CEO tot wealth ($ mil) 10.71 1.35 1.85 9.78 10.70 11.63 1100.00% CEO wealth in firm 0.58 0.27 0.00 0.37 0.58 0.81 1.00% Own top five 0.14 14.83 0.00 0.01 0.03 0.12 0.42
C. Ownership at proxy contest targets
Incumbents’ ownership 0.1091 0.1187 0.0000 0.0232 0.0680 0.1470 0.6030Dissidents’ ownership 0.0962 0.1067 0.0000 0.0294 0.0810 0.1330 0.4100Vested options held by CEO 0.0122 0.0168 0.0000 0.0022 0.0057 0.0153 0.0945
Panel A reports summary statistics for option and firm variables recorded at the option package-month level (theunit of observation for our main regression analysis) for the Compustat/CRSP sample. Panel B reports summarystatistics for CEO variables for the Execucomp sample. Panel C reports ownership variables for the sample offirms subject to proxy contests. All variables are defined in Table 1. All potentially unbounded variables areprewinsorized at the 1% and 99% extremes. Columns (1) and (2) report the mean and standard deviation of eachvariable. Columns (4)–(6) report their values at the 25th, 50th, and 75th percentiles.
2.2 Hazard analysisGiven the nature of the data structure (records of option packages over their“lifetimes”) and the research question (what motivates CEOs to exercise theiroptions before maturity), the appropriate estimation method is a hazard analysis.The Cox proportional hazards model is among the most popular in settingssimilar to ours (Klein and Maug 2011) because of its flexibility with basehazard functions. We make two major changes from the Klein and Maug (2011)framework. First, we incorporate proxy contests as an explanatory variable ofkey interest. Second, we explicitly differentiate exercise and sell from exerciseand hold because they are driven by distinct motives when control is at stake,
1560
at Colum
bia University L
ibraries on June 27, 2016http://rfs.oxfordjournals.org/
Dow
nloaded from
Out-of-the-Money CEOs: Private Control Premium and Option Exercises
departing from existing models that assume that the insider intends to sell theresulting shares.
As a result, each option package is subject to two types of “risk” of“exiting” before expiration: exercise to sell the shares and exercise to holdthe shares. Moreover, the two exit strategies are mutually exclusive but are notnecessarily independent of each other (and if they are dependent, the sign oftheir dependence is a priori unclear). The right model for such a situation isthe Cox proportional hazards model with competing risks developed by Fineand Gray (1999).13
In such a model, the coefficient on the j -th regressor Xj measures the effectof increasing the j -th covariate by an infinitesimal amount on the log ratioof hazard rates. For ease of interpretation and following common practice,we report in the tables the exponentiated coefficients eβj , which represent themultiples of the hazard rates, or the hazard ratios, associated with a one-unitchange in the covariate Xj . There is no direct mapping between the t-statisticsfor the original coefficients and those for the hazard rates (which do not followa symmetric distribution). However, the p-values are comparable in that thep-value for an original coefficient to be different from zero is the same as thatfor the corresponding hazard rate to be different from unity. For this reason,we report the p-values in all hazard-model regressions. In our context, thehazard ratios are essentially the option exercise rate (at the monthly frequency)relative to the normal rates. We first estimate the relation between the rate ofExercise&sell and the covariates with Exercise&hold as the competing risk,and then we reverse the order. Finally, because a package could experiencemultiple exercises over the course of its life, we let an option package “startanew” immediately following each exercise until the option exit date.
2.3 Determinants of exercise and sellSection 1 presented a hypothesis predicting that proxy contests should have anegative effect on the probability that a CEO will exercise and sell. Resultsfrom the competing risk model, reported in Table 3, confirm this prediction.We conduct regressions on three decreasingly nested samples: (1) the universeof public companies covered by the TIF that award CEOs options; (2) thesubsample of firms with non missing firm characteristic variables; and (3) thefurther subsample of firms that are covered by the Execucomp database so asto have CEO personal and wealth characteristics. All regressions include yeardummies and report exponentiated coefficients or hazard ratios. The neutralvalue of a hazard rate is one (i.e., at the same exercise rate as normal). Thep-values indicate that the significance levels for the reported hazard rates differfrom unity, based on standard errors clustered at the option-package level.
13 The key difference between a regular hazard model and a competing risk model in our setting is that when aCEO exercises an option package and holds the resulting shares, the standard model analyzing exercise and sell
1561
at Colum
bia University L
ibraries on June 27, 2016http://rfs.oxfordjournals.org/
Dow
nloaded from

The Review of Financial Studies / v 29 n 6 2016
Table 3Exercise & sell and proxy contests: Hazard model with competing risk
(1) (2) (3)
Contest 0.2254∗∗∗ 0.2034∗∗∗ 0.3063∗[0.0021] [0.0008] [0.0784]
Years to maturity 0.9963 1.0246∗[0.7263] [0.0891]
Market cap 1.0446∗∗ 0.9644[0.0128] [0.2543]
BM 0.8241∗∗∗ 0.8466[0.0099] [0.1188]
Growth 0.9354 1.1967∗[0.3173] [0.0735]
Stock ret 1.9254∗∗∗ 2.1131∗∗∗[0.0000] [0.0000]
Idiosyncratic vol 0.3487∗∗∗ 0.3212∗∗∗[0.0000] [0.0000]
Illiquidity 0.5054∗∗∗ 0.0410∗∗∗[0.0000] [0.0000]
Dividend yld 0.2667∗∗ 0.4397[0.0466] [0.3125]
Dividend record month 1.2154∗∗∗ 1.2666∗∗∗[0.0015] [0.0016]
Earnings month 0.7577∗∗∗ 0.7371∗∗∗[0.0000] [0.0000]
New grant 14.7853∗∗∗ 17.1961∗∗∗[0.0000] [0.0000]
CEO age 1.0025[0.5892]
CEO tot wealth 1.0277[0.3125]
% CEO wealth in firm 0.6098∗∗∗[0.0000]
Year dummies Yes Yes Yes
# Option package series 19,058 14,133 8,384# Option package months 1,024,673 643,958 356,882# Observations with y=1 4,713 2,962 1,642
This table shows the determinants of CEO exercise–and–sell decisions. Results are presented at the optionpackage–month level using the Cox proportional hazards model with competing risks (Fine and Gray 1999).The empirical methodology is described in Section 2.2. We estimate the relation between the subdistributionhazard rates and covariates for Exercise&sell as the main risk and Exercise&hold as the competing risk. Allindependent variables are as defined in Section 2.1 and Table 1. All regressions include year dummies. The tablereports exponentiated coefficients or hazard ratios. The p-values, based on standard errors clustered at the optionpackage level, indicate the significance levels for whether the hazard ratios are significantly different from unity.*, **, and *** indicate statistical significance at the 10%, 5%, and 1% levels, respectively.
First, proxy contests significantly deter exercise and sell, consistent withCEOs’ motive to maintain the option to acquire more shares. The coefficientsare stable, with progressive inclusion of control variables. The presence of aproxy contest during the past 12 months reduces the monthly rate of exerciseand sell to about one fourth (0.20 to 0.30) of the normal level. The originalcoefficients (the log-hazard ratios) are significantly different from zero at the1% level for the CRSP/Compustat samples and at the 10% level for the much
would record the observation as being censored. In contrast, the competing risk model keeps the observation inthe “risk set” and treats it as being censored only at the end of the sample.
1562
at Colum
bia University L
ibraries on June 27, 2016http://rfs.oxfordjournals.org/
Dow
nloaded from
Out-of-the-Money CEOs: Private Control Premium and Option Exercises
smaller Execucomp sample.14 By refraining from selling, insiders could affirmthe voting power associated with these shares, preventing the same shares fromfalling into the hands of the dissidents and their supporters.
As expected, the coefficients on the covariates are consistent with the standardtheories predicting option exercises. For example, Idio volatility is associatedwith significantly lower incidences of option exercise and sell because ofthe high time value of the options. However, the variable that proxies forhigher fundamental value (Stock ret) predicts significantly more exercises.15
The 22%–27% increase in the hazard ratio of exercise and sell during thedividend record month confirms the prediction of a standard model that dividendpayments encourage exercises of call options whose strike prices do not adjustfor dividends (which is the convention for executive options).
However, empirical support for diversification motives is more mixed. Newgrants (New grant) prompt CEOs to exercise 15–17 times more (significantat the 1% level) than the normal rate, raising the exercise probability from0.44% in a typical month to 7%–8% during a month with new grants,consistent with the diversification motivation. However, CEO firm-specificwealth (%CEO firm wealth) is significantly and negatively related to exerciseand sell, exactly the opposite of what standard portfolio theories predict. Weshould interpret these results to mean that some CEOs seek to accumulate sharesin their firms, and that such traits are highly persistent.
Last, because of prevalent black-out periods for insider trading aroundearnings announcement windows (varying from a week to a full month),the rate of exercise and sell during the earnings announcement month offersa benchmark for the direct effect of trading restrictions. Table 3 indicatesthat CEOs reduce exercise-and-sell behavior during the month by aboutone quarter (corresponding to the hazard ratio of 0.74–0.76 associated withEarnings month). The fact that during proxy contests the rate of exercise andsell decelerates to only 20% of the normal level indicates that a large portion ofsuch activity is likely to be voluntary rather than owing to a mechanical effectof a strict or soft blackout.
2.4 Attributing exercise behavior to proxy contests2.4.1 Does unobserved CEO/firm heterogeneity drive the results? Proxycontests and deceleration in exercise and sell could both be driven by someinherent CEO-specific trait. Overconfidence has been a leading explanationin the literature for CEOs’ reluctance to reduce their personal exposure
14 We find similar deceleration in exercise and sell by non-CEO insiders (other top executives and board members):the probability of exercise and sell decreases from 1.37% 3 years before a proxy contest to 0.63% during thecontest year, or a 50% deceleration.
15 If we add stock returns during the six post-announcement months, the coefficient is significantly negative butwith modest economic magnitude: a 10-percentage-point increase in future returns is associated with a 4% dropin the rate of exercise and sell. Both effects support a “lock-in-value” motive, but do not affect the coefficienton Contest.
1563
at Colum
bia University L
ibraries on June 27, 2016http://rfs.oxfordjournals.org/
Dow
nloaded from

The Review of Financial Studies / v 29 n 6 2016
to company-specific risk. In fact, a popular CEO overconfidence measure(Malmendier and Tate 2005a) is constructed based on a lower-than-normal levelof exercise and sell, an outcome observationally equivalent to our finding. Theliterature also documents that CEO overconfidence leads to suboptimal capitalstructure and overinvestment, and that the resulting inefficiencies can attractshareholder activism.
We thus resort to the conditional logit model with fixed effects to identifywhether the pattern in option exercises is driven by unobserved CEOheterogeneity or by the unusual circumstances of a proxy contest.16 Resultsare reported in Supplementary Table A2. The effects of a proxy contest (as wellas some of the key firm/stock level characteristics) are very close, when incor-porating a CEO fixed effect, compared with those derived without fixed effects.
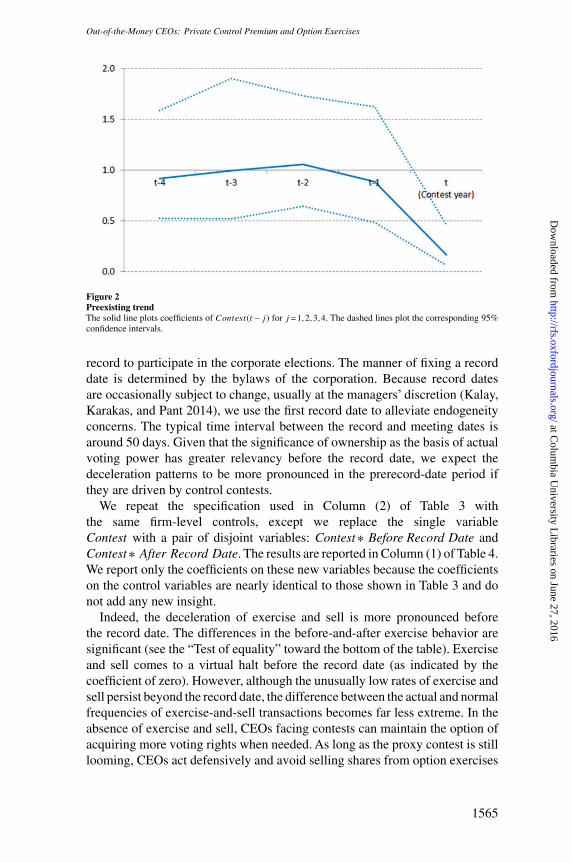
Similarly, we establish that there is no preexisting trend in the pattern ofexercise and sell for the same firms leading to the proxy contest. We estimatethe same equation as in Column (2) of Table 3 (which includes all firm-level butno CEO-level control variables) based on the sample of all Compustat firms,except that we replace the single regressor, Contest, with a set of regressorsContest(t −j ), an indicator variable equal to one if the firm-year observationis j (=4,3,2,1,0) years before a proxy contest at the firm. If a firm experiencesrepeated contests in consecutive years, only the first contest is counted. Weplot the coefficients on Contest(t −j ) and the corresponding 95% confidenceintervals in Figure 2. The chart shows no preexisting trend: CEOs at firmsexperiencing proxy contests maintained their normal rates of exercise and sell(the coefficients being indistinguishable from the neutral value of one) untilthe year before the contest, at which point the rate of exercise and sell dropsprecipitously to about 20% of the normal level.
Both tests suggest that the observed deceleration of exercise and sell isdriven by circumstances and motives associated with proxy contests, ratherthan by inherent CEO traits or unobserved firm heterogeneity. The subject ofour analyses, CEOs’ major option exercises at the monthly frequency, is alow-probability event (less than 1%). As such, statistical inferences might besusceptible to data flukes. For this reason, the two tests in this section also serveto confirm the stability of the probabilities and hazard ratios of exercises duringthe event and nonevent windows.
2.4.2 Option exercise and sell along proxy contest evolvement. This sectionrelates option exercises and features that are unique to proxy contests to form amore specific connection between them. First, we study option exercises beforeand after the record date. Proxy contests typically occur in connection with thecompany’s annual shareholders’ meeting, in which case the record date is thecompany’s predetermined official date before which one must be an owner on
16 We change the model specification because currently available competing risk models do not deliver consistentestimates when fixed effects are incorporated.
1564
at Colum
bia University L
ibraries on June 27, 2016http://rfs.oxfordjournals.org/
Dow
nloaded from
Out-of-the-Money CEOs: Private Control Premium and Option Exercises
Figure 2Preexisting trendThe solid line plots coefficients of Contest(t −j ) for j =1,2,3,4. The dashed lines plot the corresponding 95%confidence intervals.
record to participate in the corporate elections. The manner of fixing a recorddate is determined by the bylaws of the corporation. Because record datesare occasionally subject to change, usually at the managers’ discretion (Kalay,Karakas, and Pant 2014), we use the first record date to alleviate endogeneityconcerns. The typical time interval between the record and meeting dates isaround 50 days. Given that the significance of ownership as the basis of actualvoting power has greater relevancy before the record date, we expect thedeceleration patterns to be more pronounced in the prerecord-date period ifthey are driven by control contests.
We repeat the specification used in Column (2) of Table 3 withthe same firm-level controls, except we replace the single variableContest with a pair of disjoint variables: Contest∗ Before Record Date andContest∗ After Record Date. The results are reported in Column (1) of Table 4.We report only the coefficients on these new variables because the coefficientson the control variables are nearly identical to those shown in Table 3 and donot add any new insight.
Indeed, the deceleration of exercise and sell is more pronounced beforethe record date. The differences in the before-and-after exercise behavior aresignificant (see the “Test of equality” toward the bottom of the table). Exerciseand sell comes to a virtual halt before the record date (as indicated by thecoefficient of zero). However, although the unusually low rates of exercise andsell persist beyond the record date, the difference between the actual and normalfrequencies of exercise-and-sell transactions becomes far less extreme. In theabsence of exercise and sell, CEOs facing contests can maintain the option ofacquiring more voting rights when needed. As long as the proxy contest is stilllooming, CEOs act defensively and avoid selling shares from option exercises
1565
at Colum
bia University L
ibraries on June 27, 2016http://rfs.oxfordjournals.org/
Dow
nloaded from

The Review of Financial Studies / v 29 n 6 2016
Table 4Exercise & sell dynamics around record dates and staggered terms
(1) (2) (3) (4)
Contests* 0.0000∗∗∗ 0.0000∗∗∗ Contests* 0.0000∗∗∗ 0.0000∗∗∗Before record date [0.0000] [0.0000] nominated [0.0000] [0.0000]
Contests* 0.2420∗∗∗ 0.2412∗∗∗ Contests* 0.0712∗∗∗ 0.0663∗∗∗After record date [0.0032] [0.0031] not nominated [0.0007] [0.0014]
p-val for the difference 0.000∗∗∗ 0.000∗∗∗ 0.000∗∗∗ 0.000∗∗∗
No contest* 0.6608 No contest* 1.3784before record date [0.1835] nominated [0.5619]
No contest* 1.1128 No contest* 1.1681after record date [0.6101] not nominated [0.7490]
p-val for the difference 0.163 0.821
p-val for the dif-in-dif 0.000∗∗∗ 0.000∗∗∗Firm controls Yes Yes Yes Yes# Option package series 14,133 14,133 5,381 5,381# Option package months 643,958 643,958 237,290 237,290# Observations with y=1 2,962 2,962 1,092 1,092
This table follows the same regression specifications as in Table 3 to explore the unique features associated withproxy contests: The record dates and the terms of staggered boards. In Columns (1) and (2), the key variableContest is partitioned into Contest ∗ Before record date and Contest ∗ After record date to indicate whether thecurrent month (associated with a proxy contest) is before or after the date of ownership record that entitles theholder to voting rights at the upcoming meeting. In Columns (3) and (4), the key variable Contest is partitionedinto Contests ∗ Nominated and Contests ∗ Not Nominated to indicate whether the announced proxy contest isagainst a board in which the CEO is nominated for reelection at the upcoming meeting. In Columns (2) and(4), we interact the new variables with No Contest, a dummy variable coded one if the observation belongs toa (size/book-to-market/industry) matched firm, which is not a target firm for a proxy contest during its proxyseason in the same year and month. Firm-level control variables and year dummies are included in the regressionsbut not reported. Significance of differences is tested using chi tests. The table reports exponentiated coefficientsor hazard ratios. The p-values, based on standard errors clustered at the option package level, indicate thesignificance levels for whether the hazard ratios are significantly different from unity. *, **, and *** indicatestatistical significance at the 10%, 5%, and 1% levels, respectively.
even beyond the record date. In our sample, 20% of the event companies weretargets of repeated contests; moreover, dissidents may well continue to seekboard representation or influence through noncontested routes after the initialconfrontation.
Given that the (first) record date is an exogenously set date unique to theproxy process, the difference in the exercise-and-sell rates before and after isunlikely to be explained by factors outside the context of proxy voting. It is,however, plausible that CEOs would refrain from selling before the record datein any proxy season (even in the absence of a contest) under two hypotheses.First, a significant reduction in CEO ownership revealed right before the annualshareholder meeting might be taken by the market as a negative signal. Second,proposals are voted on at all companies’ annual shareholder meetings, and aCEO could desire voting rights on issues that are important to her even thoughthere is no explicit proxy contest.
To delineate the effect of a proxy contest from that of the record date in anon-contested proxy season, we add to the regression two additional regressors,No Contest∗Before Record Date and No Contest∗After Record Date, suchthat the first dummy variable is coded one if the observation belongs to amatched firm during its proxy season in the same year and the month is equal
1566
at Colum
bia University L
ibraries on June 27, 2016http://rfs.oxfordjournals.org/
Dow
nloaded from

Out-of-the-Money CEOs: Private Control Premium and Option Exercises
to or before the month of the record date, and the second dummy is coded oneif the month is after the record date. We locate a match firm for each event firmfrom the same stock market capitalization and book-to-market quintile (usingthe NYSE quintile cutoffs) during the contest year, and from the same four-,three-, two-, or one-digit SIC code until we find a match. If there are multiplematches, we pick the one that is closest in market capitalization. Moreover, anecessary condition for a matched firm is that it does not have a proxy contestduring the 3-year period centered on the year in consideration.
Results are reported in Column (2) of Table 4. The exercise-and-sell rateis indeed a bit slower than usual before the record date during a normalproxy season, but it returns to normal afterward. However, the before-and-afterdifference is not significant. More importantly, the difference-in-differencescomparing the before-and-after change during proxy contests and normal proxyseasons is significant at less than the 1% level, indicating the necessity of a proxycontest in decelerating exercise and sell.
Second, we explore directors’ differential vulnerability to contests related totheir nomination status using the subsample of firms with a staggered boardstructure. In a staggered board, only the nominated incumbent directors areup for reelection because their terms have expired. Fos and Tsoutsoura (2014)show that nominated directors experience negative career consequences to amuch greater extent relative to non-nominated directors when the firm is a targetin a proxy contest. Such heterogeneity in the exposure of incumbent directorsto proxy contests should result in stronger motives among the nominated CEOsto refrain from exercise and sell.
We follow a similar specification to partition the key variable Contestinto the following pair of disjoint variables: Contest∗Nominated andContest∗Not nominated. The results, reported in Column (3) of Table 4,indicate that although both nominated and non-nominated CEOs are less likelyto exercise and sell when the company is involved in a proxy contest, the effectis significantly stronger for the nominated CEOs.
As was the case with the argument regarding the record dates, it is possiblethat a nominated CEO could be reluctant to appear to be selling her holdings forfear of sending negative signals to the market. To tease out the effect attributableto proxy contests, we add to the regression two dummy variable regressors,No Contest∗Nominated and No Contest∗Not nominated, such that the firstdummy variable is coded one if the observation belongs to a nominated CEOduring a proxy contest but the timing is 3 years earlier and the second dummyvariable is defined analogously. These dummy variables are added to capturethe situation for the same CEOs as those targeted by proxy contests but during anon-contest year with the same nomination status (because almost all staggeredboards adopt 3-year staggered terms). The results, reported in Column (4) ofTable 4, indicate that CEOs generally do not slow down their option exercisesduring a noncontested proxy season regardless of whether they are nominated.Again, the difference-in-differences between contested and noncontested proxy
1567
at Colum
bia University L
ibraries on June 27, 2016http://rfs.oxfordjournals.org/
Dow
nloaded from
The Review of Financial Studies / v 29 n 6 2016
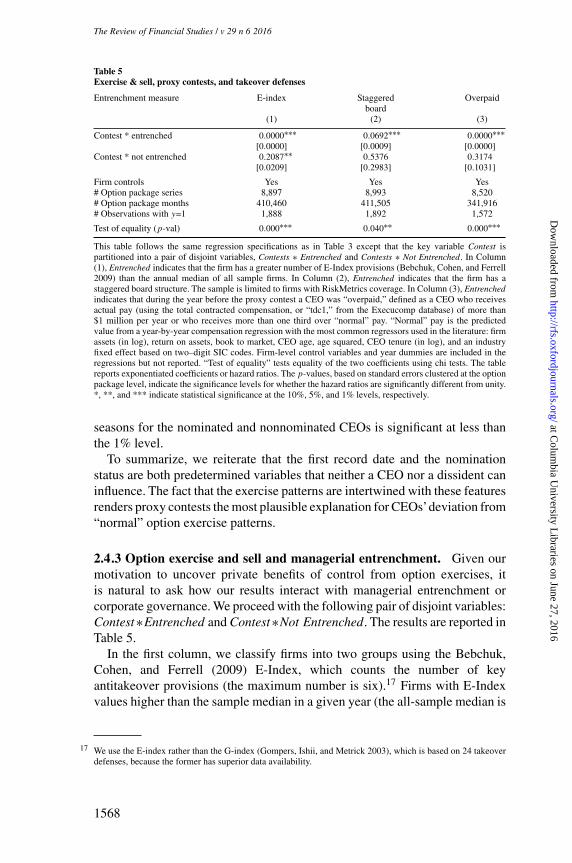
Table 5Exercise & sell, proxy contests, and takeover defenses
Entrenchment measure E-index Staggered Overpaidboard
(1) (2) (3)
Contest * entrenched 0.0000∗∗∗ 0.0692∗∗∗ 0.0000∗∗∗[0.0000] [0.0009] [0.0000]
Contest * not entrenched 0.2087∗∗ 0.5376 0.3174[0.0209] [0.2983] [0.1031]
Firm controls Yes Yes Yes# Option package series 8,897 8,993 8,520# Option package months 410,460 411,505 341,916# Observations with y=1 1,888 1,892 1,572
Test of equality (p-val) 0.000∗∗∗ 0.040∗∗ 0.000∗∗∗
This table follows the same regression specifications as in Table 3 except that the key variable Contest ispartitioned into a pair of disjoint variables, Contests ∗ Entrenched and Contests ∗ Not Entrenched. In Column(1), Entrenched indicates that the firm has a greater number of E-Index provisions (Bebchuk, Cohen, and Ferrell2009) than the annual median of all sample firms. In Column (2), Entrenched indicates that the firm has astaggered board structure. The sample is limited to firms with RiskMetrics coverage. In Column (3), Entrenchedindicates that during the year before the proxy contest a CEO was “overpaid,” defined as a CEO who receivesactual pay (using the total contracted compensation, or “tdc1,” from the Execucomp database) of more than$1 million per year or who receives more than one third over “normal” pay. “Normal” pay is the predictedvalue from a year-by-year compensation regression with the most common regressors used in the literature: firmassets (in log), return on assets, book to market, CEO age, age squared, CEO tenure (in log), and an industryfixed effect based on two–digit SIC codes. Firm-level control variables and year dummies are included in theregressions but not reported. “Test of equality” tests equality of the two coefficients using chi tests. The tablereports exponentiated coefficients or hazard ratios. The p-values, based on standard errors clustered at the optionpackage level, indicate the significance levels for whether the hazard ratios are significantly different from unity.*, **, and *** indicate statistical significance at the 10%, 5%, and 1% levels, respectively.
seasons for the nominated and nonnominated CEOs is significant at less thanthe 1% level.
To summarize, we reiterate that the first record date and the nominationstatus are both predetermined variables that neither a CEO nor a dissident caninfluence. The fact that the exercise patterns are intertwined with these featuresrenders proxy contests the most plausible explanation for CEOs’deviation from“normal” option exercise patterns.
2.4.3 Option exercise and sell and managerial entrenchment. Given ourmotivation to uncover private benefits of control from option exercises, itis natural to ask how our results interact with managerial entrenchment orcorporate governance. We proceed with the following pair of disjoint variables:Contest∗Entrenched and Contest∗Not Entrenched. The results are reported inTable 5.
In the first column, we classify firms into two groups using the Bebchuk,Cohen, and Ferrell (2009) E-Index, which counts the number of keyantitakeover provisions (the maximum number is six).17 Firms with E-Indexvalues higher than the sample median in a given year (the all-sample median is
17 We use the E-index rather than the G-index (Gompers, Ishii, and Metrick 2003), which is based on 24 takeoverdefenses, because the former has superior data availability.
1568
at Colum
bia University L
ibraries on June 27, 2016http://rfs.oxfordjournals.org/
Dow
nloaded from

Out-of-the-Money CEOs: Private Control Premium and Option Exercises
two) are considered “entrenched” and the complement set are “not entrenched.”In the second column, we classify firms into two groups depending on whetherthe boards are staggered. Firms with a staggered board structure are classifiedas “entrenched” (“not entrenched”). We single out staggered boards because theprovision is specifically designed to defend incumbent control in proxy contests.
We further consider a more direct entrenchment measure (in the thirdcolumn), Overpaid, a dummy variable indicating that during the year beforethe proxy contest a CEO was “overpaid,” defined as a CEO who receivestotal compensation (using the total contracted compensation, or “tdc1,” fromthe Execucomp database) of more than $1 million or more than one thirdover “normal” pay. “Normal” pay is the predicted value from a year-by-year compensation regression with the most common regressors used in theliterature: firm assets (in log), return on assets, book-to-market ratio, CEO age,age squared, CEO tenure (in log), and industry fixed effects based on two-digit SIC codes. The procedure results in about one quarter of the CEOs undercontest being classified as “overpaid.” These CEOs presumably have strongerincentives to defend their large pecuniary private benefits.
Results shown in Table 5 indicate that the deceleration of exercise and sellis more pronounced for “entrenched” CEOs—that is, CEOs who are alreadyequipped with more options to defend themselves against dissidence and whohad received compensation that appears excessive relative to their peers. Thedifferences in the Entrenched and Not Entrenched exercise behavior issignificant using all three entrenchment measures. Table 5 further reveals thatoption exercises serve as complements of, rather than substitutes for, otherdefenses. The voting rights associated with option exercises could be moreeffective in fending off non-control-aiming aggressive dissidence, which is notdeterred by conventional takeover defenses.
2.4.4 Option exercise and sell and value of votes to incumbents. Giventhat deviating from normal option exercise plans is costly for CEOs, theyshould be more likely to resort to the strategy when it is necessary orwhen the resulting incremental voting power is ex ante more important. Wereestimate the regressions after splitting the contest events into two groupscaptured by the two interaction terms Contests ∗ Votes are more needed andContest ∗ Votes are less needed.
First, market reaction upon the announcement of a proxy contest isinformative about the level of support the dissident enjoys from outsideshareholders. A CEO is facing greater challenges when the marketwarmly welcomes the emergence of a dissident. Accordingly, we codeVotes are more needed as one if the cumulative abnormal returns (CAR) duringthe 3 month period centered on the announcement month is positive.18 Results
18 The CARs are estimated using a four-factor (market, size, market to book, and momentum) model using 73monthly observations (or as many as are available) centered on the announcement month. The average CAR of
1569
at Colum
bia University L
ibraries on June 27, 2016http://rfs.oxfordjournals.org/
Dow
nloaded from

The Review of Financial Studies / v 29 n 6 2016
Table 6Exercise & sell and the likelihood that dissident shareholders will win the contest
Positive Voted Meeting SupportCAR contest delayed dissidents(1) (2) (3) (4)
Contest * votes are more needed 0.0000∗∗∗ 0.0000∗∗∗ 0.0000∗∗∗ 0.0000∗∗∗[0.0000] [0.0000] [0.0000] [0.0000]
Contest * votes are less needed 0.6888∗∗∗ 0.2563∗∗∗ 0.1757∗∗ 0.1947∗∗[0.5687] [0.0058] [0.0232] [0.0143]
Firm controls Yes Yes Yes Yes# Option package series 14,132 14,133 14,133 8,897# Option package months 641,991 643,958 643,283 410,460# Observations with y=1 2,953 2,959 2,959 1,888
Test of equality (p-val) 0.000∗∗∗ 0.000∗∗∗ 0.000∗∗∗ 0.000∗∗∗
This table follows the same regression specifications as in Table 3, except that the key variable Contest ispartitioned into a pair of disjoint variables, Contests ∗ Votes are more needed and Contest ∗ Votes are less needed.In Column (1), Votes are more needed indicates that the contest occurred at a firm with positive cumulativeabnormal returns (CAR) during the 3-month period centered on the announcement month. In Column (2),Votes are more needed indicates contests in which the outcome was ultimately determined by voting. In Column(3), Votes are more needed indicates that the contest occurred at a firm that delayed its annual meeting. InColumn (4), Votes are more needed indicates that either two top shareholder advisory companies (InstitutionalShareholder Services and Glass, Lewis & Co.) supported dissidents or at least one of the five shareholder advisorycompanies supports dissidents and nobody supports management. Firm-level control variables and year dummiesare included in the regressions but not reported. “Test of equality” tests the equality of the two coefficients usingchi tests. The table reports exponentiated coefficients or hazard ratios. The p-values, based on standard errorsclustered at the option package level, indicate the significance levels for whether the hazard ratios are significantlydifferent from unity. *, **, and *** indicate statistical significance at the 10%, 5%, and 1% levels, respectively.
are reported in the first column of Table 6, which shows that when the dissidentshave support from public investors, the CEOs almost completely stop exercise-and-sell transactions. In contrast, when the market reacts negatively to theannouncement of a proxy contest, the dissident—a minority shareholder whocan succeed only with the assistance of fellow shareholders—is unlikely towin. In that case, the CEOs slightly reduce exercises relative to normal rates,but not significantly so. The difference between the two rates is significant atthe 1% level.
In a similar vein, the market support for dissidents can also be captured by therecommendation of shareholder advisory companies, especially InstitutionalShareholder Services (ISS) and Glass, Lewis & Co. (GL). Several studiesshow that leading proxy advisors can sway substantial number of votes byinstitutional investors (Larcker, McCall, and Ormazabal 2014; Malenko andShen 2015). We hand collect information on voting recommendations fromEDGAR and news articles for five shareholder advisory companies: ISS, GL,PROXY Governance, Proxy Monitor, and Egan-Jones. ISS advised in 378proxy contests, GL in 184 contests, and the three remaining companies advisedin 157 contests. Votes are more needed is coded one if either of the two topadvisors supports the dissidents, or at least one of the five advisors supports thedissidents and nobody supports management. In about 30% of proxy contests
the [-1, +1] month window is 5.1%, and 58.8% of the events have positive CAR, indicating that market generallyperceives proxy contests as bringing value-enhancing changes.
1570
at Colum
bia University L
ibraries on June 27, 2016http://rfs.oxfordjournals.org/
Dow
nloaded from

Out-of-the-Money CEOs: Private Control Premium and Option Exercises
this indicator equals one. The result shown in Column (4) of Table 6 revealsthat CEOs completely stop exercise-and-sell transactions when dissidents getsupport from shareholder advisory companies, presumably when the insidersare in greater need of their own votes.
Second, we expect the deviation from normal option exercises to be morepronounced when CEOs expect the contest to be a close call, such that CEOswould resort to any tactic to boost incumbent voting power. There are threemajor potential outcomes of a proxy contest: (1) In 15.7% of the cases, thedissident withdraws. These cases are clearly not ex ante close-calls. (2) Thedissident and the incumbent reach a settlement without going into a votingcontest in 24.7% of the cases. A settlement indicates that at least one party isnot confident about winning a fight. (3) About 44.6% of the announced contestsare ultimately resolved by a shareholder vote; in our sample, dissidents won63.4% of these voted contests. For events in the last group, both parties perceivea reasonable probability of winning, and hence these events are ex ante closecalls. Moreover, voting rights have ex post realized values only in this category.Indeed, the result shown in Column (2) of Table 6 reveals that among proxycontests that were ultimately determined by voting, CEOs virtually halt exerciseand sell to preserve all their voting rights. For the non-voted events, CEOsreduce the exercise-and-sell rate to about 25% of the normal level as potentialvoting rights may still boost the bargaining power in settlements or serve asdeterrents. The difference between the two is again significant at the 1% level.
Third, we expect the deviation from normal option exercises to be morepronounced when the meetings are delayed, usually at the incumbent board’sdiscretion to have more time to implement response plans or to build support forthe incumbent in the contest. As expected, meetings with contests are far morelikely to be delayed than meetings without contests: In our sample of proxycontests, 25% of the meetings were delayed. More importantly, the result shownin Column (3) of Table 6 reveals that CEOs completely stop exercise-and-selltransactions when the meeting is rescheduled to a future date, suggesting thatthe CEOs seek to preserve voting rights when they could become useful in thenear future.
The four tests reported in Table 6, built on different sources of datainformation, fully support the hypothesis that CEOs are more aggressive inpreserving voting power when the voting rights are ex ante more valuable.Arguably, the existence of a proxy contest is prima facie evidence of a “close”contest. Indeed, our hand-collected data (from annual proxy statements) alsoindicate that the ownership stakes of the two directly opposing blocks—theincumbent block (executive officials and board members) and the dissidentblock—are both substantial and quite close: The mean and median values areall close to 10%;19 the mean (median) difference is 1.29% (−1.30%); and the
19 Incumbent ownership at proxy contest targets is substantially higher than reported in earlier studies for generalsamples (Cheng, Nagar, and Rajan 2004; Rauh 2006). This is consistent with the hypothesis that proxy contests
1571
at Colum
bia University L
ibraries on June 27, 2016http://rfs.oxfordjournals.org/
Dow
nloaded from

The Review of Financial Studies / v 29 n 6 2016
quartile values are all within a tight range (seeTable 2). Refraining from exerciseand sell potentially allows insiders (CEOs and directors) to retain on averageabout 2% of the voting rights, which potentially serves as a poison-pill-likedeterrent for the proxy fight to stop before the voting stage.
Conditional on the actually voted contests (296 of them), insiders’ vestedoptions fall within the ex post winning margin in a majority of the cases buthave the potential to affect quite a few. We calculated the difference betweenthe number of shares cast in favor of the winning party and the number ofshares for the losing party, normalized by the number of shares outstanding.The average (median) winning margin is 33% (24%), but with high variance. Areallocation of 2% of voting rights from winners to losers could flip the votingoutcome in 36 contests, corresponding to more than 10% of the sample of votedcontests. Needless to say, option exercises are likely to be one of the tactics(e.g., soliciting large and small shareholders) that incumbents use in defendingcontrol challenges.
2.5 Determinants of exercise and holdModels of option exercises usually do not predict exercise and hold foreither diversification or liquidity motives. Instead, exercise and hold is usuallypredicted to be driven by frictions such as taxation (Cicero 2009).20 In thissection, we analyze the effect of proxy contests on exercise and hold.
Results from the competing risk model are reported in Table 7. Thespecifications are the same as in Table 3 except that Exercise&hold is nowthe main risk and Exercise&sell becomes the competing risk. Consistent withthe hypotheses presented in Section 1.2, the probability of exercise and holdincreases considerably by about 50% (significant at the 10% level) in the fullsample. However, the change is not significant for the Execucomp sample.Thus, CEOs of smaller firms accelerate option exercises to own more shares,but the effect does not prevail among firms in Execucomp, which includes onlyfirms in the S&P 1500 Index.21
Table 7 shows that variables that indicate a high time value of options(Year to maturity and Idio volatility) are associated with a lower incidenceof exercise and hold. Additionally, our proxy for higher fundamental value(Stock ret) predicts fewer exercises. %CEO firm wealth is significantly andpositively related to exercise and hold. This relation is exactly opposite to the
were launched against firms with more “powerful” insiders who may not yield to more modest forms ofshareholder activism.
20 Most option grants are “non-qualified” for tax purposes. For such option grants, the exercise premium is taxed atthe ordinary income level, whereas the ensuing gains are taxed as capital gains. As such, CEOs who are privatelyinformed about positive news about a stock should exercise the options and hold the stock for the duration ofprice appreciation to minimize taxes. In our sample, however, we do not find more highly accelerated exerciseand hold when future stock returns are higher among the target firms.
21 The exercise and hold intensity for non-CEO insiders increases from 0.97% 3 years before proxy contest to1.32% during the proxy contest year, corresponding to a 35% increase.
1572
at Colum
bia University L
ibraries on June 27, 2016http://rfs.oxfordjournals.org/
Dow
nloaded from

Out-of-the-Money CEOs: Private Control Premium and Option Exercises
Table 7Exercise & hold and proxy contests: Hazard model with competing risk
(1) (2) (3)
Contest 1.6031∗ 1.7318∗ 0.5342[0.0629] [0.0658] [0.5287]
Years to maturity 0.8817∗∗∗ 0.9036∗∗∗[0.0000] [0.0000]
Market cap 0.7505∗∗∗ 0.8163∗∗∗[0.0000] [0.0001]
BM 0.8260∗∗ 1.1832[0.0285] [0.3524]
Growth 1.5959∗∗∗ 1.6203∗∗∗[0.0000] [0.0033]
Stock ret 0.9366 0.8140∗∗[0.1868] [0.0455]
Idiosyncratic vol 1.0763 0.7329[0.6455] [0.4413]
Illiquidity 0.9935 1.7182[0.9522] [0.3173]
Dividend yld 0.1861∗ 0.0232∗∗[0.0536] [0.0144]
Dividend record month 1.4199∗∗∗ 1.2151[0.0000] [0.1188]
Earnings month 1.0603 1.1591[0.3681] [0.1585]
New grant 8.7289∗∗∗ 7.6156∗∗∗[0.0000] [0.0000]
CEO age 0.9977[0.7642]
CEO tot wealth 1.0847[0.1285]
% CEO wealth in firm 3.4119∗∗∗[0.0000]
Year dummies Yes Yes Yes
# Option package series 19,058 14,133 8,384# Option package months 1,024,673 643,958 356,882# Observations with y=1 2,767 1,739 963
This table shows the determinants of CEO exercise-and-hold decisions. Results are presented at the optionpackage–month level using the Cox proportional hazards model with competing risks (Fine and Gray 1999).The empirical methodology is described in Section 2.2. We estimate the relation between the subdistributionhazard rates and covariates for Exercise&hold as the main risk and Exercise&sell as the competing risk. Allindependent variables are defined in Section 2.1 and Table 1. All regressions include year dummies. The tablereports exponentiated coefficients or hazard ratios. The p-values, based on standard errors clustered at the optionpackage level, indicate the significance levels for whether the hazard ratios are significantly different from unity.*, **, and *** indicate statistical significance at the 10%, 5%, and 1% levels, respectively.
predicted outcome from diversification motives. As before, we interpret theresults as suggesting that some CEOs persistently accumulate shares in theirfirms. The earnings month has no effect on exercise and hold, presumablybecause no open-market transaction is involved. New grants make it morelikely that CEOs exercise options (significant at the 1% level), presumably tomaintain a target portfolio of unexercised options.
The effect of proxy contests on exercise and hold is consistent with theanalysis in Section 1 and complements the results regarding exercise andsell. Aggregated at the firm-year level, the unconditional probability that aCEO will have a major exercise and sell (exercise and hold) in a givenyear is 8.1% (4.8%), and our analyses indicate that the probability decreases
1573
at Colum
bia University L
ibraries on June 27, 2016http://rfs.oxfordjournals.org/
Dow
nloaded from

The Review of Financial Studies / v 29 n 6 2016
Table 8Exercise & hold dynamics around record dates
(1) (2)
Contest * before record date 5.0098∗∗∗ 4.6783∗∗∗[0.0000] [0.0000]
Contest * after record date 1.1054 1.0633[0.8337] [0.8966]
p-val for the difference 0.017∗∗ 0.016∗
No contest * before record date 1.8665∗∗∗[0.0114]
No contest * after record date 0.7123[0.4763]
p-val for the difference 0.0084∗∗∗p-val for the difference in differences 0.4799
Firm controls Yes Yes
# Option package series 14,133 14,133# Option package months 643,958 643,958# Observations with y=1 1,739 1,739
This table follows the same regression specifications as in Table 7 except that the key variable Contest ispartitioned into Contests ∗ Before record date and Contests ∗ After record date to indicate that the current month(associated with a proxy contest) is before or after the date of ownership record that entitles the holder tovoting rights at the upcoming meeting. In Column (2) we add to the regression two additional regressorsNo Contest ∗ Before Record Date and No Contest ∗ After Record Date, where the first dummy variable is codedone if the observation belongs to a matched firm during its proxy season in the same year and the month is equalor before the month including the record date, and the second dummy is defined analogously. The matched firmsare as described in Section 2.4.2. Firm-level control variables and year dummies are included in the regressionsbut not reported. Significance of differences is tested using chi tests. The table reports exponentiated coefficientsor hazard ratios. The p-values, based on standard errors clustered at the option package level, indicate thesignificance levels for whether the hazard ratios are significantly different from unity. *, **, and *** indicatestatistical significance at the 10%, 5%, and 1% levels, respectively.
(increases) to 2.0% (7.7%) during the year the firm experiences a proxycontest. Out of the 1,029 proxy contests, if all CEOs maintain their normalrates of exercise and sell (exercise and hold), we should observe about 83(49) of them exercise and sell (exercise and hold) during the proxy seasons;in fact we observe only 21 selling CEOs but 79 holding ones. To form amore specific connection between exercise and hold and proxy contests, weexplore the dynamics of exercise-and-hold decisions around record dates. Werepeat the analysis in Column (2) of Table 7 with the same firm-level controlsexcept we replace the single variable Contest with a pair of disjoint variables:Contest∗Before record date and Contest∗After record date. In Table 8, wereport only the coefficients on these new variables because the coefficients onthe control variables are nearly identical to those in Table 7 and add no insights.
Results shown in Table 8 conform nicely to our hypotheses. Indeed, theacceleration of exercise and hold is more pronounced before a proxy contestreaches a resolution, especially before the record date where the differencein the before-and-after exercise behavior is significant. Equally interestingunusually high rates of exercise and hold by CEOs stop mostly at the recorddate, consistent with the needs to have shares by that time to boost actual votingpower. It thus appears that exercise and hold is about acquiring actual votingrights.
1574
at Colum
bia University L
ibraries on June 27, 2016http://rfs.oxfordjournals.org/
Dow
nloaded from

Out-of-the-Money CEOs: Private Control Premium and Option Exercises
Based on reasoning that is similar to that offered in Section 2.4.2, weseparate the effect of the proxy contests from that of the record dates duringnon-contested proxy processes by adding to the regression two dummyvariables: No Contest∗Before record date and No Contest∗After record date.These variables are the same as those shown in Column (2) of Table 4 andcapture whether firms with similar characteristics exhibit the same exercisebehavior before and after the record date in non-contested proxy seasons. Theresults, reported in Column (2) of Table 8, reveals an interesting and significant(at the 1% level) acceleration of exercise and hold by CEOs right before therecord dates during normal proxy seasons, suggesting that CEOs desire votingrights at the annual meetings even when there is no hostile contest. This couldhappen when dissidents put forward shareholder proposals for voting at theannual meeting without launching a proxy contest.22
There are, however, two important distinctions between contests and non-contests. First, the ratio of the exercise-and-hold rate before and after the recorddate during contests is around 4.4 to 1, while the same ratio for non-contests is2.6 to 1. That is, the desire to grab more voting rights right before the recorddate is stronger when there is a proxy contest. Second, the extra shares acquiredvia option exercises before the record date do not substitute for exercise andhold afterwards (the coefficient of 1.063 indicates a rate that is very close to thenormal level). During a normal proxy season, CEOs’ above-normal exercise-and-hold rates before the record dates is followed by slightly below-normalrates afterwards, leading to fewer extra shares acquired during the whole proxyseason. Thus, while it affirms the role that record dates play in a general setting(with or without contests), Table 8 highlights the distinct effect of proxy contestson CEOs’ share acquisitions via option exercises.
2.6 Out-of-the-money exercisesMotivated by the Riggio/Barnes & Noble story introduced at the beginningof the study, we conduct a systematic analysis of OTM option exercises. Anyoption model that assumes a common valuation of the underlying security rulesout exercising OTM options because the same shares could be acquired at thefair market price, which is lower than the strike price. For this reason, OTMoption exercises by insiders epitomize the valuation wedge between insidersand the outside market.
2.6.1 Data on out-of-the-money exercises. The main data source foranalyzing OTM exercises remains theThomson Reuters Insider Filing database.
22 Brav, Jiang, Partnoy, and Thomas (2008) show that hedge funds often launch their activist campaigns withshareholder proposals, and resort to the more aggressive proxy contests in about one-quarter of the cases.Although voting outcomes on the proposals are not legally binding, a voting outcome that is highly favorableto the dissidents will have a non-trivial negative impact on the firm/management because of public scrutiny andreputation concerns.
1575
at Colum
bia University L
ibraries on June 27, 2016http://rfs.oxfordjournals.org/
Dow
nloaded from

The Review of Financial Studies / v 29 n 6 2016
To identify OTM exercises, we do not rely exclusively on the transaction code inTIF—where “O” is coded for exercise of OTM derivative securities defined bythe SEC—because the coding severely under-classifies the frequency of thesetransactions. To link option exercises with the resulting simultaneous stockpurchases, we require both a “Disposition” coding of the options (in Table 2of Form 4) and an “Acquisition” coding of the stocks (in Table 1 of Form 4),with matching prices and number of shares.23 To be conservative, our baselinedefinition of OTM exercise is that the strike price exceeds the daily high price.
For the initially identified OTM exercise cases, we cross-check the strikeprice recorded in TIF with the original records in Form 4 filings, and thestock price recorded in CRSP with another source such as Yahoo Financeor Bloomberg. We declassify a case if any information source indicates thatthe exercise was in the money, or if there is a stock split around the time.Moreover, we further require a minimum exercise of 100 shares and a stockprice below $200. Using these filters, we uncover 1,497 OTM option exercisesbetween 1996 and 2012. We compute the negative exercise premium to be thedifference between the exercise price and the daily high price, scaled by thelatter. The median (average) premium is 13% (37%), and the interquartile rangeis 4% to 43%. The average (median) time to maturity is 1314 (1157) days atthe exercise point, comparable to the same figures for in-the-money options.
2.6.2 Determinants of out-of-the-money option exercises. This sectionexplores the determinants of OTM option exercises at the firm-year level. Thefirm/CEO variables are defined in the same way as in Section 2.1 except theyare now recorded at the firm-year level. The dependent variable, OT M , is adummy variable for the occurrence of any OTM option exercises. It capturesthe intensity of such events in a firm-year. We use the logit model for thisspecification.
The key independent variable is Contest, a dummy variable equal to oneif there is an announcement of a proxy contest for the same firm-year.Control variables include firm and CEO characteristics. As in Table 3, weexamine the relations using three nested samples with varying coverage byCRSP/Compustat and Execucomp. The results of this analysis are reportedin Table 9. In Columns (1) through (3) the analysis is performed in the fullsample. In Columns (4) through (6), the sample is restricted to include all firm-year observations where an insider has at least one vested OTM option duringat least some months of the year. We report the exponentiated coefficients,which represent multiples of “odds ratios” associated with a one-unit change inan independent variable. More specifically, the coefficient on Contest indicatesby how many times the odds ratio Pr(OTM)/[1−Pr(OTM)] (≈Pr(OTM)) will
23 This procedure avoids misclassification because of coincidence, for example, when a CEO is awarded optionsand simultaneously buys the same amount of stocks at the same price.
1576
at Colum
bia University L
ibraries on June 27, 2016http://rfs.oxfordjournals.org/
Dow
nloaded from

Out-of-the-Money CEOs: Private Control Premium and Option Exercises
Table 9Determinants of out-of-the-money (OTM) exercise
Sample Full Full Full Feasible set Feasible set Feasible set(1) (2) (3) (4) (5) (6)
Contest 2.6450∗∗∗ 2.7851∗∗∗ 3.4840∗∗ 3.4534∗∗∗ 3.7920∗∗∗ 7.0677∗∗∗[0.0074] [0.0050] [0.0366] [0.0021] [0.0012] [0.0034]
Log(market cap) 0.9578 1.0156 0.9152∗ 1.0071[0.3653] [0.9124] [0.0801] [0.9601]
BM 1.0392 0.9554 1.0477 0.8484[0.7263] [0.7949] [0.6892] [0.4413]
Growth 1.1264 0.2873∗ 1.2788∗∗ 0.3249[0.2460] [0.0854] [0.0135] [0.1936]
Stock ret 1.0812 0.6396 0.5572 0.5444[0.9442] [0.8493] [0.6171] [0.8103]
Idiosyncratic vol 1.5380∗∗ 3.3490∗∗ 1.3709 2.3231[0.0168] [0.0349] [0.1389] [0.1770]
Illiquidity 0.8475 0.9140 1.0660 1.4318[0.1936] [0.9124] [0.6101] [0.7039]
CEO total wealth 1.1267 1.0613[0.3077] [0.6455]
% CEO wealth in firm 0.5298 0.5828[0.2380] [0.3320]
CEO age 1.0004 1.0053[0.9840] [0.7795]
% Own top five 0.4153 1.8138[0.6892] [0.8103]
Year dummies Yes Yes Yes Yes Yes Yes
Pseudo R2 0.88% 1.02% 3.52% 2.75% 3.98% 5.06%Observations 90,341 83,834 25,594 11,755 11,316 4,660E(Y) 0.37% 0.38% 0.31% 2.88% 2.81% 1.67%# Observations with y=1 334 319 79 339 318 78
This table reports determinants of OTM exercises with three specifications at the firm-year level. All independentvariables are defined in Section 2.1 and Table 1. The dependent variable is OTM—a dummy variable forthe occurrence of OTM option exercises. The columns report odds ratios from logit models and the p-valuesassociated with the original (unexponentiated) coefficients, which indicate whether the reported odds ratios aresignificantly different from unity. In Columns (1) to (3), the analysis is performed using the full sample. InColumns (4) to (6), the sample is restricted to include only firm-year observations where an insider has vestedOTM options during at least 1 month of the year. All p-values in this table are calculated using heteroscedasticityrobust standard errors and are clustered by firm. *, **, and *** indicate statistical significance at the 10%, 5%,and 1% levels, respectively.
multiply when there is a proxy contest for the firm in the same year, relative tothe odds ratio in a non-contest firm-year.
The results in the first two columns of Table 9 indicate that the probability ofan OTM exercise increases by 2.6–2.8 times (i.e., from about 0.4% to 1.1%).The effect is stable when including firm-level controls, and is significant atthe 1% level in both specifications. When limited to the sample covered byExecucomp, the coefficient on Contest increases to 3.5, and is significant at the5% level.
As a robustness check, we restrict the analysis to a “feasible set,” (i.e., firm-year observations where an insider has vested OTM options during at least somemonths of the year). Results shown in the last three columns of Table 9 indicatethat the effect of proxy contests on the probability of an OTM exercise is botheconomically meaningful and statistically significant. While the probability ofOTM exercises ranges from 1.7% to 2.9% in this restricted sample, the sameprobability rises to 9.9% to 11.8% when a proxy contest is looming.
1577
at Colum
bia University L
ibraries on June 27, 2016http://rfs.oxfordjournals.org/
Dow
nloaded from
The Review of Financial Studies / v 29 n 6 2016
Most firm and CEO characteristics do not predict OTM exercises. Thisis not surprising as the conventional model would predict no such eventsregardless of the conditions of the firm or the CEO. The only notable exceptionis Idiosyncratic vol, which is significant at the 5% level with an economicallymeaningful magnitude: An interquartile change in the variable leads to a 1.2–1.7 times increase in the probability of an OTM exercise (imputed fromthe coefficients reported in Columns (2) and (3)). There are two potentialexplanations for the significance of Idiosyncratic vol. First, high stock volatilitymay overwhelm a modest difference between the current market price and thestrike price, and an OTM option could easily become in-the-money shortly.Second, some in-the-money option exercises might become out of the moneybetween the decision to exercise and the actual execution because of the highvolatility. These forces are largely orthogonal to proxy contests. Moreover, itwould require a four standard-deviation change in Idiosyncratic vol to generatethe same effect on the odds ratio as a proxy contest. Hence the presence of aproxy contest is, by far, the dominant determinant of OTM exercises.
In this context reverse causality—that is, the idea that shareholders are morelikely to launch proxy contests when insiders acquire shares out of the money—is implausible. However, it is possible that some unobserved factors (such asCEO characteristics) could drive both option exercise patterns and the firm’svulnerability to proxy contests. To assess the importance of this hypothesis, wereestimate the models in Columns (1) to (3) of Table 9 using the conditionallogit model with CEO (or firm) fixed effects to filter out firm/CEO-specifictraits. Results are reported in the Appendix (Supplementary Table A4). We findthat the odds ratios associated with Contest are stable across all specifications.We therefore infer that circumstances, rather than unobserved personal (orfirm) characteristics, lead to OTM exercises. Overall, results suggest that theincumbents may resort to OTM exercises to defend their control of the firm.
Needless to say, the majority of the OTM exercises do not have proxy contestsin sight. Other explanations for OTM exercises include data recording errors,high stock price volatility, funding of the exercise prices by the firm, and atax motive.24 This study establishes a relation between proxy contests and thepropensity of CEOs to exercise OTM options, revealing the extent to whichinsiders are willing to go as a last resort to enhance their voting power.
3. The Premium Insiders Pay for Control: Inferences from Option Exercises
The previous sections have demonstrated consistent patterns of option exerciseanomalies when proxy contests are in sight. Given the exercise distortionsreported in this study, a natural follow-up question asks how large of a pricepremium insiders pay for control. Our earlier results indicate that the presence
24 Data recording errors include simple clerical errors and incidences of option repricing that were not properlyupdated in the filings. The tax motive is analogous that explained in Footnote 20.
1578
at Colum
bia University L
ibraries on June 27, 2016http://rfs.oxfordjournals.org/
Dow
nloaded from
Out-of-the-Money CEOs: Private Control Premium and Option Exercises
of a proxy contest is associated with a reduction in the annual rate of exerciseand sell from a normal level of 5.3% to close to zero (0.8%). Additionally,Hypothesis 1 discussed in Section 1.2 indicates that a deceleration of exerciseand sell could be generated by a valuation wedge between the insider and themarketplace.
To calibrate the implied parameter b (the incremental private valuation), weapply the certainty equivalent approach adopted in Hall and Murphy (2002).25
We begin by estimating the value of an option for a risk-averse insider assumingthe insider exercises the option optimally. We then impose an exogenous no-exercise window (“delay”) of varying length and reassess the value of theoption for the insider. By construction, the value of the call option to theinsider under the constrained exercise policy is lower than it would be underan optimal exercise policy. The reduction in the option value corresponds tothe loss in option value the insider is willing to bear for delaying exercise andsell when facing a proxy contest. Finally, we calculate the reduction in thestock value under the unconstrained regime needed to equate the option valuesunder the two regimes. The reduction in the stock valuation is an estimateof the price insiders pay for delaying exercise and sell when facing proxycontests.
The default parameters are set to reflect the conditions of a typical optionpackage in our sample: the exercise price (X) is $30, time to maturity (T ) isfour years, and the option is currently 50% in the money in proportion to thecurrent stock price. We assume that the stock pays no dividends, β =1, rf =6%, σ =30%, rm−rf =6.5%. Following Hall and Murphy (2002), we assumethe insider’s utility over wealth is U (W )≡ (1/(1−ρ))W 1−ρ , where ρ is theconstant relative risk aversion (CRRA) coefficient. We adopt the Capital AssetPricing Model (CAPM) and assume that the distribution of stock prices in T
years is lognormal with volatility σ and that the expected return is equal to(rf +β(rm−rf )−σ 2/2)T , where β is the firm’s systematic risk loading andrm is the return on the market portfolio. The calibration results are reported inTable 10.
Table 10 presents three variations in time to maturity (4, 2, and 8 years inPanels A, B, and C), three variations in relative risk aversion (ρ =2, 3, and 10),and two variations in CEO wealth in the firm (50% and 75%). These are thestandard permutations adopted in the literature. Our benchmark is “no delay”(0% delay), where we report the option value to the insider. We then calibrate theinsider option values with delays in exercise equal to 25%–100% of the options’remaining life. For example, for an option with four years to expiration, thiscorresponds to a forced delay of 1–4 years in exercise.
Our key interest lies in the numbers in the “% Change” and “ImpliedDiscount” columns in Table 10. “% Change” is the percentage change in option
25 Because these models implicitly assume that insiders exercise options for the sole purpose of selling, we do nothave a structural procedure to infer the private valuation premium from accelerated exercise and hold.
1579
at Colum
bia University L
ibraries on June 27, 2016http://rfs.oxfordjournals.org/
Dow
nloaded from

The Review of Financial Studies / v 29 n 6 2016
Tabl
e10
Opt
ion
valu
atio
nw
ith
dela
yin
exer
cise
&se
ll
0%D
elay
25%
Del
ay50
%D
elay
75%
Del
ay10
0%D
elay
CR
RA
%O
fw
ealth
Opt
ion
Opt
ion
Impl
ied
Opt
ion
Impl
ied
Opt
ion
Impl
ied
Opt
ion
Impl
ied
coef
.in
stoc
kva
lue
valu
e%
Cha
nge
disc
ount
valu
e%
Cha
nge
disc
ount
valu
e%
Cha
nge
disc
ount
valu
e%
Cha
nge
disc
ount
(1)
(2)
(3)
(4)
(5)
(6)
(7)
(8)
(9)
(10)
(11)
(12)
(13)
(14)
(15)
Pane
lA:T
ime
tom
atur
ity4
year
s;m
oney
ness
50%
20.
532
.832
.7−0
.2%
0.1%
32.4
−1.2
%0.
7%31
.7−3
.1%
1.8%
30.8
−5.9
%3.
5%2
0.67
30.5
30.0
−1.6
%0.
9%28
.9−5
.2%
2.8%
27.5
−9.9
%5.
4%25
.9−1
5.2%
8.4%
30.
530
.429
.6−2
.5%
1.3%
28.1
−7.4
%4.
0%26
.3−1
3.5%
7.3%
24.1
−20.
5%11
.2%
30.
6730
.027
.1−9
.6%
4.8%
24.2
−19.
2%9.
6%21
.3−2
8.9%
14.4
%18
.4−3
8.8%
19.6
%10
0.5
30.0
21.1
−29.
8%14
.9%
14.4
−52.
2%26
.1%
9.2
−69.
3%34
.6%
5.2
−82.
6%42
.3%
100.
6730
.017
.5−4
1.8%
20.9
%9.
4−6
8.7%
34.3
%4.
5−8
5.1%
42.8
%1.
6−9
4.5%
51.0
%
Pane
lB:T
ime
tom
atur
ity2
year
s;m
oney
ness
50%
20.
531
.030
.9−0
.1%
0.0%
30.8
−0.5
%0.
3%30
.5−1
.4%
0.7%
30.2
−2.5
%1.
3%2
0.67
30.0
29.5
−1.6
%0.
8%28
.8−3
.9%
1.9%
28.1
−6.5
%3.
3%27
.2−9
.3%
4.7%
30.
530
.029
.2−2
.7%
1.3%
28.3
−5.8
%2.
9%27
.2−9
.4%
4.7%
26.0
−13.
3%6.
6%3
0.67
30.0
27.9
−7.0
%3.
5%25
.9−1
3.5%
6.8%
24.0
−20.
0%10
.0%
22.1
−26.
4%13
.2%
100.
530
.023
.4−2
1.9%
10.9
%17
.9−4
0.4%
20.2
%13
.3−5
5.7%
27.9
%9.
4−6
8.7%
34.3
%10
0.67
30.0
20.7
−30.
8%15
.4%
13.5
−55.
1%27
.5%
8.2
−72.
6%36
.3%
4.5
−84.
9%42
.4%
Pane
lC:T
ime
tom
atur
ity8
year
s;m
oney
ness
50%
20.
536
.636
.5−0
.3%
0.2%
35.7
−2.4
%1.
6%34
.2−6
.7%
4.5%
31.9
−12.
8%8.
6%2
0.67
32.6
32.0
−1.8
%1.
1%30
.2−7
.4%
4.6%
27.6
−15.
4%9.
5%24
.5−2
4.8%
15.6
%3
0.5
32.4
31.6
−2.5
%1.
5%29
.2−9
.7%
5.9%
26.1
−19.
5%12
.0%
22.3
−31.
1%19
.3%
30.
6730
.227
.4−9
.2%
4.9%
23.5
−22.
2%12
.2%
19.2
−36.
3%20
.4%
14.9
−50.
6%29
.3%
100.
530
.020
.2−3
2.5%
16.3
%12
.9−5
6.8%
28.6
%7.
4−7
5.4%
40.0
%3.
3−8
9.1%
52.1
%10
0.67
30.0
16.1
−46.
5%23
.2%
7.9
−73.
7%37
.1%
3.2
−89.
4%49
.0%
0.8
−97.
4%61
.6%
Thi
sta
ble
repo
rts
the
valu
esof
stoc
kop
tions
with
anex
erci
sepr
ice
of$3
0an
dm
oney
ness
that
is50
%of
the
mar
ketp
rice
usin
gth
eH
alla
ndM
urph
y(2
002)
met
hod.
The
optio
nva
lue
ises
timat
edas
the
gran
t-da
teca
shaw
ard
that
yiel
dsth
esa
me
expe
cted
utili
tyto
the
insi
der
asre
ceiv
ing
the
optio
n.T
hein
side
rex
ecut
ive
isas
sum
edto
have
aco
nsta
ntre
lativ
eri
skav
ersi
on(C
RR
A)u
tility
func
tion
with
anin
itial
wea
lthof
$5m
illio
nsp
litbe
twee
nri
skle
ssca
shan
dco
mpa
nyst
ock.
The
stoc
kpr
ice
islo
gnor
mal
and
retu
rns
follo
wth
eC
apita
lAss
etPr
icin
gM
odel
(CA
PM).
We
assu
me
the
stoc
kpa
ysno
divi
dend
s,β
=1,
r f=
6%,σ
=30
%,r
m−r
f=
6.5%
.Pan
els
Ath
roug
hC
prov
ide
vari
atio
nsin
time
tom
atur
ity(4
,2,a
nd8
year
s).I
nea
chpa
nel,
the
forc
edde
lay
inex
erci
sera
nges
from
0%to
100%
ofth
etim
eto
mat
urity
.“O
ptio
nva
lue”
isth
eva
lue
ofth
eop
tion
from
the
exec
utiv
e’s
pers
pect
ive.
“%C
hang
e”is
the
perc
enta
gech
ange
inop
tion
valu
ere
lativ
eto
the
unco
nstr
aine
dop
tion
exer
cise
polic
y.“I
mpl
ied
Dis
coun
t”is
the
equi
vale
ntre
duct
ion
inst
ock
pric
eun
der
the
unco
nstr
aine
dre
gim
eth
ateq
uate
sth
eva
lue
ofth
eop
tion
with
the
dela
yin
exer
cise
toth
atun
der
the
optim
alex
erci
sepo
licy.
1580
at Colum
bia University L
ibraries on June 27, 2016http://rfs.oxfordjournals.org/
Dow
nloaded from
Out-of-the-Money CEOs: Private Control Premium and Option Exercises
value relative to the unconstrained option exercise policy. “Implied Discount”is the equivalent reduction in stock price under the unconstrained regime thatequates the value of the option with the delay in exercise to the value underthe optimal exercise policy. Suppose our default benchmark is an insider witha CRRA coefficient of 3 and with 50% of her wealth in the firm who exercisesoptions optimally given her diversification needs but lacks any control motives.Imposing a one-year “no–exercise” window on an option with four yearsto expiration will cause a 2.5% reduction in option value, corresponding to1.3% of the stock’s value. Imputed on the average stock market capitalization($4,180 million) and the average size of vested options held by CEOs (1.8%of outstanding shares), the delay amounts to a reduction of $1.9 million in thevalue of options to the insider. The numbers quickly rise to 28.9% and 14.4%if the delay is for three years. In other words, it is as if the insiders value thestocks about 10-15% above the market price so that they exhibit the same delayin exercising in the absence of a control motive.
4. Conclusion
This study explores how CEOs’ (and insiders’) private benefits of control arereflected in their option exercise behavior. Through a series of analyses, thestudy documents that CEOs distort their option exercise behavior to boosttheir voting power before proxy contests. CEOs are significantly less (more)likely to exercise options to sell (hold) the resulting shares when a proxycontest is looming, and the results are more pronounced when the voting rightsare ex ante more important. Our study uncovers a novel motive underlyingCEO option exercises and highlights the role of proxy contests in addressingmanagerial agency issues.
Appendix. Proofs for Hypotheses Development
Assume the following standard setting and notation: St is stock price at time t ; T is the expirationdate of an American call option; X is the exercise price of the option; and C(St ,T −t,X) is thevalue of option. The stock pays no dividends. The two conditions are the same as those stated inSection 1.1.
We first show formally how the private benefits of control affect an insider’s incentives toexercise in-the-money options before maturity. We consider two types of early exercises: an earlyexercise with an intention to sell the stock and an early exercise with an intention to hold thestock.
Proposition 1. If the insider’s personal valuation (S∗t ) is higher than the market price of the stock
(St ), the insider is less likely to exercise an option to sell the stock.
Proof. If the insider holds the stock, his personal valuation of the stock is higher than the marketprice, S∗
t >St . Therefore, the insider will not find it profitable to sell the stock. �Proposition 1 leads to Hypothesis 1.
1581
at Colum
bia University L
ibraries on June 27, 2016http://rfs.oxfordjournals.org/
Dow
nloaded from
The Review of Financial Studies / v 29 n 6 2016
However, the record dates for proxy contests or dividends might trigger an early exercise of acall option. Next, we provide two propositions that can facilitate early exercises of call options forthe purpose of holding the resulting shares.
Proposition 2. Under Condition 1, the insider is more likely to exercise an option before maturitywith an intention to hold the stock if the stock pays a constant dividend yield qd >0, comparedwith the situation in which the private control premium is zero (b=0).
Proof. When a stock pays a constant dividend yield, an early exercise takes place if the stockprice exceeds a threshold. A positive private benefit (b>0) has a positive effect on the insider’svaluation and therefore makes an early exercise more likely. �
Proposition 3. Under Conditions 1 and 2, the insider is more likely to exercise an option beforematurity and to intend to hold the stock, compared with the situation in which b=0.
Proof. Holding the stock delivers a convenient yield qc >0 because it reduces the potentialconstraint the insider faces when open–market purchases are prohibited. The effect of theconvenient yield qc on the early exercise policy is similar to the effect of the dividendyield. �
Propositions 2 and 3 lead to Hypothesis 2.We next discuss the conditions under which an insider exercises an option out of the money.
Proposition 4. If Conditions 1 and 2 are satisfied, the insider might exercise a call option outof the money at maturity. The insider might also exercise a call option out of the money beforematurity if date τ is before the maturity date of the option (τ <T ), and the insider assigns a positivevalue to the voting rights that will result from holding the shares on date τ (e.g., the proxy contestrecord date).
Proof. If the insider exercises a call option at maturity, his payoff is S∗T −X>ST −X (Condition
1). If b is sufficiently large, S∗T −X>0>ST −X. That is, the insider can find it profitable to
exercise a call option out of the money. Condition 2 is necessary because if ST −X<0, theinsider prefers to purchase shares in the open market at cost ST instead of paying the exerciseprice X.
Let G be the value the insider assigns to holding a share of the stock on date τ ; the value G
is related to the private benefits of control b because the voting rights from holding the shareshelp to defend control. The insider will exercise a call option out of the money (i.e., Sτ −X<0)if S∗
τ+ +G−X>C(S∗τ+,T −τ+,X). Therefore, an OTM exercise is possible for a sufficiently high
G. Because a call option’s delta is less than unity, the effect of b on S∗τ+ is larger than its effect on
C(S∗τ+,T −τ+,X), making early exercise more likely. Again Condition 2 is necessary because the
insider would otherwise prefer to purchase shares in the open market at cost Sτ+ instead of payingthe exercise price X. �
Lastly we show that if a stock pays a dividend, it makes an OTM exercise even more likely inthe presence of a proxy contest.
Proposition 5. The insider is more likely to exercise a call option out of the money beforematurity if Conditions 1 and 2 hold and the dividend record date is before the maturity date of theoption.
Proof. On the dividend record date, the insider will exercise a call option out of the money(Sτ+ +D−X<0) if S∗
τ+ +D−X>C(S∗τ+,T −τ+,X). Higher b will make option exercises more
likely because its effect on S∗τ+ +D−X is higher than its effect on the time value because the delta
1582
at Colum
bia University L
ibraries on June 27, 2016http://rfs.oxfordjournals.org/
Dow
nloaded from

Out-of-the-Money CEOs: Private Control Premium and Option Exercises
of a call option is below unity. Condition 2 is necessary because the insider would otherwise preferto purchase shares in the open market at cost Sτ+ +D instead of paying the exercise price X. �
Propositions 4 and 5 lead to Hypothesis 3.
References
Aggarwal, R., P. Saffi, and J. Sturgess. 2012. Does proxy voting affect the supply and/or demand for securitieslending? Working Paper, Georgetown University.
Albuquerque, R. and Schroth, E. (2010). Quantifying private benefits of control from a structural model of blocktrades. Journal of Financial Economics 96:33–55.
Amihud,Y. 2002. Illiquidity and stock returns: Cross-section and time-series effects. Journal of Financial Markets5:31–56.
Barclay, M., and C. Holderness. 1989. Private benefits from control of public corporations. Journal of FinancialEconomics 25:371–95.
Bartov, E., and P. Mohanram. 2004. Private information, earnings manipulations, and executive stock-optionexercises. Accounting Review 79:889–920.
Bebchuk, L., A. Cohen, and A. Ferrell. 2009. What matters in corporate governance? Review of Financial Studies22:783–827.
Bertrand, M., and S. Mullainathan. 2003. Enjoying the quiet life? Corporate governance and managerialpreferences. Journal of Political Economy 111:1043–75.
Bradley, M., A. Brav, I. Goldstein, and W. Jiang. 2010. Activist arbitrage: A study of open-ending attempts ofclosed-end funds. Journal of Financial Economics 95:1–19.
Brav, A., W. Jiang, F. Partnoy, and R. Thomas. 2008. Hedge fund activism, corporate governance, and firmperformance. Journal of Finance 63:1729–75.
Carpenter, J., and B. Remmers. 2001. Executive stock option exercises and inside information. Journal of Business74:513–34.
Carpenter, J., R. Stanton, and N. Wallace. 2010. Optimal exercise of executive stock options and implicationsfor firm cost. Journal of Financial Economics 98:315–37.
———. 2014. The importance of behavioral factors in the exercise and valuation of employee stock options.Working Paper, New York University.
Carpenter, J. (1998). The exercise and valuation of executive stock options. Journal of Financial Economics48:127–58.
Cheng, S., V. Nagar, and M. Rajan. 2004. Identifying control motives in managerial ownership: Evidence fromantitakeover legislation. Review of Financial Studies 18:637–72.
Christoffersen, S., C. Geczy, D. Musto, and A. Reed. 2007. Vote trading and information aggregation. Journalof Finance 62:2897–929.
Cicero, D. 2009. The manipulation of executive stock option exercise strategies: Information timing andbackdating. Journal of Finance 64:2627–63.
Cremers, M., and A. Ferrell. 2014. Thirty years of shareholder rights and firm valuation. Journal of Finance,forthcoming.
Detemple, J. and Sundaresan, S. 1999. Nontraded assets valuation with portfolio constraints:Abinomial approach.Review of Financial Studies 12:835–72.
Dittmann, I., and E. Maug. 2007. Lower salaries and no options? On the optimal structure of executive pay.Journal of Finance 62:303–43.
1583
at Colum
bia University L
ibraries on June 27, 2016http://rfs.oxfordjournals.org/
Dow
nloaded from
The Review of Financial Studies / v 29 n 6 2016
Dyck, A., and L. Zingales. 2004. Private benefits of control: An international comparison. Journal of Finance59:537–600.
Fine, J. and R. Gray. 1999. A proportional hazards model for the subdistribution of a competing risk. Journal ofthe American Statistical Association 94:496–509.
Fos, V., and M. Tsoutsoura. 2014. Shareholder democracy in play: Career consequences of proxy pontests.Journal of Financial Economics 114:316–40.
Fos, V. 2015. The disciplinary effects of proxy contests. Management Science, forthcoming.
Frydman, C., and D. Jenter. 2009. SEC Rule 10b5-1 and insiders’strategic trade. Management Science 55:224–39.
Gompers, P., J. Ishii, and A. Metrick. 2003. Corporate governance and equity prices. Quarterly Journal ofEconomics 118:107–56.
Hall, B., and K. Murphy. 2002. Stock options for undiversified executives. Journal of Accounting and Economics33:3–42.
Hauser, S., and B. Lauterbach. 2004. The value of voting rights to majority shareholders: Evidence from dual-classstock unifications. Review of Financial Studies 17:1167–84.
Heath, C., S. Huddart, and M. Lang. 1999. Psychological factors and stock option exercise. Quarterly Journalof Economics 114:601–27.
Huddart, S., and M. Lang. 1996. Employee stock option exercises: An empirical analysis. Journal of Accountingand Economics 21:5–43.
Huddart, S., and M. Lang. 2003. Information distribution within firms: Evidence from stock option exercises.Journal of Accounting and Economics 34:3–31.
Kalay, A., O. Karakas, and S. Pant. 2014. The market value of corporate votes: Theory and evidence from optionprices. Journal of Finance 69:1235–71.
Karpoff, J., and P. Malatesta. 1989. The wealth effects of second-generation state takeover legislation. Journalof Financial Economics 25:291–322.
Klein, D., and E. Maug. 2011. How do executives exercise their stock options. Working Paper, University ofMannheim.
Larcker, D.,A. McCall, and G. Ormazabal. 2014. Outsourcing shareholder voting to proxy advisory firms. Journalof Law and Economics, forthcoming.
Lease, R., J. McConnell, and W. Mikkelson. 1983. The market value of control in publicly-traded corporations.Journal of Financial Economics 11:439–71.
Levy, H. 1983. Economic evaluation of voting power of common stock. Journal of Finance 38:79–93.
Malenko, N., and Y. Shen. 2015. The role of proxy advisory firms: Evidence from a regression-discontinuitydesign. Working Paper, Boston College.
Malmendier, U., and G. Tate. 2005a. CEO overconfidence and corporate investment. Journal of Finance 60:2661–700.
Malmendier, U., and G. Tate. 2005b. Does overconfidence affect corporate investment? CEO overconfidencemeasures revisited. European Financial Management 11:649–59.
Nenova, T. 2003. The value of corporate voting rights and control: A cross-country analysis. Journal of FinancialEconomics 68:325–51.
Rauh, J. 2006. Own company stock in defined contribution pension plans: A takeover defense? Journal ofFinancial Economics 81:379–410.
Sharara, N., and A. Hoke-Witherspoon. 1993. The evolution of the 1992 shareholder communication proxy rulesand their impact on corporate governance. Business Lawyer 49:327–58.
1584
at Colum
bia University L
ibraries on June 27, 2016http://rfs.oxfordjournals.org/
Dow
nloaded from
Out-of-the-Money CEOs: Private Control Premium and Option Exercises
Sircar, R., and W. Xiong. 2007.Ageneral framework for evaluating executive stock options. Journal of EconomicDynamics and Control 31:2317–49.
Zingales, L. 1994. The value of the voting right: A study of the Milan stock exchange experience. Review ofFinancial Studies 7:125–48.
Zingales, L. 1995. What determines the value of corporate votes? Quarterly Journal of Economics 110:1047–73.
1585
at Colum
bia University L
ibraries on June 27, 2016http://rfs.oxfordjournals.org/
Dow
nloaded from