out-migration from hill region of uttarakhand: issues...
TRANSCRIPT

OUT-MIGRATION FROM HILL REGION OF UTTARAKHAND: ISSUES AND POLICY OPTIONS
Rajendra P. Mamgain and D.N. Reddy
Sponsored by
S.R. Sankaran Chair for Rural Studies, National Institute of Rural Development, Hyderabad
GIRI INSTITUTE OF DEVELOPMENT STUDIES
Sector O, Aliganj Housing Scheme Lucknow – 226 024
Phones: 2321860, 2332640
E-mail: [email protected]; Website: www.gids.org.in
2
CONTENTS
Page No.
I. The Issue
4
II Demographic Changes in Uttarakhand
7
III. Growth and Regional Inequalities
11
IV. Outmigration, Magnitude and Its Impact
14
Magnitude 14
Migration process 18
Contribution of Migration to Household Income 19
Impact of Migration on Village Economy and Society 20
Impact of Migration on Women’s Work 25
V. Understanding Drivers of Migration 26
Employment and Its Quality 28
Low Earnings 33
Village Infrastructure, Its Quality and Infrastructure 36
Constraints Identified by Villagers 39
VI. Policy Initiatives 41
Policy Issues 44
Lack of Pro-active Policies for attracting Return
Migrants
45
Role of Migrants and Their Diasporas 46
VII. Conclusion 47
References 50
3
Tables
Page No.
Table 1
Demographic Features of Uttarakhand and India, 2011
8
Table 2
Household Size-Class Distribution of Villages and
Population, 2011
10
Table 3
Village-size wise Population Growth, 2001-11
10
Table 4
Magnitude of Out-migration
16
Table 5
Educational Level of Sample Population (7 Years plus) by
Type of Household
17
Table 6
Number of Households who have completely Out-migrated
during
last Ten Years in Sample Villages
18
Table 7
Use of Remittances
21
Table 8
Work Participation Rate (%)
28
Table 9
Status of Employment among Non-migrant Workers (%)
29
Table 10
Status of Employment
29
Table 11
Structure of Employment among Social Groups (Per cent)
33
Table 12
Percentage Distribution of Total Persondays by Range of
per Personday Average Earnings in Hill districts of
Uttarakhand
34
Table 13
Reasons for Migration
35
Figures
Figure 1 Sectoral Composition of GSDP in Uttarakhand (2002-12)
(at 2004-05 prices)
12
Figure 2 Per capita Net District Domestic Product, 2010-11 (at current
prices) (Rs. ‘00)
13
Figure 3 Average Monthly Income and Expenditure of Agriculture
Households (Rs.)
14
Figure 4 Indebtedness among Agriculture Households in Select
States, 2013
14

4
OUTMIGRATION FROM HILL REGION OF UTTARAKHAND:
ISSUES AND POLICY OPTIONS
I. THE ISSUE
A distinct feature of economic growth in India relates to increase in inequalities across its
regions and various social groups over the last six decades of development planning (Planning
Commission, 2013). The persistence of inequalities in income levels is largely attributable to the
failure to develop basic economic infrastructure across several regions of the country and
unequal access to income opportunities for persons belonging to various social groups. This led
occasionally to a demand for smaller states in India. The arguments in the backdrop were of
better governance and resultant economic efficiency in the use of state resources, thereby leading
to improved income opportunities. The creation of Uttarakhand as a new state of the Indian
Union on November 9, 2000 is also largely linked with the economic backwardness of the
region. The major aspirations of common people from their new State included, among others,
creation of better employment opportunities for them. This in turn was expected to arrest the
existing large scale out-migration of able-bodied youth, mainly educated males, from the hill
regions of Uttarakhand. Other expectations relate to improved access to infrastructure facilities
such as electricity, road, telecommunications, health and education, thus leading towards better
living conditions for the population residing in the hill districts of the State.
The development experience of Uttarakhand over a nearly one and half decade has been
quite encouraging in respect to achieving high economic growth. However, such growth has
been mainly centred in three plain districts of the State, and ten hill districts remaining far behind
in this increasing prosperity of the state (GoUK, 2013-14 Annual Plan). Most of the economic
opportunities have been developed in plain parts of the state. As a result, population in hill
region of the state has yet to struggle hard for eking out their livelihoods largely from agriculture
by putting larger numbers of their household members into the labour force (Mamgain, 2004).
As a result, the pace of out-migration could not slow down from the hill districts of the state after
its formation. Rather it has accelerated during the recent years. This is reflected by the latest
results of Population Census 2011. It shows a very slow growth of population in most of the
mountain districts of the state. An absolute decline in the population in two districts, namely,

5
Almora and Pauri Garhwal in 2011 as compared to the year 2001 is a testimony of huge out-
migration. Historically, these districts had well developed social indicators in comparison to
many other districts of the state. The pace of out-migration is so huge that many of the villages
are left with a population in single digit. In fact, this situation seems to arise due to an alarming
increase in the out-migration from these two districts during the past, which is mainly associated
with the lack of economic opportunities in the region and increasing pressure on local economy.
In brief, the fruits of development could not reach to these districts which could have otherwise
created out-migration reducing impact in the form of increased opportunities of economic and
social well-being. The alarming de-population of villages in remote and border areas has raised
the concern of security of the borders of the country falling along with the hill districts of
Uttarakhand. This is in fact, a serious policy challenge that deserves immediate attention.
It is believed that due to lack of any policy and programme for attracting the skills and
abilities of return migrants, a large number of out-migrants tend to settle permanently outside
their villages along with their households. This has increased the tendency of out-migration of an
entire household. The migration has also adversely affected the source areas in terms of loss of
educated and experienced human resources, which could otherwise would have been utilized
locally (Mamgain, 2004). The increased migration process in Uttarakhand’s hill districts thus
could hardly transform the local economy in the form of increased flow of remittances as has
been seen in Kerala and to some extent, Bihar (Deshangikar and Farrington, 2009).
At the same time, there are evidences to suggest that how farm diversification in Rawain
valley in Uttarkashi district has transformed its local economy with the help of local
development agencies and government support. Evidence also suggests the role of NGOs in
promoting cooperatives of small and marginal farmers in hill districts of Pithoragarh and
Champawat and reducing their vulnerabilities (CBED, 2012). These experiences have
encouraging impact on the local economy in a form of reduced out-migration of semi-skilled and
unskilled poor cultivating households associated with their improved their earnings.
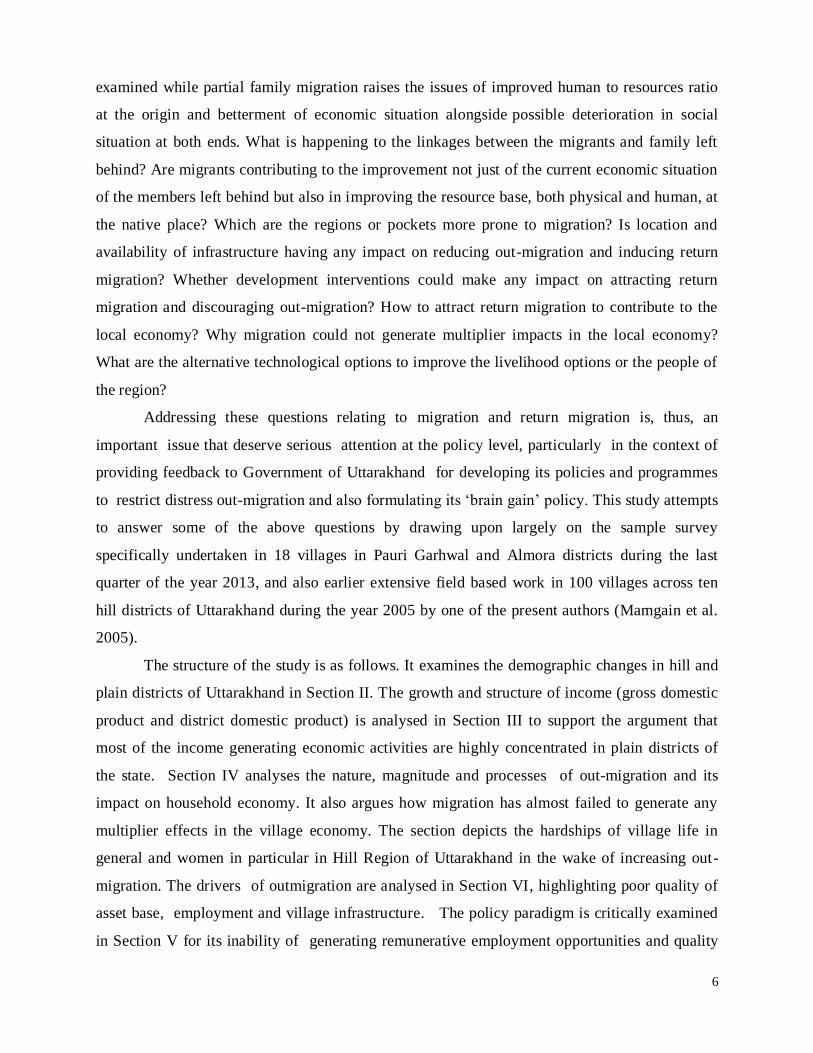
There are several aspects relating to migration that need to be looked at from the
viewpoints of enhancing understanding and policy and action. What is the magnitude of out-
migration? Are people being pushed by depletion of livelihood resources or are migrating
because they are in a position both in terms of capabilities and opportunities for really better
avenues elsewhere? Migration of the whole family and villages which leaves the question of
the use of abandoned resources for economic and environmental regeneration needs to be
6
examined while partial family migration raises the issues of improved human to resources ratio
at the origin and betterment of economic situation alongside possible deterioration in social
situation at both ends. What is happening to the linkages between the migrants and family left
behind? Are migrants contributing to the improvement not just of the current economic situation
of the members left behind but also in improving the resource base, both physical and human, at
the native place? Which are the regions or pockets more prone to migration? Is location and
availability of infrastructure having any impact on reducing out-migration and inducing return
migration? Whether development interventions could make any impact on attracting return
migration and discouraging out-migration? How to attract return migration to contribute to the
local economy? Why migration could not generate multiplier impacts in the local economy?
What are the alternative technological options to improve the livelihood options or the people of
the region?
Addressing these questions relating to migration and return migration is, thus, an
important issue that deserve serious attention at the policy level, particularly in the context of
providing feedback to Government of Uttarakhand for developing its policies and programmes
to restrict distress out-migration and also formulating its ‘brain gain’ policy. This study attempts
to answer some of the above questions by drawing upon largely on the sample survey
specifically undertaken in 18 villages in Pauri Garhwal and Almora districts during the last
quarter of the year 2013, and also earlier extensive field based work in 100 villages across ten
hill districts of Uttarakhand during the year 2005 by one of the present authors (Mamgain et al.
2005).
The structure of the study is as follows. It examines the demographic changes in hill and
plain districts of Uttarakhand in Section II. The growth and structure of income (gross domestic
product and district domestic product) is analysed in Section III to support the argument that
most of the income generating economic activities are highly concentrated in plain districts of
the state. Section IV analyses the nature, magnitude and processes of out-migration and its
impact on household economy. It also argues how migration has almost failed to generate any
multiplier effects in the village economy. The section depicts the hardships of village life in
general and women in particular in Hill Region of Uttarakhand in the wake of increasing out-
migration. The drivers of outmigration are analysed in Section VI, highlighting poor quality of
asset base, employment and village infrastructure. The policy paradigm is critically examined
in Section V for its inability of generating remunerative employment opportunities and quality
7
infrastructure in hill districts and resultant out-migration for creating present demographic
vacuum. The Concluding Section offers policy interventions to promote employment
opportunities in Hill Region of Uttarakhand.
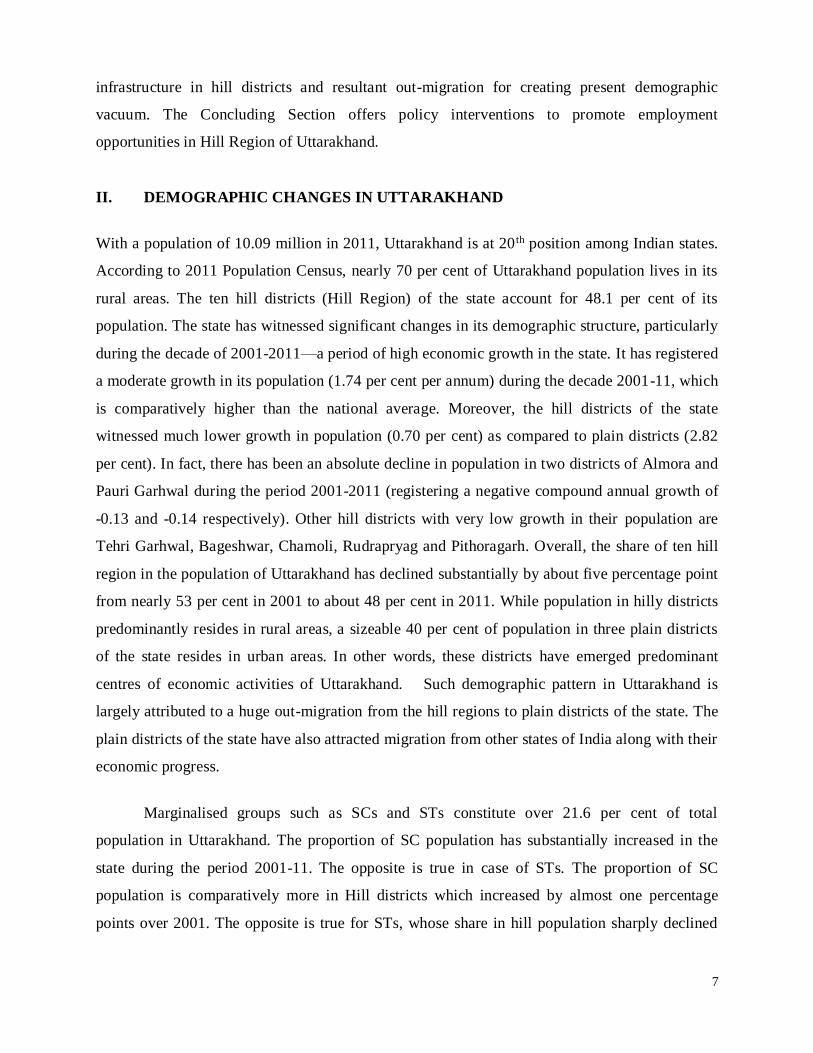
II. DEMOGRAPHIC CHANGES IN UTTARAKHAND
With a population of 10.09 million in 2011, Uttarakhand is at 20 th position among Indian states.
According to 2011 Population Census, nearly 70 per cent of Uttarakhand population lives in its
rural areas. The ten hill districts (Hill Region) of the state account for 48.1 per cent of its
population. The state has witnessed significant changes in its demographic structure, particularly
during the decade of 2001-2011—a period of high economic growth in the state. It has registered
a moderate growth in its population (1.74 per cent per annum) during the decade 2001-11, which
is comparatively higher than the national average. Moreover, the hill districts of the state
witnessed much lower growth in population (0.70 per cent) as compared to plain districts (2.82
per cent). In fact, there has been an absolute decline in population in two districts of Almora and
Pauri Garhwal during the period 2001-2011 (registering a negative compound annual growth of
-0.13 and -0.14 respectively). Other hill districts with very low growth in their population are
Tehri Garhwal, Bageshwar, Chamoli, Rudrapryag and Pithoragarh. Overall, the share of ten hill
region in the population of Uttarakhand has declined substantially by about five percentage point
from nearly 53 per cent in 2001 to about 48 per cent in 2011. While population in hilly districts
predominantly resides in rural areas, a sizeable 40 per cent of population in three plain districts
of the state resides in urban areas. In other words, these districts have emerged predominant
centres of economic activities of Uttarakhand. Such demographic pattern in Uttarakhand is
largely attributed to a huge out-migration from the hill regions to plain districts of the state. The
plain districts of the state have also attracted migration from other states of India along with their
economic progress.
Marginalised groups such as SCs and STs constitute over 21.6 per cent of total
population in Uttarakhand. The proportion of SC population has substantially increased in the
state during the period 2001-11. The opposite is true in case of STs. The proportion of SC
population is comparatively more in Hill districts which increased by almost one percentage
points over 2001. The opposite is true for STs, whose share in hill population sharply declined

8
during the decade (Table 1). The significant changes in the social composition of population also
indicate a faster out-migration among other social groups (mainly upper caste Hindus) from hill
districts of Uttarakhand.
Table 1
Demographic Features of Uttarakhand and India, 2011
Sl. No. Variable Uttarakhand India
Hill areas Plain areas Total
1. Population (in millions) 48.50 52.36 100.86 1210.86
2. 0-6 years population (%) 13.18 13.68 13.44 13.60
3. Population growth rate (2001-
2011)
0.70 2.82 1.74 1.64
4. Sex ratio (all age groups) 1037 900 963 943
5. Sex ratio (0-6 age group) 894 888 890 919
6. SC population (%) 20.91 16.78 18.76 16.6
7. ST population (%) 1.05 4.60 2.89 8.6
8. % Urban population 17.06 42.43 30.23 31.2
9. Literate population (%) 80.87 76.90 78.82 73.0
10. Workers (main plus marginal) 43.71 33.47 38.39 39.8
11. Male WPR 48.32 50.84 49.67 53.3
12. Female WPR 39.26 14.16 26.68 25.5
Source: Calculated from Primary Census Abstract, India and Uttarakhand, 2011
The sex ratio in hill areas has been comparatively high as compared to plain areas of the
state (Table 1). Such differences are not revealing in case of child sex ratio between hill and
plain districts of the state. This is, thus, mainly attributed to high incidence of male out-migration
from the hill areas (Mamgain, 2004). It is intriguing to observe a sharp decline in child sex ratio
by over 33 points in Hill Region of the state, whereas that remained almost same in plain districts
between 2001 and 2011. This throws up several questions such as growing passion for male child
among hill population and easy accessibility to select sex determination tests and female
feticides, mostly accessible in the medical facilities in the plain areas of the state. This revealing
phenomenon requires further in depth inquiry.

9
With a literacy rate of over 78.8 per cent Uttarakhand is much ahead to national average.
Literacy levels of population residing in hill areas are much higher than plain areas of the state;
however, such differences have significantly reduced over the decade with a faster improvement
in literacy levels in plain districts of the state. Gender-wise, literacy levels of females are lower
both in hill and plain areas of the state.
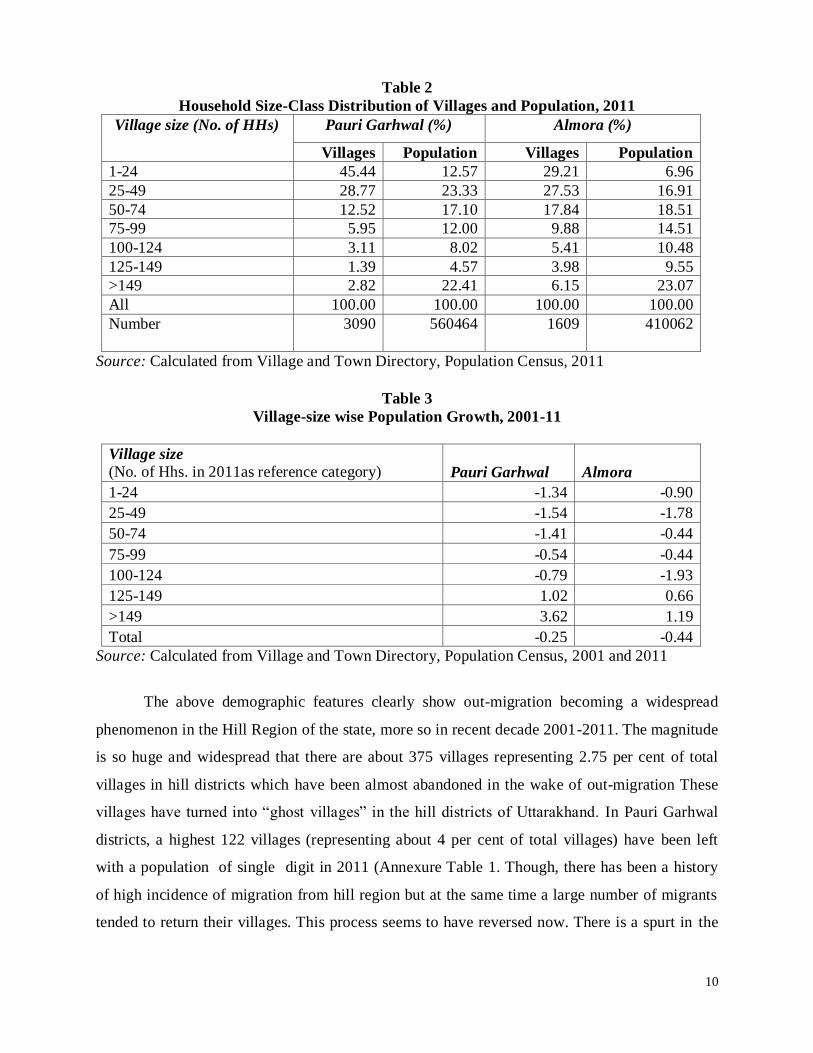
We have analysed the demographic changes in two districts of Almora and Pauri
Garhwal (districts having absolute decline of 8061 and 9807 persons in their population,
respectively between 2001 and 2011) across different village sizes. While a large number of
villages (about 45.4 per cent) in Pauri Garhwal have an average size of less than 25 households,
the village size in Almora is relatively bigger. Villages with over 100 households account for 7.3
percent and 15.5 per cent of total villages in Pauri Garhwal and Almora districts, respectively. In
terms of share in population, the smaller villages (less than 50 households) account for about 36
per cent population of Pauri Garhwal villages and about 24 percent that in Almora. Larger
villages (with more than 100 households) account for 35 per cent and 43 per cent of total village
population in Pauri and Almora respectively (Table 2). In other words, population is widely
dispersed across various sizes of villages, yet large villages though numbering few have largest
share in population in both the districts.
How has been the population growth across different size groups of villages during 2001-
2011? By taking 2011 as base year for the categorization of villages into their household class
sizes, we have traced back the villages in 2001 for understanding the increase/decrease in their
population and number of households. It emerges that maximum absolute decline in population
has been in smaller villages in both the districts. This has been also observed across villages with
up to 124 households. In rest of the bigger villages population growth has been rather positive
and well above one per cent during the decade 2001-2011 (Table 3). It merits mention that the
bigger villages are mainly the rural market places which have grown over the years. In later
section, we shall argue that in smaller villages the hardships of social and economic life become
more pronounced as compared to large villages, thus, posing as a serious reason for out-
migration.
10
Table 2
Household Size-Class Distribution of Villages and Population, 2011
Village size (No. of HHs) Pauri Garhwal (%) Almora (%)
Villages Population Villages Population
1-24 45.44 12.57 29.21 6.96
25-49 28.77 23.33 27.53 16.91
50-74 12.52 17.10 17.84 18.51
75-99 5.95 12.00 9.88 14.51
100-124 3.11 8.02 5.41 10.48
125-149 1.39 4.57 3.98 9.55
>149 2.82 22.41 6.15 23.07
All 100.00 100.00 100.00 100.00
Number 3090 560464
1609 410062
Source: Calculated from Village and Town Directory, Population Census, 2011
Table 3
Village-size wise Population Growth, 2001-11
Village size
(No. of Hhs. in 2011as reference category) Pauri Garhwal Almora
1-24 -1.34 -0.90
25-49 -1.54 -1.78
50-74 -1.41 -0.44
75-99 -0.54 -0.44
100-124 -0.79 -1.93
125-149 1.02 0.66
>149 3.62 1.19
Total -0.25 -0.44
Source: Calculated from Village and Town Directory, Population Census, 2001 and 2011
The above demographic features clearly show out-migration becoming a widespread
phenomenon in the Hill Region of the state, more so in recent decade 2001-2011. The magnitude
is so huge and widespread that there are about 375 villages representing 2.75 per cent of total
villages in hill districts which have been almost abandoned in the wake of out-migration These
villages have turned into “ghost villages” in the hill districts of Uttarakhand. In Pauri Garhwal
districts, a highest 122 villages (representing about 4 per cent of total villages) have been left
with a population of single digit in 2011 (Annexure Table 1. Though, there has been a history
of high incidence of migration from hill region but at the same time a large number of migrants
tended to return their villages. This process seems to have reversed now. There is a spurt in the
11
outmigration of households. This situation can certainly not occur due to all round development
in these regions. In fact, this situation seems to arise due to an alarming increase in the out-
migration from Hill Region and more so from Pauri Garhwal and Almora districts during the
past, which is mainly associated with the lack of development opportunities in the region and
increasing pressure on local economy. In brief, the fruits of development could not reach to these
districts which could have otherwise created out-migration reducing impact in the form of
increased opportunities of economic and social well-being.
Such type of phenomenal changes in the demography of the region is a culmination of
various factors and has become a prime matter of concern for polity and society of the state. It
assumes more importance due to the fact that the main plank for the demand for the separate
state of Uttarakhand had been its economic backwardness due to which many people had to
resort to distress-driven migration to support their families. Such process still continues on a
larger scale and voices are now increasingly being raised about the utility of separate state for the
people residing in hill districts of Uttarakhand. Nobody knows if another movement again starts
for the separate hill state within Uttarakhand itself. Unfortunately, the issue of outmigration
could hardly find any space in the election manifestos of major political parties of the state
during state assembly elections in 2012. This is in fact, a serious policy challenge that deserves
immediate attention.
III. GROWTH AND REGIONAL INEQUALITIES
For understanding the dynamics of out-migration, it will be useful to briefly mention about the
pattern of economic growth and regional inequalities in Uttarakhand. Since its formation,
Uttarakhand witnessed an impressive growth of over 9 per cent in its gross state domestic
product (GSDP) during the period 2001-02 to 2011-12 (at 2004-05 prices). As a result, per
capita income of the State almost increased by 4.5 times from Rs. 19164 in 2001-02 to Rs. 92911
in 2011-12, and bypassed the national average growth since 2005-06 onwards. This growth is
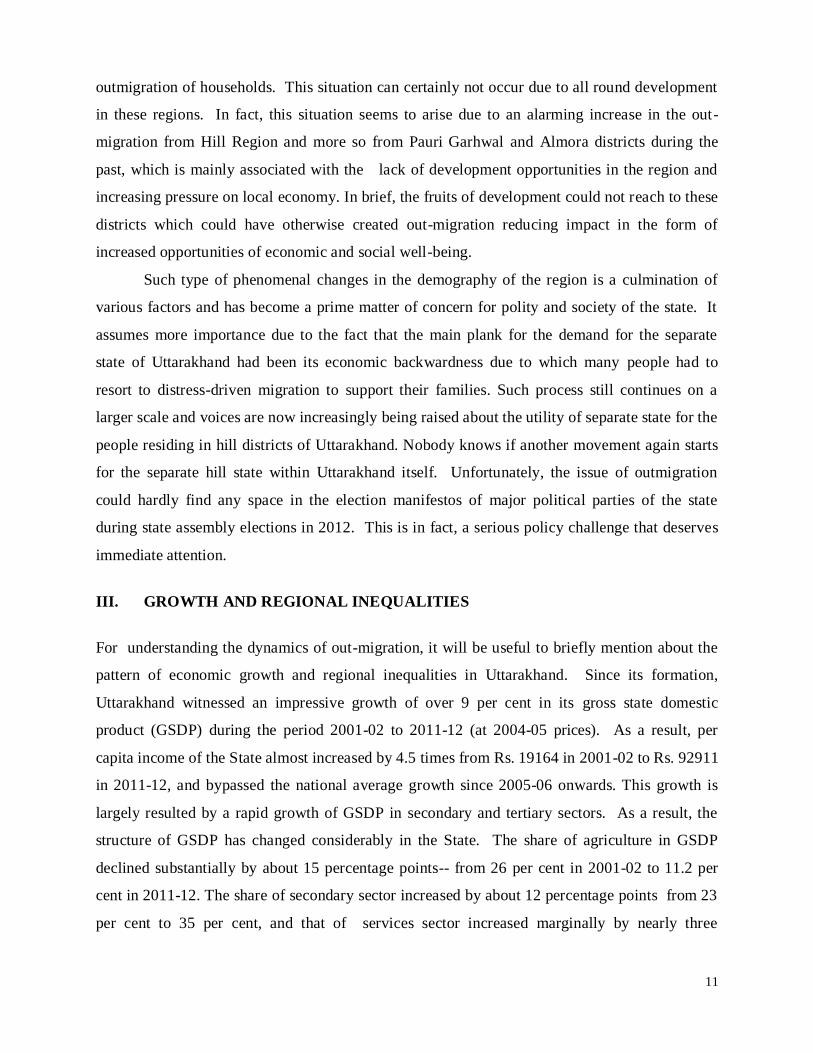
largely resulted by a rapid growth of GSDP in secondary and tertiary sectors. As a result, the
structure of GSDP has changed considerably in the State. The share of agriculture in GSDP
declined substantially by about 15 percentage points-- from 26 per cent in 2001-02 to 11.2 per
cent in 2011-12. The share of secondary sector increased by about 12 percentage points from 23
per cent to 35 per cent, and that of services sector increased marginally by nearly three
12
percentage points from 51 per cent to 54 per cent (Figure 1). The credit for this impressive
growth largely goes to the Industrial Policy of Uttarakhand which provided several incentives to
attract private industries to the State.
Figure 1: Sectoral Composition of GSDP in Uttarakhand (2002-12) at 2004-05 prices
Source: Author’s calculation based on CSO Data.
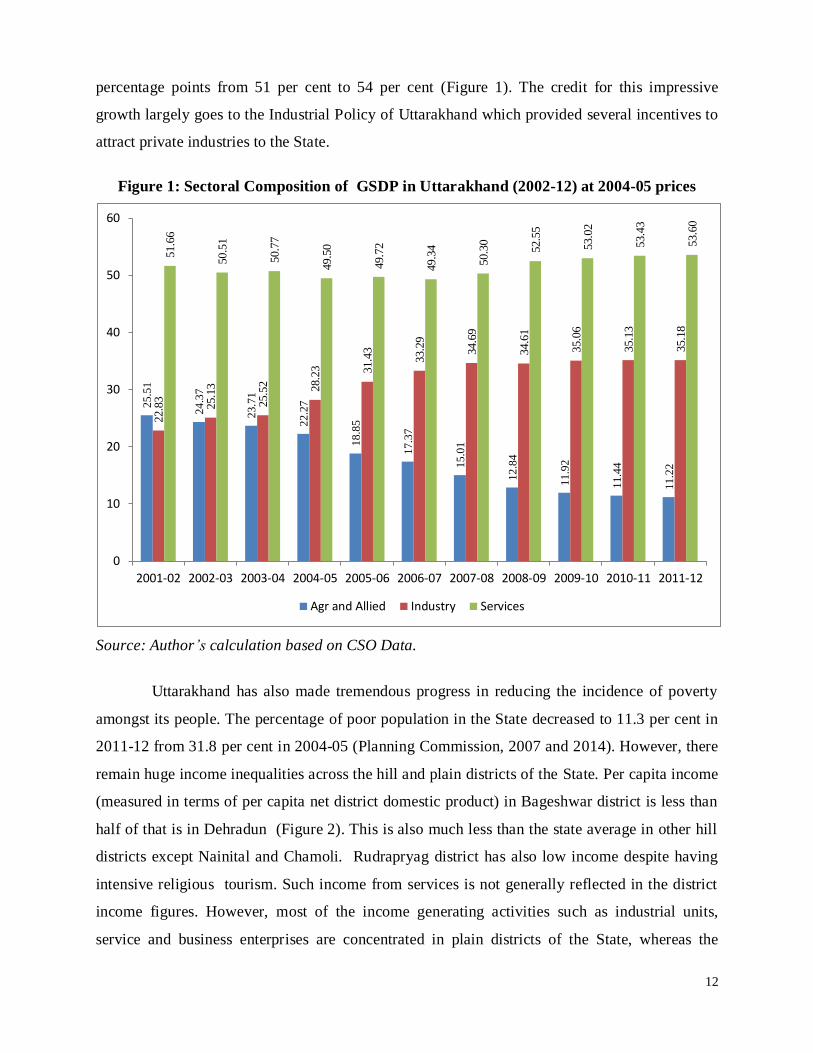
Uttarakhand has also made tremendous progress in reducing the incidence of poverty
amongst its people. The percentage of poor population in the State decreased to 11.3 per cent in
2011-12 from 31.8 per cent in 2004-05 (Planning Commission, 2007 and 2014). However, there
remain huge income inequalities across the hill and plain districts of the State. Per capita income
(measured in terms of per capita net district domestic product) in Bageshwar district is less than
half of that is in Dehradun (Figure 2). This is also much less than the state average in other hill
districts except Nainital and Chamoli. Rudrapryag district has also low income despite having
intensive religious tourism. Such income from services is not generally reflected in the district
income figures. However, most of the income generating activities such as industrial units,
service and business enterprises are concentrated in plain districts of the State, whereas the
25
.51
24
.37
23
.71
22
.27
18.8
5
17
.37
15
.01
12
.84
11
.92
11
.44
11
.22
22.8
3
25.1
3
25.5
2 28.2
3 31.4
3
33.2
9
34.6
9
34.6
1
35.0
6
35.1
3
35.1
8
51.6
6
50.5
1
50.7
7
49.5
0
49.7
2
49.3
4
50.3
0
52.5
5
53.0
2
53.4
3
53.6
0
0
10
20
30
40
50
60
2001-02 2002-03 2003-04 2004-05 2005-06 2006-07 2007-08 2008-09 2009-10 2010-11 2011-12
Agr and Allied Industry Services
13
population in hill districts is mainly dependent on agriculture and allied activities and that too
largely carried as subsistence with abysmally low levels of productivity (Mamgain, 2004).
According to latest NSSO 70th Round (January-December 2013), nearly 72 per cent of
net income of agriculture households in Uttarakhand is contributed by cultivation ( 53 per cent)
and animal husbandry (18 per cent). Wages contribute another 22.7 per cent. The corresponding
share of at national level is nearly 60 per cent. In neighbouring state of Himachal Pradesh the
share is about 45 per cent, indicating larger dependence on agriculture and allied activities in
Uttarakhand. The average monthly income per agriculture household, therefore, is low in
Uttarakhand (Rs. 4701) as compared to India (Rs.4923) and Himachal Pradesh (Rs. 8777).
Figure 2: Per capita Net District Domestic Product, 2010-11 (at current prices) (Rs. ‘00)
Source: Statistical Dairy Uttarakhand, 2011-12, Directorate of Economics and Statistics,
Government of Uttarakhand.
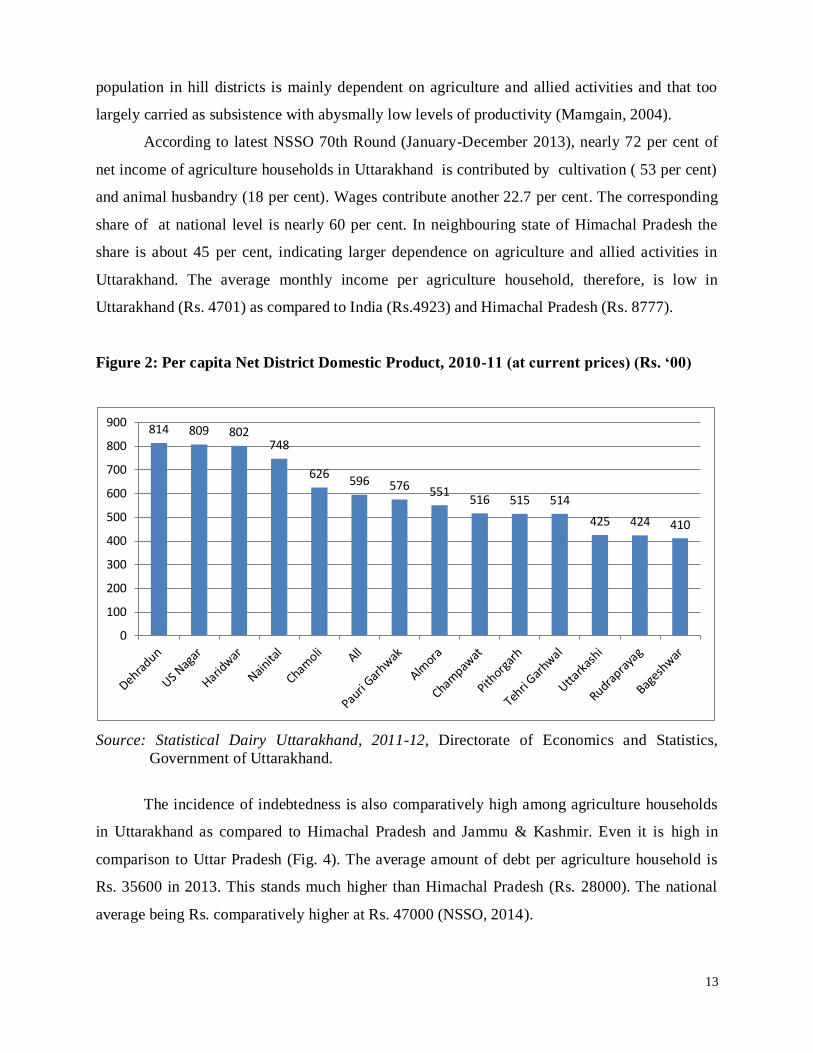
The incidence of indebtedness is also comparatively high among agriculture households
in Uttarakhand as compared to Himachal Pradesh and Jammu & Kashmir. Even it is high in
comparison to Uttar Pradesh (Fig. 4). The average amount of debt per agriculture household is
Rs. 35600 in 2013. This stands much higher than Himachal Pradesh (Rs. 28000). The national
average being Rs. comparatively higher at Rs. 47000 (NSSO, 2014).
814 809 802748
626596 576 551
516 515 514
425 424 410
0
100
200
300
400
500
600
700
800
900

14
Figure 3: Average Monthly Income and Expenditure of Agriculture Households (Rs.)
Source: NSSO 70th Round, GoI-NSSO, 2014
Fig.4: Indebtedness among Agriculture Households in Select States, 2013
Source: NSSO 70th Round, GoI-NSSO, 2014
IV. OUTMIGRATION, ITS MAGNITUDE AND IMPACT
Migration in Uttarakhand has been a historical process. The demography and ethnography of Hill
Regions in Uttarakhand has been influenced by a large in-migration from other parts of the
0
2000
4000
6000
8000
10000
12000
14000
Uttarkhand HimachalPradesh
J & K Uttar Pradesh India
4701
8777
12683
4923
64265784
7134
9017
6230 6223
Income
0
10
20
30
40
50
60
Uttarkhand HimachalPradesh
J & K Uttar Pradesh India
50.8
27.930.7
43.8
51.9
15
mainland during 11th and 12th century and later years (Atkinson, 1822-88; Walton, 1910).
Natives as well as migrants cleared jungles and developed farm land for cultivation through their
hard labour over centuries. With the creation of Garhwal and Kumaon army Regiments during
the British rule, local youth got regular employment on a large number for the first time in the
region. This necessitated out-migration of local youth for few years who generally returned to
their villages after the end of their service tenure. There had been seasonal migration of males
from upper hills to clear the jungles in lower Shivalik hills (Walton, 1910). This initial exposure
to outside world had a major influence on building acceptance of livelihood based on migration.
The situation has changed substantially in recent decades with a large number of population out-
migrating permanently along with families from the Hill Region of the State mainly to eke out
their livelihoods and better future of their children. This has become a widespread phenomenon
in hill districts, resulting in absolute decrease in population in few districts such as Almora and
Pauri Garhwal and very slow growth in other hilly districts during recent decade.
A number of studies have been undertaken in the past to understand the dynamics of out-
migration and its impact on local economy (see Bora, 1996; Mamgain, , 2004; Awasthi, 2012).
For understanding the recent patterns in migration, we have collected information from 18
sample villages from Pauri Garhwal and Almora districts covering 217 households during the
period September-December 2013.1 Our survey results show as high as 88 per cent of sample
rural households reported at least one person migrating for employment from their households
(Table 4). Such widespread magnitude of migration has been also reported by earlier studies (see
Bora, 1996; Mamgain, et al, 2005; Awasthi, 2012), which of course have been intensified in
recent decade.
In conformity with earlier studies on migration, most of the sample migrants are men,
young, educated and belong to Other castes in hill districts of Uttarakhand. About 86 per cent of
migrants are males, a highest 51.4 per cent are in the age-group 30-49 years and another 35.5
per cent in the age-group 15-29 years. The percentage of SCs is proportionately less among
1 The sample villages were selected purposively from amongst those which witnessed absolute decline in their
population during the decade 2001-2011 by taking into account size as well as social composition of villages. The
sample consists of 217 rural households. For our purpose, we have excluded migration related to marraige. Out-
migration is defined as those household members who were not living in their villages at least since last two months
preceding the date of survey due to their job and/or education.

16
migrants. This is mainly due to weak social networks of SCs at the place of destination.
However, their proportion has substantially increased in recent years.
Table 4
Magnitude of Out-migration
Duration Male Female Person
Number Per cent Number Per cent Number Per cent
Short duration
migration (2-6 months) 36 11.0 3 4.6 39 10.0
Long duration
migration (6-12
months)
251 77.0 35 53.8 286 73.1
Permanent migration
(more than 12 months) 39 12.0 27 41.5 66 16.9
Total 326 100.0 65 100.0 391 100.0
Sample population 650 50.2 468 13.9 1118 35.0
Source: Field Survey
A distinguishing feature of out-migration in Uttarakhand is its being of a predominantly
longer duration. In our sample, about 90 per cent of out-migrants are longer duration migrants
(Table 4). This is contrary to the pattern observed in several studies in other parts of the country
which report the preponderance of short duration migration among the rural households—mostly
of a circular nature (see Srivastava, 2011; Unesco, 2013). This is mainly due to the fact that an
overwhelming majority (nearly 74 per cent) of out-migrants of Uttarakhand has salaried jobs
which are generally of longer duration. Alone 16 per cent of migrants are employed in
government salaried employment and another 12 per cent are students. Another 10 per cent are
engaged in domestic works, who are largely women migrants. A fairly high percentage of
women (nearly 27 per cent) are students. Unlike rural out-migrants from Bihar or eastern Uttar
Pradesh, they do not migrate to agriculturally prosperous regions for short-term employment in
agriculture (Mamgain, 2004). Their relatively better educational attainments have facilitated
them to seek employment in salaried jobs, though necessarily not fetching decent income to most
of them.
Migrants have comparatively better educational attainments as compared to their non-
migrants counterparts. Nearly half among them have high school/higher secondary level
education and another 36.4 per cent are graduate and above (Table 5). The inter-social group

17
differences in educational levels are also quite significant with SCs remaining much behind than
their Other caste counterparts (Table 5).
Table 5
Educational Level of Sample Population (7 Years plus) by Type of Household
Educational level Type of household Total
Migrant Non-Migrant
All Illiterate 1.3 15.1 10.0
Up to Middle 12.4 45.7 33.4
High School and
Higher Secondary
49.9 30.3 37.5
Graduate and above 36.4 8.5 18.8
SC Illiterate 1.1 19.1 13.7
Up to Middle 23.9 56.9 46.9
High School and
Higher Secondary
59.1 20.1 31.8
Graduate and above 15.9 3.4 7.2
General Illiterate 1.4 13.3 8.5
Up to Middle 9.0 40.5 28.0
High School and
Higher Secondary
46.7 35.0 39.7
Graduate and above 42.9 11.0 23.7
Note: Migrant household is defined a household which has at least one person migrated out for
job and/or education.
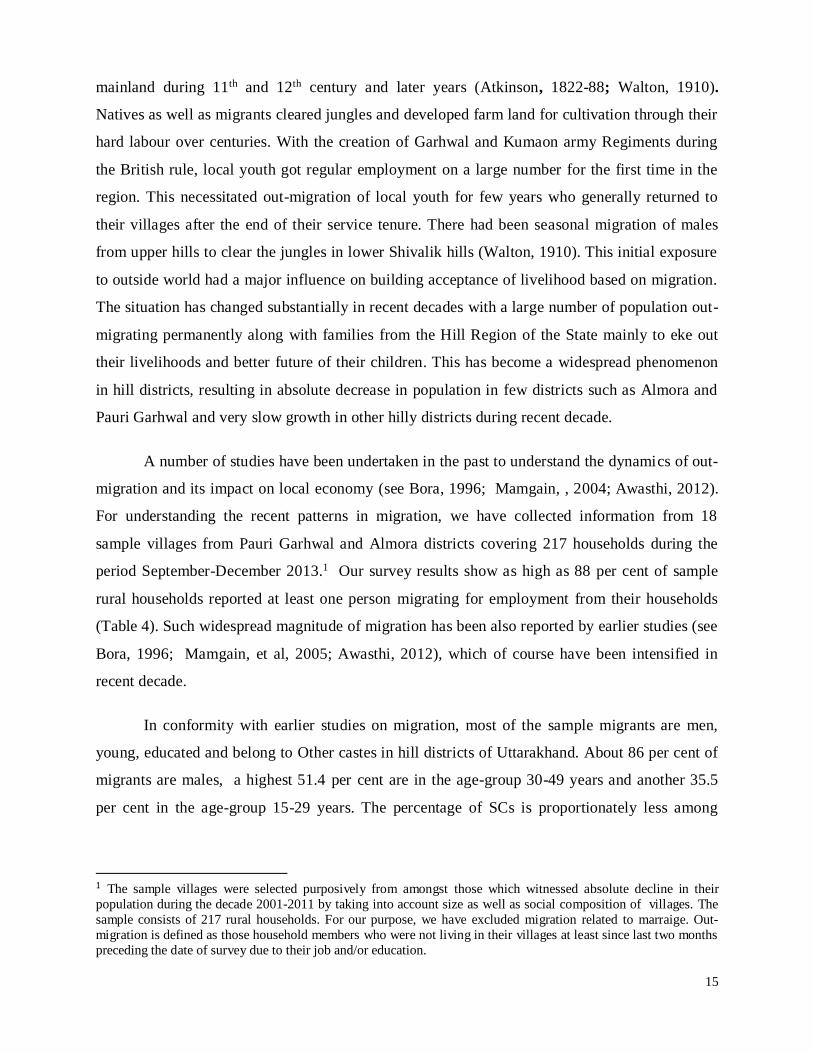
Yet another dimension relates to complete out-migration of households from the village.
In our sample villages, as high as 253 households have completely out-migrated in Pauri
Garhwal, and another 245 households in Almora district over a period of ten years. These
numbers constitute more than half of the number of existing households in the sample villages
(Table 6). One can see a number of locked and depilated houses and barren parcels of erstwhile
cultivated land in several villages in hill districts of Uttarakhand. As high as half of the
Brahmin households have out-migrated completely from their villages both in Garhwal and
Almora districts. Such tendency is much less among SC households, mainly due to their poor
incomes.
18
Table 6
Number of Households who have completely Out-migrated during
last Ten Years in Sample Villages
Social group Pauri (Ten sample
villages)
(Number)
As % of existing
number of HHs
Almora (Eight
sample
villages)
(Number)
As % of
existing
number of
HHs
SC 28 25.45 34 20.36
OBC 4 57.14 3 33.33
Other-
Rajput
61 42.36 110 35.95
Other-
Brahmin
189 54.47 98 50.52
Total 253 46.38 245 36.24
Note: This information is collected from Village Pradhan’s records after due cross checking with
the Key Informants in the sample villages.
Migration Process
Migrants heavily depend on social networks and informal channels to seek information about
jobs and to obtain recommendations. These largely include friends and relatives who had
already migrated to cities. In many case village youth travel to the cities where their relatives are
living to seek their support in job search. Support is mostly given by family, friends and relatives
and it acts like a spiral with more and more people being helped in their migration by fellow
migrants from the village. The form of support includes financial help, search for job, food,
accommodation, etc., at the initial stages of migration. Such social networks and support are
relatively weak in case of SCs, thereby restricting their mobility. FGDs and key interviews
clearly reveal that SCs do proportionately migrate less due to their low educational levels, lack of
awareness, poverty and urban contacts. Migrants belonging to Other castes may help SC
migrants from their villages in searching employment but will not help them in staying with
them and sharing food. Newspapers and internet have also important source of information for
19
jobs. In some cases private placement agencies have also helped in getting job leading to
migration (ICIMOD, 2010).
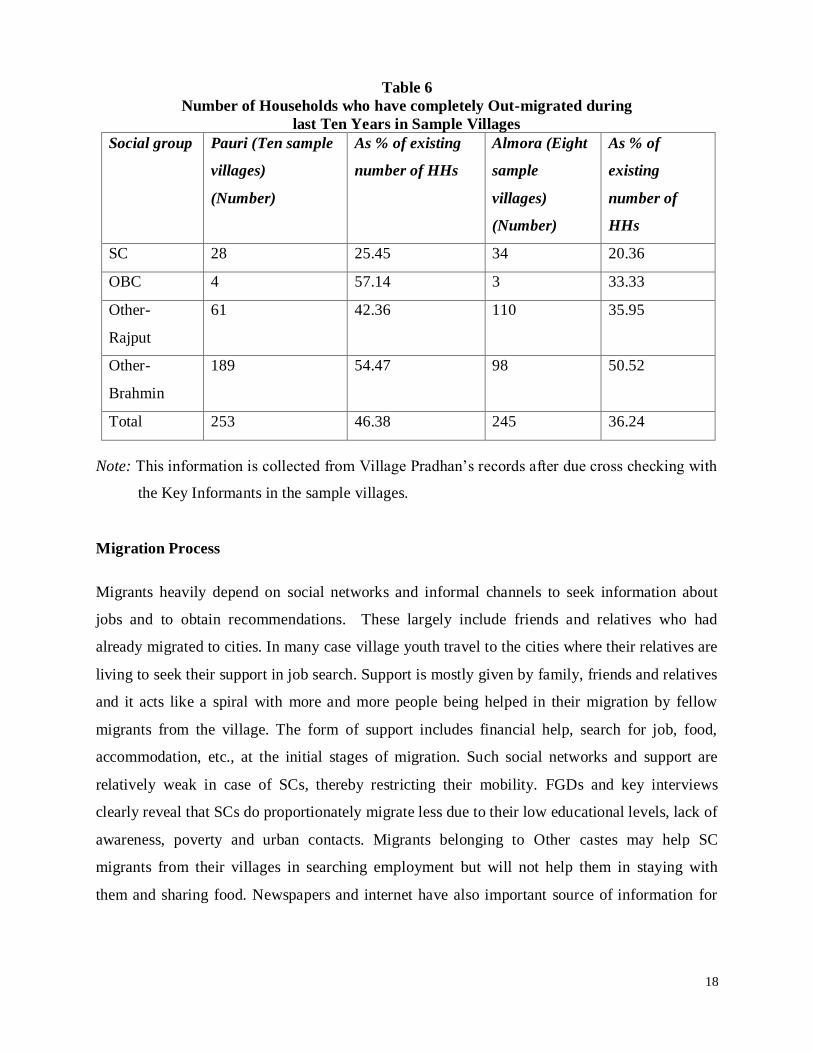
Box 1
In Bagwari village (consisting of 75 households) almost every household has one migrant
person. Most of the migrants are in Delhi, Ghaziabad and Meerut who largely work in menial
jobs like domestic servants, cooks, waiters and cleaners apart from few in armed forces. They
migrated along with older migrants who in turn introduced them to prospective employers and
also provided them initial help of food, shelter, etc. Moreover, with rising expectations youth
want to avoid hard life of their village. (Khushal Singh, a retired ex-army person).
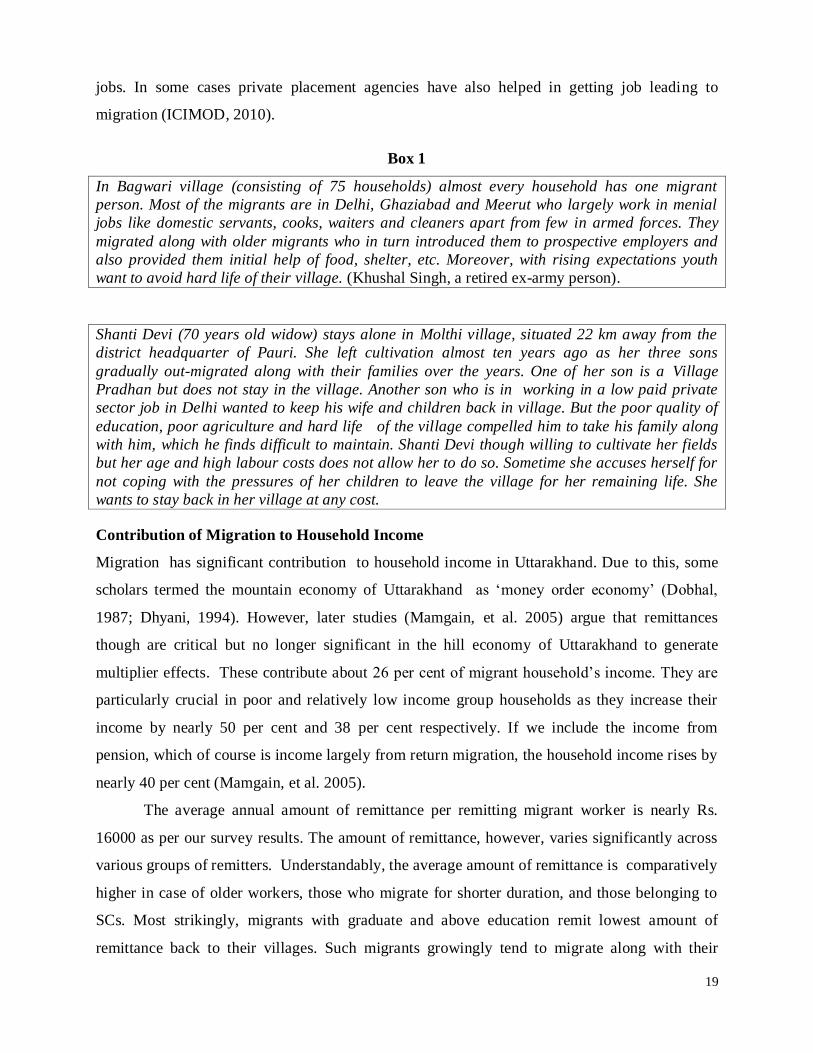
Shanti Devi (70 years old widow) stays alone in Molthi village, situated 22 km away from the
district headquarter of Pauri. She left cultivation almost ten years ago as her three sons
gradually out-migrated along with their families over the years. One of her son is a Village
Pradhan but does not stay in the village. Another son who is in working in a low paid private
sector job in Delhi wanted to keep his wife and children back in village. But the poor quality of
education, poor agriculture and hard life of the village compelled him to take his family along
with him, which he finds difficult to maintain. Shanti Devi though willing to cultivate her fields
but her age and high labour costs does not allow her to do so. Sometime she accuses herself for
not coping with the pressures of her children to leave the village for her remaining life. She
wants to stay back in her village at any cost.
Contribution of Migration to Household Income
Migration has significant contribution to household income in Uttarakhand. Due to this, some
scholars termed the mountain economy of Uttarakhand as ‘money order economy’ (Dobhal,
1987; Dhyani, 1994). However, later studies (Mamgain, et al. 2005) argue that remittances
though are critical but no longer significant in the hill economy of Uttarakhand to generate
multiplier effects. These contribute about 26 per cent of migrant household’s income. They are
particularly crucial in poor and relatively low income group households as they increase their
income by nearly 50 per cent and 38 per cent respectively. If we include the income from
pension, which of course is income largely from return migration, the household income rises by
nearly 40 per cent (Mamgain, et al. 2005).
The average annual amount of remittance per remitting migrant worker is nearly Rs.
16000 as per our survey results. The amount of remittance, however, varies significantly across
various groups of remitters. Understandably, the average amount of remittance is comparatively
higher in case of older workers, those who migrate for shorter duration, and those belonging to
SCs. Most strikingly, migrants with graduate and above education remit lowest amount of
remittance back to their villages. Such migrants growingly tend to migrate along with their

20
families and thus do not have to remit unlike their other counterparts. It merits mention here that
overall flow of remittance money to the villages is also decreasing over the years as large
number of migrants completely moving away with their families.
Whether all migrant workers do send remittance back to their villages? Our survey results
show that nearly 60 of migrant workers send remittances. Similar observations have also been
made in earlier studies (Mamgain, 2004; Awasthi, 2012). These studies show how propensity to
remit is comparatively much higher among SCs, middle aged workers and those migrating for
shorter durations. The propensity to remit is least among the permanently migrated workers and
those with higher level of education. Notably, tendency to migrate permanently is strong among
graduate migrant workers as 39.1 per cent of them are permanently migrated, while it is about 13
per cent among other workers (Mamgain et al., 2005).
The reasons for not remitting among the migrant workers may be three fold: (i) sufficient
household income at their source place to meet the basic requirements; (ii) very low earnings of
migrant workers making it difficult for them to save any amount for remitting money, as is the
case with most of the newly migrated workers who do not remit; and (iii) inclusion of family
members among the migrants thus prompting migrant workers to reduce the proportion as well
as frequency of remittances—this applies to those migrant workers who are better educated and
have comparatively higher income levels. Studies show that an overwhelming majority of out-
migrant workers are employed in low paid salaried jobs, which makes it difficult for them to
remit in larger sums. The inflationary pressures in recent years have also seriously eroded their
remitting capacities.
Thus, in a situation where nearly 70 per cent of migrant workers are in low-paid petty
jobs, more than one-third are semi-literate and most of them are unskilled, the overall earnings
and remittances of migrants are extremely low, despite the high propensity to remit.
Impact of Migration on Village Economy and Society
How out-migration has impacted on source areas? The neo-classical economists argue that
migration improves the income and standard of living of source areas through several ways. The
remittances received in source areas generate demand for goods and services in that region which
further improves employment and income opportunities. Migrants also bring with them new
knowledge and technology which they use in their native place (Lewis, 1954; Fei and Ranis,
1964, Stark, 1991). However, there are mixed experiences of such positive impacts as emerge
21
from our field observations. In case of villages in Hill Region of Uttarakhand, migration has
made a tremendous change in consumption pattern, which is mostly met from outside the region.
This has been shifted from consumption of coarse bara naja (twelve grains) to wheat and rice
like other regions of India. Though people do grow ragi and finger millets but these are mainly
used as animal feed. Alcoholism among male youth is widespread and has become a major social
concern.
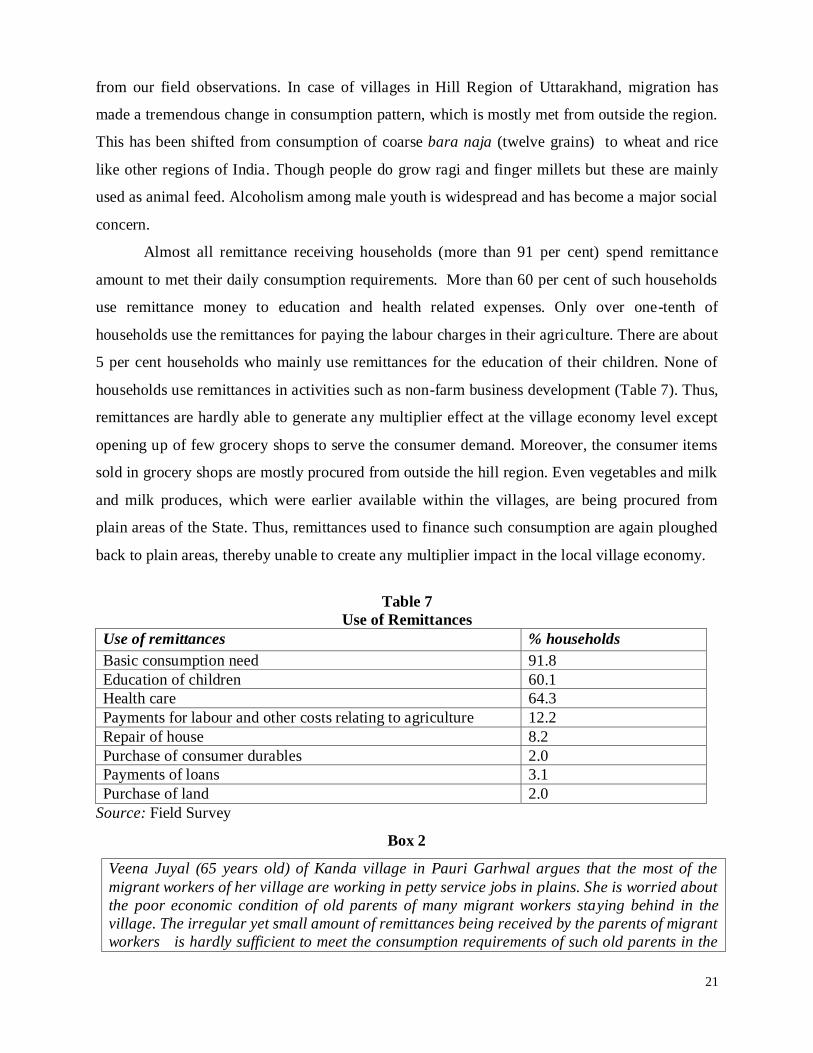
Almost all remittance receiving households (more than 91 per cent) spend remittance
amount to met their daily consumption requirements. More than 60 per cent of such households
use remittance money to education and health related expenses. Only over one-tenth of
households use the remittances for paying the labour charges in their agriculture. There are about
5 per cent households who mainly use remittances for the education of their children. None of
households use remittances in activities such as non-farm business development (Table 7). Thus,
remittances are hardly able to generate any multiplier effect at the village economy level except
opening up of few grocery shops to serve the consumer demand. Moreover, the consumer items
sold in grocery shops are mostly procured from outside the hill region. Even vegetables and milk
and milk produces, which were earlier available within the villages, are being procured from
plain areas of the State. Thus, remittances used to finance such consumption are again ploughed
back to plain areas, thereby unable to create any multiplier impact in the local village economy.
Table 7
Use of Remittances
Use of remittances % households
Basic consumption need 91.8
Education of children 60.1
Health care 64.3
Payments for labour and other costs relating to agriculture 12.2
Repair of house 8.2
Purchase of consumer durables 2.0
Payments of loans 3.1
Purchase of land 2.0
Source: Field Survey
Box 2
Veena Juyal (65 years old) of Kanda village in Pauri Garhwal argues that the most of the
migrant workers of her village are working in petty service jobs in plains. She is worried about
the poor economic condition of old parents of many migrant workers staying behind in the
village. The irregular yet small amount of remittances being received by the parents of migrant
workers is hardly sufficient to meet the consumption requirements of such old parents in the
22
village. Many times, they have to resort to borrowing for meeting their consumption and
medical requirements. In case of their illness, sometimes Veena has to help them as a fellow
villager and social worker by taking them to doctor and bear their medical expenses. Veena is
quite upset with the pathetic condition of old age parents of migrants in her village. She
blames the compulsions of migration for this state of affairs and questions the very purpose of
family and children who are unable to take care of their old age parents. Veena also questions
the blind race for out-migration among the village youths who could have otherwise put their
hard labour in their agriculture and allied activities. She argues that some youths with low
levels of education could have been motivated to take up farm based livelihoods through
better training.
Box 3
Tula Ram is 65 year old and belongs to a Scheduled Caste household in Almora district. His
wife Ganeshi is 59 years old. They have one son Dinesh (age 40 years) who out-migrated with
his wife, two sons and one daughter to Delhi. Dinesh works in a private company and has low
earnings. He occasionally sends remittances casually to his parents. The amount of remittance
is very small—last year he sent only Rs. 3500 and Tula Ram and his wife could not even meet
their food requirements with this amount. Therefore, despite his ill health, Tula Ram is forced to
do casual work apart from cultivating his small parcel of land. Dinesh and his family have not
visited their parents for the last two years.
People have abandoned their farmlands in large number, which had been developed by
their ancestors with their hard labour over several years. This is a common scene in districts like
Pauri and Almora. In some villages over half of the erstwhile cultivated land is lying barren.
Given the alternative, every able bodied person of the village, particularly young ones, would
like to discontinue his/her farming based livelihoods.2 In several parts of hill regions, even
irrigated parcels of land have been abandoned due to huge outmigration. The reasons for such
disenchantment include very low productivity of agriculture, increasing menace of wild animals
(like monkeys, bores and bears) in destroying crops, and practically no technical know-how and
support to diversify agriculture. Moreover, it has become increasingly difficult to find labour for
ploughing, leading very high charges for such labour in many villages. This has again dissuaded
villagers to cultivate their land.
The magnitude of out-migration is so huge that there are several ghost villages left with
very few old people (Umar, 2012; Outlook, 2013). In Pauri Garhwal, the identities of many
villages are saved by one or two people who still live there (Trivedi, 2012). The names of such
villages may be lost to the world soon. The barren fields and ruined houses tell the tale of the 2 Based on FGDs and Key Informant Interviews

23
sad exodus. The condition of those living back in such villages is pathetic as they face huge
social marginalization by their own kith and kins, who hardly visit them. Sometimes it is difficult
to manage couple of people for the last rites of a dead person in such villages.
Out-migration has also marginalized the political voices in the rural areas of hill districts
in Uttarakhand. Majority of MLA seats have been now shifted to plain districts of the State after
the delimitation exercise of 2008. Local MLAs/MPs hardly take interest in the development of
local resources including agriculture. Rather the level of political interferences in the functioning
of development agencies have increased manifold, thus adversely impacting on the development
projects for the villages.3
Due to huge migration of educated youth, voices of villagers in local level Gram
Panchayats have weakened. Many of such Gram Panchayats are unable to place their demand for
the development works and other services before the government developments. Their voices are
hardly listened either by politicians or development agencies. The positive development of such
migration relates to increasing importance of SCs in political economy of Hill districts with their
increasing proportion in population (19.8 per cent in 2001 to 20.9 per cent in 2011). The forms of
untouchability no more remain that severe as existed few decades back due to political
empowerment of these groups.
With the increasing penetration of market forces coupled with out-migration, social
institutions in the villages have become weak. A new class of political leaders, contractors and
government officials is growingly defining the new boundaries of “class” in these villages. Most
of them have settled their families in relatively better places like Dehradun and Haldwani in
plain areas of the State. However, they dominate in decision making in the village.
Youth power is becoming growingly idle and inactive in Hill Region due to lack of
employment opportunities outside agriculture and associated vocational guidance and training.
They are least interested in taking up tedious agricultural work on their fields. In some places
their fields are being cultivated by Nepalese for vegetable production to cater the local market.
Notably, these Nepalese labour give a nominal amount as rent to the villagers. Local youth are
3 Discussions with the District Magistrate of Pauri Garhwal.
24
indulged whole day in playing cards as their time pass activity. Added to this is increasing liquor
addiction and passive attitude towards life and society. There is a huge obsession for salaried
jobs irrespective of quality and tenure—expectations of people have ever risen and want to avoid
hard life. This is due to high risk and uncertainty associated with starting self-employed ventures
outside agriculture.4
Despite better educational levels, youth hardly possess any skill training. Most of the
skilled/semi-skilled jobs are being undertaken by labour from outside the State, even from far
flung areas of Bihar. Unskilled casual wage works, thus, do not attract local labour, which is
more irregular and short in duration. As a result, there are often labour shortages to complete
public works5. If government establishes skill development centers and improves education and
the healthcare system, things will dramatically improve,” as suggested by respondents in villages
of Takula block in Almora. However, there are good examples (for example Gadola village in
Rudrapryag district) of youth taking up commercial farming. This could be possible due to better
quality of land, better extension services and good access to market resulting in remunerative
farm income.
Box 4
Molthi village, situated at a distance of 22 km. from the district headquarters Pauri, has a
Primary School having 29 students. Alone 19 students are from SC community of the village. The
school has two female teachers who commute daily from the district headquarters and generally
reach late to school. They have made a routine of coming to school every alternate day so that
there is at least one teacher present in the school daily in the school. It is impossible for a single
teacher to handle 29 students from different grades. This has adversely affected the quality of
teaching as admitted by several parents. However, nobody from the village questions such
arrangement made by the teachers.
Many migrants would like to return their villages provided they get employment outside
agriculture and at the same time better services of education, health and other basic amenities
within or nearby their villages. 6 A major issue is high rate of absenteeism among teachers and
health care workers and other line department officials responsible for village development.
There are hardly any livable places for government employees nearby their places of work such
as schools or health facilities. This forces them to travel a distance of 25 km to 50 km daily by
4 This emerged prominently during our discussions with villagers of Ujedi, Lwalli, Kanda, Malli and
Bagwari 5 As emerged during discussion with the District Magistrate of Pauri Garhwal. 6 As emerged in FGDs and Key Informant interviews in sample villages of Pauri and Almora

25
partly travelling by bus/taxi and partly on feet to reach their residence in nearby market places;
and thus giving less time to their work.7
Impact of Migration on Women’s Work
Migration as a labour reallocation process is expected to improve the overall income levels of
households. With the improving income levels a household has a choice between work and
leisure. It is postulated that household labour would withdraw themselves from activities with
zero marginal productivity and would rather choose leisure with the improving income levels
either through remittances or increase in productivity. It is in this sense, households receiving
remittances in Hill Region would have withdrawn from tedious activities such as cultivation and
animal husbandry. For understanding this phenomenon we have used the time use data collected
for this study both for men and women in the working age-group 15-59 years. It emerges that
remittances per se have not reduced the work load and related drudgeries of women population.
The work load of women belonging to migrant households remains almost similar to their
counterparts belonging to non-migrant households. Every able bodied women work for average
eight to ten hours daily in various productive activities, such as cultivation, fodder collection,
fuel collection, animal husbandry apart from cooking of food and care of child and old people in
their households. Alone 4 to 5 hours of a hill woman are spent in farm related works, animal
tendering, fuel wood collection and fodder collection. Next important activity is cooking of food
and cleaning of home and utensils which takes about another 2-3 hours daily. While collecting
fuel wood and fodder from forests they are always fearful of being caught by forest officials of
state owned reserve forests. In many cases migration has in fact overburdened women as they
have to undertake those activities which were being performed earlier by their spouses like
working in agriculture and MNREGA works. Women's share over half the MNREGA
employment. The burden of cooking and other domestic chores get reduced for women in joint
families where relatively older women take care of cooking and animal tendering activities.
Contrary to this, their male counterparts work daily for about four hours, mainly undertaking
ploughing, leveling and repair of their fields, and sometime collection of fuel wood8.
7 As emerged in Key Informant interviews in sample villages of Pauri and Almora 8 It is common to see male members engaged in time-pass games such as playing of cards, going to local markets,
etc. They would simply find farm related works uninteresting and non-remunerative.
26
The gender differences in work load are so sharp that even school going girl child has to
share tasks related to farm, animal husbandry, fuel and fodder collection with her mother more
frequently than her brother. Girl children hardly find any time to devote time for their studies at
home. Many of them would like to pursue higher studies. But their parents are unlikely to
support them partly due to weak financial position of households and partly due to passiveness
towards girls’ education. Such gender discrimination severely affects their studies and future.9
In brief, an overburdened woman is a widespread phenomenon across villages in hill
districts in Uttarakhand. They are the backbone of hill society yet remain most exploited,
marginalized in household decision making and governed by complex traditional, cultural norms
and practices (IHD-IFAD study, 2011). Remittances though have ameliorated their economic
conditions to certain extent but still their work related drudgeries remain almost unchanged. This
is due to the fact that remittances are not sufficient enough to meet the household requirements;
whereas farm related activities still provide some additional economic support to such
households for few months. Thus, women’s contribution is very critical in supporting household
well-being, more so in migrant households in hill districts of Uttarakhand. This unique situation
shows the precarious situation of women in the village society of hill regions of Uttarakhand
which remains almost unchanged as depicted by Walton way back during 1910 (Walton, 1910,
reprinted in 1994).
V. UNDERSTANDING DRIVERS OF OUTMIGRATION
There are several causes of migration, the nature of which predominantly depend on the
conditions prevailing in a household or a region. The causative factors are generally categorised
into two groups in Lee’s (1966) framework of ‘push’ and ‘pull’ factors. Both these factors
concentrate only on labour market related migration. In case of migration in developing countries
like India such framework is inadequate to capture the complex interplay of variations in the
labour market (both expanding opportunities and failure of the rural labour markets in providing
jobs), social and political reasons, the living environment (housing, sanitation and access to basic
infrastructure such as education and health) (Jayaraj, 2013). In the context of the Hill Region in
Uttarakhand, ‘push factors’ predominate the decision to migrate since most of the households
have marginal land holdings with abysmally low levels of farm income—mainly attributed to
traditional farm practices and extremely limited employment opportunities outside agriculture for
9 Discussion with girl students in select High Schools and Intermediate Colleges.

27
increasing population. Over 90 per cent of respondents attribute abysmally low levels of
agriculture productivity coupled with increased fragmentation of land holdings as one of the
important reasons for migration. A recent NSSO 70th Round survey of Agricultural Households
(2013) also shows per household gross value of production lower by 3.4 times for households
reporting cultivation as a major activity in Uttarakhand (Rs. 10752) as compared to similar
figure for all-India (Rs. 36696).
No major efforts have been made to improve the agriculture and its productivity through
its diversification in favour of high value crops. In fact, farmers are willing to diversify their
farm production to improve their income, but the required support of agricultural extension
services, development of irrigation channels, use of better seeds, improved inputs, technology
and marketing remain major concern. As a result, almost all cultivators are willing to leave their
highly non-remunerative agriculture provided they get other alternative livelihoods. Apart from
very low agricultural productivity, destruction of crops by wild animals has become more
frequent and widespread, resulting in huge losses to famers. As a result, farmers have left their
cultivable land barren in outer circle of their village boundaries. Also, rapid spread of wild grass
and wild bushes have destroyed the farm land and other barren land in the hill districts, leaving
farm activity more difficult. Irrigation channels are in bad shape and are hardly being maintained
for irrigation purposes. Many of these channels have been washed away during recent years due
to frequent heavy rains. The utter failures of hydraulic pump systems for irrigation show the
callousness of government towards infrastructure development for agriculture. One can see such
defunct systems in many villages in Pauri Garhwal.
Like land, the availability of other assets like livestock, farm and non-farm assets is
extremely limited. Livestock mainly consists of local breed of milch, draught and other animals
like goats and sheep. This is mainly practiced to support the crop production and augment the
milk requirements of the households. The number of such animals has drastically reduced over
the years. Now rural households tend to retain proportionately lesser number of milch animals to
augment their livelihoods. Moreover, the quality of milch animals is poor resulting in very low
milk yields. Due to limited land, the shortage of fodder poses a serious problem for most of the
households as they have to travel longer distances to collect fodder from reserve forests. This
also discourages households from maintaining a large number of milch animals. There is hardly
any visible programme aimed at providing cheaper fodder through PDS, effecting improvement
in the breed of milch animals and development of infrastructure for procurement of milk.
28
Employment and Its Quality
For understanding the whole issue of out-migration from Hill Region of Uttarakhand, it would be
useful to first shed some light on the type and quality of employment available in the region. As
mentioned earlier, the number of working population is proportionately more in hill districts of
Uttarakhand as compared to plain areas. This is mainly due to higher percentage of working
women in the hill districts who act as backbone of the hill agriculture. The percentage share of
working men is rather smaller in hill districts than plain districts of the state and also much
smaller than the national average (Table 1). Our sample data also show nearly 46 percent of non-
migrant women as workers in Pauri Garhwal and Almora villages. The low rate of work force
participation among males is not a demographic phenomenon; instead it is purely an economic
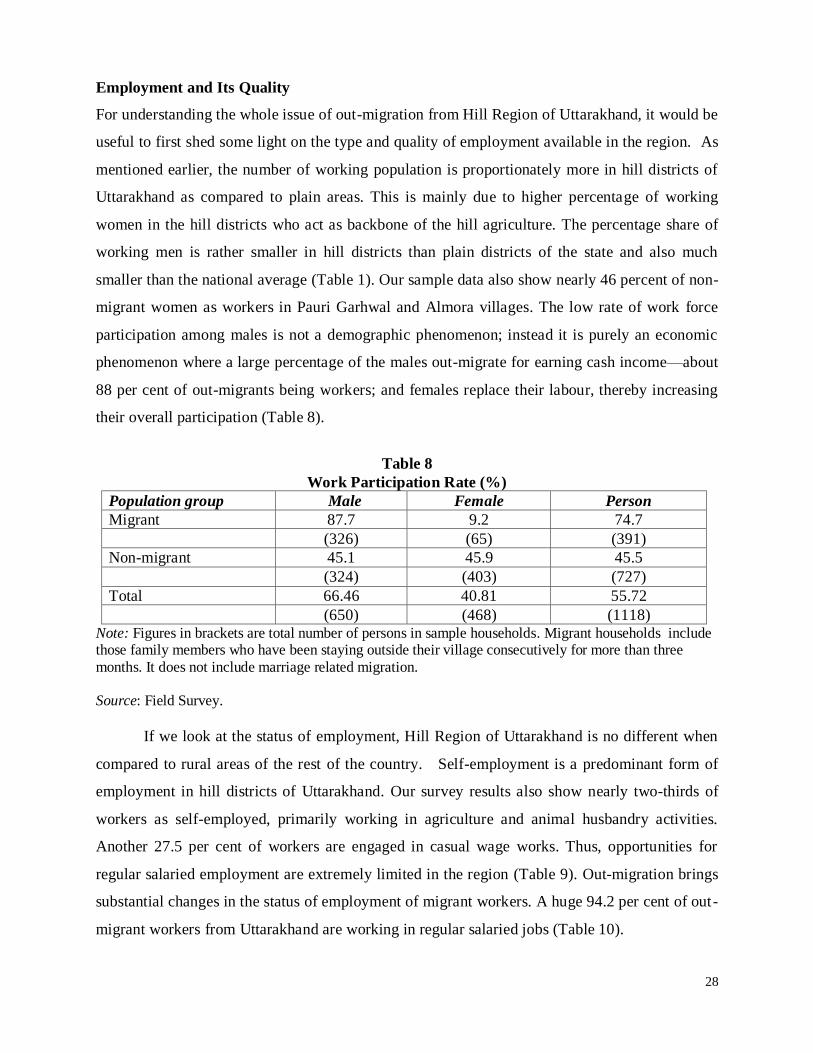
phenomenon where a large percentage of the males out-migrate for earning cash income—about
88 per cent of out-migrants being workers; and females replace their labour, thereby increasing
their overall participation (Table 8).
Table 8
Work Participation Rate (%)
Population group Male Female Person
Migrant 87.7 9.2 74.7
(326) (65) (391)
Non-migrant 45.1 45.9 45.5
(324) (403) (727)
Total 66.46 40.81 55.72
(650) (468) (1118) Note: Figures in brackets are total number of persons in sample households. Migrant households include those family members who have been staying outside their village consecutively for more than three
months. It does not include marriage related migration. Source: Field Survey.
If we look at the status of employment, Hill Region of Uttarakhand is no different when
compared to rural areas of the rest of the country. Self-employment is a predominant form of
employment in hill districts of Uttarakhand. Our survey results also show nearly two-thirds of
workers as self-employed, primarily working in agriculture and animal husbandry activities.
Another 27.5 per cent of workers are engaged in casual wage works. Thus, opportunities for
regular salaried employment are extremely limited in the region (Table 9). Out-migration brings
substantial changes in the status of employment of migrant workers. A huge 94.2 per cent of out-
migrant workers from Uttarakhand are working in regular salaried jobs (Table 10).

29
Status of employment significantly varies across gender, social group and economic category of
households (Table 9). Less than half of male workers in Hill Region are self-employed whereas
over 77 per cent of their female counterparts are engaged as self-employed. Casual wage
employment is also a major mode of employment in case of male workers, employing nearly 40
per cent of them. The percentage of females in regular salaried jobs is almost four times less than
males.
Similarly, in the case of the SC workforce, their proportion was comparatively less in
agriculture as compared to the other castes. This was mainly due to the larger extent of
landlessness among SCs. Their dependence on casual wage labour is much higher than Others as
is seen in the following Table 9.Their access to regular salaried jobs is extremely limited as
compared to other castes. Reasons for such limited access to regular salaried jobs to SCs as
compared to Others are generally seen in their low levels of education; but underlying
discrimination of SCs in access to local level regular jobs can be explored further in Uttarakhand
also.
Table 9
Status of Employment among Non-migrant Workers (%)
Category
Self- employed
Regular
salaried Casual labour
Number of workers
Male 49.3 11.6 39.0 146
Female 77.3 4.3 18.4 185
SC 55.6 2.0 42.4 99
Others 68.9 10.1 21.1 232
APL HH 72.7 12.8 14.5 172
BPL HH 56.3 1.9 41.8 159
Total 64.9 7.6 27.5 331
Source: Field Survey
Table 10
Status of Employment
Type of worker
Self- employed
Regular
salaried Casual labour
Number of
workers
Migrants 1.7 94.2 4.1 292
Non-Migrants 64.9 7.6 27.5 331
Total 35.3 48.2 16.5 623
Source: Field Survey
Workers belonging to BPL households have also significantly different employment
structure as compared to those belonging to APL households. About 42 per cent of workers
30
among BPL households are engaged in casual age works. Their access to regular salaried jobs is
very limited, thereby explaining their poverty (Table 9).
The predominance of self-employment in rural areas is also revealed by latest NSSO data
on employment and unemployment for the year 2011-12. It shows nearly three-fourths of workers
in rural areas of Uttarakhand as self-employed, another 14.7 per cent as casual wage workers and
remaining 11.2 per cent as regular salaried workers. The share of regular salaried workers in rural
employment of the state increased substantially from 7.2 per cent in 2004-05 to 11.2 per cent in
2011-12. It also shows over 61.4 per cent of rural workforce in Uttarakhand working in
agriculture and allied activities. The next highest sector is construction employing 12.3 per cent
of rural workforce in the state (Annexure Table 2.).
For understanding the structure of employment, its quality and earnings, a study of
employment in 100 villages across 10 hill districts of Uttarakhand by Mamgain et al. (2005)
brings out some noteworthy findings. It shows that for about 70 per cent of the sample
workforce, agriculture and allied activities were the main source of livelihood. Construction was
the next main sector of employment as it employed about 16 per cent of the workforce. The share
of other sectors in employment was not prominent. There are significant variations in the sectoral
pattern of employment of rural workforce across 10 hill districts. For example, more than three-
fourths of the workforce in Pauri Garhwal district was engaged in agriculture and allied activities.
On the other extreme, this percentage was the lowest at about 57 per cent in Uttarkashi district. In
other districts the share of agriculture and allied activities in employment varied between 68 and
72 per cent. (Annexure Table 3).
The study found construction sector another major sector of employment for over one-
fifth of the workforce in Champawat, Nainital and Pithoragarh districts. In all the other hill
districts except Rudraprayag, it provided employment to a sizeable percentage of the workforce
(Annexure Table 3). In fact, there was a significant increase in developmental projects in all the
hill districts in the State which led to intensive construction related work. This gave a fillip to the
demand for labour in the construction sector. It should, however, be mentioned here that in major
hydro power construction sites like the Tehri Garhwal Dam and Vishnu Prayag, there was a
negligible number of local labourers involved. The reasons for such a situation can broadly be
traced to lack of skills among local labour, tendency of local youth to out-migrate and general
preference among employers for outside labour.

31
The share of the service sector in employment was the highest at about 16 per cent in
Rudraprayag and the lowest at about 6 per cent in Pauri Garhwal district. The other districts with
comparatively higher share of service sector employment were Tehri Garhwal, Bageshwar and
Uttarkashi. These districts also have a better flow of tourists, which promotes demand for the
service sector, mainly hotels and amenity services. It should be mentioned here that nearly half
the service sector employment belonged to public services, which mainly comprise teachers and
health workers in the rural areas of the hill districts. This was true for the all the sample districts.
The manufacturing sector employed a very small percentage (1 to 2 per cent) of the workforce in
most of the hill districts except Uttarkashi and Chamoli. In these two districts, 17 per cent and 6.3
per cent of the workforce was respectively employed in the manufacturing sector. In both these
districts particularly at the high altitudes, most of the households were engaged in weaving,
knitting and manufacturing woollen garments based on locally available wool and skills. This has
been a traditional occupation of these communities but in the recent past they have been facing
problems such as availability of raw material, higher cost of production and stiff competition
from cheaper and better finished products from urban areas. As a result this traditional occupation
is gradually vanishing. In brief, there is a need to initiate a suitable growth process which will
help in shifting a larger proportion of the workforce to rural non-farm employment with adequate
incomes.
There emerged a marked difference in the structure of employment between males and
females. Almost all the females in the rural areas were employed in agriculture and allied
activities. They alone accounted for more than 83 per cent of the total workforce engaged in the
agriculture sector. On the other extreme, more than three-fourths of the male workers were
employed in rural non-farm employment, mainly in construction work. The pattern was almost
similar across the hill districts in Uttarakhand (Mamgain et al. 2005).
The highest concentration of the male workforce in rural non-farm activities, particularly
in the construction sector, was mainly due to government support for building infrastructure like
roads, culverts, bridges, buildings and wage employment programmes. However, it needs to be
clarified that most of such rural non-farm jobs in the construction sector were not necessarily
located within the boundaries of villages. A large proportion of these jobs were available through
daily commuting to nearby towns/rural bazaars. Access to such jobs for women was highly
restricted owing to various barriers.
32
Yet another visible industry group was that of retail shops, which catered to the food and
non-food needs of the villagers. In almost every sample village two to three such shops could be
seen. In some villages, the villagers had their shops in nearby rural bazaars where they generally
commuted daily. Apart from these, there were tailoring shops and black smiths, etc., serving the
village communities. Assistance provided under the Pradhan Mantri Rozgar Yojana (PMRY) too
helped some youth to open shops in villages.
Most of the workers in the construction sector were unskilled. The demand for skilled
workers such as masons, plumbers, carpenters, drillers and welders was generally met by
labourers from outside the State, even from distant places such as Bihar.
Thus, accessibility to non-farm employment opportunities was mainly in the domain of
males. This further accentuated the vulnerability of women, though they were the main producers
in agriculture. They had no direct access to income, howsoever little, that accrued from
agriculture and other non-farm activities.
Structure of Employment among Social Groups
The structure of employment significantly varies among various social groups such as SC, ST
and other castes. In the case of the SC workforce, their proportion was comparatively less in
agriculture as compared to the other castes. This was mainly due to the larger extent of
landlessness among SCs. As can be seen from Table 11. about one-fourth of the SC workforce
was working in the construction sector in which their share was the highest as compared to the
other caste groups. Their relatively higher share at 12 per cent in the manufacturing sector was
mainly concentrated in repair related work and in caste-based occupations like basket weaving,
black smithy and copper smith which are essentially low paying occupations (Mamgain et al.,
2005).
Gender-wise structure of employment was almost similar across the various social groups,
except for STs. Women predominantly worked in agriculture and allied activities while the men
worked in the non-agricultural sector. In the case of STs, the largest percentage (63.6 per cent) of
the women workforce was engaged in manufacturing of woollen garments. This is a traditional
economic activity. In other words, there are no social barriers for women working in their own
fields or household enterprises. However, there appeared to be serious mobility restrictions once a
woman decided to move out to non-agricultural employment such as in construction related

33
works, which are generally located outside their villages. This was true for all the castes. In
essence, woman working in agriculture either as casual or family labour was not viewed as an
exception.
Table 11
Structure of Employment among Social Groups (Per cent)
Industry Others SC ST OBC
Agriculture and allied activities 72.44 61.29 40.26 69.44
Mining & quarrying 0.19 0.23 0 0
Manufacturing 0.94 7.14 42.86 1.39
Construction 14.85 25.81 5.19 9.72
Trade, hotel & restaurant 3.81 1.04 5.19 1.39
Transport and communication 1.75 0.23 2.6 6.94
Finance, business activities etc. 0.3 0.12 0 0
Public admn, education, commercial services 5.72 4.15 3.9 11.11
Total 100 100 100 100
Source: Mamgain et al., (2005).
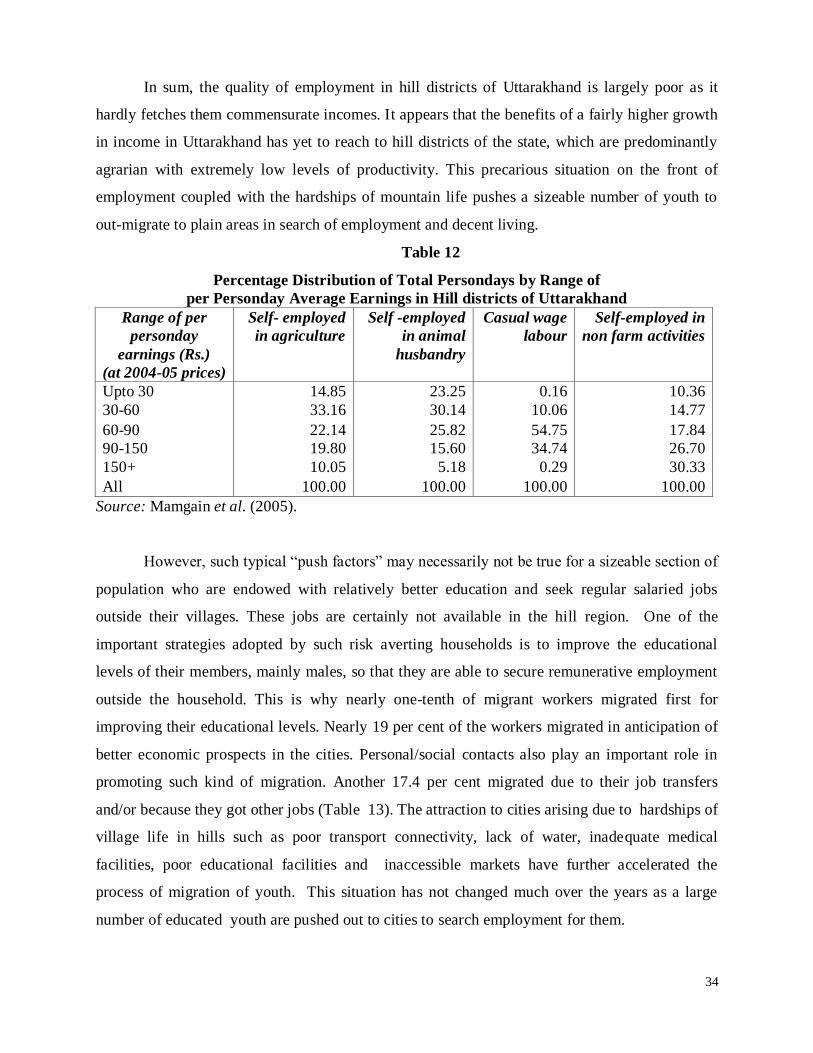
Low Earnings
Nearly half of the labour input in agricultural sector (employing nearly 70 per cent of the rural
workforce) in hill districts of Uttarakhand could not fetch up even a minimum wage level (Rs. 60
during 2004-05) (Mamgain et al., 2005). This only indicates a very high incidence of
underemployment among those engaged in these two sectors. Similarly, over half of the person
days remained underemployed in animal husbandry. The NSSO 70th Round (2013) also
reconfirms the very low average monthly income of agricultural households in Uttarakhand (Rs.
4701) as compared to neighbouring Himachal Pradesh (Rs. 8777) (GoI-NSSO, 2014). Per
person day average earnings are comparatively better for those self-employed in non-farm
activities (Mamgain et al., 2005). However, such employment opportunities are extremely
limited. Thus, transfer incomes are very important sources of household income (Mamgain et al.,
2005). District-wise, for 70-80 per cent of person days, the average per person day earning was
less than the minimum wage in Pithoragarh, Tehri Garhwal and Pauri Garhwal. Chamoli was the
only district where less than one-fifth person days in agriculture remained underemployed.
Similarly, over half of the person days remained underemployed in animal husbandry. The
highest incidence was in Uttarkashi, Pithoragarh and Rudrapryag (Mamgain et al., 2005).
34
In sum, the quality of employment in hill districts of Uttarakhand is largely poor as it
hardly fetches them commensurate incomes. It appears that the benefits of a fairly higher growth
in income in Uttarakhand has yet to reach to hill districts of the state, which are predominantly
agrarian with extremely low levels of productivity. This precarious situation on the front of
employment coupled with the hardships of mountain life pushes a sizeable number of youth to
out-migrate to plain areas in search of employment and decent living.
Table 12
Percentage Distribution of Total Persondays by Range of
per Personday Average Earnings in Hill districts of Uttarakhand
Range of per
personday
earnings (Rs.)
(at 2004-05 prices)
Self- employed
in agriculture
Self -employed
in animal
husbandry
Casual wage
labour
Self-employed in
non farm activities
Upto 30 14.85 23.25 0.16 10.36
30-60 33.16 30.14 10.06 14.77
60-90 22.14 25.82 54.75 17.84
90-150 19.80 15.60 34.74 26.70
150+ 10.05 5.18 0.29 30.33
All 100.00 100.00 100.00 100.00
Source: Mamgain et al. (2005).
However, such typical “push factors” may necessarily not be true for a sizeable section of
population who are endowed with relatively better education and seek regular salaried jobs
outside their villages. These jobs are certainly not available in the hill region. One of the
important strategies adopted by such risk averting households is to improve the educational
levels of their members, mainly males, so that they are able to secure remunerative employment
outside the household. This is why nearly one-tenth of migrant workers migrated first for
improving their educational levels. Nearly 19 per cent of the workers migrated in anticipation of
better economic prospects in the cities. Personal/social contacts also play an important role in
promoting such kind of migration. Another 17.4 per cent migrated due to their job transfers
and/or because they got other jobs (Table 13). The attraction to cities arising due to hardships of
village life in hills such as poor transport connectivity, lack of water, inadequate medical
facilities, poor educational facilities and inaccessible markets have further accelerated the
process of migration of youth. This situation has not changed much over the years as a large
number of educated youth are pushed out to cities to search employment for them.
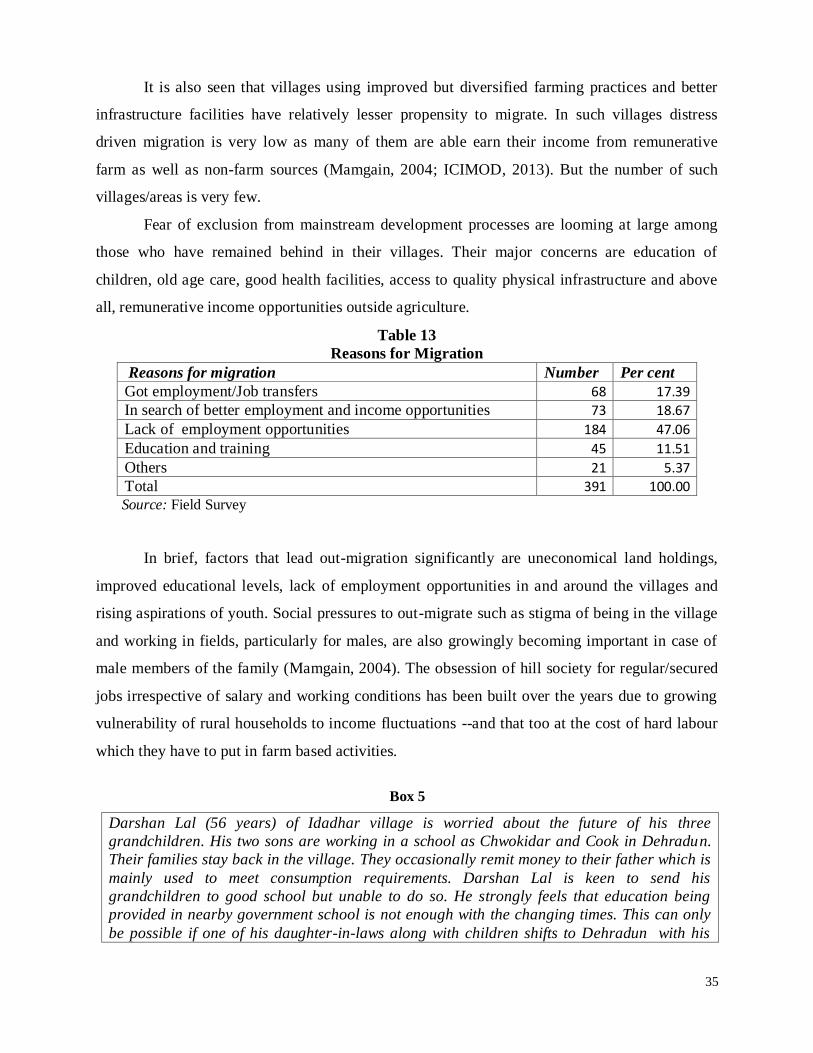
35
It is also seen that villages using improved but diversified farming practices and better
infrastructure facilities have relatively lesser propensity to migrate. In such villages distress
driven migration is very low as many of them are able earn their income from remunerative
farm as well as non-farm sources (Mamgain, 2004; ICIMOD, 2013). But the number of such
villages/areas is very few.
Fear of exclusion from mainstream development processes are looming at large among
those who have remained behind in their villages. Their major concerns are education of
children, old age care, good health facilities, access to quality physical infrastructure and above
all, remunerative income opportunities outside agriculture.
Table 13
Reasons for Migration
Reasons for migration Number Per cent
Got employment/Job transfers 68 17.39
In search of better employment and income opportunities 73 18.67
Lack of employment opportunities 184 47.06
Education and training 45 11.51
Others 21 5.37
Total 391 100.00 Source: Field Survey
In brief, factors that lead out-migration significantly are uneconomical land holdings,
improved educational levels, lack of employment opportunities in and around the villages and
rising aspirations of youth. Social pressures to out-migrate such as stigma of being in the village
and working in fields, particularly for males, are also growingly becoming important in case of
male members of the family (Mamgain, 2004). The obsession of hill society for regular/secured
jobs irrespective of salary and working conditions has been built over the years due to growing
vulnerability of rural households to income fluctuations --and that too at the cost of hard labour
which they have to put in farm based activities.
Box 5
Darshan Lal (56 years) of Idadhar village is worried about the future of his three
grandchildren. His two sons are working in a school as Chwokidar and Cook in Dehradun.
Their families stay back in the village. They occasionally remit money to their father which is
mainly used to meet consumption requirements. Darshan Lal is keen to send his
grandchildren to good school but unable to do so. He strongly feels that education being
provided in nearby government school is not enough with the changing times. This can only
be possible if one of his daughter-in-laws along with children shifts to Dehradun with his
36
son. But wages of his sons are not sufficient to support other family members at their place of
migration. He also feels that due to their poor background, they could not be benefitted by the
job reservation policy in education and employment.
Box 6
Pankaj (24 year old) from Rangaun village is simply a high school pass. He never wanted to
migrate for a work. But he had to do so due to social pressures. It was difficult for him to get
married as he had no salaried job. For this his family decided to send him to Haridwar to
work in a factory as a helper. He had been helped by his fellow villager to get a temporary job
in a factory in Haridwar. His salary was hardly enough to support him therein. He had to
work there unwillingly till his marriage was settled back in his village. After his marriage he
left the job and returned to village. He is happy to work in the village in similar casual wage
jobs.
Box 7
Ekambar Singh Rawat (62 years) a retired Daftry from Garhwal University, Srinagar
Garhwal has 2.5 acre land in his village Malli, situated just 10 km away from district
headquarter. His village has all basic amenities except employment opportunities outside
agriculture. He had been cultivating his fields during his service time also. His sons are not
interested in agriculture. He has leased out a part of his irrigated land to Nepalese just for few
hundred rupees. His village has a good potential for vegetable production, which Nepalese are
doing labouriosly therein. He laments that the unemployed youth of his village would like to sit
idle rather putting hard work in their fields to grow commercial crops, such a vegetables for
nearby market. Due to disinterest in agriculture a large area of agricultural land is being
invaded by wild grass. Wild animals such as monkeys and wild pigs are also destroying crops
of his village.
Village Infrastructure, Its Quality and Infrastructure
Village level infrastructures have important bearing on migration. Many of migrant households
argued that the decision of their family members to out-migrate have been largely due to lack of
facilities like access to quality education, health care services, roads, drinking water,
telecommunication, etc., in/nearby their villages. Road connectivity has considerably improved
in the Hill Region of Uttarakhand. This has been possible under Prime Minister’s Gram Sadak
Yojana (PMGSY). In our sample villages average distance from motor road is 2.5 kms. One can
see huge road construction going on in various parts of the region under PMGSY. Even the
network is being developed in those villages which have only few households left therein in the
wake of out-migration. Electricity is also available in these villages but about 40 per cent of
households have taken electricity connection in their households. Mobile phone connectivity has
penetrated in hill villages on a large scale. Such connectivity has improved social and
37
psychological bondage of hill women, particularly of those whose family members have
migrated to distant cities. Mobile connectivity has also improved the health care of villagers by
reducing their substantial time in to and fro commuting to health care facilities located at distant
places. One can see a hill woman carrying her mobile phone while going to collect fuel and
fodder in the forests.
Though access to piped drinking water has tremendously improved over the years, the
traditional sources of pure water such as springs have been grossly neglected. Moreover, the
access to piped water is highly erratic, thus taking a substantial time of residents, particularly
women and children, of several villages in fetching water from a distant source. There are hardly
any water conservation projects which could have been used both for drinking and irrigation
purposes. Due to scarcity of water, toilets constructed under government programme remain
almost unutilised. Pedestrian paths (RCC roads) have been developed in many villages in recent
years. This has improved the accessibility of households within villages.
Access to schools has also improved tremendously in the hill region. In our sample
villages, every village has primary school. High school is available at an average distance of
four kilometer. Network of degree colleges and ITIs has also substantially improved in Hill
Region of the state. Out of the 67 Government degree colleges 52 are located in hill districts.
However, these educational institutions lack basic facilities and staff (Joshi, 2010). Thus, quality
of schools and teachers therein is a major concern. Most of the villagers pointed our attention at
the rapidly deteriorating teaching standards in schools and colleges. Teacher absenteeism is a
quite common phenomenon and parents hardly raise their voices against this practice. Though
there are school management committees but their meetings are rarely convened. The District
Magistrate of Pauri Garhwal has candidly pointed the issue of absentee teachers, falling quality
of education and political pressures to transfer teachers to urban/well connected centres to avoid
the hardships of serving remote villages. Several teachers working in hill region are close family
members of powerful politicians, PRI representatives and bureaucrats who would never be
willing to be posted in difficult places. Several positions of subject teachers in science stream are
vacant in government schools. Facilities within schools such separate toilets for girls, furniture
and labs are serious bottlenecks. (This also emerged during discussions with teachers and
students in Government Inter College, Thalisain). The sparsely populated villages coupled with
distantly located education facility takes a substantial travel time of children for attending school.
Due to this, many of village girls discontinue their education associated with their safety and

38
comfort. It is rather dismal state of public education institutions in many parts of Hill Region of
Uttarakhand despite their rapid expansion after the formation of new state. Though several
private schools have mushrooming growth in small market places/towns, these are hardly
accessible to those residing in remote areas.
The region also could not benefit from the rapid growth in self-financed technical and
professional educational institutions as only six out of 89 are located in Hill Region (Joshi,
2010). This lopsided development in the field of higher education has bereft the region of several
educational development related backward and forward linkages.
There is a huge drop out of students after their school education. Many of parents are not
in a position to send their children for higher and technical education which are located at far off
places. Such children, mainly males, resort to migration and help their families in supporting
their household income. During our visit to a senior secondary school, an overwhelming majority
of male students preferred to out-migrate and find job either in armed forces or any regular
salaried jobs. There is hardly any vocational counseling and guidance available to these young
and enthusiastic minds at their schooling stage which could shape their preferences and options
for a better career. We could hardly come across any skill development centres nearby our
sample villages. People are also ignorant about the Prime Minister’s Skill Development
Programme.
Similar to educational infrastructure, access to health services is a major concern. There
has been a tremendous expansion of public health institutions under NRHM. There were 9
CHCs, 28 Block level PHCs, 42 Additional PHCs, 117 Allopathic Dispensaries and 413 Sub-
centre in Pauri Garhwal and Almora districts during the year 2012-13. Despite such expansion,
these centres are facing acute shortage of human resources, particularly that of Doctors and Lab
Technicians. Over 40 per cent of sanctioned positions of Doctors, 54 per cent of Lab Technicians
and 16 per cent of Nurses are lying vacant in Uttarakhand. Among working Doctors nearly one-
fifth are on contractual appointment (GoUK, 2012, Uttarakhand PIP 2011-12, Uttarakhand
Health & Family Welfare Society, Dehradun). This situation is further aggravated in the Hill
Region where a very few of Doctors are willing to join the health services (GoUK, CM’s
presentation to Planning Commission, 12th Plan). Such human resource shortages have seriously
affected the availability and quality of health services. The other issues of very poor quality of
health services relate to lack of medicines, lack of personal care and visits of doctors to villages.
Due to this, dependence on private health services and that too of substandard quality at higher

39
costs is a common feature of health care by villagers. Villagers complained that even for minor
ailments doctors refer patients to distant CHCs or district hospitals, which involve huge personal
costs for the patient. Geographical terrain and associated lack of access to transport facility at the
doorstep is yet another major hurdle to health care in the hill region. Thus, concerns for better
health care also act as another major driver of household decision to permanently out-migrate to
cities and towns. The Emergency Health Service (called 108 service) has proved to be very
useful in providing people emergency health support in hill region of Uttarakhand. It has saved
many lives, but the challenge is of improving the access and quality of overall health care system
in the villages.
In brief, despite improvement in road and other infrastructure, lack of quality education
and health facilities compel many out-migrant workers to take their families along with them in
the hope of better education and health care at their place of migration. Everybody wants to
avoid the hard life his/her village. This point strongly emerged during our discussions with a
cross section of respondents.
Constraints Identified by Villagers
In our earlier work (see Mamgain et al., 2005) the major constraints identified by villagers were
lack of employment opportunities, lack of knowledge and skills, poor infrastructure facilities, the
passive nature of banks for financing the credit needs and market support. People were reluctant
to put their entire agricultural land or even a substantial part of it for the production of
commercial crops due to food security constraints. During our present field survey, the
increasing menace of wild animals in destroying crops has emerged another major challenge in
the sample villages. This has dissuaded farmers to cultivate their lands. In FGDs, many villagers
pointed towards the irregular and inferior supply of food grains through PDS.
Some of the other constraints that were identified in FGDs (Mamgain et al., 2005; present
Field Survey) which have a direct bearing on the livelihoods and out-migration of the rural
population in the Hill districts of Uttarakhand are:
1. Lack of quality education.
2. Many schools are facing a shortage of teachers, which in turn is affecting the education of
children.
3. Absence of teachers from schools is a common feature.
4. No major facilities for technical education at the block level.

40
5. High literacy rates but least technical competencies.
6. High incidence of unemployment among the youth.
7. Educated youth unwilling to take up agriculture related tasks.
8. Higher incidence of migration of educated male youth.
9. Lack of public health facilities. Even those which exist are of a poor quality.
10. People have to largely depend on quacks/untrained practitioners largely for health care.
11. The old system of Ayurvedic medicine disappearing.
12. Major expenditure in case of illness.
13. Drinking water is a major problem.
14. High cost of maintenance of infrastructure
15. Frequent damage to agricultural land due to land slides
16. Destruction of crops by wild animals like pig, bore, bear, stag, etc
17. Fuel wood is a major problem. Women have to travel long distance to collect fuel wood.
18. High incidence of alcoholism among rural males.
19. Poor governance and high corruption in public offices.
20. Poor quality of assets created under government supported programmes.
21. Nexus between local politicians, contractors and government functionaries.
22. General lack of entrepreneurship
23. Highly overburdened women
24. Safety of women
25. Changing social fabric in favour of market forces
Way out suggested by villagers: Suggestions made by villagers towards improving
employment opportunities and quality of life include a plethora of issues and areas which require
immediate policy interventions. These include consolidation of farm land, diversification of
crops towards high value and less irrigation intensive crops; better R&D of agricultural extension
services, improving access to markets for farm and non-farm produces, use of MNREGA for
farm development, village tourism, drinking water, road connectivity, quality education
infrastructure such as residential schools and skill development centres in every block, quality
health services, mobile services for health checkups, promotion of village level organizations for
development, etc.
41
VI. POLICY INITIATIVES
Development of hill areas has been a policy priority in the national planning process since long.
Special Hill Area Development Programme was initiated in Sixth Plan period for the
development of hill regions in the country. The main emphasis had been on creation of
infrastructure facilities and social and community services during the Sixth and Seventh Plan
periods. Production sectors and sectors that have direct bearing on environment preservation
have received attention in subsequent plans under the Hill Area Development plans of Planning
Commission. The state has been accorded a Special Category Status in 2002 by the Planning
Commission. A widespread backwardness in the Hill Region has been a major plank for the
demand for new state. One of the biggest challenges before the new state, therefore, was to
initiate a plethora of measures for promoting all round development of Uttarakhand without
losing precious time. Some of the important policy measures initiated by the Government of
Uttarakhand are critically examined in the following sections.
Industrial Policy
Towards achieving all-round development of the State, the government of Uttarakhand has
initiated several policy measures since its formation in November 2000. The first Industrial
Policy of the State was prepared in 2001. Keeping in view the fast changing economic scenario,
the State prepared its New Industrial Policy in June 2003, and offered major incentives. These
included: (a) for next five years for the companies and 25% for others, (b)100% central excise
exemption for ten years on items other than those mentioned in the negative list in the
concessional industrial package announced by the Central Government; (c) exemption
from entry tax on Plant & Machinery for setting up industry or undertaking substantial
expansion and modernization, and (d) Capital investment subsidy @ 15 per cent subject to a
maximum of Rs. 60 lakh. The policy on the sectors where Uttarakhand has inherent advantage
like Agro and Food Processing, Floriculture, Handloom, Hydropower, Khadi and Village
Industries and Tourism. Subsequent to this, Integrated Industrial Development Policy was
launched in February 2008.
There has been tremendous progress in industrial development in the state. The number
of industries registered under Factories Sector Act increased by over seven times from 698 in
2001-02 to 2843 in 2011-12. Employment in these factories jumped over 8.4 times from 40880
to 342385 during this period (CSO, ASI data). Unfortunately, hill areas remained almost

42
untouched in industrial development as most of the units were located in plain areas of the state.
Similarly, there has been a big jump in the number of MSMEs in the state, but again largely were
confined to plain areas of the state. Since industrial policy of the state could hardly benefit hill
areas, a separate Hill Industrial Development Policy was announced in 2008 for 10 years to
attract industries to hill districts. However, this policy was almost non-starter till 2011, when
Government of Uttarakhand amended 2008 policy and extended its incentives like upto 90 per
cent tax rebate, transport subsidy and rebate on power tariff till 2025. It also decided to set up
11 industrial hubs at district headquarters. With initial hiccups, the policy has started attracting a
growing number of units to hill areas—643 in 2008-09 to 911 in 2011-12, employing about 3077
persons in 2011-12. The impact of this policy has yet to percolate on a large scale to block
headquarters. There are several issues related to creation of quality infrastructure such as roads,
buildings and power supply which need to be addressed.
For harnessing the potential of tourism, the State has its Tourism Policy under which the
activities include developing state-of-the-art infrastructure, year round tourism, development of
new tourist destinations, promotion of tourism oriented handicrafts industry and cuisine and
human resource development. Towards linking local population with tourism related activities as
well as employment generation, the State government launched the Veer Chandra Singh
Garhwali Paryatan Swarozgar Yojana. This is a credit-cum-subsidy scheme with a maximum
loan of Rs. 10 lakh with a subsidy to the extent of 20 per cent of the project cost subject to a
maximum of Rs. 2 lakh. Assistance is given for fast food centres, setting up of retail outlets for
local handicrafts, transport, motels, hotels, equipment for adventure sports, setting up of tourist
information centres with PCs, restaurants, etc. Tourism, thus, is being seen as a source of
employment generation both directly as well as indirectly.
However, the potential of tourism and other related activities has yet to be harnessed for
creation of employment and income in the hill districts of Uttarakhand. At present most of the
tourism is religious in nature, which has also been severely damaged due to the disaster in Kedar
valley during June 2013. There are several places and locations in hill districts which are yet to
be explored and developed fully for attracting tourist inflows to the region. There are serious
lacks of good quality road connectivity, suitable accommodation, drinking water and trained
human resources. Equally important issues that hinder the effective marketing of the state as a
tourism destination are lack of awareness of Uttarakhand as a tourism destination; ineffective
branding of the state; lack of a marketing strategy and expensive annual campaigns that are not
43
sufficiently focused; development and operational issues; awareness of the scheme among the
locals, lack of skill development facilities, and the virtual non existence of public-private sector
coordination.
For harnessing the potential of agriculture and horticulture the State government set up
many development boards like the Organic Board, Jatropa Board, Board for Development of
Aromatic and Medicinal Plants, the Organic Farming Board, Tea Board, Bamboo Fibre Board,
Technology Mission for Integrated Development of Horticulture, Livestock Board, Sericulture
and the Watershed Board. An Integrated Horticulture Development Programme has been
launched in the hill districts of Almora, Pauri Garhwal and Chamoli. A separate university of
Horticulture has been established in Bharsar, Pauri Garhwal for education, research and
extension services.
For improving the livelihoods in hill region, Government of Uttarakhand with the
financial support of IFAD is implementing Uttarakhand Livelihoods Improvement Project for the
Himalayas, commonly known as Ajeevika since 2004. The programme is being implemented in
five districts of Almora, Bageshwar, Chamoli, Tehri and Uttarkashi, covering 959 villages across
17 Development Blocks. The programme has been successful in improving farm productivity,
ensuring food security, access to markets and access to credit to rural households.
Yet another Integrated Livelihood Support Project is being implemented by Uttarakhand
Watershed Development Unit with the financial support of IFAD in seven Development Blocks
in three districts of Pauri Garhwal, Champawat and Nainital. The strategy involves supporting
and developing food production systems and promotion of cash crops through improved
technology and market support. It also supports rural tourism and skill development for
remunerative employment.
Despite a comprehensive organizational structures and targeted programmes initiated
over the years for agriculture and horticulture development, the position of agriculture and
horticulture development in Hill Region could not improve at the desired levels. In our sample
villages in Almora and Pauri Garhwal districts, there are hardly any evidence of use of better
farming practices in crop production, horticulture, poultry, dairy and fishery production. This is
mainly due to lack of agricultural extension services available to villagers to improve their farm
practices and productivity. Hardly any upscaling efforts are being made to improve farming
practices and small enterprise development to a large part of hill region.
44
Special financial allocations are also provided under various Central Finance
Commissions to hilly states to their environmental protection. The Thirteenth Finance
Commission has also recognized the need for incentivizing forest conservation and
compensating states for economic disadvantages arising from the maintenance of forest cover.
The Commission has recommended a forest formula designed to take into consideration various
factors and allocated a sum of Rs.5,000 crore for compensating States for these purposes.
However, it is seen that apart from Arunachal Pradesh which has been given a highest allocation
of Rs.728 crore over the 5 year period, the allocation to other States is much lower with Sikkim
getting Rs.40.56 crore and Uttarakhand Rs.205.44 crore (GoUK, 2014). Government of
Uttarakhand has been arguing for a larger share under this provision made by the Finance
Commission.
In brief, the development strategy of Uttarakhand government has made remarkable
achievements within a short period by accelerating its economic growth substantially as
compared to many states in India. This growth process has been largely led by the development
of manufacturing and construction activities in the state. But this development strategy has
resulted huge regional inequalities within the state as Hill Region lagging far behind than its
plain regions in economic development. The spillover effects of such high growth could hardly
be harnessed, especially in the creation of employment and income opportunities in hill regions,
thereby fuelling the outmigration of able bodied persons form the hill region.
Policy Issues
The policy framework for the all-round development of Hill Region of Uttarakhand is
comprehensive and appreciable. However, Uttarakhand needs targeted growth strategy that
resembles as well as differs in critical ways for hills. Despite high social indicators, growth
prospects in hills are hampered by sparse population, severely adverse terrain, high cost of
construction and service delivery and general livability challenges (GTZ Report cited in World
Bank, 2012, p. 53). In particular, efforts need to be made to generate greater progress in niche
agriculture and horticulture and in higher value services. Uttarakhand has not benefited greatly
from the growth in services that has fueled much of the growth in the rest of India. The
challenge lies in weighting the public policy needs appropriately to achieve balance between
ecology and economics.
There are encouraging examples of promoting sustainable livelihoods, linking these to
value chains and improving quality of life of rural areas in the hill districts, being undertaken by
45
various government agencies, bilateral donors and NGOs. A study by Choudhary et al., 2013,
for ICIMOD amply shows about the tremendous opportunities for income generating activities
both in farm as well non-farm sector through value chain development of high-value products
and services. In this entire process, the role of local communities is of paramount importance for
upstream interventions. Equally important are improved access to information, skills,
technology, markets, policy and institutional support leading to better terms of engagement for
small producers (p.32). Policies need to be implemented fairly and/or developed with a pro-poor
and mountain bias. Institutions responsible for the implementation of such policies must be pro-
active and develop a synergy and coordination to avoid conflicts and produce better results.
Mobilising and empowering communities with information, skills and support services are of
paramount importance.
Choudhary et al. (2013) argue that given the diversity, fragility and marginality of
mountain areas, a straight jacket policy frame will not work. Rather, area policies need to be
made by understanding the local situations and the key leverage points that can address the
problems of small producers in hill region. Thus, there is a need for innovative strategies that
take into account both inert-and multidisciplinary actions that address the constraints. This will
necessitate streamlining of State Government line departments and making these accountable for
mountain area development.
Lack of Pro-active Policies for attracting Return Migrants
It is believed that due to lack of any policy and programme for attracting the skills and abilities
of return migrants, a large number of out-migrants tend to settle permanently outside their
villages along with their households. This has increased the tendency of out-migration of an
entire household. The migration has also adversely affected the source areas in terms of loss of
educated and experienced human resources, which could otherwise would have been utilized
locally (Mamgain, 2004). The increased migration process in Uttarakhand's hill districts thus
could hardly transform the local economy in the form of increased flow of remittances as has
been seen in Kerala and to some extent, Bihar (Deshangikar and Farrington, 2009).
At the same time, there are evidences to suggest that how farm diversification in Rawain
valley in Uttarkashi district has transformed its local economy with the help of local
development agencies and government support. Evidences also suggest the role of NGOs in
promoting cooperatives of small and marginal farmers in hill districts of Pithoragarh and
Champawat and reducing their vulnerabilities (CBED, 2012). These experiences have

46
encouraging impact on the local economy in a form of reduced out-migration of semi-skilled and
unskilled persons from marginal cultivating households associated with their improved earnings.
To conclude, poor resource base for livelihoods with least information of modern
technical know-how to improve income opportunities is a common feature for rural households
in hill districts of Uttarakhand. The uncertainties in land based production activities along with
poor productivity levels have forced most of the rural households to resort to migration.
Role of Migrants and Their Diasporas
The non-resident Uttarakhandis (NRUs) can play major role towards promoting the overall
development of the State. They can be role-models for resident Uttrakhandis in their specialized
fields. There is a need to promote region-wise melas relating to development issues concerning
people in various fields such as education, skill training, career counseling, health care,
governance, right to information, development debate, networking, promoting cultural heritage,
technology knowledge, etc. In fact, they can act as "Watch Pole" on government policies and
programmes through their apex umbrella organization. NRUs can help in developing and
strengthening several voluntary organizations, in the State, related to their respective fields of
knowledge and expertise. In fact, they can adopt certain villages and initiate a development
process therein. NRUs can also support the poor children of Uttarakhand in their studies by
establishing some fellowships.
There is a good example of such diasporas actively engaged in various socio-economic
development activities in Musyari in Pithoragarh district such as revival and strengthening of old
educational institutions for quality education, annual sporting events including cultural events by
Johar Club, tree plantation and environmental awareness by Johar Shuaka Welfare Society,
organising medical camps by Johar-Munsyari Doctors Association, etc. Thus, Munsyari, at the
micro-level, presents a modest example of how one positive move on the part of a group of
returned migrants has led into a range of very innovative initiatives which has not only improved
the over-all environ and ambience of the area but has also resulted in a substantial private
investment on the part of the return migrants. Improved ICT connectivity has also encouraged a
far larger number of visitors both from within India and abroad. What PADIMA study has
indicated can also be seen here in action, triggered by mostly the return migrants, who with a
relatively higher educational attainment level has made an impact that also has catalysed even
the normally passive public sector (Tolia, 2015).
47
VII. CONCLUSION
The overall growth path of Uttarakhand has been impressive since its separation from Uttar
Pradesh. However, this growth has created huge regional inequalities within the State. The
growth process could hardly create productive employment and income opportunities in Hill
region of Uttarakhand. There is hardly any visible progress made towards developing
remunerative agriculture in most of the villages in Hill Region. As a result, there remains hardly
any interest in agriculture for almost all young men folk due to hard work involved, very low
productivity and frequent destruction of crops by wild animals. Outside agriculture, employment
opportunities in construction grew significantly, but local people are mostly unwilling to
undertake manual work. Their access to skilled jobs in construction sector was severely affected
due to lack of such skill training. The employment opportunities in other sectors such as trade,
transport and government services though improved in Hill Region but remained limited to few
people. Thus, lack of remunerative livelihoods coupled with obsession for salaried jobs has
forced a large number of youth to migrate to cities in search of salaried jobs which are of
relatively longer duration irrespective of earnings. The situation has become quite grim in some
pockets as there are hardly few people left in single digit in a number of villages. Such
destitution needs to be reversed.
The policy framework for the all-round development of Hill Region of Uttarakhand is
comprehensive and appreciable. However, the New Industrial Policy of the State, which has
almost remained ineffective in attracting investment to hill areas of the State, needs to be re-
looked and made more effective to ensure balanced industrial growth by attracting more capital
to backward districts, particularly in the hill areas. The persistent bias in credit flow for priority
sectors is yet another example where the banking sector prefers to finance only developed
districts and is hesitant to take risks in the hilly districts. In this process, the gap in development
is bound to widen. As a result there is hardly any visible progress made towards developing
remunerative employment opportunities in farm as well as non-farm sectors in most of the
villages in Hill Region. There remains hardly any interest in agriculture for almost all young men
folk due to hard work involved, very low productivity and frequent destruction of crops by wild
animals. Outside agriculture, employment opportunities in construction grew significantly, but
local people are mostly unwilling to undertake manual work.
Suggestions made by villagers towards improving employment opportunities and quality
of life include a plethora of issues and areas which require immediate policy interventions. These
48
include consolidation of farm land, diversification of crops towards high value and less irrigation
intensive crops; better R&D of agricultural extension services, improving access to markets for
farm and non-farm produces, use of MNREGA for farm development, promoting village
tourism, drinking water, road connectivity, quality education infrastructure such as residential
schools and skill development centres in every block, quality health services, mobile services for
health checkups, promotion of village level organizations for development, etc. These would
require a multi-disciplinary innovative institutions for the development of Hill Region.
Our field experience in rural areas and discussions with various line departments of the
State government indicate that there is a big gap between the productive employment needs of
rural households and the efforts that are being made by the government towards this end. The
huge potential of horticulture and tourism needs to be developed on a wider scale in the Hill
Region. Agriculture extension services need to be strengthened to improve their outreach and
effectiveness. Various forms of tourism as outlined in the Tourism Policy of the State need to be
developed in letter and spirit in a given time frame. This will create large number of employment
opportunities for local youth and arrest their distress driven migration. Similarly, given the
relatively higher educational levels of Hill population, expansion of communication network,
better electricity and comparatively cheap land, there is a good scope for developing knowledge
based IT services in Hill districts.
Towards harnessing the potential of employment opportunities, skill development of both
men and women is crucial for various trades and occupations. Most of the people including
migrants of the Hill Region though are better educated but lack skill training. This severely
affects their employability and earnings. This would require their training in a larger proportion
in different vocations. The skill training measures need to be generic as well as area specific
depending on the choices and opportunities for such skills.
With the growing emphasis on protection of environment in the context of climate
change, role of Hill and mountain Regions is being seen very critical towards this endeavour. In
this direction, Eco Task Force could be created on the lines of Territorial Army by recruiting
local people, whose services can be used in forestation and their maintenance. This will not only
help in improving environment but also provide salaried employment to local youth.
There are encouraging examples of promoting sustainable livelihoods, linking these to
value chains and improving quality of life of rural areas in the hill districts, being undertaken by
various government agencies, bilateral donors and NGOs. A study by ICIMOD (2013),
49
demonstrates tremendous opportunities for income generating activities both in farm as well
non-farm sector through value chain development of high-value products and services in hill
regions. In this entire process, the role of local communities is of paramount importance for
upstream interventions. Equally important are improved access to information, skills,
technology, markets, policy and institutional support leading to better terms of engagement for
small producers (p.32). Policies need to be implemented fairly and/or developed with a pro-poor
and mountain bias. Institutions responsible for the implementation of such policies must be pro-
active and develop a synergy and coordination to avoid conflicts and produce better results.
Mobilising and empowering communities with information, skills and support services are of
paramount importance.
In sum, the programmatic interventions must support the higher growth initiatives in Hill
Region of Uttarakhand which have yet to witness a remarkable improvement in employment and
income opportunities for their population. These efforts also to percolate to poor and
marginalised sections of the society such as SCs and religious minorities. The development
dreams of people of Uttarakhand, as they visualized at the time of demand for a new State,
particularly those residing in hill districts must be addressed on a priority basis. In fact, there is
need for a strong political will to initiate a process of niche based development strategy for the
hill areas of the State with a strong support of bureaucracy. The myopic vision of developing
already developed regions will not prove to be an inclusive strategy. This will also not be a
tribute to those who sacrificed their lives for making Uttarakhand a State of their dreams where
everybody gets decent work opportunities with least brain drain.
50
References
Awasthi, I.C. (2012), Livelihood Diversities in Mountain Economy: Constraints and Opportunities, Concept Publishing Company Pvt.Ltd., New Delhi.
Atkinson, E.T. (1882), North Western Provinces Gazetteers, Vol. XII. (Reprinted in 1976), The Himalayan Gazetteer, Vols, I, II and III, Cosmo Publications, Delhi.
Banskota, M.; Papola, T.S.; and Richter, J. (eds.) ( 2000), Growth, Poverty Alleviation and Sustainable
Resource Management in the Mountain Areas of South Asia, International Centre for Integrated Mountain Development, Kathmandu, Nepal.
Bora, R.S. (1996), Himalayan Out-migration, Sage Publication, New Delhi.
CBED (2012), Annual Report 2011-12, Centre for Business and Entrepreneurial Development, Dehradun
CSO (2013), Annual Survey of Industries, New Delhi
Deshangikar, P. and Farrington, J. (2009), Circular Migration and Multidimensional Livelihood Strategies in Rural India, Oxford University Press, New Delhi.
Dhyani, R.P. (1994), An Approach to Economic Planning for the Rural Poor of Central Himalayas, Classical, New Delhi.
Dobhal, G.L. (1987), Development of the Hill Areas: A Case Study of Pauri Garhwal District, Concept, New Delhi.
Fei, J.C.H. and Ranis, G. (1964), Development of the Labour Surplus Economy: Theory and Practice,
Irwin Press, Homewood.
GoUK (2012), Uttarakhand Twelfth Five Year Plan and Annual Plan 2012-13, Presentation of Finalisation Meeting between Deputy Chairman, Planning Commission and Chief Minsiter of Uttarakhand, Government of Utarakhand, New Delhi.
GoUK (2012), Uttarakhand PIP 2011-12, Uttarakhand Health & Family Welfare Society, Dehradun.
GoUK (2014), Annual Plan 2013-14, State Planning Commssion, Government of Utarakhand, New
Delhi.
Government of India, Ministry of Tourism (2012), Interim Report Uttarakhand, Identification of Tourism Circuits across India, New Delhi.
ICIMOD (2010), Labour Migration and Remittances in Uttarakhand, Case Study ReportInternational Centre for Integrated Mountain Development, Kathmandu. ICIMOD (2013), “The Value Chain Approach for Mountain Development: Case Studies from Uttarakhand, India”, ICIMOD Working Paper 2013/6, Authors: Choudhary, Dyutiman; Ghosh, Idraneel; Chauhan, Sushrut; Bahti, Sanjay and Juyal, Manish, International Centre for Integrated Mountain
Development, Kathmandu. Institute for Human Development (IHD) (2011), Poverty and Gender Analysis of Uttarakhand, A study for the International Fund for Agricultural Development, June.
51
Jayraj, D. (2013), “Family Migration in India: “Push” or “Pull” or Both or What?”, Economic and Political Weekly, Vol. XLVIII, No. 42., pp. 44-52. Joshi, B.K. (2010), “Reflections on Reform of Higher Education in Uttarakhand”, Occasional Paper 1, Doon Library & Research Centre, Dehradun. Lee, E.S. (1966), “A Theory of Migration”, Demography, Vol. 3, No.1.
Lewis, Arthur (1954), “Economic Development with Unlimited Supplies of Labour”, Manchester School of Economic and Social Studies, May.
Mamgain, Rajendra P. (2004), Employment, Migration and Livelihoods in the Hill Economy of Uttaranchal, Ph.D. Thesis, Centre for the Study of Regional Development, Jawaharlal Nehru University, New Delhi.
Mamgain, Rajendra P.; Awasthi, I.C. and Mehta, Balwant (2005), Employment Generation in Uttaranchal: Constraints and Opportunities, Institute for Human Development, New Delhi
(mimeo).
Papola, T.S. (2000), “Enterprise Development for Poverty Alleviation with Sustainable Resource Management: Trends, Experiences and Policies in the HKH Region”, in Banskota, Papola and Richter (eds.) (2000).
Planning Commission (2007), Press Note on Poverty Estimates, 2004-05, New Delhi. Planning Commission (2013), Press Note on Poverty Estimates, 2011-12, July, New Delhi. Planning Commission (2013), Twelfth Five Year Plan (2012-2017): Faster, More Inclusive and Sustaibale Growth, Vol. I, New Delhi.
Srivastava, Ravi (2011), “Internal Migration in India: An Overview of Its Features, Trends and Policy Challenges”, Paper presneted at UNESCO-UNICEF National Workshop on Internal Migration and Human Development in India, 6-7 December 2011, New Delhi. Trivedi, Anupam (2012), “Ghost Villages”, Hindustan Times, 21 January, Rudrapryag.
Tolia, R.S. (2015), "Becoming part of Solution", Doon University, Dehradun (memieo).
Umar (2012), “The Ghost Villages of Uttarakhand”, Tehelka Magazine, Vol. 9, Issue 27, 7 June.
UNESCO (2013), Social Inclusion of Internal Migrants in India, United Nationas Educational, Scientific and Cultural Organization, June, New Delhi.
Walton, H.G. (1910), British Garhwal: A Gazetteer, Reprint 1994, Indus Publishing Company, New Delhi. World Bank (2012), India: Uttarakhand Economic Assessment, Report No. 62494-IN, Poverty Reduction and Economic Management Unit, South Asia Region, New Delhi.
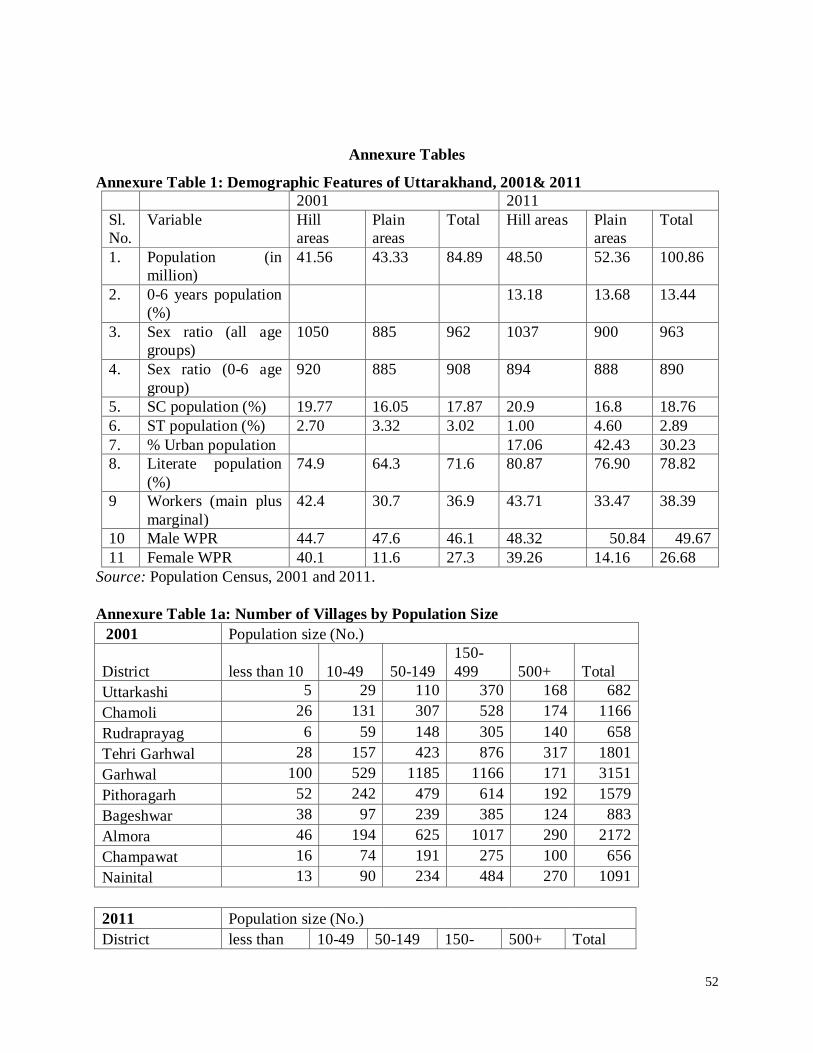
52
Annexure Tables
Annexure Table 1: Demographic Features of Uttarakhand, 2001& 2011
2001 2011
Sl.
No.
Variable Hill
areas
Plain
areas
Total Hill areas Plain
areas
Total
1. Population (in
million)
41.56 43.33 84.89 48.50 52.36 100.86
2. 0-6 years population
(%)
13.18 13.68 13.44
3. Sex ratio (all age
groups)
1050 885 962 1037 900 963
4. Sex ratio (0-6 age
group)
920 885 908 894 888 890
5. SC population (%) 19.77 16.05 17.87 20.9 16.8 18.76
6. ST population (%) 2.70 3.32 3.02 1.00 4.60 2.89
7. % Urban population 17.06 42.43 30.23
8. Literate population
(%)
74.9 64.3 71.6 80.87 76.90 78.82
9 Workers (main plus
marginal)
42.4 30.7 36.9 43.71 33.47 38.39
10 Male WPR 44.7 47.6 46.1 48.32 50.84 49.67
11 Female WPR 40.1 11.6 27.3 39.26 14.16 26.68
Source: Population Census, 2001 and 2011.
Annexure Table 1a: Number of Villages by Population Size
2001 Population size (No.)
District less than 10 10-49 50-149
150-
499 500+ Total
Uttarkashi 5 29 110 370 168 682
Chamoli 26 131 307 528 174 1166
Rudraprayag 6 59 148 305 140 658
Tehri Garhwal 28 157 423 876 317 1801
Garhwal 100 529 1185 1166 171 3151
Pithoragarh 52 242 479 614 192 1579
Bageshwar 38 97 239 385 124 883
Almora 46 194 625 1017 290 2172
Champawat 16 74 191 275 100 656
Nainital 13 90 234 484 270 1091
2011 Population size (No.)
District less than 10-49 50-149 150- 500+ Total
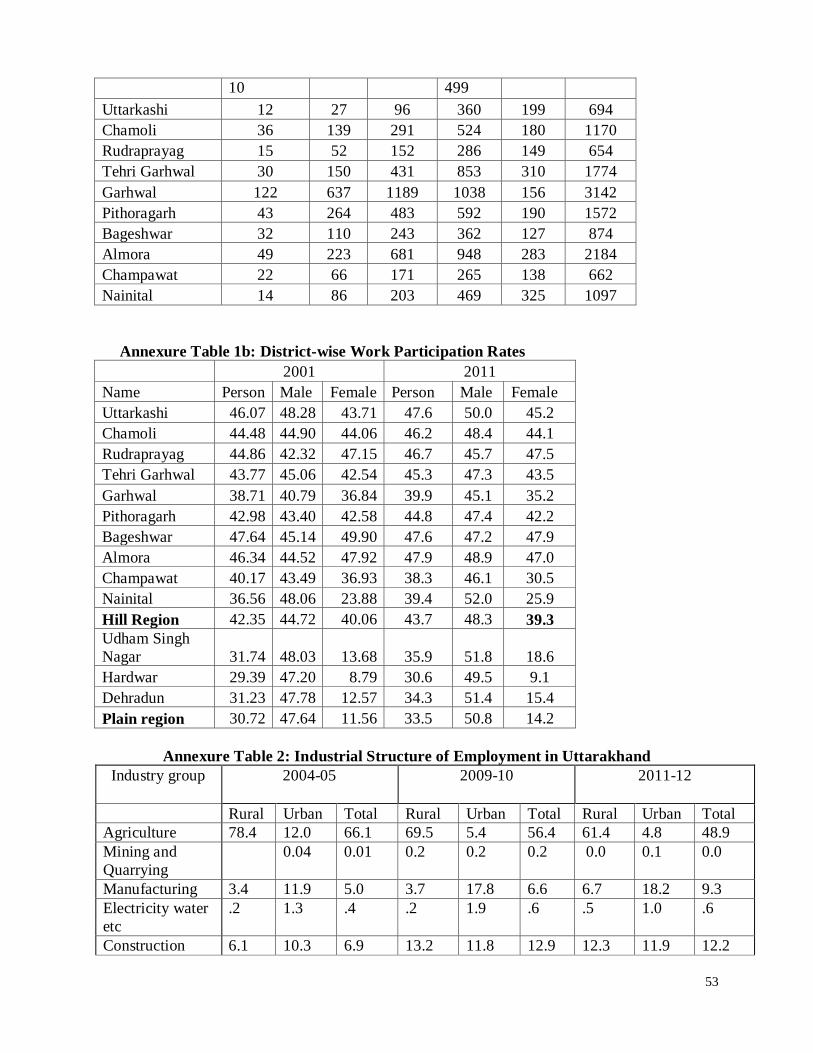
53
10 499
Uttarkashi 12 27 96 360 199 694
Chamoli 36 139 291 524 180 1170
Rudraprayag 15 52 152 286 149 654
Tehri Garhwal 30 150 431 853 310 1774
Garhwal 122 637 1189 1038 156 3142
Pithoragarh 43 264 483 592 190 1572
Bageshwar 32 110 243 362 127 874
Almora 49 223 681 948 283 2184
Champawat 22 66 171 265 138 662
Nainital 14 86 203 469 325 1097
Annexure Table 1b: District-wise Work Participation Rates
2001 2011
Name Person Male Female Person Male Female
Uttarkashi 46.07 48.28 43.71 47.6 50.0 45.2
Chamoli 44.48 44.90 44.06 46.2 48.4 44.1
Rudraprayag 44.86 42.32 47.15 46.7 45.7 47.5
Tehri Garhwal 43.77 45.06 42.54 45.3 47.3 43.5
Garhwal 38.71 40.79 36.84 39.9 45.1 35.2
Pithoragarh 42.98 43.40 42.58 44.8 47.4 42.2
Bageshwar 47.64 45.14 49.90 47.6 47.2 47.9
Almora 46.34 44.52 47.92 47.9 48.9 47.0
Champawat 40.17 43.49 36.93 38.3 46.1 30.5
Nainital 36.56 48.06 23.88 39.4 52.0 25.9
Hill Region 42.35 44.72 40.06 43.7 48.3 39.3
Udham Singh
Nagar 31.74 48.03 13.68 35.9 51.8 18.6
Hardwar 29.39 47.20 8.79 30.6 49.5 9.1
Dehradun 31.23 47.78 12.57 34.3 51.4 15.4
Plain region 30.72 47.64 11.56 33.5 50.8 14.2
Annexure Table 2: Industrial Structure of Employment in Uttarakhand
Industry group 2004-05
2009-10
2011-12
Rural Urban Total Rural Urban Total Rural Urban Total
Agriculture 78.4 12.0 66.1 69.5 5.4 56.4 61.4 4.8 48.9
Mining and
Quarrying
0.04 0.01 0.2 0.2 0.2 0.0 0.1 0.0
Manufacturing 3.4 11.9 5.0 3.7 17.8 6.6 6.7 18.2 9.3
Electricity water
etc
.2 1.3 .4 .2 1.9 .6 .5 1.0 .6
Construction 6.1 10.3 6.9 13.2 11.8 12.9 12.3 11.9 12.2
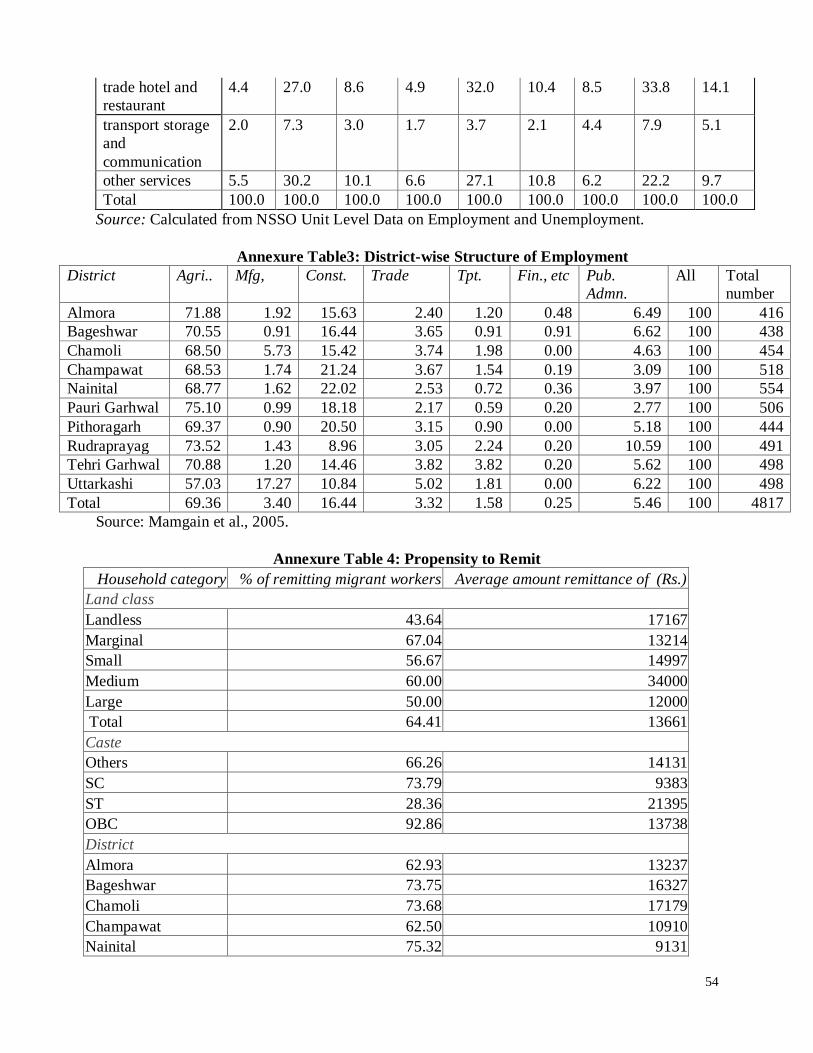
54
trade hotel and
restaurant
4.4 27.0 8.6 4.9 32.0 10.4 8.5 33.8 14.1
transport storage
and
communication
2.0 7.3 3.0 1.7 3.7 2.1 4.4 7.9 5.1
other services 5.5 30.2 10.1 6.6 27.1 10.8 6.2 22.2 9.7
Total 100.0 100.0 100.0 100.0 100.0 100.0 100.0 100.0 100.0
Source: Calculated from NSSO Unit Level Data on Employment and Unemployment.
Annexure Table3: District-wise Structure of Employment
District Agri.. Mfg, Const. Trade Tpt. Fin., etc
Pub.
Admn.
All Total
number
Almora 71.88 1.92 15.63 2.40 1.20 0.48 6.49 100 416
Bageshwar 70.55 0.91 16.44 3.65 0.91 0.91 6.62 100 438
Chamoli 68.50 5.73 15.42 3.74 1.98 0.00 4.63 100 454
Champawat 68.53 1.74 21.24 3.67 1.54 0.19 3.09 100 518
Nainital 68.77 1.62 22.02 2.53 0.72 0.36 3.97 100 554
Pauri Garhwal 75.10 0.99 18.18 2.17 0.59 0.20 2.77 100 506
Pithoragarh 69.37 0.90 20.50 3.15 0.90 0.00 5.18 100 444
Rudraprayag 73.52 1.43 8.96 3.05 2.24 0.20 10.59 100 491
Tehri Garhwal 70.88 1.20 14.46 3.82 3.82 0.20 5.62 100 498
Uttarkashi 57.03 17.27 10.84 5.02 1.81 0.00 6.22 100 498
Total 69.36 3.40 16.44 3.32 1.58 0.25 5.46 100 4817
Source: Mamgain et al., 2005.
Annexure Table 4: Propensity to Remit
Household category % of remitting migrant workers Average amount remittance of (Rs.)
Land class
Landless 43.64 17167
Marginal 67.04 13214
Small 56.67 14997
Medium 60.00 34000
Large 50.00 12000
Total 64.41 13661
Caste
Others 66.26 14131
SC 73.79 9383
ST 28.36 21395
OBC 92.86 13738
District
Almora 62.93 13237
Bageshwar 73.75 16327
Chamoli 73.68 17179
Champawat 62.50 10910
Nainital 75.32 9131
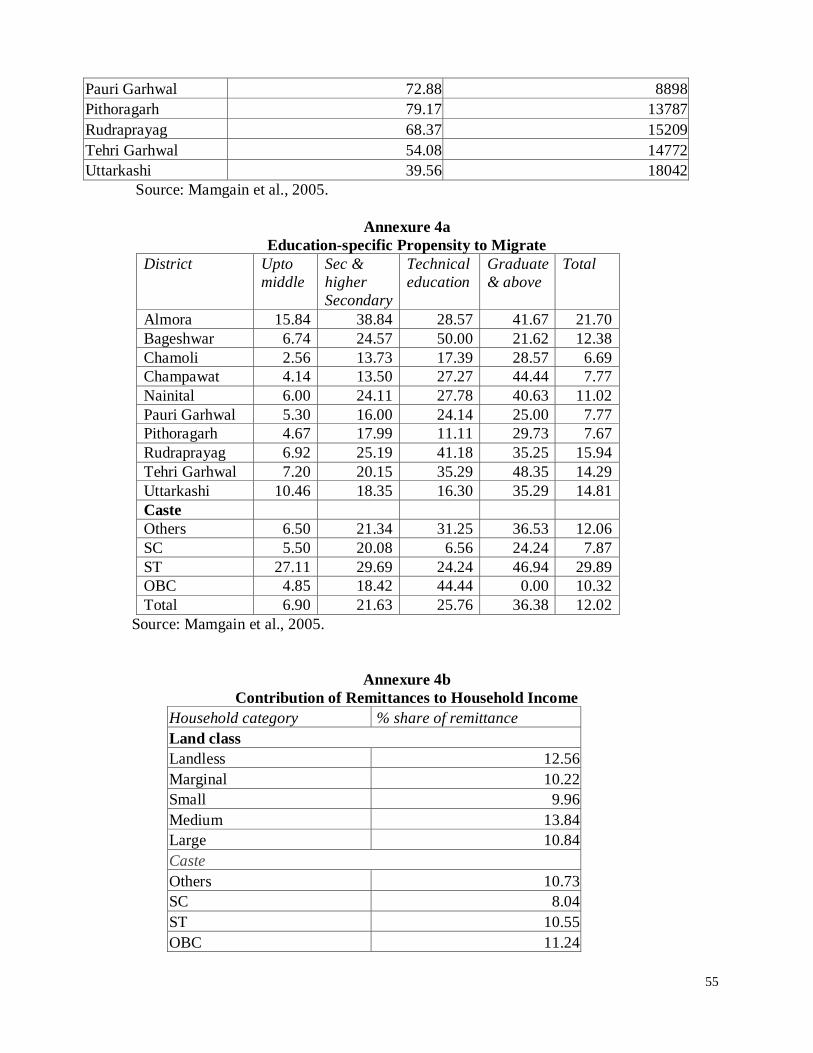
55
Pauri Garhwal 72.88 8898
Pithoragarh 79.17 13787
Rudraprayag 68.37 15209
Tehri Garhwal 54.08 14772
Uttarkashi 39.56 18042
Source: Mamgain et al., 2005.
Annexure 4a
Education-specific Propensity to Migrate
District Upto
middle
Sec &
higher
Secondary
Technical
education
Graduate
& above
Total
Almora 15.84 38.84 28.57 41.67 21.70
Bageshwar 6.74 24.57 50.00 21.62 12.38
Chamoli 2.56 13.73 17.39 28.57 6.69
Champawat 4.14 13.50 27.27 44.44 7.77
Nainital 6.00 24.11 27.78 40.63 11.02
Pauri Garhwal 5.30 16.00 24.14 25.00 7.77
Pithoragarh 4.67 17.99 11.11 29.73 7.67
Rudraprayag 6.92 25.19 41.18 35.25 15.94
Tehri Garhwal 7.20 20.15 35.29 48.35 14.29
Uttarkashi 10.46 18.35 16.30 35.29 14.81
Caste
Others 6.50 21.34 31.25 36.53 12.06
SC 5.50 20.08 6.56 24.24 7.87
ST 27.11 29.69 24.24 46.94 29.89
OBC 4.85 18.42 44.44 0.00 10.32
Total 6.90 21.63 25.76 36.38 12.02
Source: Mamgain et al., 2005.
Annexure 4b
Contribution of Remittances to Household Income
Household category % share of remittance
Land class
Landless 12.56
Marginal 10.22
Small 9.96
Medium 13.84
Large 10.84
Caste
Others 10.73
SC 8.04
ST 10.55
OBC 11.24

56
District
Almora 19.10
Bageshwar 11.80
Chamoli 8.23
Champawat 5.81
Nainital 8.94
Pauri Garhwal 8.17
Pithoragarh 8.61
Rudraprayag 12.75
Tehri Garhwal 12.80
Uttarkashi 7.79
Total 10.36
Source: Mamgain et al., 2005.
Annexure 4c
Percentage Distribution of Migrant Households by Their
Range of Increase in Household Income due to Remittance
Household
category
Range of increase (%) Total
25 25-50 50-100 100-200 200-400 400+
Caste
Others 22.57 8.15 14.42 18.18 15.67 21.00 100.00
SC 25.40 11.11 17.46 15.87 14.29 15.87 100.00
ST 11.76 - 17.65 17.65 23.53 29.41 100.00
OBC 55.56 - 11.11 - 11.11 22.22 100.00
Land class
Landless 42.86 - 9.52 4.76 28.57 14.29 100.00
Marginal 23.61 8.33 15.83 18.06 13.89 20.28 100.00
Small 4.35 13.04 4.35 17.39 30.43 30.43 100.00
Medium - - 25.00 25.00 25.00 25.00 100.00
District
Almora 30.30 9.09 10.61 24.24 12.12 13.64 100.00
Bageshwar 20.41 6.12 22.45 12.24 18.37 20.41 100.00
Chamoli 29.17 4.17 16.67 20.83 16.67 12.50 100.00
Champawat 13.04 13.04 4.35 21.74 17.39 30.43 100.00
Nainital 19.05 4.76 16.67 11.90 11.90 35.71 100.00
Pauri Garhwal 13.89 - 22.22 8.33 38.89 16.67 100.00
Pithoragarh 22.22 11.11 8.33 19.44 8.33 30.56 100.00
Rudraprayag 21.05 12.28 15.79 21.05 8.77 21.05 100.00
Tehri Garhwal 34.88 11.63 13.95 11.63 18.60 9.30 100.00
Uttarkashi 21.88 6.25 15.63 21.88 12.50 21.88 100.00
Total 23.28 8.09 14.95 17.40 15.69 20.59 100.00
Source: Mamgain et al., 2005.