our streets too
TRANSCRIPT

WHY WALKING INFRASTRUCTURE IS A PRIORITY FOR HEALTHY AGEING AND PROSPERITY IN SCOTLAND.
APRIL 2021
OUR STREETS TOO
OUR STREETS TOO
Prepared by Walking | Cycling | Climate Action Ltd for Living Streets Scotland
Authors: Jess Read, Josephine Flood
Reviewers: Penny Morriss, Rachel Lee, Living Streets
Acknowledgements:Thanks to Dr Tessa Strain and Dr Paul Kelly for their insights into the Scottish Health Survey walking data, and thanks to Professor Adrian Davis for access to historic UK walking data.
Physically inactive Achieving less than 30 minutes of physical activity per week
Older people People aged 65 years and older
Very low physical activity Less than 30 minutes of physical activity per week
GLOSSARY:

Foreword 04
Report background 05
Executive summary 06
Policy alignment 09
Recommendations for action 10
Recommendations for transport and active travel funding 11
01 Scotland is ageing 12
02 What is the value of walking for Scotland? 15
03 Why is walking important for older adults In Scotland? 25
04 Evidence for local environments and walking in older people 35
05 Evidence for walking infrastructure interventions and older people 38
06 Particulate air pollution peaks and older people 46
07 Living Streets Scotland & Walking Connects 50
CONTENTS

4
FOREWORDWe are not only in the midst of an environmental emergency; our obesity levels and sedentary lifestyles are also on the rise and disproportionately so in our ageing population. Furthermore, the negative fallout of these combined issues is affecting some of us more than others which means that social inequalities continue to be exacerbated.
It is a dark and serious situation we find ourselves in but the good news is a simple solution already exists. We must walk more.
Imagine a world where everyone, especially the people tasked with making strategic decisions in our society, had the time and space to walk more outside in green space. What cosmic shift in our understanding of what it means to be human might take place if this were the case?
Many of us saw inklings of what life could be like during Covid-19 as we were gifted the time and space to reconnect with our bodies, with nature and our immediate community. Many of us were not so fortunate and were instead stuck inside due to poor health or a lack of accessible green space. Both sets of circumstances should inform what happens next as the world picks up pace and our focus begins to return to economic growth.
Currently, it can feel subversive to choose to walk instead of drive places. Safe, shared, green spaces for everyone, and the time and permission to enjoy them, have been neglected in favour of roads and parking for many years. We must act now to reshape our communities in ways that support our ageing population and our future selves to feel connected, safe, confident, and joyful.
This report lays out why, and importantly, how we do this. I welcome its publication wholeheartedly.
Lee CraigieActive Nation Commissioner for Scotland

OUR STREETS TOO 5
Walking ConnectsLiving Streets Scotland has delivered a programme called “Walking Connects” which works in partnership with older people to identify improvements to their local walking environments.
The Walking Connects approach is people-centred and acts to reduce isolation and loss of independence. The project activities support older people to have a voice and influence walking environment changes in their immediate surrounds. This in turn enables independence and benefits others in the community. The Walking Connects programme was funded by the National Lottery Communities Fund. It was delivered in 21 communities working with 11 different local partners from 2016 to 2020.
Why we wrote this reportThe purpose of this report was to place findings from the Walking Connects programme in the wider scientific evidence-base and data context. These findings were related to the role of walking in healthy ageing, walking infrastructure as a determinant of walking for older people, and the wider value of walking in Scotland.
How we developed this reportWe conducted a rapid evidence assessment of scientific studies examining walking infrastructure as a determinant of walking for older people. We then compared several high-quality evidence summaries (including the identified systematic reviews and metanalyses) to community evidence. This included the Walking Connects programme and an insight report conducted by Living Streets examining barriers to walking for Disabled people.
We explored high quality national data sets including the Scottish Health Survey, Scottish Household Survey, and Scottish Transport Statistics for trends of walking for older people. We also reviewed the latest Chief Medical Officers’ guidelines for physical activity for older people. The report includes original carbon and environmental calculations to place walking in a wider socio-economic context.
REPORT BACKGROUND

OUR STREETS TOO 6
Healthy ageing is missing for older people now, and future generationsScotland is an ageing society, with 19% of the population over 65 years and a further 21% of the population between 50 and 64. Despite a high health and social care spend, Scotland has some of the lowest life expectancies in the UK and Western Europe. There is high inequality in healthy life expectancy, with people in the poorest communities living up to 28 fewer years of good health.
Enabling healthy ageing is an immediate priority for older people; it is also an intergenerational justice issue for the health and wellbeing of younger people today who are the older people of the future.
Daily walking is the keystone to healthy ageingWalking for transport is especially important for older people as it combines maintaining physical health with nurturing wellbeing through opportunities for social interactions, purpose in life, and reduced fear and risk of falls. As such, the simple pleasure of being able to walk to the shops is of high value for older people as it embeds walking - and these associated wellbeing benefits - into everyday life.
National data shows that walking is the most important setting for being active for older people in Scotland. However, most older people are not active enough, with 38% of older people being active for less than 30 minutes per week. This level of inactivity is as dangerous as smoking. Walking is particularly important for these highly inactive older people as even small increases in daily walking and social interactions can have large health and wellbeing benefits.
EXECUTIVE SUMMARY

OUR STREETS TOO 7
Good walking infrastructure is important for older peopleThere is a large, high quality evidence base that good walking infrastructure is a fundamental enabler of everyday walking for older people. An extensive body of community evidence compiled by Living Streets Scotland underlines that the walking environment in Scotland is hostile for older people. This aligns with national transport data which show that although walking is a highly equitable form of transport in Scotland, it is least so for older people.
Infrastructure interventions to improve walking infrastructure do work, but general data and reporting of walking needs improvement. There is a lack of interventions specifically for older people and nuance is needed to identify metrics relevant to older people, such as any walking at all and opportunities for social interactions.
Social factors have a promoting effect, and direct value for older peopleThe scientific and community evidence base shows that social factors of feeling connected, feeling safe, feeling confident, and feeling enjoyment are an important part of walking for older people. These social factors act as ‘promoters’, which have an interaction effect with physical infrastructure to enable and maintain walking for older people. They also have direct value by supporting wellbeing, reducing isolation, and risk and fear of falls.
While the Walking Connects programme gives older people a voice to influence micro-interventions in local walking environments, the main aim of the project is to focus on these social factors. Overall, this report has established that there is a strong evidence base that supports the Walking Connects programme, both in its focus on social connectedness and wellbeing, and in the physical improvements to local walking infrastructure to support walking for older people.
Enabling everyday walking for older people is a priority post-CovidCOVID-19 has disproportionately intensified social isolation and restricted daily activity levels for older people. While age is not modifiable, the key modifiable risk factors for vulnerability to COVID-19 - weight, low physical activity, air pollution - are the same risk factors which deeply undermine the health and wellbeing of older people in general, as well as the fundamental prosperity of Scotland.
As such, prioritising the simple pleasure and freedom of everyone, regardless of age, being able to ‘pop to the shops’ on foot is a national priority.
THE WALKING ENVIRONMENT
IN SCOTLAND IS HOSTILE FOR OLDER PEOPLE
OUR STREETS TOO 8
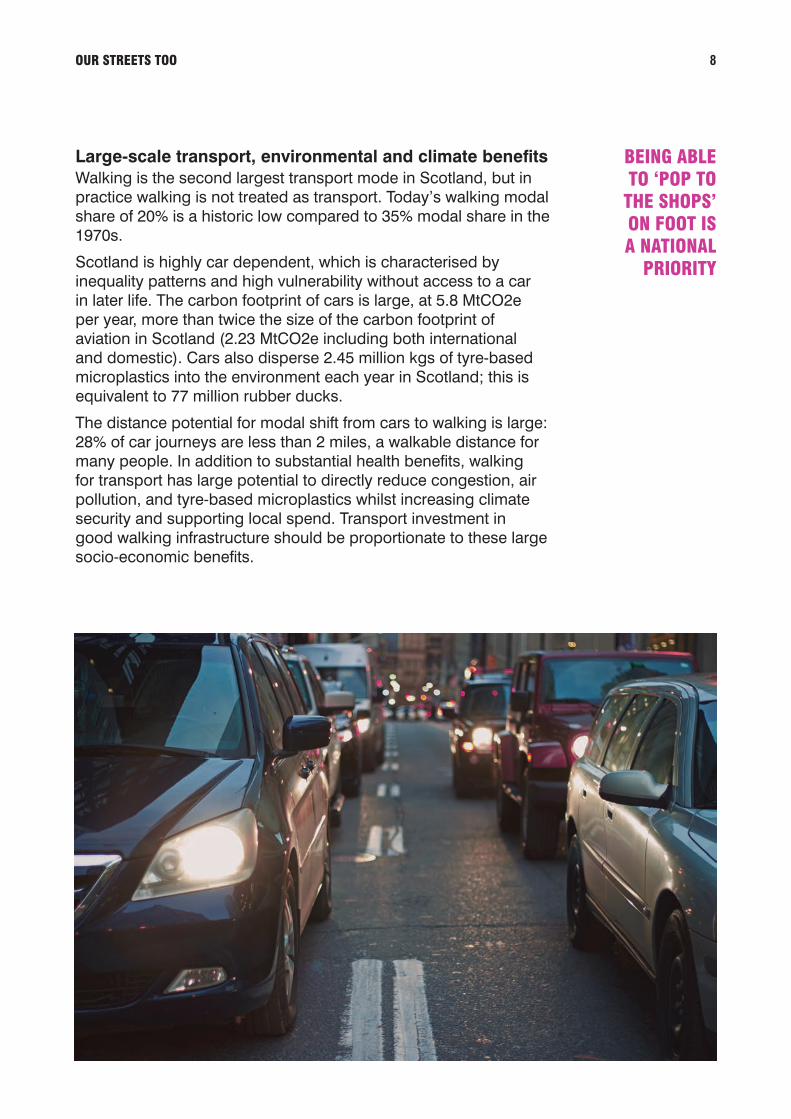
Large-scale transport, environmental and climate benefitsWalking is the second largest transport mode in Scotland, but in practice walking is not treated as transport. Today’s walking modal share of 20% is a historic low compared to 35% modal share in the 1970s.
Scotland is highly car dependent, which is characterised by inequality patterns and high vulnerability without access to a car in later life. The carbon footprint of cars is large, at 5.8 MtCO2e per year, more than twice the size of the carbon footprint of aviation in Scotland (2.23 MtCO2e including both international and domestic). Cars also disperse 2.45 million kgs of tyre-based microplastics into the environment each year in Scotland; this is equivalent to 77 million rubber ducks.
The distance potential for modal shift from cars to walking is large: 28% of car journeys are less than 2 miles, a walkable distance for many people. In addition to substantial health benefits, walking for transport has large potential to directly reduce congestion, air pollution, and tyre-based microplastics whilst increasing climate security and supporting local spend. Transport investment in good walking infrastructure should be proportionate to these large socio-economic benefits.
BEING ABLE TO ‘POP TO
THE SHOPS’ ON FOOT IS A NATIONAL
PRIORITY

OUR STREETS TOO 9
POLICY ALIGNMENT
Economy • Wellbeing Economy
Climate • Climate Change (Emissions Reduction Targets) (Scotland) Act 2019 • Carbon Reduction on Roads
Health • A More Active Scotland: Scotland’s Physical Activity Delivery Plan (2018)
• Let’s Get Scotland Walking: The National Walking Strategy (2014) • Falls and Fracture Prevention Strategy for Scotland, 2019-2024:
Consultation Version (2019) • A Healthier Future – Scotland’s Diet & Healthy Weight Delivery Plan
(2018)
Transport • 20-minute neighbourhoods (emerging 2021) • Active Travel Framework: Key policy approaches to improving the
uptake of walking and cycling in Scotland for travel (2019)
Older People • A Fairer Scotland for Older People A Framework for Action (2019) & Equalities • A Connected Scotland: our strategy for tackling social isolation and
loneliness and building stronger social connections (2019)

OUR STREETS TOO 10
1 Prioritise walking as a form of transport. • Include age-inclusive ‘popping to the shops’ as a specific
transport priority
2 Set a modal target of doubling walking in Scotland from 22% to 40% modal share.
3 Measure walking in transport/traffic surveys and datasets as a default.
4 Develop a simple national design standard for ‘good’ walking infrastructure; collaborate with local authority highways stakeholders to explore viable delivery pathways.
5 Treat car dependency as a public health issue: • At MOTs provide annual carbon footprint, tyre-based
microplastics, and lost days of being active based on short journeys
• Provide particulate air pollution warning in travel and weather news
• Require the car industry to recapture tyre-based microplastics
6 Adopt intergenerational approaches for both wellbeing promotion and being active daily:
• E.g. Walking Connects, Play Streets, Blue Zones
7 Future-proof against placement of e-assets (e.g. charging points, e-scooters, cycle parking) further cluttering and degrading the already poor walking environment. These assets must be placed and used in the carriageway, not the footway.
8 Future-proof against ban on footway parking leading to non-level driveway crossovers.
RECOMMENDATIONS FOR NATIONAL ACTION
SET A MODAL TARGET OF DOUBLING
WALKING IN SCOTLAND FROM
22% TO 40% MODAL SHARE
OUR STREETS TOO 11
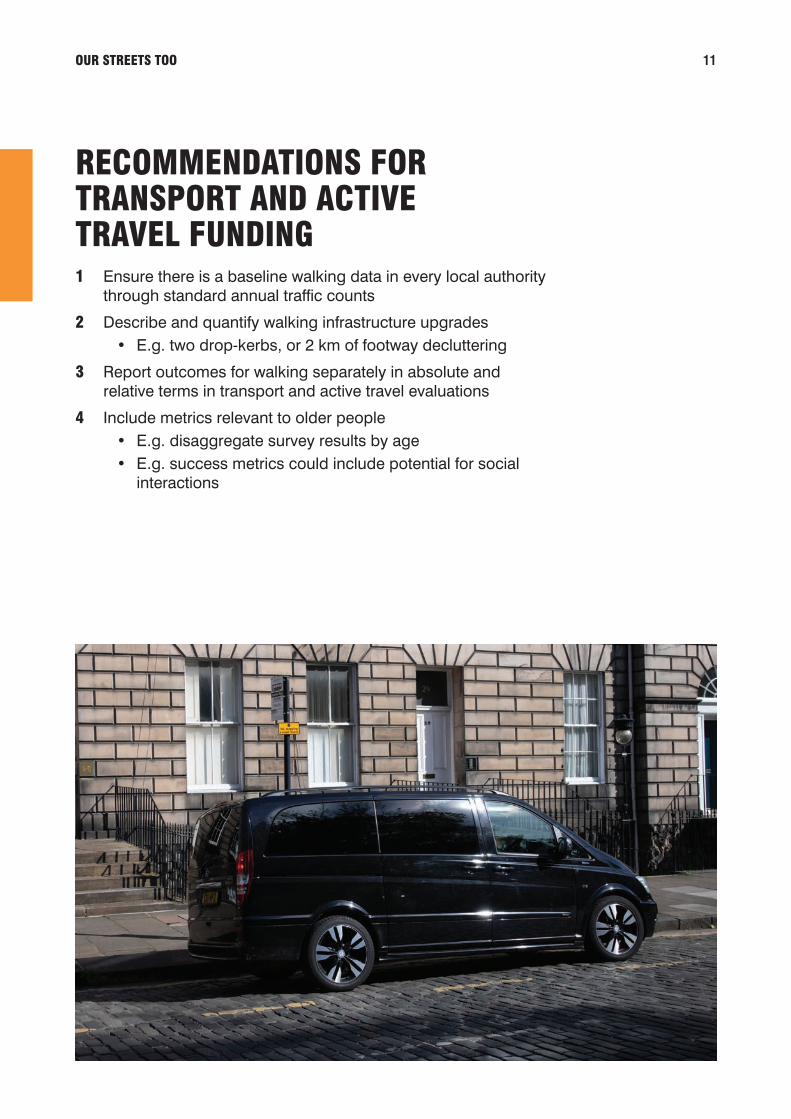
1 Ensure there is a baseline walking data in every local authority through standard annual traffic counts
2 Describe and quantify walking infrastructure upgrades • E.g. two drop-kerbs, or 2 km of footway decluttering
3 Report outcomes for walking separately in absolute and relative terms in transport and active travel evaluations
4 Include metrics relevant to older people • E.g. disaggregate survey results by age • E.g. success metrics could include potential for social
interactions
RECOMMENDATIONS FOR TRANSPORT AND ACTIVE TRAVEL FUNDING
OUR STREETS TOO 12
01SCOTLAND IS AGEING

OUR STREETS TOO 13
Scotland is an ageing society with 19% of the population aged 65 years and over1. This is just over 1 million individuals2. The combination of fewer births with longer life expectancy is the underlying reason why Scottish population is expected to age3. A further 1,138,906 people – or 21% of the population – are aged 50-64, a critical age range where physical activity and health start to decline rapidly.
Despite improvements over the past 100 years, Scotland has some of the lowest life expectancies in the UK and across Western Europe. Affluence steeply impacts life expectancy and healthy life expectancy, with people in the poorest communities living up to 28 fewer years of good health4.
The cost burden of poor health is unsustainable. It undermines the fundamental social-economic vitality of Scotland. There is a priority to manage the health and wellbeing needs of people who are already over 65 and to catch those in the pre-older life stage of 50-64. There is also a priority to lay foundations for intergenerational justice for the health and wellbeing of younger people today who are the older people of the future.
Figure 1 Years lived in poorer health or with disability for someone born in Scotland in 2017-20195.
1 National Records of Scotland (2020) Mid-Year Population Estimates. Table 1: Estimated population by age and sex, Scotland, mid-2019.2 Ibid, exact number equals 1,044,1453 National Record of Scotland (2019) Statistical Report Mid-Year Population Estimates Scotland Mid-2018.4 Scottish Government (2018) Public Health Priorities for Scotland.5 Office for National Statistics (2021) Health state life expectancies, UK: 2017 to 2019 Table HE Country level estimates: Life expectancy and healthy life expectancy by sex, age and country, 2009-2011 to 2017-2019
01 SCOTLAND IS AGEING
19% OF THE POPULATION
ARE AGED 65 YEARS AND OVER
Gender
Females
Males
Life expectancy
81.1
77.2
Healthy life expectancy
61.9
61.7
Disability free life expectancy
60.1
60.9
Years of life in poorer health
17.6
15.1
Years of life lived with disability
21.0
16.3
OUR STREETS TOO 14
6 Scottish Government (2020) Scottish Budget 2020-21. Chapter 5 Health and Sport.7 BMA (2020) Social care in Scotland.8 Own calculation: SportScotland, Active, Healthy Lives, Early Years, Health improvement and protection = £185.3 million9 Scottish Government (2021) Scottish Health Survey 2019 Main Report. Supporting files: Table 701: BMI 25+ (overweight, including obese), by age, 201910 Ho, F. K. et al. (2020) Modifiable and non-modifiable risk factors for COVID-19, and comparison to risk factors for influenza and pneumonia: results from a UK Biobank prospective cohort study. BMJ Open, 10, e040402. (doi: 10.1136/bmjopen-2020-040402) 11 Office of National Statistics (2020) Does exposure to air pollution increase the risk of dying from the coronavirus (COVID-19)?12 Holme et al (2020) Can air pollution increase the risk of COVID-19? Tidsskr Nor Legeforen.13 Pozzer et al. (2020) Regional and global contributions of air pollution to risk of death from COVID-19. Cardiovascular Research 116, 2247–2253 doi:10.1093/cvr/cvaa288
National health vulnerability is most acute for older peopleHealth, social care, sport, and public health are receiving an unprecedented high level of funding of £15.3 bn in the 2020-21 budget (not including additional COVID-19 funding)6. There is equally unprecedented financial pressure to deliver the service level expected by the general public, and the legal obligation to provide high quality health and social care to all adults over 65 years in Scotland7.
Just 1% of this funding is dedicated to activities which generate health8, 99% is spent on managing poor health. Despite this unprecedented high spend on health, the state of the nation’s health is poor. Overweight and obesity is a useful and critical baseline risk factor of basic health resilience. 66% of adults over 25 years in Scotland are overweight or obese. This sharply increases with age, peaking between 65 to 74 years with 85% of men overweight or obese and 74% of women overweight or obese9.
Age has been well established as the leading non-modifiable risk factor for COVID-19. A study conducted by the University of Glasgow10 found that slow walking pace (a rational indicator of physical fitness) was the strongest modifiable risk factor for Covid, in addition to weight, smoking, and poor blood glucose control. Various studies have identified air pollution as a key risk factor for Covid, as strong as smoking11,12,13. Weight, low physical activity, air pollution – the key risk factors for COVID-19 are the same modifiable risk factors which fundamentally undermine the health and prosperity of older people in Scotland.

02WHAT IS THE VALUE OF WALKING FOR SCOTLAND?

OUR STREETS TOO 16
14 Transport Scotland (2020) Scottish Household Survey. Table TD2: [Main mode] Percentage of journeys made by main mode1 of travel 2008-2019.15 DETR Environment Transport Regions (1998) Walking in Great Britain Transport Statistics Report. London, The Stationary Office16 Ibid.
Walking is a mode of transportWalking for transport is currently at 22% modal share in Scotland14. It is the second largest transport mode after cars, and walking modal share is larger than bus, rail, and cycling combined. Nonetheless, there are currently no dedicated walking transport officers across Scotland, and no dedicated transport budgets or design standards for walking. Kilometres of walking infrastructure and walking traffic by road type are not reported in Scottish Transport Statistics. Historic National Travel Survey data, which includes data for Scotland, reports that walking modal share was at around 35% in 1975/7615. Walking levels are currently at a historic low across the UK.
Figure 2 Percentage adults in Scotland walking 3-7 times per week by Scottish Index of Multiple Deprivation Quintiles16.
02 WHAT IS THE VALUE OF WALKING FOR SCOTLAND?
38%
1 (20% mostdeprived)
2 3 4 5 (20% leastdeprived)
39%
40%
41%
42%
43%
44%
45%
46%46% 46%
41%
43%
46%47%

OUR STREETS TOO 17
Walking is a highly equitable form of transport in Scotland There is gender equality in walking for transport. People with black, Asian and minority ethnic backgrounds are more likely to walk, and people living in the poorest communities as well as the most affluent are more likely to walk regularly17. But walking for transport declines strongly with age.
Figure 3 Percentage of adults in Scotland walking for transport regularly each week by age18.
16-19 yrs 20-29 yrs 30-39 yrs 40-49 yrs 50-59 yrs 60-69 yrs 70-79 yrs 80+ yrs
55%
37%
49%
31%
48%
28%
46%
28%
45%
26%
43%
3-7 times/week 6-7 times/week
26%
35%
19%
28%
14%
17 Transport Scotland (2020) Scottish Household Survey. Table 25: [Walking] Frequency of walking in the previous seven days*, 201918 Transport Scotland (2020) Scottish Household Survey. Table 25: [Walking] Frequency of walking in the previous seven days*, 2019

OUR STREETS TOO 18
Why older people are vulnerable in a car dependent societyScotland is a highly car dependent nation with cars at 65% modal share19 and a historic high level of car mileage20 and car ownership21, and higher car use than the EU average22. Car ownership and having a driving licence are clearly characterised by inequality patterns that become acute in later life.
Older people are less likely to drive, less likely to have a driving licence, and more likely to use the bus (similar to younger people aged 16 to 2923). These vulnerabilities intersect. For example, older women are substantially less likely to have a driving licence compared to men24. Single parents, single adults, and people living in the poorest communities are less likely to have access to a car. Single pensioners are least likely to have access to a car, with 52% of single pensioner households not having access to a car25.
SCOTLAND IS A HIGHLY CAR
DEPENDENT NATION
19 Transport Scotland (2021) Scottish Transport Statistics No 39, 2020 Edition.20 Department for Transport (2020) Transport Statistics Great Britain.21 Transport Scotland (2021) Scottish Transport Statistics No 39, 2020 Edition.22 Transport Scotland (2021) Scottish Transport Statistics No 39, 2020 Edition. Table 12.1 International comparisons.23 Equality Evidence Finder, accessed March 2021, Data source Scottish Household Travel Survey 2019. Table 20. Table 28: [Bus and train use] Adults use of local bus and train services, in the past month, 201924 Transport Scotland (2021) Scottish Transport Statistics No 39, 2020 Edition. Table 1.16 People who hold a full driving licence 2019.25 Transport Scotland (2021) Scottish Transport Statistics No 39, 2020 Edition. Table 1.20 Households with a car or van available for private use, 2019
OUR STREETS TOO 19
1 (20% mostdeprived)
2 3 4 5 (20% leastdeprived)
49%44%
19%
69%
57%
34%
80%75%
42%
86%
79%
53%
91%88%
63%
60-69 yrs 70-79 yrs 80+ yrs
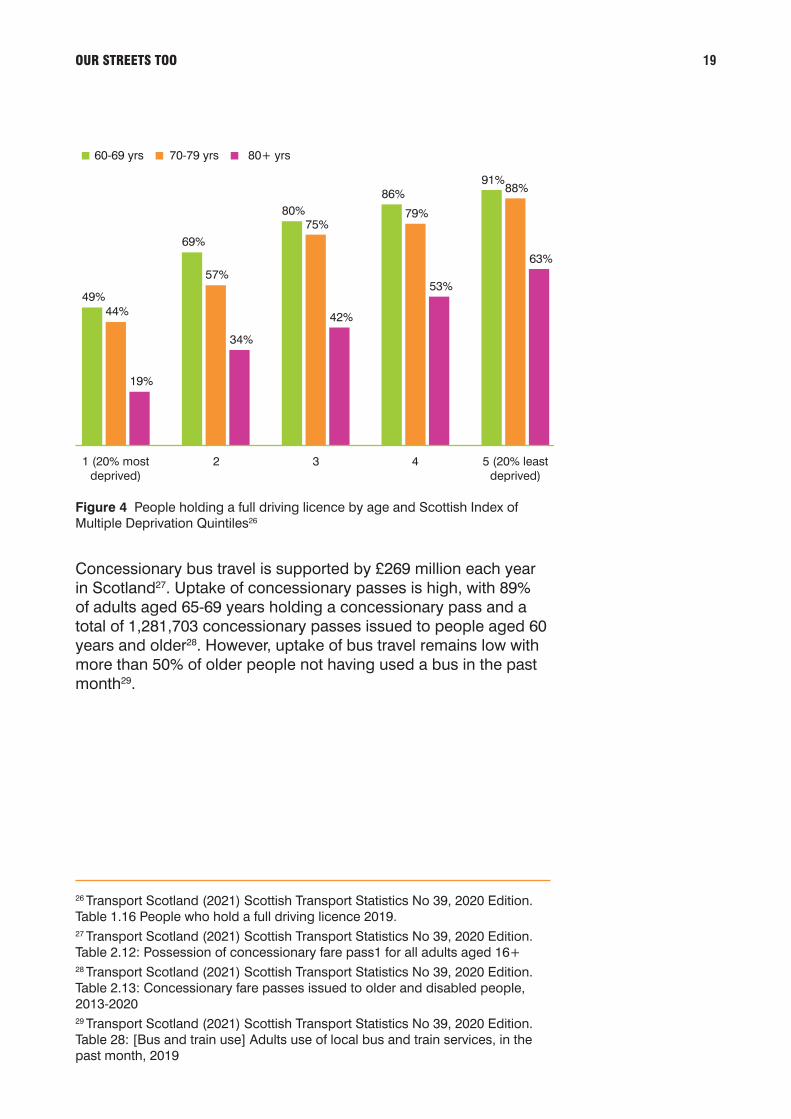
Concessionary bus travel is supported by £269 million each year in Scotland27. Uptake of concessionary passes is high, with 89% of adults aged 65-69 years holding a concessionary pass and a total of 1,281,703 concessionary passes issued to people aged 60 years and older28. However, uptake of bus travel remains low with more than 50% of older people not having used a bus in the past month29.
Figure 4 People holding a full driving licence by age and Scottish Index of Multiple Deprivation Quintiles26
26 Transport Scotland (2021) Scottish Transport Statistics No 39, 2020 Edition. Table 1.16 People who hold a full driving licence 2019.27 Transport Scotland (2021) Scottish Transport Statistics No 39, 2020 Edition. Table 2.12: Possession of concessionary fare pass1 for all adults aged 16+ 28 Transport Scotland (2021) Scottish Transport Statistics No 39, 2020 Edition. Table 2.13: Concessionary fare passes issued to older and disabled people, 2013-2020 29 Transport Scotland (2021) Scottish Transport Statistics No 39, 2020 Edition. Table 28: [Bus and train use] Adults use of local bus and train services, in the past month, 2019
OUR STREETS TOO 20
A decade of street audits conducted by Living Streets Scotland has consistently found that the road environment is hostile to walking for older people, Disabled people, people with children, and people who want to walk. Older people consistently cite the inability to access public transport as a barrier to being able to walk to travel more widely. This is supported by a large evidence base as presented in Chapter 5, and directly by Living Streets Scotland’s recent Bus Connectivity Project, which audited bus stops at 20 locations in Scotland and found the poor-quality walking environment a major barrier to assessing bus services (see Chapter 7).
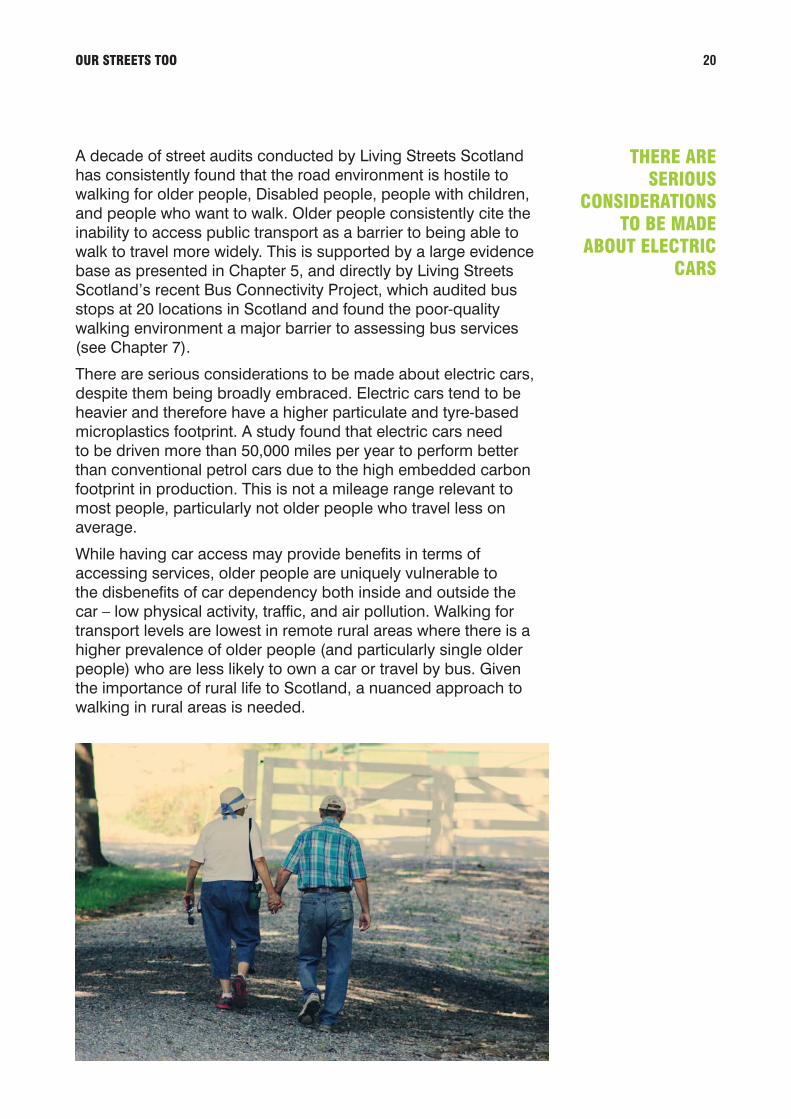
There are serious considerations to be made about electric cars, despite them being broadly embraced. Electric cars tend to be heavier and therefore have a higher particulate and tyre-based microplastics footprint. A study found that electric cars need to be driven more than 50,000 miles per year to perform better than conventional petrol cars due to the high embedded carbon footprint in production. This is not a mileage range relevant to most people, particularly not older people who travel less on average.
While having car access may provide benefits in terms of accessing services, older people are uniquely vulnerable to the disbenefits of car dependency both inside and outside the car – low physical activity, traffic, and air pollution. Walking for transport levels are lowest in remote rural areas where there is a higher prevalence of older people (and particularly single older people) who are less likely to own a car or travel by bus. Given the importance of rural life to Scotland, a nuanced approach to walking in rural areas is needed.
THERE ARE SERIOUS
CONSIDERATIONS TO BE MADE
ABOUT ELECTRIC CARS

OUR STREETS TOO 21
Increasing walking to reduce congestion, carbon and microplasticsThe potential to increase levels of walking is large and would have wide-ranging benefits for reducing congestion, carbon and tyre-based microplastics, and increasing physical activity, wellbeing and local spend. Overall, 74% of car journeys in Scotland are short, falling into an active travel range of 0-15km. 28% of car journeys in Scotland are less than 3 km, which is within core walking distance30.
Based on this distance range of car journeys, there is large potential for modal shift from car dependency to walking, equivalent to almost double levels of walking, from 22% to 40% modal share. This recommendation builds on the ambition laid out in the 2014 National Walking Strategy for Scotland “Let’s Get Scotland Walking” which describes an aspiration of 30% modal share.
Figure 5 Walking as a driver of socio-economic prosperity
30 Ibid. Table TD4a: [Distance by main mode] Percentage of journeys by road network distance by main mode, 2019.
ac
tive daily
walking
NATURE
CLIMATE SECURITY
independence
HEALTH
LOCAL BUSINESS
TRANSPORT
socialconnections
Pop to the shops
Walk to work
Run an errand
Walk the dog
Walk to the bus
Walk with a child
Walk with a friend
Go to the park
Walk places
Walk to friends©
Liv
ing
Stre
ets/
Wal
king
| C
yclin
g |
Clim
ate
Actio
n Lt
d.

OUR STREETS TOO 22
The main cause of congestion for cars are other cars and motorised vehicles31. In urban settings, and even small rural towns, traffic congestion typically results in slower vehicle speeds, with vehicles spending periods of time idling and not moving. For example, an estimated 31 minutes are lost in congestion during an average day travelling car in Edinburgh32. Converting these short, walkable-distance car journeys to walking would significantly reduce congestion, as well as air pollution from idling* engines, making streets safer for everyone.
Scotland has declared a Climate Emergency and passed the Climate Change Act in 2019 with a target of net zero emissions by 2045. The carbon emissions of transport are largely unchanged since 1990, most of which comes from passenger cars. The carbon footprint of cars is large at 5.8 MtCO2e per year, more than twice the size of the carbon footprint of aviation in Scotland (2.23 MtCO2e)33.
In addition to carbon impact, cars are the largest source of microplastics in the EU and in the world’s oceans34. 77 million rubber duck equivalents of tyre-based microplastics are dispersed each year in Scotland. Microplastics are small particles of plastic less than 5mm in diameter which easily enter soil, water, air and human pathways.
More tyre-based microplastics occur in urban settings where they pose greater direct risk to people through inhalation as air pollution but may have less environmental impact as they can be captured in sewer treatment. In rural areas, microplastics may pose less direct threat to humans but have direct environmental impact. As road run-off is less likely to be treated they could adversely affect water quality and ecological integrity, and related commercial industries such as whiskey production, salmon farming and nature-based tourism.
31 Transport Scotland (2020) Scottish Household Survey. Table TD10a: [Congestion - reason] Reason for congestion for car / van stages, 2012-2019.32 TomTom(2020) Edinburgh Traffic Data. Time lost in rush hour - per trip• World Health Organisation (2018) Ambient (outdoor) air pollution33 Transport Scotland (2020) Carbon Account for Transport No. 12: 2020 Edition 34 Eunomia (2018) Investigating options for reducing releases into the aquatic environment of microplastics emitted by (but not intentionally added) products.
77 MILLION RUBBER DUCK EQUIVALENTS
OF TYRE-BASED MICROPLASTICS ARE DISPERSED
EACH YEAR IN SCOTLAND.

OUR STREETS TOO 23
Figure 6 Carbon footprint of cars compared to aviation (international and domestic) in Scotland in million tonnes of carbon dioxide equivalent (MtCO2e). Data source: Transport Scotland (2020)35.
Planting trees to offset carbon is politically popular, but in practice this represents a requirement of unrealistically large areas of new woodland and forestry.
As a simple model, 1 hectare of woodland can capture 400 tonnes of carbon over a 100-year lifespan36. To offset the carbon footprint of passenger cars in real-time with consumption would require 1.45 million hectares of new woodland. This is equivalent to 18.4% of the area of Scotland, essentially doubling woodland coverage from currently 19% to 37%.
35 Transport Scotland (2020) Carbon Account for Transport No. 12: 2020 Edition36 Reference value provided by the Woodland Trust via email February 2021, which aligns with values described in: Levy and Butler (2020) Q&A: Is planting trees the answer to climate change? Available at: https://www.imperial.ac.uk/news/199473/qa-is-planting-trees-answer-climate/
Cars
5.8
Aviation
2.23
1.0
-
2.0
3.0
4.0
5.0
6.0
7.0 PASSENGER CARS ARE
THE LARGEST SOURCE OF CARBON IN SCOTLAND

OUR STREETS TOO 24
Although there is much value in increasing woodland coverage, especially native woodland, Scotland already has 19% woodland and forestry coverage, higher than the rest of the UK. The Woodland Trust recommends increasing native woodland by 1% by 2025 as part of their Emergency Tree Plan37. This is similar to Scottish national targets of increasing forestry and woodland cover by 3% over the next decade to 203238. The SNP has promised to plant 360 million trees by 2030. In comparison, it would require planting 2.3 billion trees to offset passenger cars. As such, a doubling of woodland area from 19% to 37% can be understood as largely unfeasible.
Cars are the single largest contributor to Scotland’s carbon footprint, representing about 14% of Scotland’s total CO2e emissions39. Trees have a role to play, yet it is clear we cannot plant our way to climate security without reducing carbon at source.
37 The Woodland Trust (2020) Emergency Tree Plan for the UK.38 Scottish Government (2019) Scotland’s Forestry Strategy 2019-2029.39 Transport Scotland (2020) Carbon Account for Transport. No.11: 2019 Edition.
IT WOULD REQUIRE
PLANTING 2.3 BILLION
TREES TO OFFSET
PASSENGER CARS

OUR STREETS TOO 25
03WHY IS WALKING IMPORTANT FOR OLDER ADULTS IN SCOTLAND?

OUR STREETS TOO 26
Being active daily is important for older peopleThe health benefits of walking are well established and summarised in Livings Streets “Is Walking a Miracle Cure” (2020) as well as the 2014 National Walking Strategy for Scotland. However, physical activity levels decline with age. In Scotland, there is a distinctive decline in physical activity for both men and women from around 55 years into later life. Although common expectation allows that a decline in physical activity with age is normal, from many perspectives staying active becomes more important as we age.
The new Chief Medical Officer’s guidelines for physical activity include updated guidelines for older people, defined as 65 years and older40. While the recommendation of 150 minutes of moderate-to-vigorous physical activity per week to gain basic health benefits remains the same, there is more nuanced understanding of the importance of being and staying active as the keystone to health ageing. These new recommendations place more emphasis on being active daily. While more daily activity is important for greater health and social benefits, the report states that small increases in activity and light activity are important for older people and can have large health benefits compared to the risks of inactivity.
40 Department of Health and Social Care, Welsh Government, Department of Health Northern Ireland, Scottish Government (2019) UK Chief Medical Officers’ Physical Activity Guidelines.
03 WHY IS WALKING IMPORTANT FOR OLDER ADULTS IN SCOTLAND?
SMALL INCREASES IN ACTIVITY AND LIGHT
ACTIVITY ARE IMPORTANT FOR OLDER
PEOPLE

OUR STREETS TOO 27
Figure 7 UK Chief Medical Officers Physical Activity Guidelines for Older Adults
UK Chief Medical Officers’ Physical Activity Guidelines for People aged 65 years and older
• Be active daily
• Include strength, balance and flexibility activities twice per week to maintain and improve physical function
• Aim for 150 minutes of moderate-to-vigorous physical activity per week
• Break up sedentary time
• Small increases in activity and light activity are important for older adults
16-24 yrs 25-34 yrs 35-44 yrs 45-54 yrs 55-64 yrs
women
65-74 yrs 75+ yrs
10%
0%
20%
30%
40%
50%
60%
70%
80%
90%
men
Figure 8 Percentage of adults by age in Scotland meeting physical activity guidelines, defined as ≥ 150 minutes of moderate-to-vigorous physical activity per week. Data derived from Scottish Health Survey41.
41 Scottish Government (2021) Scottish Health Survey 2019 Main Report. Supporting files: Table 7.1: Adult summary activity levels, 2019, by age and sex:

OUR STREETS TOO 28
Walking is an ideal physical activity setting for older peopleThe guidelines recognise the importance of being active to increase opportunities to socialise for older people as well as for maintaining independence. There is a link between inactivity and loneliness. Inversely, being active supports social connections and social functioning. Importantly, the guidelines explicitly recognise that fear of falls can lead to reduced activity which in turn increases the risk of frailty and falls, the main reason older people are taken to A&E. This is supported by a scoping review which found that more walking decreases the risk of falls in older people42. This study found that the road environment, including uneven surfaces and busy junctions, was the main cause of falls, rather than particular frailty of the older person.
Walking is described as a key activity for older people who are active and meeting the guidelines, but also for the large number of older people who are not meeting the guidelines. For these less active older people, ‘walk and rest for a minute’, short walks and increasing the duration of walking are all viable approaches to increasing activity levels, as are walking at slower speeds, such as 2 miles per hour, and standing to breakup sedentary time. Everyday walking is fundamentally important for older people as it embeds opportunities for social connections, being active, and muscle strengthening into everyday life. Walking is one of the main contributors to total physical activity across all age groups in the population and is already the most common activity for older people.
42 Schepers et al. (2017) Pedestrian falls: A review of the literature and future research directions. Journal of Safety Research.
WALKING IS THE MOST COMMON ACTIVITY
FOR OLDER PEOPLE
Pic
ture
Cre
dit:
Cen
tre
for
Agi
ng B
ette
r
OUR STREETS TOO 29
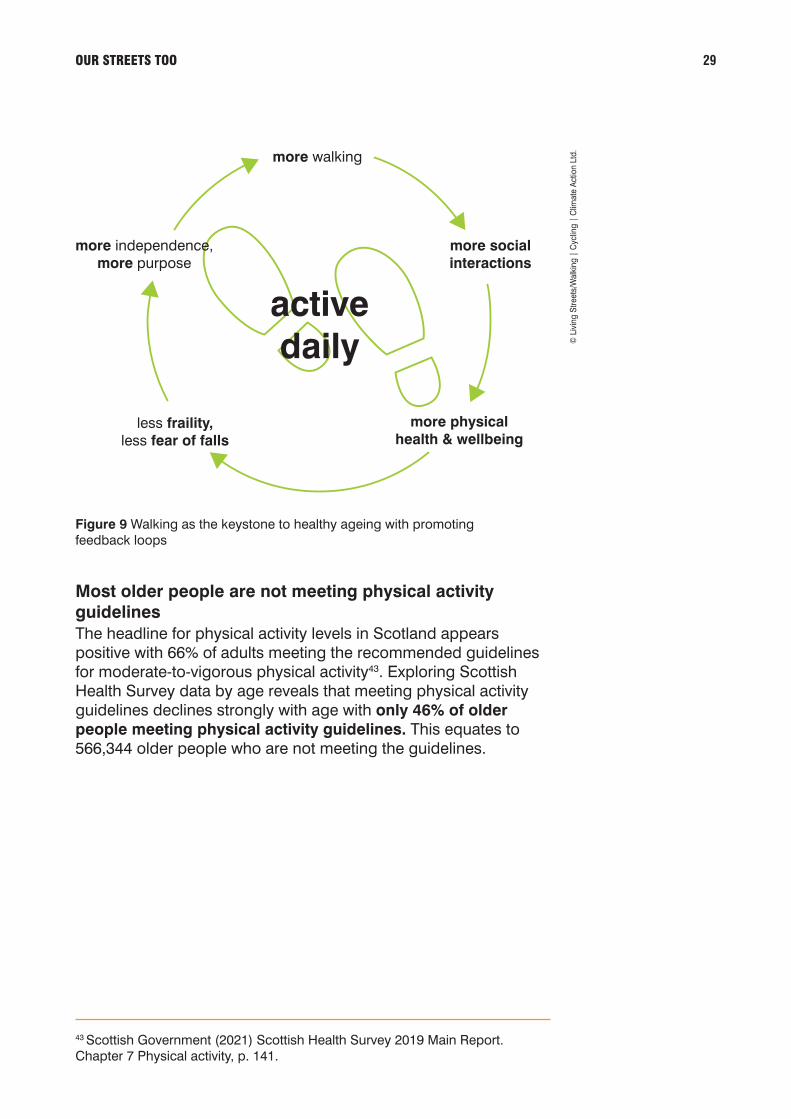
Figure 9 Walking as the keystone to healthy ageing with promoting feedback loops
Most older people are not meeting physical activity guidelinesThe headline for physical activity levels in Scotland appears positive with 66% of adults meeting the recommended guidelines for moderate-to-vigorous physical activity43. Exploring Scottish Health Survey data by age reveals that meeting physical activity guidelines declines strongly with age with only 46% of older people meeting physical activity guidelines. This equates to 566,344 older people who are not meeting the guidelines.
43 Scottish Government (2021) Scottish Health Survey 2019 Main Report. Chapter 7 Physical activity, p. 141.
more walking
more physicalhealth & wellbeing
more socialinteractions
less fraility,less fear of falls
© L
ivin
g St
reet
s/W
alki
ng |
Cyc
ling
| C
limat
e Ac
tion
Ltd.
activedaily
more independence,more purpose

OUR STREETS TOO 30
44 Scottish Government (2021) Scottish Health Survey 2019 Main Report. Supporting files: Table 7.2: Proportion of adults engaging in muscle strengthening physical activity, 2019, by age and sex.45 Ibid. p 147.46 Public Health England (2020) Guidance Health matters: physical activity - prevention and management of long-term conditions.47 Bull et al. 2004) World Health Organisation. Comparative Quantification of Health Risk Chapter 10 Physical Inactivity.48 Lee et al. (2012) Impact of Physical Inactivity on the World’s Major Non- Communicable Diseases. Lancet. 2012 July 21; 380(9838): 219–229. doi:10.1016/S0140-6736(12)61031-9. 49 Public Health England (2019) Guide to Physical Activity: applying all our health.
The data shows differences within older people with 55% of adults aged 65-74 years meeting the guidelines, which drops to 35% of adults aged 75+. We can see a large difference between genders, with men being more physically active than women throughout the life course by an average difference of 10%. Differences between gender peak in the age range 65-74 years at 14%, before returning to 10% at 75+ years. The proportion of older adults meeting guidelines for both physical activity and muscle activity is very low, with 18% of adults aged 65-74 years decreasing to 8% in adults 75+44. Differences between gender are less pronounced given the low levels of adherence to both, with 3% more men aged 65-74 years and 4% more men aged 75+ meeting both guidelines compared to women.
Shift to very low physical activity < 30 minutes per weekA marked trend in the decline with age of adults meeting the physical activity guidelines is that the shift away from meeting physical activity guidelines is mostly to the lowest category of physical activity “very low physical activity”. In the Scottish Health Survey this is defined as “Reported less than 30 mins per week of moderate physical activity, less than 15 mins per week vigorous physical activity, or an equivalent combination of these.”45
Public Health England term this category ‘physically inactive’46 as do others47. Differently, the World Health Organization’s definition for “physical inactivity”, as stated in the Lancet global physical activity review, is not meeting recommendations48. As such, 38% of older people in Scotland fall into the category of very low physical activity, being active for less than 30 minutes per week. The UK Government recognises that the risk to health at this very low level of physical activity is equivalent to the risk of smoking49.

OUR STREETS TOO 31
Figure 10 Percentage of adults by age in Scotland in “very low physical activity” category, defined as < 30 minutes moderate physical activity per week. Data derived from Scottish Health Survey50.
Walking is the most important setting for being active for older peopleData from the Scottish Health Survey supports the Chief Medical Officer’s assessment that walking is important for older people who meet physical activity guidelines as well as those who do not. For women over 65 years who are not meeting guidelines, walking is the most important setting for physical activity outside the home and contributes 35% of total physical activity. This is similar for men over 65 years, where walking contributes 32% of total physical activity.
For older women who are meeting guidelines, walking is the most important setting for all physical activity contributing 39% of total physical activity. Walking is also the most important setting for men, contributing 32% of total physical activity and a comparable number of minutes. Overall, the data presents a clear case that walking is highly important for older men and women and is the only physical activity setting where there is gender parity in later life. There is additional importance for walking compared to domestic activities as it takes place outside the home and adds potential opportunities for social interactions.
50 Scottish Government (2021) Scottish Health Survey 2019 Main Report. Supporting files: Table 7.1: Adult summary activity levels, 2019, by age and sex:
16-24 yrs 25-34 yrs 35-44 yrs 45-54 yrs 55-64 yrs
men
65-74 yrs 75+ yrs
10%
0%
20%
30%
40%
50%
60%
women

OUR STREETS TOO 32
Men not meeting guidelines Men meeting guidelines
Activity Setting minutes relative contribution minutes relative contribution
Domestic 24.5 38% 188.5 24%
Walking 20.6 32% 246.6 32%
Non-team sport 8.4 13% 129.3 17%
Exercise and Fitness 5.7 9% 52.2 7%
Outdoor pursuit 4.1 6% 46.9 6%
Leisure pursuit 1.1 2% 20.4 3%
Cycling 0.2 0% 12.5 2%
Team sport 0.0 0% 0.8 0%
Occupational 0.0 0% 73.4 10%
64.6 100% 770.6 100%
Women not meeting guidelines Women meeting guidelines
Activity Setting minutes relative contribution minutes relative contribution
Domestic 27.6 43% 164.2 26%
Walking 22.1 35% 251.8 39%
Exercise and Fitness 5.2 8% 72.8 11%
Non-team sport 4.7 7% 52.9 8%
Leisure pursuit 3.0 5% 29.3 5%
Outdoor pursuit 1.4 2% 29.7 5%
Team sport 0.0 0% 0.1 0%
Occupational 0.0 0% 41.4 6%
Cycling 0.0 0% 1.1 0%
Total 64.0 100% 643.3 100%
Figure 11 Mean and relative minutes of physical activity for women aged 65 and over by setting. Data derived from Scottish Health Survey51.
Figure 12 Mean and relative minutes of physical activity for men aged 65 and over by setting. Data derived from Scottish Health Survey52.
51 Email correspondence Tessa Strain, 4th February 2021. Data from 2013 Scottish Health Survey related to study: Strain et al (2016) Age-related comparisons by sex in the domains of aerobic physical activity for adults in Scotland. Preventative Medicine Reports 3, p. 90-97. http://dx.doi.org/10.1016/j.pmedr.2015.12.01352 Ibid

OUR STREETS TOO 33
16-24 yrs 25-34 yrs 35-44 yrs 45-54 yrs 55-64 yrs
men
65+ yrs
min
utes
of p
hysi
cal a
ctiv
ity p
er w
eek
50
0
100
150
200
250
300
women
Examining the Scottish Health Survey physical activity data across the life course shows that walking makes a large contribution to minutes of physical activity for both men and women who are active. Across the life course, walking minutes alone are equivalent to meeting the Chief Medical Officers’ physical activity guidelines of 150 minutes per week for both men and women, except for a slight dip for men aged 35 to 45 years where walking accounts for 145 minutes. Walking contributes more minutes than exercise and fitness for women aged 35+ and for men aged 45+. Walking is also important to younger people, peaking for women aged 16-24 years and for men aged 25-34 years.
Figure 13 The contribution of walking in minutes of physical activity across the life course for adults meeting physical activity guidelines. Data derived from Scottish Health Survey53.
53 Ibid

OUR STREETS TOO 34
There is a striking difference in the number of minutes of physical activity between people meeting the physical activity guidelines and those who are not. Women who are not meeting guidelines are active for an average of 70 minutes per week, compared to 652 minutes per week for women who are active. Men who are not meeting guidelines are active for an average of 68 minutes per week, compared to 746 minutes per week for men who are active. Although these minutes technically fall into the category of undertaking “some activity” as defined in the Scottish Health Survey54, the comparison shows that for people who are not meeting guidelines activity levels are active for only around 10 minutes per day and tending more towards low activity to very low activity. Walking is an ideal form of activity to transition from low levels of activity to doing more.
54 Scottish Government (2021) Scottish Health Survey 2019 Main Report. Chapter 7 Physical activity, p. 147.

04EVIDENCE FOR LOCAL ENVIRONMENTS AND WALKING IN OLDER PEOPLE

OUR STREETS TOO 36
We identified a total of seven recent systematic reviews which examine the relationship between local environment and walking for older adults. Six of these reviews found a positive relationship between local environments and walking. The seventh study found a mostly neutral relationship with some positive outcomes. The key limitation of these reviews is that most of the included studies are cross sectional and there is diversity in outcome measures.
Many of the included studies are international, so may not reflect the environmental context in Scotland. The three most recent reviews focused specifically on walking show robust methodology and report stronger associations with local walking environments. This may reflect improvements in study designs over the past decade. Overall, these seven reviews represent a strong evidence-base for the importance of good local walking environments and walking in older adults.
04 EVIDENCE FOR LOCAL ENVIRONMENTS AND WALKING IN OLDER PEOPLE
Study Type Study types No. of Outcome Local Outcome authors studies measures environmental included enablers
Lak et al. Iterative Qualitative 92 Active aging yes + (2020) systematic and review quantitative
Cerin et al. Systematic Quantitative 42 Walking and yes + 2017) review and cycling meta-analysis
Barnett et al. Systematic Quantitative 100 Total PA and yes + (2017) review walking and meta- analysis
Moran et al Systematic Qualitative 31 Walking and yes + (2014) review and mixed- physical methods activity
Annear et al. Systematic Quantitative, 83 Healthy yes + (2014) review including aging qualitative and mixed-methods
Rosso et al. Review Quantitative 17 Walking and yes + (2011) Disability
Van Systematic Quantitative 31 Transportation yes 0, + Cauwenberg review walking et al. (2011)
Table 1 Summary of reviews of local environments and walking in older adults

OUR STREETS TOO 37
The importance of walking infrastructure is clearly recognised by the 2014 National Walking Strategy for Scotland with one of its three main aims: “Better walking environments throughout Scotland” (p.8). The report also describes good walking infrastructure as an action area to enable walking, stating: “Physical Barriers which can be influenced include availability and accessibility of paths, poor quality walking surfaces, non-existent or inappropriate crossing arrangements that give little time to cross, high speed traffic, gates and stiles etc.” (p.19). The report recognises that walking can be supported through different sectors, specifically local walking infrastructure improvements and engaging with local community (p.9).

05EVIDENCE FOR WALKING INFRASTRUCTURE INTERVENTIONS AND OLDER PEOPLE

OUR STREETS TOO 39
A 2019 evidence review of active travel interventions found that 36 of 50 walking interventions were effective55. The review describes that town-or city-wide interventions were most effective, suggesting that this may be linked to the scale of investment and to the wider range of supporting measures employed. Interventions on sub-groups show limited effectiveness, but this may also be a factor of smaller sample sizes not resulting in statistically significant results.
The effectiveness of interventions to build or improve local routes or networks including walking and public realm improvements were also found to be effective, with 11 from 16 studies reporting increases in walking and/or cycling. The study states that it is difficult to identify in specific terms which intervention factors are key. While this review provides confidence that environmental interventions can increase walking, it does not add insight into the detail of what is effective for walking, nor what is effective for older adults.
This review has several limitations worth taking into consideration. Firstly, the review includes experimental and quasi-experimental studies which excludes a large body of transport evaluations that local authorities are more likely to conduct. Secondly, the study recognises the limitation posed by insufficient data for walking. While the authors state “cycling is more easily measured than walking”, this is not fact but rather a representation of commonly held beliefs in local authorities who do not routinely collect data for walking. This contributes to the first limitation as the local authority will have no baseline data for walking on either town/city or road, neighbourhood level.
55 Cavill et al. (2019) Active Travel and Physical Activity Evidence Review. Sport England.
05 EVIDENCE FOR WALKING INFRASTRUCTURE INTERVENTIONS AND OLDER PEOPLE
OUR STREETS TOO 40
Finally, the ‘clinical’ meaning of reported increases in walking are typically understated. For example, it may be reported that a town or city has seen an increase in cycling by 100% but an increase of only 30% in walking56. This implies that the measured increase in walking is not ‘clinically’ meaningful. In practice, this means cycling was doubled from 1% to 2% modal share and walking from 20% to 26% modal share. The increase in walking was three times larger than the increase in cycling. It represents one quarter of traffic modal share for the town and is an important mode of transport.
Only one of the studies included was conducted in Scotland57. This study explored the impact of the Smarter Choices, Smarter Places programme in seven local areas with populations ranging between 8,000 and 39,000 (Barrhead, Dumfries, Dundee, Glasgow East End, Kirkintilloch/Lenzie, Kirkwall and Larbert/Stenhousemuir). This study found that the intervention areas had lower levels of decline in walking and cycling compared to non-intervention areas. The study did not collect data for walking specifically, but rather measured physical activity. The interventions are not described specifically. Given that the control groups are from different areas, there is uncertainty whether the findings are the direct result of the Smarter Choices, Smarter Places interventions, or rather represent the overall approach of a particular local authority to walking and cycling, which may be represented in other enabling environmental factors.
A single study was identified which explored local street level interventions on walking and quality of life outcomes for older adults in the UK, which included locations in Scotland58. The study includes use of validated questionnaires and objective measures and employs cross-sectional as well as longitudinal design. Limitations of the study include the small number of participants (51% retention with n=36 in intervention arms, across 9 sites). The street interventions included planters, changes to parking layouts, and features to reduce speed and volume of traffic, as well as some community engagement.
56 Cairns S & Jones M (2016). Sustainable travel towns: An evaluation of the longer term impacts – Main report. Report for the Depart¬¬ment for Transport, PPR776, ISBN: 978-1- 910377-58-1. 57 Norwood et al. (2014) Active travel intervention and physical activity behaviour: An evaluation. Social Science & Medicine 113, p.50-5858 Thompson et al. (2014) Do changes to the local street environment alter behaviour and quality of life of older adults? Br J Sports Med. 48:1059-1065. Doi: 10.1136/bjsports-2012-091718

OUR STREETS TOO 41
Insights suggested by the study are that getting out of the house is the main source of low intensity physical activity for older adults. Also, that the engagement process may contribute to developing social links in the neighbourhood as well as the actual intervention. The study raises the question about dosage – what was the intervention? Was enough delivered to generate meaningful impact? Furthermore, adherence to the moderate to vigorous physical activity guidelines may not be the right assessment criteria as low intensity physical activity is more relevant to older adults.
Examining these studies in detail raises a number of issues which could improve the quality of future evaluations and scientific studies, to generate better understanding of what actually works for walking, and what works for older adults. A key observation is the lack of baseline walking data. A second key observation is the lack of metrics relevant to older people, for whom any walking is of value, not just meeting physical activity guidelines. Social factors which promote and maintain walking behaviours for older people may have high value in and of themselves, such as opportunities for social interactions. Overall, there is a need to better describe and quantify walking interventions, and better report walking outcomes separately from cycling outcomes in relative and absolute terms.
LOW INTENSITY PHYSICAL ACTIVITY IS MORE
RELEVANT TO OLDER ADULTS

OUR STREETS TOO 42
What works for older adults?As such, there is a gap in the evidence about what and how walking infrastructure interventions work for older adults. A number of recent evidence synthesis have reviewed the evidence base for older adults, including the systematic reviews identified above. To develop an evidence-based logic model for what works for older adults, two evidence synthesis were examined against findings for three walking evaluation programmes for older people, and one for Disabled people. Findings are sorted into walking infrastructure enablers and then social promoters which influence the personal and social context of the older person.
The evidence and evaluation sources included:
1 Living Streets (2021) Walking Connects programme evaluations.
2 Avon Network (2014) Promoting physical activity in older adults: A guide for local decision makers.
3 IDGO (2012) Inclusive Design for Getting Outdoors Research findings.
4 Public Health England (2017) Spatial Planning for Health.
5 Public Health England (2016) Working Together to Promote Active Travel.
6 Living Streets (2016) Overcoming Barriers and Identifying Opportunities for Everyday Walking for Disabled People.

OUR STREETS TOO 43
As this summary was collated, an understanding developed that although aspects of good walking infrastructure may be primary to enabling older people to walk, there is a strong interaction with social factors that also enable walking and promote maintenance of walking as a behaviour. These social factors have value in and of themselves for the wellbeing of older people. This evidence summary has been used as a base to develop an evidence-based logic model for walking and older people, see Figure 14 below.
An internal workshop conducted with Living Street staff in February 2021 explored what good walking infrastructure is for older people. Findings were aligned strongly with the evidence base summarised below and led to a quality statement to define ‘good’ walking infrastructure as follows:
Good walking infrastructure is safe, sociable, and attractive. People of all ages feel welcome and confident about choosing walking for everyday journeys.
PEOPLE OF ALL AGES FEEL WELCOME AND
CONFIDENT ABOUT
CHOOSING WALKING FOR
EVERYDAY JOURNEYS.

OUR STREETS TOO 44
WALKING INFRASTRUCTURE RELATED ENABLERS
Source Improved Crossings Benches/ Lighting Toilets Air Walkability* Public Attractive- Access footways Seating Quality transport ness to green space
1
2
3
4
5
6
Table 2 Comparison of walking infrastructure related enablers of everyday walking for older people.
*Walkability defined as human scale with services, destinations, and connectivity.
Legend: green = association, pink = no association identified, but can also mean that no association was explored.
WALKING RELATED PROMOTERS
Source Social Sense of Independence Feeling safe: Feeling safe: Less frailty/ Wellbeing connections Purpose PERSONAL TRAFFIC less fear of falls
1
2
3
4
5
6
Table 3 Comparison of walking related promoters of everyday walking for older people.

OUR STREETS TOO 45
Figure 14 Logic model for how good walking infrastructure enables everyday walking for older people, depicting how mediating factors help promote and sustain everyday walking
K E Y E N A B L E R
goodwalking
infrastructure
PROMOTERS
HEALTHOUTCOMES
Physical health
Wellbeing
Less frailty and falls
feelconnected
BenchesSocial journeys
Access buses
Social interactions
Green spaceAttractive
Well maintainedPoints of interest
Traffic safety
Lighting, even non-slipsurfaces
Natural surveillance
Crossings
ToiletsPhysical and social
functioning
IndependencePurpose
feelenjoyment
feelconfident
feel safe
SOCIO-ECONOMICOUTCOMES
Local spend
Congestion
Carbon
Particulate air pollution
Tyre-based microplastics
Social and healthcare spend
© L
ivin
g St
reet
s/W
alki
ng |
Cyc
ling
| C
limat
e Ac
tion
Ltd.
EVERYDAYWALKING

06PARTICULATE AIR POLLUTION PEAKS AND OLDER PEOPLE

OUR STREETS TOO 47
The evidence base for the detrimental impacts of particulate (PM2.5 and PM10) and nitrous oxides (NOx) air pollution is extensive and well established59. The main source of particulate air pollution is vehicle traffic through wear and tear on tyres and brakes, which is then resuspended in the road environment. Scotland is the first country in the EU to adopt the WHO guidelines on particulate air pollution60 which is commendable, and Scotland has some of the lowest levels of particulate air pollution in the UK.
There is a wide range of particulate air pollution levels within Scotland with an annual mean of 4.2 μg/m3 in the Western Isles compared to 8.6 μg /m3 in Edinburgh, which demonstrates the relationship between particulate air pollution and traffic61. While particulate air pollution is lower in Scotland compared to the rest of the UK, there is still a substantial associated health burden, with an estimated 2094 deaths due to particulate air pollution (PM2.5) alone62.
Figure 15 Particular air pollution (PM2.5) in Inverness in 2019 showing peaks above current WHO recommendations for 24 hour peaks of 25 μg/m3. Graph from DEFRA UK Air.
59 The Royal College of Physicians (2017) Every breath we take. The lifelong impact of air pollution.60 Scottish Government (2017) Cleaner air for Scotland: annual progress report 2016.61 Health Protection Scotland (2014) Air Quality (PM2.5 particulate air pollution) and Mortality in Scotland .62 Public Health England (2014) Estimating Local Mortality Burdens associated with Particulate Air Pollution
06 PARTICULATE AIR POLLUTION PEAKS AND OLDER PEOPLE
24-HOUR PEAK AIR POLLUTION EVENTS POSE A RISK TO OLDER
PEOPLE

OUR STREETS TOO 48
Particulate air pollution is carcinogenic and there is no safe level of exposure. The current WHO guideline for PM2.5s is 10 μg/m3 annual mean, and 25 μg/m3 24-hour mean63. However, considering the increasing evidence base for both short-term and long-term exposure, indicating risk at much lower levels than previously thought, the WHO are currently updating guidelines on air pollution64.
This implies that current air pollution estimates are likely underestimates of the true cost to life. Lower annual means can hide peak events which pose a particular risk to the most vulnerable, including older adults. For example, while Inverness has relatively low particulate air pollution with an annual mean of 5 μg/m3 for PM2.5 in 201965, there were two peak days of > 25 μg/m3 PM2.5 on the 28th of February and the 1st of March, and two further days of high particulate air pollution of 22 μg/m3 PM2.5 on the 19th of January and 23rd of April66. Likewise, while the measurement site on Byres Road in Glasgow recorded an annual mean of 9 µg/m3 for PM2.5 in 2019, there were several large peak events such as a daily mean peak of 52 μg/m3 and an hourly peak of 173 μg/m3 67. The current WHO evidence review is exploring that one-hour peaks may also pose a health risk68.
The current focus on nitrous oxides (NOx) in the media and local authority responses is driven by current UK and EU guidelines which are less rigorously health-related than the WHO guidelines. This is confusing for the general public who are likely not aware of the legal subtlety of addressing NOx (principally tailpipe emissions) while ignoring the larger particular air pollution burden (directly related to vehicle mileage and wear and tear on the brakes and tyres).
66 World Health Organisation (2005) WHO Air quality guidelines for particulate matter, ozone, nitrogen dioxide and sulfur dioxide67 World Health Organisation Europe (2021) Update of WHO Global Air Quality Guidelines68 Air Quality in Scotland website, accessed in March 2021 for Inverness Site ID: INV2
OUR STREETS TOO 49
A recent evidence synthesis by Public Health England draws out that better air quality is associated with increased physical activity in older people69. Older people are particularly vulnerable to the health effects of air pollution for both long-term and short-term peaks70. This is similar for children, where there is evidence that child lung capacity can be limited for life due to air pollution exposure with additional short-term risk of death71. In a landmark case in December 2020, a coroner in London ruled that the death of the nine-year-old child Ella Adoo-Kissi-Debrah in 2016 was due to air pollution with nitrogen dioxide and particulate matter (PM) pollution in excess of World Health Organization guidelines, the main source of which was vehicle traffic.
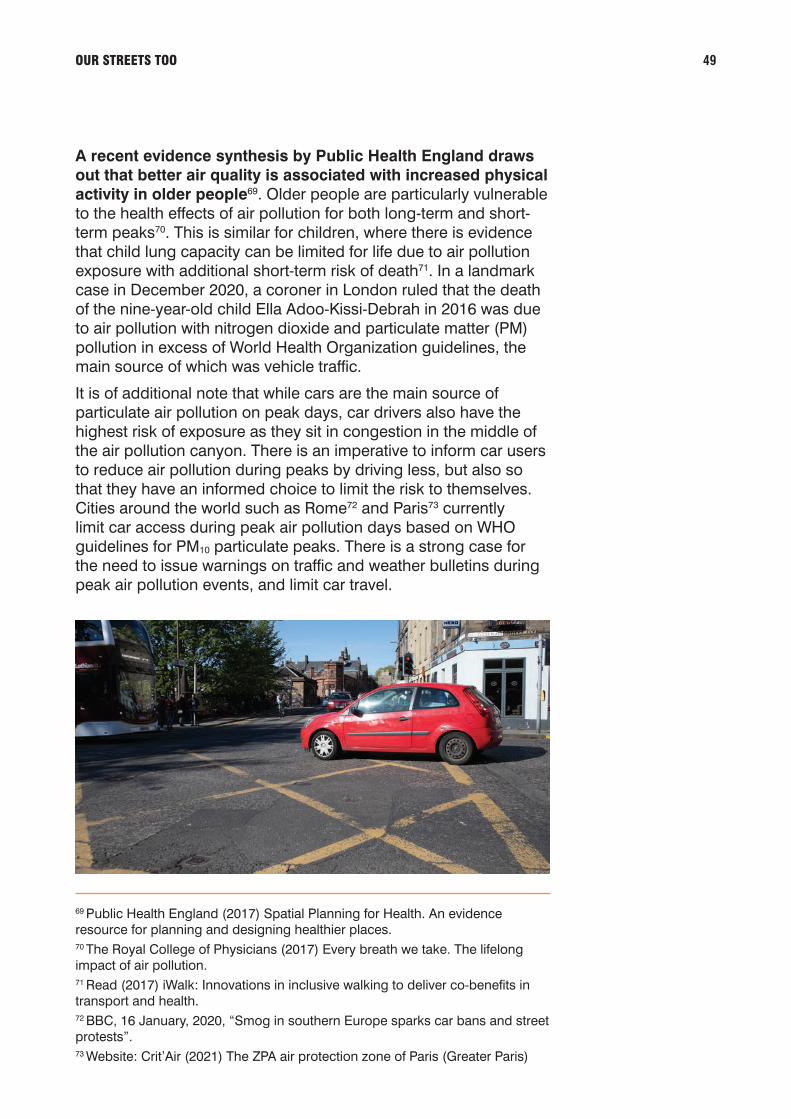
It is of additional note that while cars are the main source of particulate air pollution on peak days, car drivers also have the highest risk of exposure as they sit in congestion in the middle of the air pollution canyon. There is an imperative to inform car users to reduce air pollution during peaks by driving less, but also so that they have an informed choice to limit the risk to themselves. Cities around the world such as Rome72 and Paris73 currently limit car access during peak air pollution days based on WHO guidelines for PM10 particulate peaks. There is a strong case for the need to issue warnings on traffic and weather bulletins during peak air pollution events, and limit car travel.
69 Public Health England (2017) Spatial Planning for Health. An evidence resource for planning and designing healthier places.70 The Royal College of Physicians (2017) Every breath we take. The lifelong impact of air pollution.71 Read (2017) iWalk: Innovations in inclusive walking to deliver co-benefits in transport and health.72 BBC, 16 January, 2020, “Smog in southern Europe sparks car bans and street protests”.73 Website: Crit’Air (2021) The ZPA air protection zone of Paris (Greater Paris)

07LIVING STREETS SCOTLAND AND WALKING CONNECTS

OUR STREETS TOO 51
Living Streets Scotland is part of Living Streets, the UK charity for everyday walking. The aim of Living Streets Scotland is to create a walking nation, free from congested roads and pollution, reducing the risk of preventable illness and social isolation, and making walking the natural choice.
Over the past decade, Living Streets Scotland has undertaken a substantial body of street audit and engagement work which has consistently found how difficult and un-enabling the current walking environment is for a wide range of people, but particularly older people, Disabled people, and children. This work includes over 60 street audits in 15 different local authorities, engagement with over 600 individuals, and recently a bus stop audit in 20 different local authorities.
The Walking Connects programme builds on this community evidence base demonstrating how important local walking infrastructure is to enable everyday walking, feelings of independence, social connection, and wellbeing for older people. Walking Connects interventions were delivered in 21 communities, working with 11 different local partners from 2016 to 2020. Taken together, Living Streets Scotland’s work represents a substantial community evidence base supporting the importance of high-quality walking environments to enable everyday walking for everyone, but particularly older people, Disabled people, and children.
Street audit and community engagement activitiesBetween 2012 and 2021, the Living Streets Scotland Communities team facilitated 63 community street audits across Scotland. Community Street Audits were taken forward via the Paths for All funded Walkable Communities project (2012-2017), the Transport Scotland funded Communities programme (2017-2021), and with funding from The National Lottery Communities Fund (Walking Connects Development project; Walking Connects).
07 LIVING STREETS SCOTLAND AND WALKING CONNECTS

OUR STREETS TOO 52
In addition to community street audits, the Living Streets Scotland Communities team has facilitated engagement with community partners to assess accessibility and walkability of local streets and walking spaces. This included a hospital setting with visitors and day services, care home residents, remotely with Glasgow school communities, and older residents participating in the Out and About project funded jointly by The National Lottery Communities Fund and Paths for All Smarter Choices, Smarter Places Open Fund. Additional activity included a Community Street Audit project funded by Moray Council assessing accessibility of Elgin town centre. It is estimated that well over 600 participants have either participated in community street audits or have engaged in information gathering activities about walkability and accessibility of local streets for utility journeys and access to public transport.
Local authority areas where Community Street Audits and community engagement on accessibility and walkability have been taken forward include: City of Edinburgh, Glasgow City Council, Aberdeen Council, Aberdeenshire Council, North Lanarkshire Council, South, Ayrshire Council, East Lothian, Moray Council, East Dunbartonshire Council , Argyll and Bute Council, Stirling Council, Fife Council, Dundee City Council, Perth & Kinross Council, and Scottish Borders Council.

OUR STREETS TOO 53
PARTICIPANTS IN COMMUNITY STREET AUDIT AND ENGAGEMENT ACTIVITY INCLUDE:
COUNCIL OFFICERS:
TRANSPORTATION
COUNCIL OFFICERS: LOCAL ECONOMIC DEVELOPMENT; TOWN CENTRE MANAGEMENT; HOUSING AND REGENERATION
COUNCIL OFFICERS: COMMUNITY PLANNING; LEARNING AND DEVELOPMENT; CORPORATE SERVICES
COMMUNITY PLANNING PARTNERS, INCLUDING NEIGHBOURHOOD/AREA MANAGERS
POLICE SCOTLAND
LOCAL ACCESS PANELS
PARENT COUNCILS, SCHOOLS AND PUPILS
COMMUNITY COUNCILS
LOCAL DEVELOPMENT TRUSTS
CARE HOME RESIDENTS AND CARE HOME STAFF
DAY SERVICE USERS AND STAFF
TENANTS’ ASSOCIATIONS AND RESIDENTS’ GROUPS
LOCAL YOUTH FORUMS
WALKING GROUPS AND PATHS MAINTENANCE GROUPS
DISABILITY SERVICES
VOLUNTEERS AND LOCAL RESIDENTS
BUSINESS IMPROVEMENT DISTRICT MEMBERS AND TRADERS’ ASSOCIATIONS

OUR STREETS TOO 54
Several projects considering accessibility and walkability of streets and spaces in Scotland have been taken forward in addition to the work of the Scotland Communities team. These include: Cycling Scotland Housing Association funded active travel audits (ongoing from 2019), Bus stop audits (Transport Scotland 2018 – 2019 programme), a review of new housing developments and provision for low-car neighbourhoods (2017-2018), Kirkintilloch High Street improvements (2017 – 2020), and 20 MPH Project (2016 – 2017).
Key issues:A light-touch review of key findings from Community Street Audits and engagement activity taken forward by the Scotland Communities Team from 2012 identifies the following as recurring issues:
• Traffic speeds and volumes make walking feel unsafe, particularly at access points to schools/services
• Lack of crossing facilities or inappropriate crossing facilities; inadequate crossing times and infrequency of green light phases; crossings located away from the desire line
• Poor condition of crossing facilities e.g. damaged or missing tactile paving; damaged kerbs presenting a trip hazard
• Poor configuration of crossing facilities e.g. push buttons at a distance from the crossing entrance; dropped kerbs not aligned; dropped kerbs missing at one side
• Lack of dropped kerbs/pavement access and inconsistent access along key routes
• Poor condition of pavement/path surfaces e.g. pavement potholes, loose materials presenting a trip or slip hazard, narrow or missing footway forcing pedestrians into the road
• Footway clutter/lack of clearway on footway, including poorly placed road/traffic signage; bins; A-boards
• Poor amenity and cleanliness e.g. fly tipping, littering, derelict and vacant sites
• Lack of lighting on off-road paths; concerns about personal safety on off-road and segregated paths

OUR STREETS TOO 55
Concerns by participant types: Older people and people with mobility and sensory impairments: fear of falls; concerns about traffic speeds and ability to cross in time; concerns about personal safety and anti-social behaviour; resting places; consistent access to pavements on key routes; accessible crossing facilities; tactile markers, and appropriate wayfinding.
School communities: traffic management at school access points; crossing provision on routes to school.
Bus connectivity projectLiving Streets Scotland recently conducted a bus connectivity project, which audited bus stops at 20 locations in Scotland. The project worked with communities and local authorities to capture people’s experiences of walking to catch a bus, looking at issues affecting the walking environment on approach to the bus stops and the condition of the bus stops themselves.
The project found lack of information at bus stops was an issue at 95% of sites surveyed, followed by poor quality pavement surfaces (85%), poorly located or inadequate crossing points (80%) and missing dropped kerbs (55%). No resting places, toilets and signage were found to have a significant impact on the overall journey quality for Disabled people, and bus stations were found to be overwhelming for people with autism. Working with communities and partners, the project came up with solutions to overcome these barriers and support walking to local bus stops and for interchange. The aspiration is to deliver improvements in some of these locations with our project partners in local authorities.
Pic
ture
Cre
dit:
Cen
tre
for
Agi
ng B
ette
r
BUS STATIONS WERE FOUND
TO BE OVERWHELMING
FOR PEOPLE WITH AUTISM
OUR STREETS TOO 56
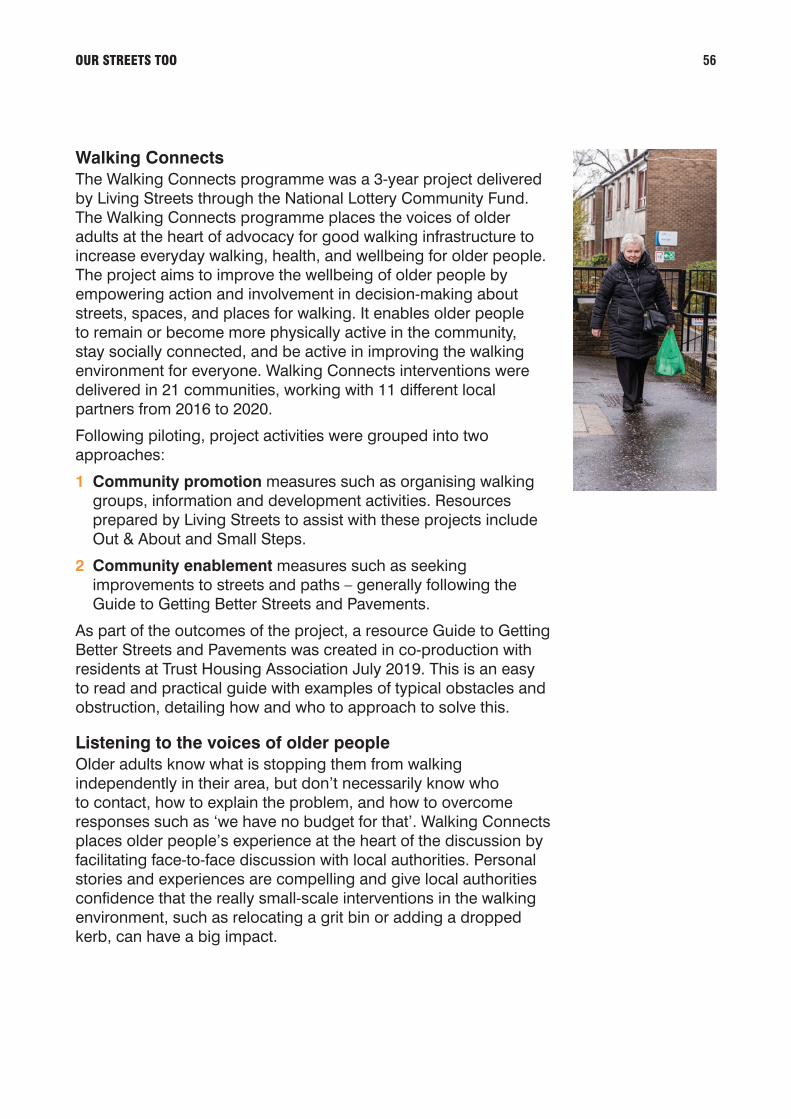
Walking ConnectsThe Walking Connects programme was a 3-year project delivered by Living Streets through the National Lottery Community Fund. The Walking Connects programme places the voices of older adults at the heart of advocacy for good walking infrastructure to increase everyday walking, health, and wellbeing for older people. The project aims to improve the wellbeing of older people by empowering action and involvement in decision-making about streets, spaces, and places for walking. It enables older people to remain or become more physically active in the community, stay socially connected, and be active in improving the walking environment for everyone. Walking Connects interventions were delivered in 21 communities, working with 11 different local partners from 2016 to 2020.
Following piloting, project activities were grouped into two approaches:
1 Community promotion measures such as organising walking groups, information and development activities. Resources prepared by Living Streets to assist with these projects include Out & About and Small Steps.
2 Community enablement measures such as seeking improvements to streets and paths – generally following the Guide to Getting Better Streets and Pavements.
As part of the outcomes of the project, a resource Guide to Getting Better Streets and Pavements was created in co-production with residents at Trust Housing Association July 2019. This is an easy to read and practical guide with examples of typical obstacles and obstruction, detailing how and who to approach to solve this.
Listening to the voices of older peopleOlder adults know what is stopping them from walking independently in their area, but don’t necessarily know who to contact, how to explain the problem, and how to overcome responses such as ‘we have no budget for that’. Walking Connects places older people’s experience at the heart of the discussion by facilitating face-to-face discussion with local authorities. Personal stories and experiences are compelling and give local authorities confidence that the really small-scale interventions in the walking environment, such as relocating a grit bin or adding a dropped kerb, can have a big impact.

OUR STREETS TOO 57
Success of the projectKey to the success of this project is having older people at the centre of the process. Being actively involved and using their local knowledge, experience and expertise not only drives the agenda to maintain their local streets but acknowledges their skills and renews confidence to walk independently and remain connected to the people and places that are important. Many of the projects also succeeded in effecting change to the built environment, giving people a clearer sense of purpose as valued members of the community whose voices matter.
In some projects, particular individuals were able to grow their leadership role, status, and personal confidence by helping to improve the local area. There is clear evidence of successful outcomes building social connections and personal confidence. Some projects report more walking trips to local facilities, but an increase in walking is not intended as a main outcome from the work. Rather, the focus on a sense of purpose and social connections sits well with the importance of promoting social factors for walking, cohesive with the evidence summary and the Chief Medical Officer’s interpretation of the value of walking for older people.

Living Streets Scotland, Thorn House, 5 Rose Street, Edinburgh EH2 2PR
Telephone: 0131 243 2645 Email: [email protected] www.livingstreets.scot
Living Streets (The Pedestrians’ Association) is a Registered Charity No. 1108448 (England and Wales) and SCO39808 (Scotland). Company Limited by Guarantee (England and Wales), Company Registration No. 5368409. Registered office: America House, America Square London EC3N 2LU