our heart and technology for the future - toyodenki.co.jp · toyo denki seizo k.k. has contributed...
TRANSCRIPT

2017Toyo Denki Seizo Report
O u r H e a r t a n d Te c h n o l o g y f o r t h e F u t u r e
Tokyo Tatemono Yaesu Building, 1-4-16, Yaesu, Chuo-ku, Tokyo 103-0028 Tel: +81-3-5202-8121 (General Affairs Division)
https://www.toyodenki.co.jp/

Toyo Denki Seizo K.K. Contributes to the Development of Social Infrastructure Systems
Integrating the exceptional motor drive technologies since establishment with our breakthrough
advanced technologies to help build social infrastructure systems that are considerate of the
global environment through global business development.
Our Long-Term Vision
● Editorial Policy ●
We have been publishing this report since 2013 with the goal of allowing a wide range of stakeholders to have a better understanding of the Company. This report combines our management policy with reports on our business-es, CSR and finances. We are committed to describing our initiatives during the year and our future direction in a manner that is easy to understand.● Period Covered by This Report ●This report focuses on our activities in fiscal 2016 (from June 2016 to May 2017), but also contains some infor-mation from outside this period.● Organizations Covered by This Report ●This report covers the Toyo Denki Group, including Toyo Denki Seizo K.K. and its consolidated subsidiaries.● Reference Guidelines ●
•Global Reporting Initiative (GRI) “Sustainability Reporting Guidelines Version 4”
Toyo Denki Seizo K.K. has contributed with new technologies to the development of railways, industries and social infrastructure in Japan and the world. Toyo Denki Seizo K.K. was founded in 1918 in an aim to “domestically manufacture electrical equipment for rail vehicles” and will celebrate the 100th anniversary of its founding in June 2018.We are developing businesses in transportation, industry and information equipment sectors, and all the three sectors shares a high relevan-cy to society and the public interest. We contribute to the development of industry and enrichment of people’s lives through our manufactur-ing expertise by leveraging high technological skills.We will continue to promote global development and aggressively work to develop advanced technologies befitting the name of “Toyo as a technology company,” promote transfer of expertise and skills as well as training of human resources for supporting the development of ad-vanced technologies, and create new businesses. Furthermore, through ensuring compliance and enhancing governance, we will strive to build a solid presence in the world as a manufacturer trusted by all stakeholders.
CONTENTS
Contents / Editorial Policy / Long-Term Vision 1Consolidated Financial Highlights 3Message from the President 5Construction of New Production Base in the Shiga, Ryuo Region 7Business Report 9CSR Report 15Financial Report 31Reference Data for Management Indices 58Company Profile 59Executive Profiles 60Organization Chart 61Stock Related Information 62
Shiga Ryuo Plant (Conceptual drawing)Completion is scheduled for January 2018 and full-scale operation for June 2018.
Toyo Denki Seizo Report 20171 2

2012 2013 2014 2015 2016FY
30,5
75 34,9
57 39,6
17
39,7
46
40,6
68
Fiscal term 152 153 154 155 156
Fiscal 2012 Fiscal 2013 Fiscal 2014 Fiscal 2015 Fiscal 2016
(Unit: Million yen)
Fiscal Year
Net sales 30,575 34,957 39,617 39,746 40,668
Gross profit 7,696 8,097 9,282 9,119 9,221
Operating income 501 1,076 1,596 1,638 1,571
Net income attributable to owners of the parent 722 644 1,105 889 1,174
Comprehensive income 3,761 1,421 5,468 (925) 1,513
Capital investment 1,296 612 969 902 4,606
Research and development costs 916 665 897 868 927
Fiscal Year-End
Net assets 18,519 19,350 24,895 23,676 24,603
Total assets 42,364 44,752 53,041 50,233 54,927
Number of employees 1,170 1,201 1,216 1,245 1,262
(Unit: Yen)
Per Share Information
Net assets 1,920.70 2,007.25 2,583.04 2,457.05 2,605.09
Net income 74.92 66.85 114.72 92.33 123.87
Dividend 6 6 6 6 30
(Unit: %)
Major Management Indices
Shareholders’ equity ratio 43.7 43.2 46.9 47.1 44.8
Return on equity (ROE) 4.3 3.4 5.0 3.7 4.9
Operating income ratio 1.6 3.1 4.0 4.1 3.9
Overseas net sales ratio 23.7 27.3 38.0 32.0 31.1
Dividend payout ratio 40.0 44.9 26.2 32.5 24.2
Net sales (Unit: Million yen)
Net assets/Total assets (Unit: Million yen)
Return on equity (ROE) (Unit: %)
Operating income (Unit: Million yen)
Number of employees (Unit: Persons)
Operating income ratio (Unit: %)
Net income attributable to owners of the parent (Unit: Million yen)
Dividend/Dividend payout ratio (Unit: Yen)
Overseas net sales ratio (Unit: %)
2012 2013 2014 2015 2016FY
501
1,07
6
1,59
6
1,63
8
1,57
1
2012 2013 2014 2015 2016FY
722
644
1,10
5
889
1,17
4
2012 2013 2014 2015 2016
Net assets Total assets
FY
18,5
1942
,364
19,3
5044
,752
24,8
9553
,041
23,6
7650
,233
24,6
0354
,927
2012 2013 2014 2015 2016FY
1,17
0
1,20
1
1,21
6
1,24
5
1,26
2
2012 2013 2014 2015 2016
Dividend Dividend payout ratio
FY
40.0%44.9%
6 6
26.2%32.5%
6 6
24.2%
30(30)
(30)
(30)
(30)
FY 2012 2013 2014 2015 2016
4.3
3.4
5.0
3.7
4.9
2012 2013 2014 2015 2016FY
1.6
3.1
4.0 4.13.9
2012 2013 2014 2015 2016FY
23.727.3
38.0
32.0 31.1
Note: Effective as of December 1, 2016, the Company implemented a share consolidation (five shares consolidated into one share). Net assets and net income are calculated on the assumption that the share consolidation was implemented at the beginning of the 152nd fiscal term.
Dividends are presented in the actual amounts paid.
Highlights of Toyo Denki Seizo K.K. and Consolidated Subsidiaries for the Consolidated Fiscal Year ended May 31 or as of May 31
Consolidated Financial Highlights
3 Toyo Denki Seizo Report 2017 4

President, Representative Director
Kenzo Terashima
All-time highs since 2000 posted in both orders received and net sales on a consolidated basis
FY 2000 2001 2002 2003 2004 2005 2006 2007 2008 2009 2010 2011 2012 2013 2014 2015 2016
25
30
35
40
45
2017(Forecast)
(Billion yen) Net sales Orders received
40.6
43.3
43.0
46.0
Building a foothold for the next leap by steadily establishing a management foundation
In the fiscal year ended May 31, 2017, all three business seg-ments secured more orders than the previous fiscal year and we achieved a year-on-year increase of 2.3% in net sales, mainly at-tributable to the Transportation Systems segment and the Infor-mation Equipment Systems segment. Orders of 43.3 billion yen and net sales of 40.6 billion yen are both all-time highs since 2000. Ordinary income increased 11.5% year on year and net in-come attributable to owners of the parent grew 32.0% year on year thanks to a sharp decrease in exchange losses, although op-erating income declined from the previous fiscal year due to de-creased profits in the Industrial Systems segment.
In the Transportation Systems segment, orders received for Chinese high-speed railways decreased since it was not the tim-ing for rail vehicles to be replaced with new models, but orders increased in Japan, mainly from private railway companies. Cou-pled with the robust performance of the business for domestic buses, operated by a subsidiary, both net sales and profits in this segment increased.
In the Industrial Systems segment, net sales decreased due to a decline in sales for testing equipment for automobile
The medium-term management plan “NEXT 100: Beyond 100 years, Ver. 2,” which has been under way, is aimed at building a management foundation toward significant growth in the future through such basic policies as “strengthening international com-petitiveness,” “restructuring production system” and “developing new businesses and technologies,” with a focus on “building a stable business earnings structure,” in the two-year period from fiscal 2016 to fiscal 2017.
With regard to “strengthening international competitiveness,” we are accelerating development in China in the Transportation Systems segment. We have captured demands associated with the introduction of standard vehicles of high-speed railways and expanded the maintenance business for electrical equipment for subway vehicles in Beijing. Furthermore, to expand the sub-way-related business from Beijing to other regions, we will en-
development, despite increases in orders for processing equip-ment and for overseas, mainly Southeast Asian countries and South Korea. Profits decreased significantly as a result of a de-cline in profitability in addition to the impact of net sales decrease. The decline in profitability was temporary, resulting from a lon-ger-than-expected man hours required for designing in relation to the high functionalization of testing equipment for automobile de-velopment and its expansion to automotive parts manufacturers. We believe that the technologies and knowledge acquired through this experience will fully contribute to future market expansion.
In the Information Equipment Systems segment, the increase in orders through acquisition of orders for large-scale projects of composite commuter pass issuing machines that can singlehand-edly issue a variety of tickets resulted in sharp increases in net sales and profits.
Looking at the future business environment, the overall econo-my is expected to continue a gradual recovery in the near term. Investments in railway infrastructure are projected to continue ex-panding in China and the ASEAN countries and demands are in-creasing toward the hosting of the Tokyo 2020 Olympic and Paralympic Games. With regard to consolidated financial results for the fiscal year ending May 31, 2018, we project increases in both net sales and profits, since the order backlog has increased in all the three business segments and more orders are expected.
Orders increased favorably and net sales topped 40.0 billion yen.Both net sales and profits are expected to increase also in the fiscal year ending May 31, 2018.
International competitiveness was strengthened and restructuring of production systems progressed.Advancing in the initiatives for development of new businesses and technologies.
The Company will continue product development that contributes to environmental loading reduction, based on such keywords as “energy conservation,” “high efficiency” and “clean.”
Since we operate in the railway transportation domain, which is of a highly public nature and requires a high level of safety, we are striving to improve and develop our business in the recogni-tion that our business itself contributes to society. Therefore, we aim to be a “company needed by society” and “build a solid posi-tion as a specialized manufacturer” through development and in-novation of environment-friendly products. At the same time, we will enhance our foundation for growth by pushing forward with utilization of diverse human resources and diverse work styles in order to raise the job satisfaction of employees, those of which are the starting point of value creation cycle of the Company.
We will realize a company that is trusted by all stakeholders and live up to their expectations by achieving sustainable devel-opment through the initiatives mentioned above.
Understanding that contribution to the establishment of railway and industrial infrastructure is the mission of the Company and the basis of environmental, social and governance (ESG), we will strive to consolidate our position as a specialized manufacturer by taking on the challenge of innovation for providing further values.
gage in local production of pantographs at Chengdu Yonggui Toyo Rolling Stock Equipment Co., Ltd., which was established in Chengdu. Other than China, we will seize the opportunities for market expansion in India and the ASEAN region. In the Industrial Systems segment, orders for generators and processing ma-chines are increasing in Asia due to the effect of establishing a representative office in Thailand in 2014. As for testing equipment for automobile development, we are currently strengthening our sales activities for parts manufacturers in addition to finished ve-hicle manufacturers.
Regarding “restructuring production system,” construction work of the Shiga Ryuo Plant is advancing steadily and full-scale operation of the plant is expected to start in June 2018. We will realize more than 30% improvement in productivity by consolidat-ing the development, design and production functions of the In-dustrial Systems segment, which are now dispersed in Yokohama and Shiga, into the new plant. At the same time, we will expand business domains by expanding the lineup of motors and invert-ers and enhancing the competitive advantage of our products, such as by adding higher values to generators, and will thereby increase net sales. Meanwhile, we will push forward with the re-structuring of the production lines at the Yokohama Plant to rein-force production capability of the Transportation Systems segment.
With regard to “developing new businesses and technologies,” we are working on development projects, with an eye on future growth domains in the Transportation Systems segment and the Industrial Systems segment, including “inverters adopting silicon carbide (SiC) elements” that contribute to space and energy sav-ing for rail vehicles, multifunctional testing equipment applicable for tests for electric vehicles (EVs) and hybrid electric vehicles (HEVs) and generation systems that support effective use of natu-ral energies.
Unfortunately, we are unlikely to achieve the initial performance targets of the plan. However, we will steadily establish a manage-ment foundation over the next year to build a foothold for the next leap.
Message from the President
5 Toyo Denki Seizo Report 2017 6

Commencement of construction of a new production base in Ryuo Town, Shiga Prefecture
Special Report
We commenced the construction of a new production base in Ryuo Town, Shiga Prefecture this March. Building this new production base is one of the core measures of our medium-term management plan, “NEXT 100: Beyond 100 years, Ver. 2,” implemented as a foothold to ex-pand our business scale as well as to establish a stable business earnings structure.
At the new production base, we aim to increase production efficiency by grouping up the previously scattered production bases of the In-dustrial Systems segment, alongside working towards the expansion of our business areas and increase of sales through the strengthening of our research and development function.
Medium-Term Management Plan
NEXT 100Fundamental Policy
1Strengthen international
competitiveness
4Promote development
of technology
3Restructure
production system
2Build a stable business
earnings structure
5Establish new
businesses
6Train human resources to
support global development
Ground-breaking ceremony Framework-raising ceremony Inside the plant in September 2017
The construction of the new production base is progressing as planned, and we are smoothly reaching a turning point towards its completion in January 2018. We plan to start working on the reloca-tion and installation of production equipment after completion, and commence partial operation in March 2018. Full-scale operation is expected in June of the same year, coinciding with our 100th anni-versary of foundation.
At the same time, we plan to increase the productivity of Yokoha-ma Works, the production base of the Transportation Systems seg-ment. Through expanding both of our core segments, the Industrial Systems segment and the Transportation Systems segment, we plan to achieve further growth.
Our coming schedule
Restructuring production systems
Main concepts of the Shiga Ryuo Plant
To increase productivity and improve quality
To improve the product development
environment
To expand product line-up
To provide a female-inclusive plant
To enhance the product testing
environment
To achieve an eco-friendly plant
Overview of the new factory
Name TOYO DENKI SEIZO K.K.Shiga Ryuo Plant
Location
2911-6 Oaza OkayaRyuo Town, Gamo District, Shiga Prefecture(Shiga Ryuo Industrial Park vicinity)
Land area Approx. 32,706 m2
Total floor area Approx. 19,997 m2
Total investment amount
Approx. ¥7.0 billion(Land, buildings, equipment)
Financing plan Self-financing and loans
Products Products for Industrial Systems segment(Industrial motors and inverters, etc.)
Schedule for Shiga Ryuo Plant
March 1, 2017: Ground-breaking ceremony
May 26, 2017: Column-setting ceremony
September 21, 2017: Framework-raising ceremony
January 3, 2018: Completion
March 2018: Start of operation
June 2018: Full-scale operation
7 Toyo Denki Seizo Report 2017 8
24,7
59
27,0
92
26,8
69
26,7
57
3,11
7
2,96
4
29,3
66
28,1
99 3,07
9
2014 2014 20142015 2016 2015 2016 2015 2016FY FY FY
Orders Received (Unit: Million yen) Net Sales (Unit: Million yen) Segment Income (Unit: Million yen)
Orders Received Orders received increased 8.4% com-pared with the previous fiscal year to 29,366 million yen, led by upturns in Ja-pan mainly due to demand ahead of the Tokyo 2020 Olympic and Paralympic Games.
29,366 million yen(Up 8.4% year on year)
Net Sales Net sales totaled 2 8,1 9 9 million yen, a 5.4% increase from the previous fiscal year, due to an increase in Japan.28,199 million yen
(Up 5.4% year on year)
Segment Income Segment income increased 3.9% com-pared with the previous fiscal year to 3,079 million yen.3,079 million yen
(Up 3.9% year on year)
Results for fiscal 2016
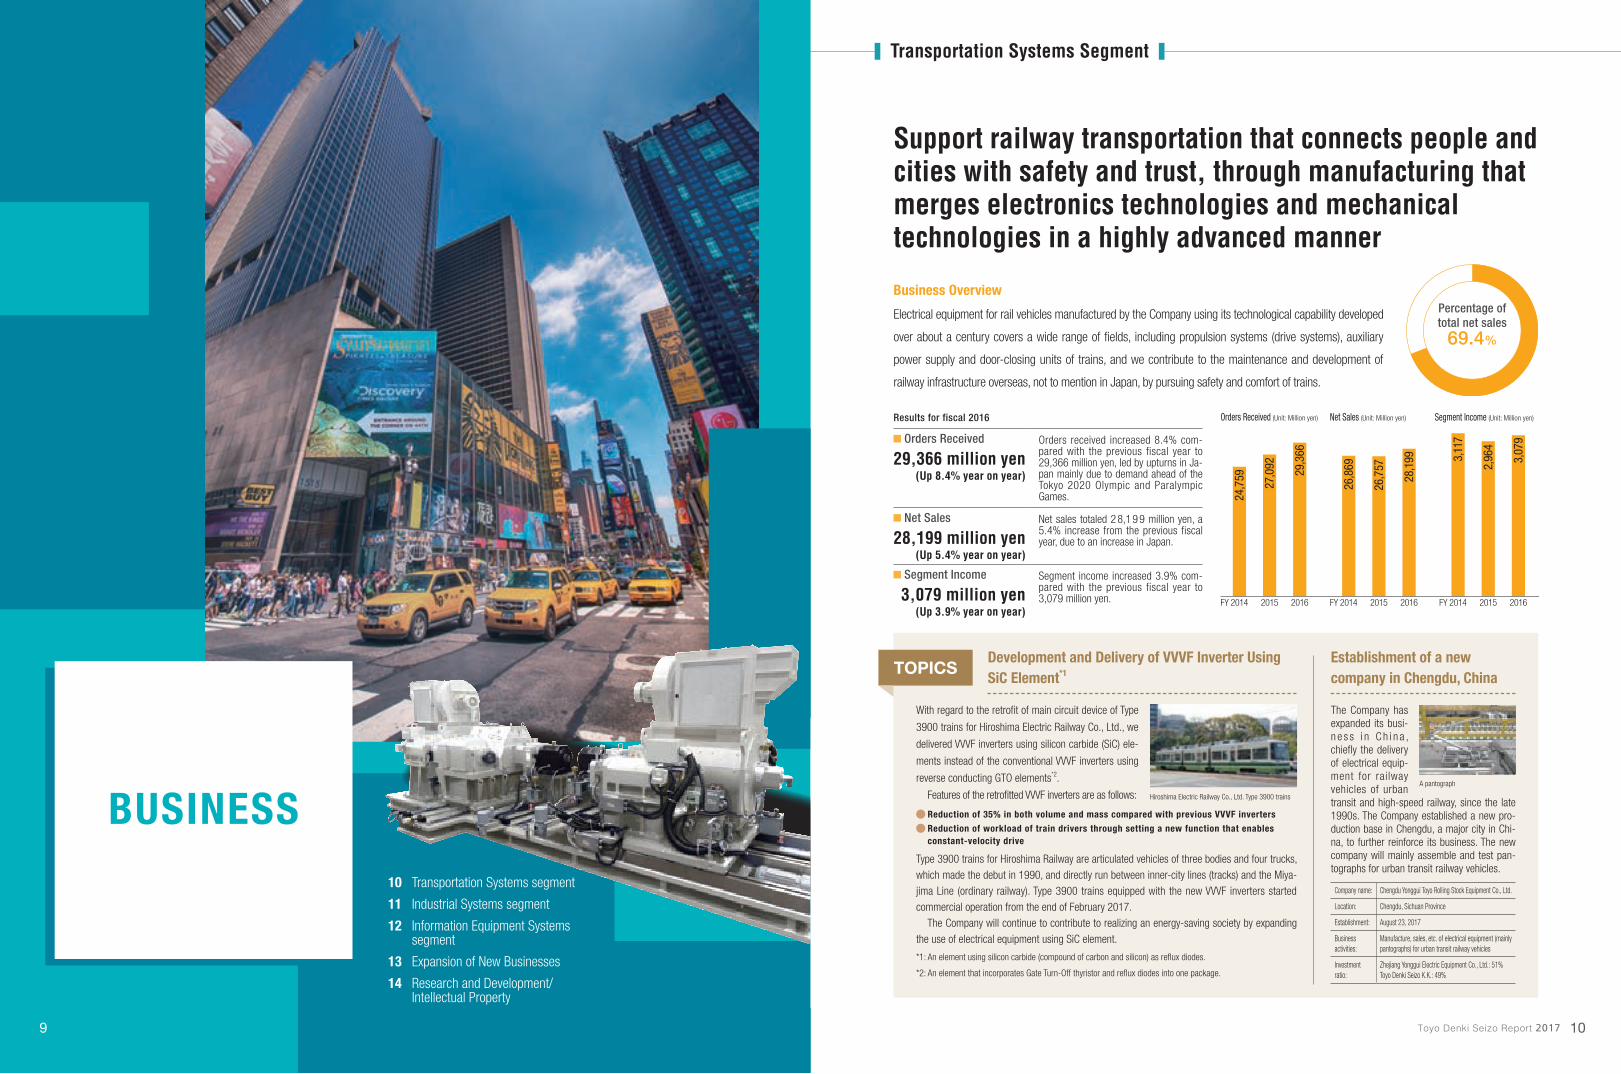
Support railway transportation that connects people and cities with safety and trust, through manufacturing that merges electronics technologies and mechanical technologies in a highly advanced manner
Business Overview
Electrical equipment for rail vehicles manufactured by the Company using its technological capability developed
over about a century covers a wide range of fields, including propulsion systems (drive systems), auxiliary
power supply and door-closing units of trains, and we contribute to the maintenance and development of
railway infrastructure overseas, not to mention in Japan, by pursuing safety and comfort of trains.
Percentage of total net sales69.4%
10 Transportation Systems segment
11 Industrial Systems segment
12 Information Equipment Systems segment
13 Expansion of New Businesses
14 Research and Development/Intellectual Property
BUSINESS
TOPICS
With regard to the retrofit of main circuit device of Type
3900 trains for Hiroshima Electric Railway Co., Ltd., we
delivered VVVF inverters using silicon carbide (SiC) ele-
ments instead of the conventional VVVF inverters using
reverse conducting GTO elements*2.
Features of the retrofitted VVVF inverters are as follows:
Type 3900 trains for Hiroshima Railway are articulated vehicles of three bodies and four trucks,
which made the debut in 1990, and directly run between inner-city lines (tracks) and the Miya-
jima Line (ordinary railway). Type 3900 trains equipped with the new VVVF inverters started
commercial operation from the end of February 2017.
The Company will continue to contribute to realizing an energy-saving society by expanding
the use of electrical equipment using SiC element.
Reduction of 35% in both volume and mass compared with previous VVVF inverters
Reduction of workload of train drivers through setting a new function that enables constant-velocity drive
*1: An element using silicon carbide (compound of carbon and silicon) as reflux diodes.
*2: An element that incorporates Gate Turn-Off thyristor and reflux diodes into one package.
Hiroshima Electric Railway Co., Ltd. Type 3900 trains
Establishment of a new company in Chengdu, China
The Company has expanded its busi-n e s s i n C h i n a , chiefly the delivery of electrical equip-ment for railway vehicles of urban transit and high-speed railway, since the late 1990s. The Company established a new pro-duction base in Chengdu, a major city in Chi-na, to further reinforce its business. The new company will mainly assemble and test pan-tographs for urban transit railway vehicles.
Company name: Chengdu Yonggui Toyo Rolling Stock Equipment Co., Ltd.
Location: Chengdu, Sichuan Province
Establishment: August 23, 2017
Business activities:
Manufacture, sales, etc. of electrical equipment (mainly pantographs) for urban transit railway vehicles
Investment ratio:
Zhejiang Yonggui Electric Equipment Co., Ltd.: 51% Toyo Denki Seizo K.K.: 49%
A pantograph
Development and Delivery of VVVF Inverter Using SiC Element*1
Transportation Systems Segment
Toyo Denki Seizo Report 2017 109

985 1,
369
1,12
7
954
71 95
1,78
8
1,38
8
304
2014 2014 20142015 2016 2015 2016 2015 2016FY FY FY
Orders Received (Unit: Million yen) Net Sales (Unit: Million yen) Segment Income (Unit: Million yen)
Orders Received Orders received increased 30.6% com-pared with the previous fiscal year to 1,788 million yen, due to the receipt of a large-scale order for railway station op-erating equipment.
1,788 million yen(Up 30.6% year on year)
Net Sales Net sales increased 45.4% year on year to 1,388 million yen for a reason similar to that for increased orders received.1,388 million yen
(Up 45.4% year on year)
Segment Income Segment income increased 218.8% compared with the previous fiscal year to 304 million yen.304 million yen
(Up 218.8% year on year)
13,3
19
11,4
21
11,6
13
12,0
27
848 1,
019
12,1
94
11,0
73
747
2014 2014 20142015 2016 2015 2016 2015 2016FY FY FY
Orders Received (Unit: Million yen) Net Sales (Unit: Million yen) Segment Income (Unit: Million yen)
Orders Received Orders received increased 6.8% com-pared with the previous fiscal year to 12,194 million yen, due to increased or-ders for processing equipment and out-side Japan.
12,194 million yen(Up 6.8% year on year)
Net Sales Net sales decreased 7.9% year on year to 11,073 million yen, due to decreases in sales of testing equipment and pro-cessing equipment.
11,073 million yen(Down 7.9% year on year)
Segment Income Segment income totaled 747 million yen, a 26.7% decrease compared with the previous fiscal year, due to a decrease in sa les and deve lopment cos ts o f multi-functional testing equipment.
747 million yen(Down 26.7% year on year)
Results for fiscal 2016
Results for fiscal 2016
Deliver technologies and gratitude to customers with highly precise, highly responding and highly efficient power electronics, for realization of an environment-friendly society
Business Overview
The Company is extensively contributing to customers at home and abroad through general industrial machinery and equipment, testing equipment for automobile development and social infrastructure equipment that is indispensable to the daily lives of people. In addition, we address manufacturing that contributes to the prevention of global warming, while providing products manufactured through high system-building technologies that make full use of energy-saving motors, inverters, FA controllers and networks.
Percentage of total net sales27.2%
Provision of products that make the execution of operations on station premises and trains smooth and convenient and M2M solutions based on mobile phone networks and cloud servers using remote monitoring system
Business Overview
In the Information Equipment Systems segment, we operate in the two fields of railway station operating equipment and remote monitoring systems, by merging advanced telecommunication technologies and mechatronics.
With regard to railway station operating equipment systems, we develop and manufacture commuter pass issuing machines that quickly became IC card compliant and portable terminal devices for conductors, and provide systems for smooth toll collection and income management system to railway operators.
Our remote monitoring systems greatly contribute to labor saving and maintenance saving of custom-ers through realization of various equipment monitoring and position monitoring, by leveraging cloud computing.
Percentage of total net sales
3.4%
TOPICS
The newly developed measurement control system, RunView, enables customers
who perform tests to conduct tests under wide-ranging conditions by freely cus-
tomizing user interfaces, including intuitive operation, flexible composition and
changes/revisions of monitor displays.
The Company has developed solution systems in which inverters and machines
are combined, with a focus on the development of low-inertia, high-torque motors
as well as dynamos. The addition of this measurement control system to such solu-
tions will enable us to respond to a wider range of requests of customers in auto-
mobile development processes.
We will strengthen our proposal capabilities to parts manufacturers, in addition
to automobile manufacturers, by further enhancing these comprehensive solutions.
Testing systems for automobiles
Inverter
Low-inertia motor
Mechanical system
RunView measurement control system
Further improvement of convenience and operability of testing equipment for automobile development ~ Development of measurement control system RunView
Display example of RunView measurement control system
Order received for IC station terminal devices for the Bureau of Transportation of the Tokyo Metropolitan Government
TOPICS
We have received order for IC station terminal devices from the Bureau of Transportation of the Tokyo Metropolitan Government, following the order received for commuter pass issuing ma-chines for the Transportation Bureau of the City of Yokohama last year. The hardware of this prod-uct is a composite ticket vending machine that can handle IC card-related business processing and singlehandedly issue a variety of tickets such as commuter passes, standard tickets, books of tickets and special tickets. However, the specification of the IC station terminal devices is limit-ed to IC card-related business processing and issuance of special tickets.
The terminal devices conform to the security authorization standards of the Congress of Ja-pan Railway Cybernetics.
We will continue to develop and provide easier-to-use railway station operating equipment.Composite ticket vending machine (separate type)
Industrial Systems Segment Information Equipment Systems Segment
11 Toyo Denki Seizo Report 2017 12

Segment Project Description
Transportation Systems
Development of VVVF inverter unit to which SiC semiconductor is applied
Developed our first VVVF inverter for commercial vehicles, to which silicon carbide (SiC) semiconduc-tor is applied, for replacement of streetcars.
Development of parallel cardan electrical equipment for super low floor type trains
Developed super small-diameter induction motor and drive unit, which enable the application of the parallel cardan drive method to super low floor type trains.
Industrial Systems
Development of high-torque, super low-inertia motor
With regard to high-torque motors used as alternative loads on the wheel side at automobile testing facilities, developed a high-torque, super low-inertia motor, whose inertia is lowered to as low as 45% of that of conventional motors.
Development of dual bench
Developed a dual bench that can conduct evaluation tests both on torque converters and clutch packs, both of which are automotive parts, by using our proprietary transfer mechanism. This bench can singlehandedly conduct the two kinds of evaluation tests that previously required individual test devices for each test.
Information Equipment Systems
Development of software module for railway station operating equipment
Developed a common software module for various types of railway station operating equipment for the pur-pose of quality improvement. This module is also effective in reducing development costs at the time of repair.
Improvement of various ticket issuing machines
With regard to composite ticket issuing machines and small ticket vending machines, realized addi-tion of functions to hardware and standardization of control boards.
Research Laboratory
Basic development of control system for industrial use, compliant with IoT
To expand overseas development of industrial equipment, developed a system with basic IoT functions in consideration of IoT standards for plants, including “Industrie 4.0” of Germany and “Industrial Inter-net Consortium (IIC)” of the U.S., and built a prototype system modeled on a system in a small plant.
Research on wireless power transmission
Succeeded for the first time in the world in power supplying from coils laid in roads to in-wheel mo-tors during the actual vehicle run. With regard to this system, our research laboratory was responsible for the development of a converter and its controller that wirelessly transmits power via coils between the vehicle body and wheels and between the ground and wheels as well as an in-wheel motor mounted on wheels, and an inverter that controls the in-wheel motor. A joint paper on this research, which was mainly written by an employee of our research laboratory, won the 2017 IEEE Power Elec-tronics Transactions First Paper Award of the Institute of Electrical and Electronics Engineers (IEEE).
Results and topics from fiscal 2016
2013 2014 2015 2016 2017
Patent applications: JapanJapan
OverseasOverseasGranted cases:
0
20
40
60
80(Applications)
FY
2
052
22
54
222
0
33 30
3530
5
0
57
16
62
16
0
045
14
45
14
1
165
26
66
27
Patent applications granted
Initiatives in distributed power source (small-scale hydropow-er, solar, wind power, biomass, wave power, tidal power, etc.)
Initiatives in remote monitoring (IoT/M2M solutions)
We have been working to safely make the most of natural energy sources such as small-scale hydropower, solar, wind power, biomass, wave power and tidal power, by leveraging the know-how of permanent magnet synchronous generators and interconnected systems we have developed over many years.
Take the small-scale hydropower generation system for instance. The system uses water as renewable energy, and effectively utilizes water resources which have not been utilized before, such as agricultural waterways and agricultural dams. We will continue working on effective utilization of various natural energy sources.
We contribute to improvements of efficiency in operations through IoT/M2M solutions using mobile phone networks and cloud servers for monitoring and control.
System upgrades of distributed power source sys-tems of Toyo Denki Seizo K.K.Bountiful experience with power companies in JapanInterconnected system protective function Higher efficiency by combining with permanent magnet synchronous generators Islanding detection function is incorporated in inverters that support interconnected systems Switchable from interconnected system operation to self-supporting operationBlack start in the absence of power source systems is possibleSystem upgrades of overload protection, external signal input, etc.Output control function A wide range of lineup with output from 10 to 750 kW, in particular, bountiful experience with output from 10 to 200 kW
Power Conditioner
EDG Permanent magnet synchronous generator (supports 10 - 750kW)
Fuel cell lift trucks
Data logger unit
In cooperation with TOYOTA INDUSTRIES CORPORATION, we have developed data acquisition and analysis systems for fuel cell lift trucks. With this system, operation data is collected, stored in cloud servers using mobile phone communication systems, and analyzed. For the remote data manage-ment system owned by Toyo Denki Seizo K.K., we developed a data logger capable of on-board use, which enables real-time analysis of cloud servers and is equipped with information transmission function. This system analyses and visualizes data on location information and operation states, thereby contributing to optimization of maintenance services and improvement of merchantability.
Joint development of data acquisition and analysis systems for fuel cell lift trucks
In cooperation with Denyo Co., Ltd., we developed a communication power generator mounted with a remote monitoring system, and commenced its services. The communication power generator was developed by mounting “IORemotor,” Toyo Denki Seizo K.K.’s remote monitoring terminal, to Denyo Co., Ltd.’s engine power generator. It enables sending email alerts in case of failure and remote monitoring through cloud services utilizing mobile phone lines. Customers can use various functions through ASP services. We will continue to contribute to operational efficiency through provision of easy-to-install and affordable IoT/M2M solutions.
Joint development of communication power generator mounted with re-mote monitoring system
Communication power generator
IORemoter
Research and Development/Intellectual Property
Research and Development
The Group’s R&D activities are based on seeking to create prod-ucts that fully satisfy our customers and challenging the creation and expansion of these products, and we actively promote
development of technologies of our existing businesses and basic technology developments that support this development as well as development of new products that expand our businesses.
R&D to support the development of social infrastructure and supporting frameworks
Intellectual Property
Our intellectual property is placed as a key corporate resource.
Our intellectual property department is responsible for the
management of intellectual property and our research laboratory
and the development divisions in each business unit actively apply
for patents and utility models.
In the overseas markets which we expect to further expand our
businesses, we have started to actively engage in activities
concerning our intellectual property in order to protect our
technologies and brand.
Expansion of New Businesses
13 Toyo Denki Seizo Report 2017 14

Environment
16 Initiatives to Protect the Environment
Governance
25 Corporate Governance
27 Internal Control and Compliance
27 Risk Management
27 Information Security
28 Business Risk
29 Data
CSR Report
Implementation of measures against global warming
Promotion of 3Rs (reduce, reuse, recycle)
Energy conservation through the Company’s technologies and products
Energy conservation in production activities
Use of sustainable energy
Improvement of logistics efficiency
Proper treatment of wastes
Reduction of amount of final disposal of wastes
Proper management of chemical substances
Cleanup around offices
Low-carbon society
Recycling-based society
Conservation of biodiversity
Nature-symbiotic society
Social
19 With Our Customers
20 With Our Suppliers
21 With Our Shareholders and Investors
22 Contributions to Local Communities
23 With Our Employees
In order to tackle environmental issues on an independent and con-tinuous basis, the Company has developed and operates an envi-ronmental management system and thereby obtained ISO 14001 certification. This certification has been acquired for all offices and the production bases Yokohama Plant and Shiga Factory.
A sustainable society as envisaged by the Company is the combi-nation of a “low-carbon society,” a “recycling-based society” and a “nature-symbiotic society.”
The environment technologies of the Company have produced numerous products that contribute to energy conservation, including high efficiency motors and inverters that capitalize on the amalgama-tion of our outstanding motor drive technology and other state-of-the-art technologies. In the meantime, the Company has been striving to conserve resources through not only the efficient use of energy but also the reduction of the size and weight of its products.
In addition, the Company is working on the development of products with lower levels of noise involved in their use to make them friendlier to the surrounding environment.
The Company will make further contribution to make society more sustainable, fully utilizing on its environmental technologies on a global scale, while carrying out various environmental actions at each of its bases.
With a view to realizing an environment-friendly society, the Company will further strive to promote the reduction of
environmental burden, while providing more efficient products that contribute to energy conservation.
Initiatives to Protect the Environment
Environmental Philosophy The Toyo Denki Group sets initiatives to protect the global environment as its priority task and contributes to the development of a sustainable society.
Action Guidelines We will continue to provide products and services that are considerate of the burden on the global environment by drawing on our “future-oriented technologies friendly to the Earth and mankind.”
1. We will comply with all environmental requirements including those under the relevant laws and regulations.2. We will strive to minimize environmental burden through a reduction of energy consumption and other measures at
all stages of product lifecycle, namely planning, development, design, production, sales, use and disposal.3. We will establish and execute a system to continuously promote activities to protect the global environment.4. We will raise environmental awareness among individuals through enlightenment activities within the Group
Aiming for Realization of a Sustainable Society
Environmental Management System
Years of ISO 14001 certification
Yokohama Plant Shiga Factory Extended to all offices
2004 2001 2010
Environment
Toyo Denki Seizo Report 2017 1615

*The fiscal year is from April to March of the following year.
2012 20130
200
400
600
800
0
100
200
300
400
2014 2015 2016
(Unit: 10,000 kWh) Electricity Gas (Unit: 1,000 Nm3)
(year*)
590.9
252.0
628.5284.0
651.8
284.7617.8
286.0615.6
294.1
20120
5
10
15
25
20
2013 2014 2015 2016
(Unit: 1,000 m3)
(year*)
Water input Water output
19.9
13.9 14.212.3
14.1 14.115.2 15.2 15.2 15.2
横浜製作所 水資源投入量・排出量
20120
1,000
2,000
3,000
4,000
2013 2014 2015 2016 (year*)
(t)
3,307.3
3,936.0 4,095.0
3,759.0 3,734.0
0
150,000
300,000
450,000
750,000
600,000
2014 2015 2016
(kWh)
(year*)
Based on 500 kW generator
676,000.0635,843.0 628,268.0
0
100
200
300
400
500
2012 2013 2014 2015 2016
General waste output Valuable waste output(t)
(year*)
346.0 361.3
408.5434.3 424.5
255.6290.9
274.1246.2
109.6
0
2
4
6
10
8
2012 2013 2014 2015 2016
(t)
(year*)
5.0
5.9
9.0
2.3
5.0
0
2,000
4,000
6,000
10,000
8,000
2012 2013 2014 2015 2016
(kg) Total amount of air emissions Total amount of shift
(year*)
7,300
4,810
8,300
5,290
7,900
6,120
7,700
5,260
7,000
5,800
The Company is promoting energy conservation at each of its production bases and offices to reduce its CO2 emissions. At the production bases in particular, we are promoting power-saving and streamlining at production facilities. In addition, the Yokohama Plant uses solar power generation for peak shaving of power de-mands.
Aiming to reduce CO2 emissions per unit of production output by 1% year on year, the Company’s main production base, the Yoko-hama Plant, reduced emissions by approximately 0.9% in fiscal 2016.
Initiatives to reduce greenhouse gas (CO2) emissions Targeted reduction of CO2 emissions and progress status
Total energy input at Yokohama Plant (electricity and gas)
Total water input/output at Yokohama Plant
Total CO2 emissions at Yokohama Plant
Total solar power generation at Yokohama Plant
Initiatives to Prevent Global Warming
The Company successfully reduced its landfill waste rate to 0.9% in fiscal 2016, as a result of thoroughly implementing waste pro-cessing rules, sorting of metal waste and recycling of paper re-sources.
Main actions
Output of general and valuable waste Volume of landfill waste
Volatile organic compounds (VOCs) emitted as a result of our business activities are adequately controlled and the amount of emission is monitored under the Pollutant Release and Transfer Register (PRTR).
We will further engage in the reduction of waste through such measures including using non-VOC materials and implementing recovery and reuse of solvents. PCB waste is also subject to ade-quate control, storage and disposal in accordance with Japan’s Act on Special Measures concerning Promotion of Proper Treat-ment of PCB Wastes.
Notification volume for Pollutant Release and Transfer Register (PRTR) substances
Initiatives for Control over Chemical Substances
Initiatives for Reducing Disposed Waste as Well as Recycling
Environment
17 Toyo Denki Seizo Report 2017 18
Formulation of “Procurement Action Guidelines” (formulated in February 2016)
The Company’s electrical equipment for rail vehicles is installed in many rail vehicles. These extremely important products play a direct role in ensuring the safety of human life and property during rail transportation. In the Industrial Systems and Informa-tion Equipment Systems segments as well, the Company’s prod-ucts and services are used in customers’ production facilities, development sites and in the field of social infrastructure, and they form the foundation supporting the sustainable development of a society that is safe and comfortable to live in.
In order to ensure the high quality of our products and ser-vices, the Company has established a “Basic Policy on Quality Control” which is deployed at all production bases as we strive to maintain and improve our human resources education, compli-ance with rules, and our facilities.
With regard to quality control, each fiscal year the Company devel-ops policies and the promotion framework aimed at further main-taining and improving quality in each business unit, along with specific policies pertaining to the reduction of flaws and other is-sues. The Company’s Corporate Quality Control Division works to-gether with the quality control department or the quality assurance department in each business unit to put together a report on the status of quality control and results in each unit. The report is de-livered to top management at the monthly Executive Officer Liaison Meeting where measures are debated and decided. Furthermore, in the event that a flaw is discovered after a product has been shipped, the necessary steps are swiftly taken, mainly by the qual-ity assurance department in each business unit, while at the same time the causes that led to the flaw and its mechanism are investi-gated, and this information is put into a database so that the infor-mation can be shared in-house in an effort to prevent recurrence.
The Company has created and operates a quality management system at its production bases, the Yokohama Plant and the Shiga Factory, and has obtained ISO 9001 certification.
The Company makes it one of our business principles to “build trust by focusing on quality first.” As such, we strive to enhance customer satisfaction through our commitment to thorough-going quality control as we believe deliver-ing safe and secure products and services to customers is the Company’s most important mission.
Basic policy on quality control
Promotion framework
With Our Customers
Year ISO 9001 certification obtained
Yokohama Plant Shiga Factory Extended companywide
1994 2000 2007
The Export Control Department at General Affairs Division is re-sponsible for export management as the export management control department. We have created a system for the proper management of exports in order to ensure compliance with the laws and regulations concerning export management in the coun-tries and regions where we engage in business activities as well as to avoid involvement in transactions that could hinder the maintenance of international peace and safety.
The Export Control Department handles cargo and technology parameters used in determining whether or not export permits are required, as well as investigation of transactions. In addition, the Department carries out employee education and guidance and support for Group companies.
The Company has acquired International Railway Industry Stan-dard (IRIS)* and China Railway Certification Center (CRCC) certifi-cation.
Going forward, we will continue to acquire international stan-dards as we aim to further promote global expansion and sales growth.* Acquired for the first time in Japan with our auxiliary power supply (SIV).
Information based on customer opinions and requirements ob-tained by the sales department is periodically reported to the top management at the executives’ briefing sessions, and that infor-mation is shared within the Company. We strive to maintain good relations with our customers by identifying problems that need to be solved and swiftly addressing them in order to raise customer satisfaction.
Proper export controls
Acquisition of International Standards
Good Relations with our Customers
Quality management system
Responding to the Global Market
Towards Greater Customer Satisfaction
Quality Control– Providing Safe and High-Quality Products
The Company’s products possess various distinctive characteris-tics such as being individually built-to-order, manufactured in multi-product small lots, and demanding high reliability. Therefore, the Company can be affected by the performance of our suppliers as a result of issues such as delays in supply due to fluctuations in production quantity or delays in processing due to the quality of products received.
In order to reduce these risks as much as possible, the Com-pany carries out instruction and support related to quality, tech-nology, and skills for our suppliers, as well as guidance for im-provement of manufacturing sites, in order to ensure stable procurement of even better quality products. In addition, we actively promote information sharing through the “Toyo Denki Cooperation Association” to which our leading suppliers belong.
* Inquiries from outside are accepted via the following phone number and e-mail address:
The Company endeavors to maintain proper execution of opera-tions by implementing a variety of training programs for material procurement officers to deepen their knowledge of the Act against Delay in Payment of Subcontract Proceeds, Etc. to Subcontractors and related laws and regulations and to cultivate awareness of legal compliance.
The Company has established an external whistle-blower system to receive consultations or reports on compliance from our suppli-ers. The legal compliance department handles complaints and consultations about transactions, and the Company’s retained lawyer resolves issues when necessary.
The Company responds to the needs of our customers through the strong network we have built with suppliers in line with our unique characteristics as a business based on an individual build-to-order/multi-product small lot manufacturing model.
Training for material procurement officers
External whistle-blower system (for suppliers)
With Our Suppliers
Legal Compliance Department, General Affairs Division +81-3-5202-8121 email address for inquiries to Toyo Denki Seizo K.K.: [email protected]
Communication with suppliers
Towards Just and Fair Procurement
Procurement Action GuidelinesThese guidelines indicate the codes of conduct that the Toyo Denki Group’s executives and employees should observe in the procurement
of purchased parts and outsourced parts as required for the manufacturing of products ordered by customers (“procurement transactions”).
1. Procurement transactions shall be carried out in observance of the laws of the relevant countries.
2. Information concerning suppliers in procurement transactions shall only be obtained within the scope necessary for conducting procure-
ment activities in accordance with contracts. Furthermore, efforts shall be made to carefully manage and observe the confidentiality of
information gained through procurement transactions.
3. Personal interests with suppliers shall be prohibited in procurement transactions, including the lending and borrowing of money.
4. Receiving of support beyond the socially accepted practices or receiving of money or inappropriate gifts or any other forms of personal
rewards from suppliers shall be prohibited in personal transactions. In addition, forceful requests for any of the above from suppliers shall
be prohibited in procurement transactions.
Social
19 Toyo Denki Seizo Report 2017 20
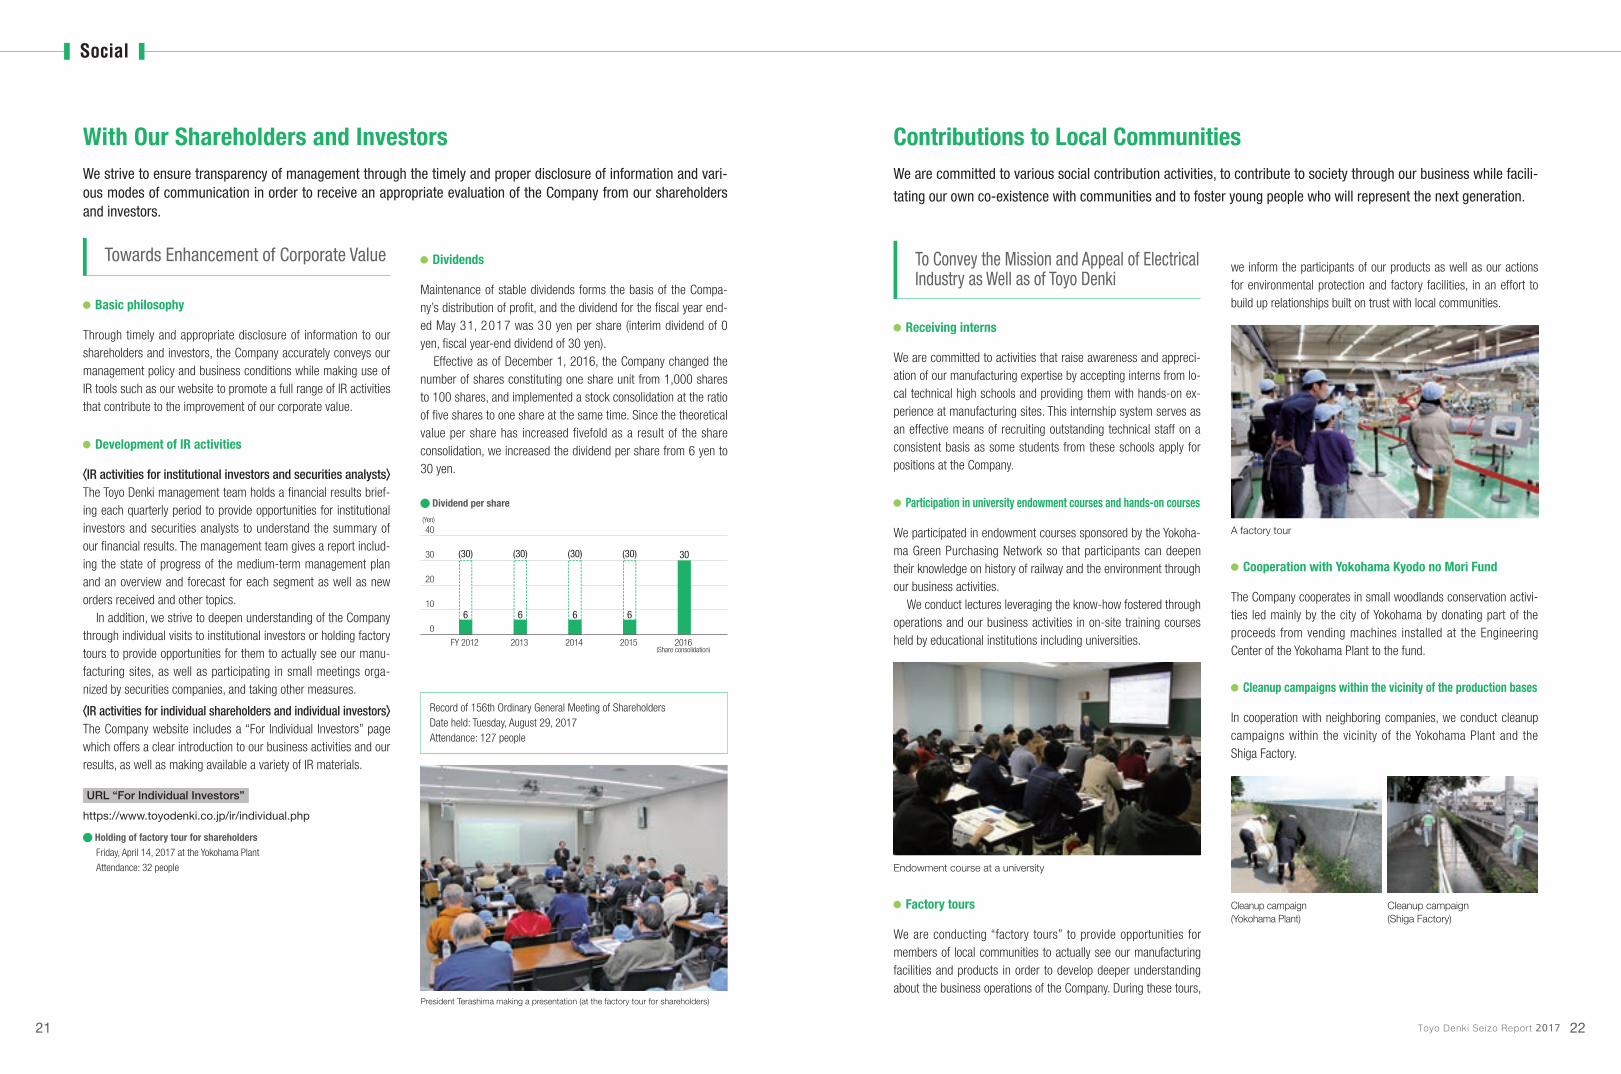
Maintenance of stable dividends forms the basis of the Compa-ny’s distribution of profit, and the dividend for the fiscal year end-ed May 31, 2017 was 30 yen per share (interim dividend of 0 yen, fiscal year-end dividend of 30 yen).
Effective as of December 1, 2016, the Company changed the number of shares constituting one share unit from 1,000 shares to 100 shares, and implemented a stock consolidation at the ratio of five shares to one share at the same time. Since the theoretical value per share has increased fivefold as a result of the share consolidation, we increased the dividend per share from 6 yen to 30 yen.
Dividends
0
10
20
30
40(Yen)
2013 2014 2015 2016(Share consolidation)
FY 2012
6 6 6 6
30(30)(30)(30)(30)
Through timely and appropriate disclosure of information to our shareholders and investors, the Company accurately conveys our management policy and business conditions while making use of IR tools such as our website to promote a full range of IR activities that contribute to the improvement of our corporate value.
IR activities for institutional investors and securities analystsThe Toyo Denki management team holds a financial results brief-ing each quarterly period to provide opportunities for institutional investors and securities analysts to understand the summary of our financial results. The management team gives a report includ-ing the state of progress of the medium-term management plan and an overview and forecast for each segment as well as new orders received and other topics.
In addition, we strive to deepen understanding of the Company through individual visits to institutional investors or holding factory tours to provide opportunities for them to actually see our manu-facturing sites, as well as participating in small meetings orga-nized by securities companies, and taking other measures.
IR activities for individual shareholders and individual investorsThe Company website includes a “For Individual Investors” page which offers a clear introduction to our business activities and our results, as well as making available a variety of IR materials.
We strive to ensure transparency of management through the timely and proper disclosure of information and vari-ous modes of communication in order to receive an appropriate evaluation of the Company from our shareholders and investors.
Basic philosophy
Development of IR activities
With Our Shareholders and Investors
Dividend per share
Record of 156th Ordinary General Meeting of ShareholdersDate held: Tuesday, August 29, 2017Attendance: 127 people
https://www.toyodenki.co.jp/ir/individual.php
URL “For Individual Investors”
Holding of factory tour for shareholdersFriday, April 14, 2017 at the Yokohama Plant
Attendance: 32 people
President Terashima making a presentation (at the factory tour for shareholders)
Towards Enhancement of Corporate Value
We are committed to activities that raise awareness and appreci-ation of our manufacturing expertise by accepting interns from lo-cal technical high schools and providing them with hands-on ex-perience at manufacturing sites. This internship system serves as an effective means of recruiting outstanding technical staff on a consistent basis as some students from these schools apply for positions at the Company.
The Company cooperates in small woodlands conservation activi-ties led mainly by the city of Yokohama by donating part of the proceeds from vending machines installed at the Engineering Center of the Yokohama Plant to the fund.
We participated in endowment courses sponsored by the Yokoha-ma Green Purchasing Network so that participants can deepen their knowledge on history of railway and the environment through our business activities.
We conduct lectures leveraging the know-how fostered through operations and our business activities in on-site training courses held by educational institutions including universities.
In cooperation with neighboring companies, we conduct cleanup campaigns within the vicinity of the Yokohama Plant and the Shiga Factory.
We are committed to various social contribution activities, to contribute to society through our business while facili-
tating our own co-existence with communities and to foster young people who will represent the next generation.
Receiving interns
Cooperation with Yokohama Kyodo no Mori Fund
Participation in university endowment courses and hands-on courses
Cleanup campaigns within the vicinity of the production bases
Contributions to Local Communities
Endowment course at a university
Cleanup campaign(Shiga Factory)
Cleanup campaign(Yokohama Plant)
we inform the participants of our products as well as our actions for environmental protection and factory facilities, in an effort to build up relationships built on trust with local communities.
We are conducting “factory tours” to provide opportunities for members of local communities to actually see our manufacturing facilities and products in order to develop deeper understanding about the business operations of the Company. During these tours,
A factory tour
Factory tours
To Convey the Mission and Appeal of Electrical Industry as Well as of Toyo Denki
Social
21 Toyo Denki Seizo Report 2017 22

I returned to duties at the China Sales Division, where I had been as-signed previously, in May 2017 after having taken maternity and child-care leaves of about one and a half years.
It was a natural choice for me to continue working after I had a child, probably because I had grown up looking at the back of my working mother. However, I had a rough time in finding a day nursery, and now I work by leaving my child in a non-certified nursery. At first, I was anx-ious about leaving her at a nursery for many hours. However, such anxi-ety was blown away as I watched my daughter pleasantly go to nursery with a smile every day. Now, both my daughter and I live each day to the fullest.
I am struggling every day, feeling grateful for the understanding of colleagues at work.Chika Yamaya (China Sales Division, Transportation Business Unit)
In fact, my husband is also an employee of the Company. Thanks to understanding at workplace of each other, we are tiding over hard times. For example, when our daughter runs a fever, we take a leave by turns. With no relatives around to turn to, such cooperation from my husband is a great help as we both work. I will try my best in confronting the work, so that I can not only fulfill my roles as a parent but also contribute to society as a person, while continuing to cooperate with my husband in rearing our daughter.
Work and family life balance
The Company has set the following policy on human resources development and carries out education and training under the ed-ucation and training system diagram as shown below.
Human resources development policy
Under the “Company-Wide Safety and Hygiene Management Poli-cy,” formulated every fiscal year, the Company holds the Safety and Hygiene Committee monthly at each office, where annual plans are drawn up and ongoing discussions are held in order to build a safe working environment, to reduce workplace injuries to zero and to find solutions to issues, including mental health. In addition, the Company holds the “Company-Wide Safety and Hygiene Commit-tee” every quarter to promote sharing of information between offic-es as well as between Group companies.
The Company makes improvements to the workplace environment and carries out workplace training with the aim of creating a workplace where the disabled and those in normal health can work together energetically. We also promote collaboration with local governing agencies and special-needs schools regarding employment of the disabled.
As measures to address mental health, the Company conducts “Line care training” for administrative professionals and “Self care training” for employees. In addition, we have partnered with an external medical institution to set up a telephone and e-mail con-sultation service to provide support for prevention, treatment, and return to work.
The Company conducts an “employee satisfaction survey” once per year, and relevant departments work to resolve various issues extracted from the survey results. In addition, the company-wide “Dynamism Committee,” whose purpose is to create a “dynamic corporate culture,” leads various activities aimed at revitalizing internal communication.
In accordance with The Act on Promotion of Women’s Participa-tion and Advancement in the Workplace (Women’s Advancement Promotion Act) that was enacted on April 1, 2016, the Company is formulating an action plan to create an environment where women can continue working with a sense of security as they ad-vance their careers.
Safety and hygiene initiatives
Initiatives for employment of the disabled
Mental health measures
Implementation of employee satisfaction survey
Response to the Act on Promotion of Women’s Participation and Advancement in the Workplace
The Company has implemented a flexible work-style including a flextime system for sales staff and those involved in development. Furthermore, in order to encourage retention and utilization of employees with knowledge and skills, we have put in place the “System for Rehiring Employees” for employees who have re-signed due to life events that occur in the course of their career (childbirth, childcare, family care, spouse’s transfer, etc.), so that they can be rehired when they reach the stage when it is possible to return to work.
As for employees who wish to be rehired after they reach the mandatory retirement age (60), in principle, we continue to em-ploy them until the age of 65.
Initiatives for diverse work-styles
In recognition of our efforts as a “company that supports child-rearing,” which includes a substan-tial childcare system, educational activities concern-ing a work-life balance, the creation of an environment in which it is easy to obtain childcare leave, and the acquisition record of child-care leave by male employees, we received the “Kurumin” certifica-tion logo from the Tokyo Labor Bureau in June 2014.
Acquisition of the “Kurumin” certification logo (June 2014)
Creating a Pleasant Workplace
The Company seeks to cultivate a dynamic corporate culture and to create a pleasant and safe workplace where
each and every employee can unleash his or her diverse capabilities.
With Our Employees
Towards the Development of Human Resources with Competitive Strengths
Human Resources Development Policy(1) To develop human resources who understand and practice
our business principles and code of conduct and who are of value both as company employees and as members of so-ciety.
(2) To develop human resources who are professionals, each possessing a high degree of specialized expertise, by en-hancing the knowledge, techniques, and skills they need to carry out their duties.
(3) To provide a variety of educational opportunities in order to promote personal development, with emphasis on a self-di-rected approach to study and growth.
Training programs at the Company are divided into several categories according to the employee’s year of service, type of work and role, and training is carried out after clarifying what part each employ-ee is expected to play.
Furthermore, for the purpose of developing human resources that support global development, we offer an overseas trainee pro-gram and various language programs tailored to the level of partici-pating employees.
To maintain high quality and pass on outstanding technologies and skills, the Company works on education on maintenance and improvement of expertise individually at each division and encour-ages employees on a company-wide basis to obtain public certifi-cations.
Furthermore, employees with exceptional manufacturing skills or expertise are recognized as “Technical My Star” internally and given responsibility to instruct and train younger employees. At the Tech-nical Training Center, established within the Yokohama Plant, train-ing is carried out for technical staff through lectures and various hands-on workshops.
Education and training system
Training for new employees
Education and training system diagram
Executive training
Training for newly appointed division heads
Training for third-year managers and professionals
Pre-promotion training for managers
Pre-promotion training for senior general staff
Training for workplace overseers:Job Instruction (JI), Job Relations (JR), Training Within Industry (TWI)
Pre-promotion training for workplace overseers:Job Instruction (JI), Training Within Industry (TWI)
Follow-up training (Third year) Follow-up training (Fifth year after graduation from high school)
Follow-up training (Third year after graduation from high school)
Technical education for the first yearI. Common basic courseII. Speciality basic courseIII. Workplace hands-on learning
Education including computer operation
Follow-up training (Second year)
Follow-up training (First year)
Practical training
Basic technical training
On site hands-on learning
Correspondence course for unofficial new hires (graduates)
Training in business manners
Introductory training
Regular new hires(General staff)
Regular new hires(Technical staff)
Regular new hires(Clerical staff)
Training for newly appointed managers and professionals: evaluator training, basic financial training, coaching training
Comprehensive training for newly appointed senior general staff: basic financial training, coaching training
Level-specific education and training (Human Resources Division)
Individual training (Human Resources Division)
Support for self-development and
acquisition of certification (Human Resources Division)
Division education and training
Maintenance and improvement of
expertise
Expansion to other divisions
Support for acquiring certifications necessary for operation of business and
offices as well as execution of dutiesOJT
Mid-career hires
ExecutivesDivision heads
Department
headsDeputy
department headsNon-m
anagerial employees
Mental health training
Support for fostering specialists (Doctor of Engineering, Master of Business Administration (MBA), Management of Technology (MOT) and Professional Engineer)
Support for acquiring certification (Chief Electricity Engineer, Electrician, Information Technology Engineer, bookkeeping, business law)
Support for language training (TOEIC, e-learning, sending employees to English conversation classes and others)
Support for correspondence training
Staff
Sales
Technology
Skill
Staff
Sales
Technology
Skill
Staff
Sales
Technology
Skill
Field
Operation chief
Safety
Audit
Other
Life-planning training (including DC)
Inspection program for foreign affairs
Training for improvem
ent of innovative thinking capability
Training for maintenance and improvement of specific technologies, common technologies and patent technologies (Engineer Development Committee)
Training for transmission, maintenance and improvement of advanced expert skills (My Star Recognition Committee)
Overseas trainees
Seminars outside the com
pany
Social
23 Toyo Denki Seizo Report 2017 24

Our philosophy of corporate governance
Corporate governance
Internal audit and statutory auditor’s audit
The Group’s business activities are based on the business princi-ples that “prioritize ethics and contribute to the prosperity of cus-tomers and society as a whole.” We therefore strive to attain sound corporate management through strengthening and rein-forcing corporate governance, fully appreciating the significance of compliance based on corporate ethics. At the same time, we review as appropriate our management monitoring system to en-sure its conformity to the changes in the business environment including social environment and relevant legislation.
We have corporate bodies established in accordance with laws and regulations as well as the Articles of Incorporation, including the General Meeting of Shareholders, Directors and the Board of Directors, Statutory Auditors and the Board of Statutory Auditors, and Accounting Auditors. At its regular monthly meetings as well as extraordinary meetings held when appropriate, the Board of Directors, which is composed of eight Directors including two Outside Directors, discusses and decides on important manage-ment matters such as reports on Directors’ business execution and matters to be decided solely at the discretion of the Board of Directors, while supervising Directors’ business execution. In ad-dition, the Company has meeting bodies including the Manage-
In an effort to continuously enhance its corporate value, the Company is striving to ensure transparency of
management and compliance, along with the maintenance and operation of an adequate governance frame-
work while reinforcing its risk management framework.
Action plans and results of internal audits are reported to the Board of Directors and Statutory Auditors by the Audit Division, as part of an effort to reinforce corporate governance. Statutory Au-ditors hold preliminary meetings with Accounting Auditors after the Ordinary General Meeting of Shareholders to exchange opin-ions regarding the audit plan. Statutory Auditors receive the re-sults of quarterly reviews from Accounting Auditors both verbally and in writing, and confirm their action plans (if required by the reviews) to be taken at a fiscal year-end audit. Statutory Auditors also receive the results of the reviews on the fiscal year-end audit from Accounting Auditors in a statutory document along with verbal reviews. Furthermore, Statutory Auditors are in principle required to be present at inventory taking or on-site inspection at subsidiaries by Accounting Auditors.
Code of Conduct
1. Respond to customers in a timely and speedy manner
2. Tackle all challenges with forethought and creativity
3. Continuous efforts toward self-development and skill improvement
4. Keep a broad perspective and influence each other toward growth
5. Act with awareness and pride of a good member of society and
businessman
Established in June 2001
Prioritize ethics and contribute to the prosperity of customers and society as a whole
Encourage creativity and enterprising spirit to meet the challenges of the future
Build trust by focusing on quality first
Business Principles
ment Strategy Meeting and Executive Officer Liaison Meeting. Through these bodies, specific matters related to their execution of duties are reported to the President by the general managers of business execution departments, and critical management matters including those subject to the deliberation of the Board of Directors are deliberated and discussed preliminarily. As for the matters discussed at meetings, matters subject to the deliberation of the Board of Directors are decided by the Board of Directors and other matters are decided by employees with business exe-cution authority through means such as circulars based on the Management Authority Rules.
Corporate Governance
The Company has established independence guidelines regarding in-
dependence required for a candidate for its Outside Executive, and
appoints Outside Directors and External Statutory Auditors who have
excellent insight in their areas of expertise. Currently, the Company ap-
pointed two Outside Directors and three External Statutory Auditors.
Note that each of the External Statutory Auditors is playing a role to
enhance audit functions required by laws and regulations while re-
maining independent from the Company.
Mr. Hirokazu Chinone, our Outside Director, is qualified as a lawyer
and provides useful advice regarding management in general, drawing
on his specialized knowledge regarding corporate law and his wealth
of experience developed throughout his career.
Mr. Takashi Yamagishi, our Outside Director, provides useful advice
regarding management in general, drawing on his wealth of corporate
management experience in Japan and overseas and his superior ex-
pertise.
Mr. Hiroshi Hamano and Eiichi Suzuki, our External Statutory Audi-
tors, are engaged in the auditing activities for the Company, drawing
on their wealth of experience and knowledge of audit developed in
corporate management and service at financial institutions.
Mr. Yoshinori Kawamura, our External Statutory Auditor, was newly
appointed as an External Statutory Auditor at the 156th Ordinary Gen-
eral Meeting of Shareholders (August 29, 2017). He serves as Pro-
fessor of Faculty of Commerce, Waseda University, with experiences as
Secretary and Special Member of the Business Accounting Council of
the Financial Services Agency, and an examiner of the Certified Public
Accountant Examination, etc. We look forward to his auditing activities,
Corporate governance framework
General meeting of shareholders
Board of Statutory Auditors
Internal Control CommitteeAudit Division
Legal counsel (Contact for whistle-blowers)
Appointments/dismissals Appointments/dismissals Appointments/dismissals
Appointments/dismissals
Appointments/dismissals
Instruction/reporting
Instruction/reportingInstruction/reporting
Instruction/reporting
General Affairs Division (Contact for whistle-blowers)(Contact for legal consulting)
(Secretariat)
Accounting Auditors
Statutory Auditors
Board of Directors
President
Directors and Executive Officers
Each business department
Each Group company
Management Strategy MeetingExecutive Officer Liaison Meeting
National and Global Group Company Meetings
Directors
Instruction/reporting
Reporting/decisions
Reporting
Reporting
Whistle-blowings
Whistle-blowings
Oversight
Reporting
Reporting on business execution
Reporting
Business audit
Legal audit
Appointments/reporting/
recommendations
Accounting audit
Internal audit
Executive Remuneration
Total amounts of remuneration for Directors and Statutory Auditors are
decided by a resolution at the General Meeting of Shareholders. Basic
remuneration for Directors is a fixed salary while a bonus is payable as
determined by each Director’s contribution to management as well as
business results of the Company. Basic remuneration for both Stand-
ing and Part-time Statutory Auditors is a fixed salary without bonus
payments.
(As of the end of May 2017)
Category of executivesNumber of executives applicable
Total amount of remuneration
(Unit: Million yen)
Directors(excluding Outside Directors)
8 145
Statutory Auditors(excluding External Statutory Auditors)
1 14
Outside Executives(Outside Directors and External Statutory Auditors)
5 38
drawing on his expertise regarding corporate finance and accounting
developed thus far.
The Company has appointed Mr. Hirokazu Chinone, Mr. Takashi Ya-
magishi and Mr. Yoshinori Kawamura as independent directors and
registered them as such at Tokyo Stock Exchange, Inc.
External Statutory Auditors and Outside Directors
(Note) The number of executives applicable mentioned above includes one Director who retired from office at the end of the 155th Ordinary General Meeting of Shareholders held on August 26, 2016.
Governance
25 Toyo Denki Seizo Report 2017 26

Basic policy
Information security training
The Company holds a vast amount of information assets including
information presented by customers related to its business
execution and confidential information concerning the Group’s
proprietary technologies and its trade. Each Group company is
taking various measures in this respect based on an awareness
of shared security under the Group’s Information Security Guide-
lines, which have been established to adequately manage and
use these information assets.
The Company is conducting educational activities to develop
information security awareness among all employees including
various training sessions, some involving the use of educational
DVDs.
Internal Control
Compliance education
Principles of compliance
Compliance promotion framework
The Company views the development and operation of an internal con-
trol system to be an important management issue, and it has developed
an efficient, legal and appropriate business execution system pursuant
to Article 362 of the Companies Act and Article 100 of the Ordinance
for Enforcement of the Companies Act. The Internal Control Committee
established under the Board of Directors reviews the operational status
of the internal control system and will revise it as necessary.
The Company is organizing scheduled and systematic training
sessions based on a compliance training master plan to enhance
knowledge on compliance while promoting a conscious respect
for corporate ethics.
The Company has set “1. adherence to rules,” “2. observance of
confidentiality,” “3. distinction between private and public mat-
ters,” “4. strictness with money,” “5. prohibition of side jobs,” and
“6. prohibition of discriminatory and sexually suggestive state-
ments or behavior” as principles of compliance.
To focus on business principles and fulfill its social responsibility,
the Company has provided all officers and employees with a copy
of the Compliance Manual (Toyo Denki Seizo Ethical Standards)
that stipulates its code of conduct. The move is part of an effort to
have the code and the basic rules of work fully known.
The Company has also introduced a whistle-blowing system
that allows employees to provide information directly to the man-
agement. The system is aimed at ensuring that any illegal or
inappropriate conduct within the Company is detected at the
earliest possible stage and that adequate measures are taken
promptly and as needed so that such conduct is rectified.
Basic policy
Promotion framework
The Company is engaged in developing rules and a framework for risk
management according to the Basic Rules for Risk Management es-
tablished in August 2006.
The Company has established the Internal Control Committee under the
Board of Directors, chaired by the President. It analyzes and assesses
all the risks that exist in the Group and develops an effective risk man-
agement framework capable of dealing precisely with the risks of the
types and degrees that the Group is exposed to. The committee specif-
ically reviews risk verifications and countermeasures, and periodically
reports details of its deliberations to the Board of Directors.
Furthermore, the committee is committed to enhancing the Group-
wide risk management framework in accordance with the Basic Rules
for Risk Management.
Information Security
Risk ManagementInternal Control and Compliance
From the perspective of proactive information disclosure, the
Group intends to disclose a wide range of recognizable risks. Ma-
jor risks that may affect its earnings and financial position are set
out below. The Group aims for thorough understanding of these
risks in order to establish a necessary risk management frame-
work designed to prevent the risks from materializing or minimize
the impact of risks if they do materialize.
(1) Business activities, business structure, economic trends, and other factors
The Group’s sales heavily rely on the Transportation Systems
and Industrial Systems segments. Its customers conduct busi-
ness operations at home and overseas. As such, business
climates and individual spending conditions in different
countries may affect the Group’s business performance.
(2) Production bases
The great majority of the Group’s production bases are located
in the Kanto area. Production capacity may be severely affect-
ed by large-scale disasters in the area.
(3) Intensifying competition
The Japanese market for the Transportation Systems segment
has matured and thus faces intensifying competition. The In-
dustrial Systems segment is under pressure from intensifying
competition for product development. The Group’s business
performance may be affected by such intensifying competition.
(4) Product quality
Defects in products may link to materialization of a risk that
requires large-scale compensation for damages. The possibili-
ty exists that insurance may not be able to cover associated
costs, which may affect the Group’s business performance.
(5) Product development
With a view to providing attractive products to customers, the
Group applies itself to gathering information about customer
needs and leverages it in the development of new products to
support its future growth. However, delays in the development
of new products to respond to rapid technological or environ-
mental changes may affect the Group’s performance.
(6) Material procurement
Owing to the fact that the Group’s business has various distinc-
tive characteristics, some of the materials it procures are not
easily available due to factors such as a limited number of sup-
pliers. Delays in supply or discontinuation in production of such
materials may affect the Group’s performance. In addition, dis-
ruptions to the entire supply chain caused by a large-scale
disaster or other incidents could impact the Group’s operations.
Moreover, its business may be affected by the fluctuation in
prices of raw materials, notably steel products and copper.
(7) Overseas expansion
The Group proactively pursues the expansion of overseas
operations including the Chinese market. Its performance may
be affected by major changes in situations overseas.
(8) Intellectual property rights
The Group attends to the protection of intellectual property
rights. However, amid drastically advancing technical innova-
tions and accelerating globalization of business, the Group is
inevitably exposed to potential disputes with third parties over
intellectual property rights. If a dispute occurs, the Group’s
business may be affected.
(9) Business alliances
With the aim of business expansion and enhancing competi-
tiveness, the Group proactively pursues various alliances with
third parties. However, if these alliances do not deliver expect-
ed results due to a failure in forging favorable relationships
with partners, the Group may face an impact on its perfor-
mance.
(10) Exchange rate fluctuations
On the back of aggressive expansion into overseas markets,
the Group will inevitably face heavier impact of foreign cur-
rency exchange rate fluctuations on its earnings as it
increases foreign currency denominated transactions.
(11) Holding assets
Fluctuations in the fair value of assets held by the Group may
affect its performance.
(12) Financing
The Group’s financing programs may be affected by unex-
pected changes in financial conditions.
(13) Information security
The Group retains customer information related to its business
executions. Also, it possesses various types of confidential in-
formation concerning the Group’s proprietary technologies and
operations. If these information assets leak outside the Group
for unforeseeable reasons, it may impact its performance.
(14) Compliance
The Group proactively pursues expansion in overseas opera-
tions, particularly the Chinese market; therefore its opera-
tions are subject to the laws and regulations of each country.
Although the Group has established and conducts a robust
compliance system, its operations are still at risk from the ef-
fects of unforeseeable events.
(15) Litigation
If the Group becomes the subject of any legal action or other
legal procedures, its business may be affected.
Risk Factors
Governance
27 Toyo Denki Seizo Report 2017 28
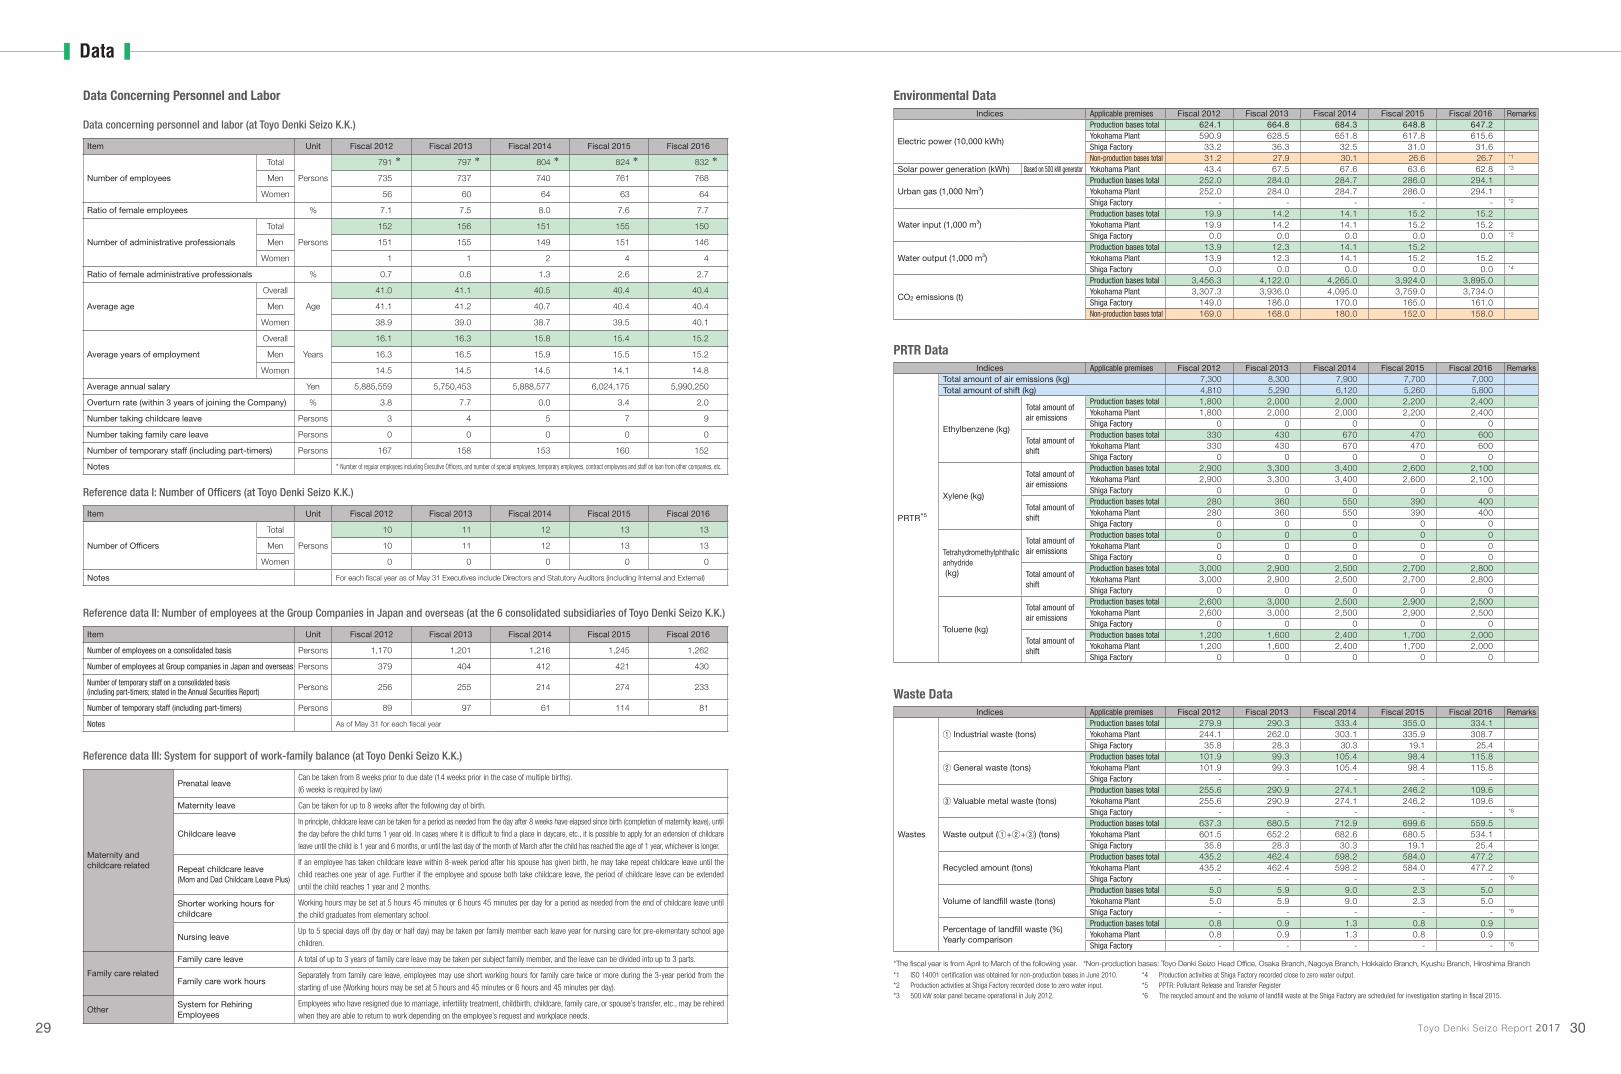
Indices Applicable premises Fiscal 2012 Fiscal 2013 Fiscal 2014 Fiscal 2015 Fiscal 2016 Remarks
PRTR*5
Total amount of air emissions (kg) 7,300 8,300 7,900 7,700 7,000Total amount of shift (kg) 4,810 5,290 6,120 5,260 5,800
Ethylbenzene (kg)
Total amount of air emissions
Production bases total 1,800 2,000 2,000 2,200 2,400Yokohama Plant 1,800 2,000 2,000 2,200 2,400Shiga Factory 0 0 0 0 0
Total amount of shift
Production bases total 330 430 670 470 600Yokohama Plant 330 430 670 470 600Shiga Factory 0 0 0 0 0
Xylene (kg)
Total amount of air emissions
Production bases total 2,900 3,300 3,400 2,600 2,100Yokohama Plant 2,900 3,300 3,400 2,600 2,100Shiga Factory 0 0 0 0 0
Total amount of shift
Production bases total 280 360 550 390 400Yokohama Plant 280 360 550 390 400Shiga Factory 0 0 0 0 0
Tetrahydromethylphthalic anhydride (kg)
Total amount of air emissions
Production bases total 0 0 0 0 0Yokohama Plant 0 0 0 0 0Shiga Factory 0 0 0 0 0
Total amount of shift
Production bases total 3,000 2,900 2,500 2,700 2,800Yokohama Plant 3,000 2,900 2,500 2,700 2,800Shiga Factory 0 0 0 0 0
Toluene (kg)
Total amount of air emissions
Production bases total 2,600 3,000 2,500 2,900 2,500Yokohama Plant 2,600 3,000 2,500 2,900 2,500Shiga Factory 0 0 0 0 0
Total amount of shift
Production bases total 1,200 1,600 2,400 1,700 2,000Yokohama Plant 1,200 1,600 2,400 1,700 2,000Shiga Factory 0 0 0 0 0
PRTR Data
Indices Applicable premises Fiscal 2012 Fiscal 2013 Fiscal 2014 Fiscal 2015 Fiscal 2016 Remarks
Wastes
Industrial waste (tons)Production bases total 279.9 290.3 333.4 355.0 334.1Yokohama Plant 244.1 262.0 303.1 335.9 308.7Shiga Factory 35.8 28.3 30.3 19.1 25.4
General waste (tons)Production bases total 101.9 99.3 105.4 98.4 115.8Yokohama Plant 101.9 99.3 105.4 98.4 115.8Shiga Factory - - - - -
Valuable metal waste (tons)Production bases total 255.6 290.9 274.1 246.2 109.6Yokohama Plant 255.6 290.9 274.1 246.2 109.6Shiga Factory - - - - - *6
Waste output ( ) (tons)Production bases total 637.3 680.5 712.9 699.6 559.5Yokohama Plant 601.5 652.2 682.6 680.5 534.1Shiga Factory 35.8 28.3 30.3 19.1 25.4
Recycled amount (tons)Production bases total 435.2 462.4 598.2 584.0 477.2Yokohama Plant 435.2 462.4 598.2 584.0 477.2Shiga Factory - - - - - *6
Volume of landfill waste (tons)Production bases total 5.0 5.9 9.0 2.3 5.0Yokohama Plant 5.0 5.9 9.0 2.3 5.0Shiga Factory - - - - - *6
Percentage of landfill waste (%)Yearly comparison
Production bases total 0.8 0.9 1.3 0.8 0.9Yokohama Plant 0.8 0.9 1.3 0.8 0.9Shiga Factory - - - - - *6
Waste Data
Environmental Data
*The fiscal year is from April to March of the following year. *Non-production bases: Toyo Denki Seizo Head Office, Osaka Branch, Nagoya Branch, Hokkaido Branch, Kyushu Branch, Hiroshima Branch
*1 ISO 14001 certification was obtained for non-production bases in June 2010.*2 Production activities at Shiga Factory recorded close to zero water input. *3 500 kW solar panel became operational in July 2012.
*4 Production activities at Shiga Factory recorded close to zero water output. *5 PPTR: Pollutant Release and Transfer Register*6 The recycled amount and the volume of landfill waste at the Shiga Factory are scheduled for investigation starting in fiscal 2015.
Indices Applicable premises Fiscal 2012 Fiscal 2013 Fiscal 2014 Fiscal 2015 Fiscal 2016 Remarks
Electric power (10,000 kWh)
Production bases total 624.1 664.8 684.3 648.8 647.2Yokohama Plant 590.9 628.5 651.8 617.8 615.6Shiga Factory 33.2 36.3 32.5 31.0 31.6Non-production bases total 31.2 27.9 30.1 26.6 26.7 *1
Solar power generation (kWh) Based on 500 kW generator Yokohama Plant 43.4 67.5 67.6 63.6 62.8 *3
Urban gas (1,000 Nm3)Production bases total 252.0 284.0 284.7 286.0 294.1Yokohama Plant 252.0 284.0 284.7 286.0 294.1Shiga Factory - - - - - *2
Water input (1,000 m3)Production bases total 19.9 14.2 14.1 15.2 15.2Yokohama Plant 19.9 14.2 14.1 15.2 15.2Shiga Factory 0.0 0.0 0.0 0.0 0.0 *2
Water output (1,000 m3)Production bases total 13.9 12.3 14.1 15.2Yokohama Plant 13.9 12.3 14.1 15.2 15.2Shiga Factory 0.0 0.0 0.0 0.0 0.0 *4
CO2 emissions (t)
Production bases total 3,456.3 4,122.0 4,265.0 3,924.0 3,895.0Yokohama Plant 3,307.3 3,936.0 4,095.0 3,759.0 3,734.0Shiga Factory 149.0 186.0 170.0 165.0 161.0Non-production bases total 169.0 168.0 180.0 152.0 158.0
Data Concerning Personnel and Labor
Data concerning personnel and labor (at Toyo Denki Seizo K.K.)
Item Unit Fiscal 2012 Fiscal 2013 Fiscal 2014 Fiscal 2015 Fiscal 2016
Number of employees
Total
Persons
791 797 804 824 832
Men 735 737 740 761 768
Women 56 60 64 63 64
Ratio of female employees % 7.1 7.5 8.0 7.6 7.7
Number of administrative professionals
Total
Persons
152 156 151 155 150
Men 151 155 149 151 146
Women 1 1 2 4 4
Ratio of female administrative professionals % 0.7 0.6 1.3 2.6 2.7
Average age
Overall
Age
41.0 41.1 40.5 40.4 40.4
Men 41.1 41.2 40.7 40.4 40.4
Women 38.9 39.0 38.7 39.5 40.1
Average years of employment
Overall
Years
16.1 16.3 15.8 15.4 15.2
Men 16.3 16.5 15.9 15.5 15.2
Women 14.5 14.5 14.5 14.1 14.8
Average annual salary Yen 5,885,559 5,750,453 5,888,577 6,024,175 5,990,250
Overturn rate (within 3 years of joining the Company) % 3.8 7.7 0.0 3.4 2.0
Number taking childcare leave Persons 3 4 5 7 9
Number taking family care leave Persons 0 0 0 0 0
Number of temporary staff (including part-timers) Persons 167 158 153 160 152
Notes * Number of regular employees including Executive Officers, and number of special employees, temporary employees, contract employees and staff on loan from other companies, etc.
Reference data I: Number of Officers (at Toyo Denki Seizo K.K.)
Item Unit Fiscal 2012 Fiscal 2013 Fiscal 2014 Fiscal 2015 Fiscal 2016
Number of Officers
Total
Persons
10 11 12 13 13
Men 10 11 12 13 13
Women 0 0 0 0 0
Notes For each fiscal year as of May 31 Executives include Directors and Statutory Auditors (including Internal and External)
Reference data II: Number of employees at the Group Companies in Japan and overseas (at the 6 consolidated subsidiaries of Toyo Denki Seizo K.K.)
Item Unit Fiscal 2012 Fiscal 2013 Fiscal 2014 Fiscal 2015 Fiscal 2016
Number of employees on a consolidated basis Persons 1,170 1,201 1,216 1,245 1,262
Number of employees at Group companies in Japan and overseas Persons 379 404 412 421 430
Number of temporary staff on a consolidated basis (including part-timers; stated in the Annual Securities Report) Persons 256 255 214 274 233
Number of temporary staff (including part-timers) Persons 89 97 61 114 81
Notes As of May 31 for each fiscal year
Reference data III: System for support of work-family balance (at Toyo Denki Seizo K.K.)
Maternity and childcare related
Prenatal leaveCan be taken from 8 weeks prior to due date (14 weeks prior in the case of multiple births).
(6 weeks is required by law)
Maternity leave Can be taken for up to 8 weeks after the following day of birth.
Childcare leaveIn principle, childcare leave can be taken for a period as needed from the day after 8 weeks have elapsed since birth (completion of maternity leave), until
the day before the child turns 1 year old. In cases where it is difficult to find a place in daycare, etc., it is possible to apply for an extension of childcare
leave until the child is 1 year and 6 months, or until the last day of the month of March after the child has reached the age of 1 year, whichever is longer.
Repeat childcare leave(Mom and Dad Childcare Leave Plus)
If an employee has taken childcare leave within 8-week period after his spouse has given birth, he may take repeat childcare leave until the
child reaches one year of age. Further if the employee and spouse both take childcare leave, the period of childcare leave can be extended
until the child reaches 1 year and 2 months.
Shorter working hours for childcare
Working hours may be set at 5 hours 45 minutes or 6 hours 45 minutes per day for a period as needed from the end of childcare leave until
the child graduates from elementary school.
Nursing leaveUp to 5 special days off (by day or half day) may be taken per family member each leave year for nursing care for pre-elementary school age
children.
Family care related
Family care leave A total of up to 3 years of family care leave may be taken per subject family member, and the leave can be divided into up to 3 parts.
Family care work hoursSeparately from family care leave, employees may use short working hours for family care twice or more during the 3-year period from the
starting of use (Working hours may be set at 5 hours and 45 minutes or 6 hours and 45 minutes per day).
OtherSystem for Rehiring Employees
Employees who have resigned due to marriage, infertility treatment, childbirth, childcare, family care, or spouse’s transfer, etc., may be rehired
when they are able to return to work depending on the employee’s request and workplace needs.
Data
29 Toyo Denki Seizo Report 2017 30

Cash Flows
Net cash provided by operating activities amounted to 1,505 million yen. A principal cash inflow was income be-
fore income taxes at 1,707 million yen, while a major cash outflow was depreciation and amortization at 801
million yen.
Cash flow from operating activitiesNet cash provided by operating activities1,505 million yen
Net cash used in investing activities totaled 4,691 million yen, and mainly comprised funds used in for the pur-
chases of property, plant and equipment at 3,901 million yen as well as funds used in for the purchases of intan-
gible assets at 619 million yen.
Cash flow from investing activitiesNet cash used in
investing activities4,691 million yen
Net cash provided by financing activities was 2,868 million yen. A major cash inflow was an increase in long-
term debt at 3,500 million yen, while a major cash outflow was purchases of treasury stock at 302 million yen.
Cash flow from financing activitiesNet cash provided by financing activities2,868 million yen
Financial Position
Total assets as of May 31, 2017 stood at 54,927 million yen, an increase of 4,693 million yen compared with the end of
the previous fiscal year. The increase in total assets was largely attributable to increases of 2,040 million yen in trade notes
and accounts receivable, 3,261 million yen in property, plant and equipment and 758 million yen in investment securities.
AssetsTotal Assets
54,927 million yen
LiabilitiesTotal liabilities
30,324 million yen
Total liabilities as of May 31, 2017 stood at 30,324 million yen, an increase of 3,767 million yen compared with
the end of the previous fiscal year. This increase was largely attributable to an increase in debts of 3,450 million
yen.
Net assets as of May 31, 2017 stood at 24,603 million yen, an increase of 926 million yen compared with the
end of the previous fiscal year. This increase was largely attributable to an increase of 871 million yen from re-
tained earnings and a 410 million yen increase in unrealized holding gain on available-for-sale securities.
Net AssetsTotal net assets
24,603 million yen
Results of Operation
Orders received increased 8.7% compared with the previous fiscal year to 43,355 million yen due to an increase
in orders received in the Transportation Systems segment, the Industrial Systems segment and the Information
Equipment Systems segment.
Orders receivedYoY +8.7%
Net sales increased 2.3% compared with the previous fiscal year to 40,668 million yen due to an increase in the
Transportation Systems segment and the Information Equipment Systems segment, despite a decrease in the In-
dustrial Systems segment.
Net salesYoY +2.3%
From a profit perspective, operating income decreased 4.1% compared with the previous fiscal year to 1,571 million yen due to decreased
revenue in the Industrial Systems segment, despite increased revenue in the Transportation Systems segment and the Information Equip-
ment Systems segment. However, ordinary income increased 11.5% compared with the previous fiscal year to 1,663 million yen due to a
sharp decrease in foreign exchange losses, and net income attributable to owners of the parent increased 32.0% to 1,174 million yen.
Profit/LossNet Income
attributable to owners of the parent
YoY +32.0%
Consolidated Operating Results, Consolidated Financial Position, and Consolidated Cash Flow for Fiscal
2016 (from June 1, 2016 to May 31, 2017) are as follows:
Financial Report Financial Report
32 Financial Review
33 Consolidated Balance Sheets
35 Consolidated Statements of Income
and Comprehensive Income
36 Consolidated Statements of Changes in Net Assets
37 Consolidated Statements of Cash Flows
Financial Review
Toyo Denki Seizo Report 2017 3231
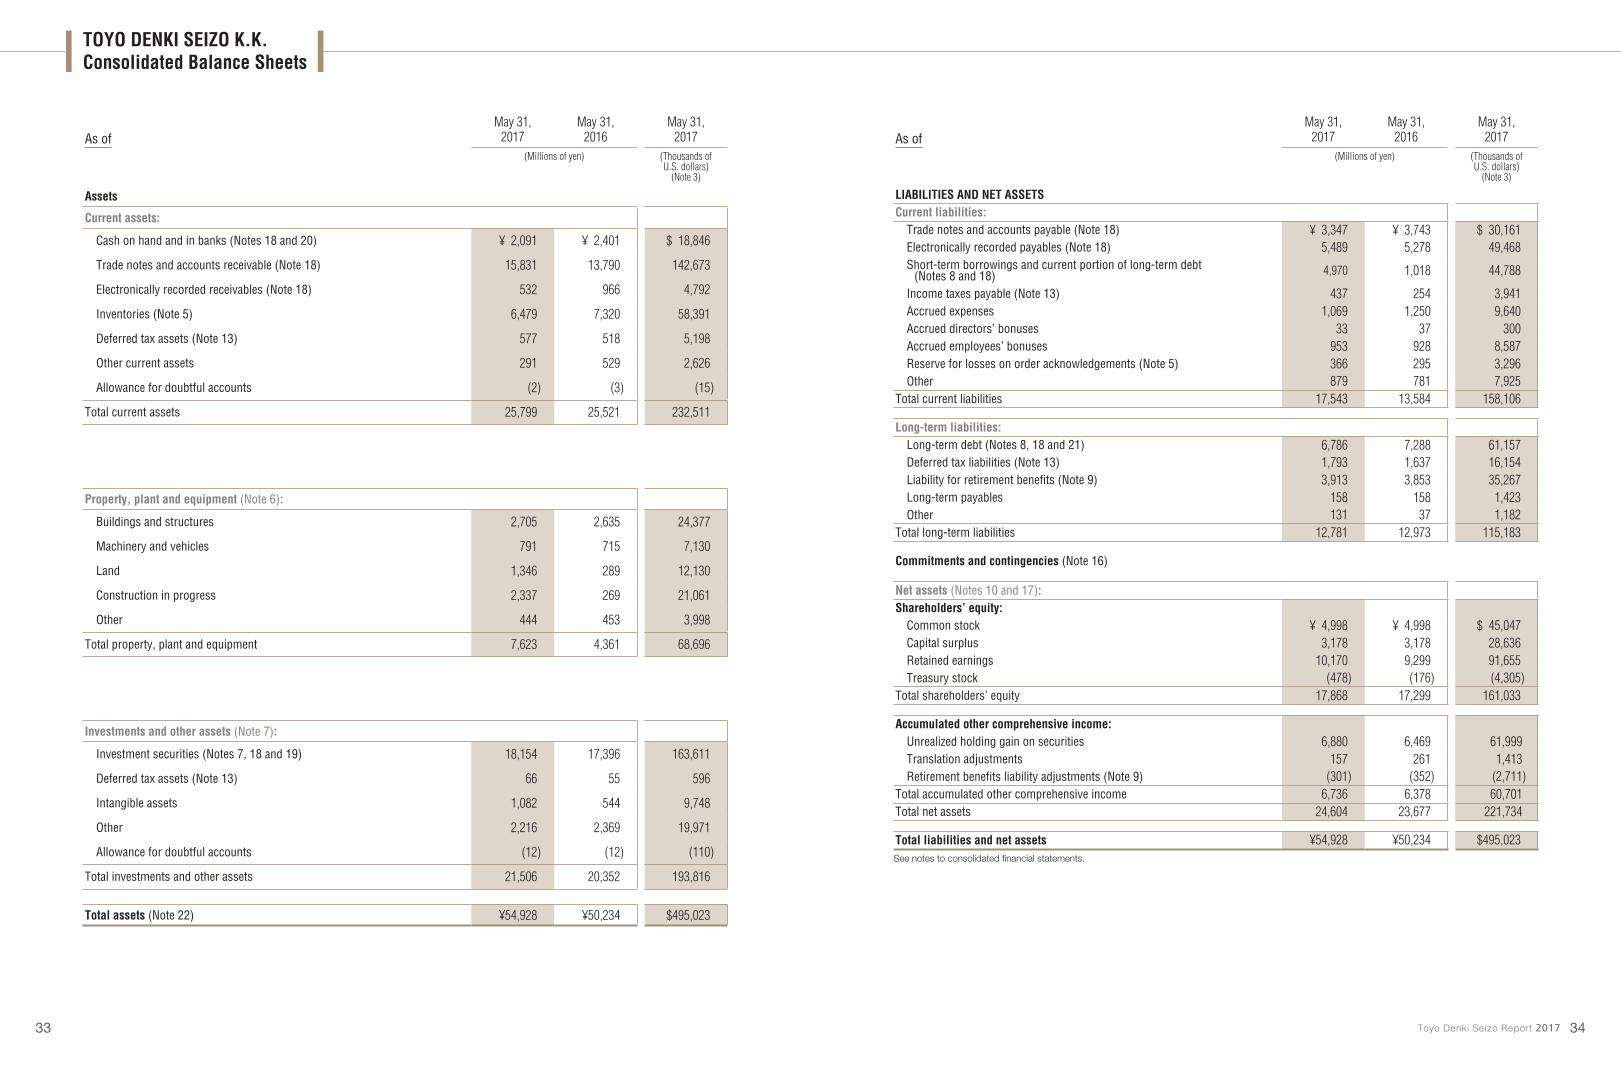
As ofMay 31,
2017May 31,
2016May 31,
2017(Millions of yen) (Thousands of
U.S. dollars) (Note 3)
Assets
Current assets:
Cash on hand and in banks (Notes 18 and 20) ¥ 2,091 ¥ 2,401 $ 18,846
Trade notes and accounts receivable (Note 18) 15,831 13,790 142,673
Electronically recorded receivables (Note 18) 532 966 4,792
Inventories (Note 5) 6,479 7,320 58,391
Deferred tax assets (Note 13) 577 518 5,198
Other current assets 291 529 2,626
Allowance for doubtful accounts (2) (3) (15)
Total current assets 25,799 25,521 232,511
Property, plant and equipment (Note 6):
Buildings and structures 2,705 2,635 24,377
Machinery and vehicles 791 715 7,130
Land 1,346 289 12,130
Construction in progress 2,337 269 21,061
Other 444 453 3,998
Total property, plant and equipment 7,623 4,361 68,696
Investments and other assets (Note 7):
Investment securities (Notes 7, 18 and 19) 18,154 17,396 163,611
Deferred tax assets (Note 13) 66 55 596
Intangible assets 1,082 544 9,748
Other 2,216 2,369 19,971
Allowance for doubtful accounts (12) (12) (110)
Total investments and other assets 21,506 20,352 193,816
Total assets (Note 22) ¥54,928 ¥50,234 $495,023
As ofMay 31,
2017May 31,
2016May 31,
2017(Millions of yen) (Thousands of
U.S. dollars) (Note 3)
LIABILITIES AND NET ASSETSCurrent liabilities:
Trade notes and accounts payable (Note 18) ¥ 3,347 ¥ 3,743 $ 30,161Electronically recorded payables (Note 18) 5,489 5,278 49,468Short-term borrowings and current portion of long-term debt
(Notes 8 and 18) 4,970 1,018 44,788
Income taxes payable (Note 13) 437 254 3,941Accrued expenses 1,069 1,250 9,640Accrued directors’ bonuses 33 37 300Accrued employees’ bonuses 953 928 8,587Reserve for losses on order acknowledgements (Note 5) 366 295 3,296Other 879 781 7,925
Total current liabilities 17,543 13,584 158,106
Long-term liabilities:Long-term debt (Notes 8, 18 and 21) 6,786 7,288 61,157Deferred tax liabilities (Note 13) 1,793 1,637 16,154Liability for retirement benefits (Note 9) 3,913 3,853 35,267Long-term payables 158 158 1,423Other 131 37 1,182
Total long-term liabilities 12,781 12,973 115,183
Commitments and contingencies (Note 16)
Net assets (Notes 10 and 17):Shareholders’ equity:
Common stock ¥ 4,998 ¥ 4,998 $ 45,047Capital surplus 3,178 3,178 28,636Retained earnings 10,170 9,299 91,655Treasury stock (478) (176) (4,305)
Total shareholders’ equity 17,868 17,299 161,033
Accumulated other comprehensive income:Unrealized holding gain on securities 6,880 6,469 61,999Translation adjustments 157 261 1,413Retirement benefits liability adjustments (Note 9) (301) (352) (2,711)
Total accumulated other comprehensive income 6,736 6,378 60,701Total net assets 24,604 23,677 221,734
Total liabilities and net assets ¥54,928 ¥50,234 $495,023See notes to consolidated financial statements.
TOYO DENKI SEIZO K.K. Consolidated Balance Sheets
33 Toyo Denki Seizo Report 2017 34

For the Years EndedMay 31,
2017May 31,
2016May 31,
2017(Millions of yen) (Thousands of
U.S. dollars) (Note 3)
Net sales (Note 22) ¥40,668 ¥39,746 $366,511Cost of sales (Note 5) 31,447 30,627 283,407Gross profit 9,221 9,119 83,104
Selling, general and administrative expenses (Note 11) 7,649 7,480 68,938Operating income (Note 22) 1,572 1,639 14,166
Non-operating income (expenses):Interest and dividend income 228 233 2,056Interest expense (123) (125) (1,105)Equity in earnings of unconsolidated subsidiaries and affiliates 68 76 614Dividend income on life insurance 48 70 428Foreign exchange loss (17) (418) (155)Other income (expenses), net (112) 18 (1,011)
92 (146) 827Ordinary income 1,664 1,493 14,993Special gains (losses), net (Note 12) 44 (88) 396Income before income taxes 1,708 1,405 15,389
Income taxes (Note 13):Current 663 369 5,968Deferred (129) 146 (1,161)
534 515 4,807Net income 1,174 890 10,582Net income attributable to non-controlling interests — — —Net income attributable to owners of the parent ¥ 1,174 ¥ 890 $ 10,582See notes to consolidated financial statements.
For the Years EndedMay 31,
2017May 31,
2016May 31,
2017(Millions of yen) (Thousands of
U.S. dollars) (Note 3)
Net income ¥1,174 ¥ 890 $10,582
Other comprehensive income (loss) (Note 14):Unrealized holding gain (loss) on securities 410 (1,848) 3,696Translation adjustments (12) 49 (106)Retirement benefits liability adjustments 51 32 459Share of other comprehensive loss of affiliates accounted for by the
equity method (109) (48) (989)
Total other comprehensive income (loss) 340 (1,815) 3,060
Comprehensive income (loss) ¥1,514 ¥ (925) $13,642
Comprehensive income (loss) attributable to:Owners of the parent ¥1,514 ¥ (925) $13,642Non-controlling interests — — —
See notes to consolidated financial statements.
(Millions of yen)
Shareholders’ equity Accumulated other comprehensive income
Commonstock
Capitalsurplus
Retainedearnings
Treasurystock
Totalshareholders’
equity
Unrealizedholding gain on
securitiesTranslationadjustments
Retirementbenefitsliability
adjustments
Totalaccumulated
othercomprehensive
incomeTotal netassets
Balance as of June 1, 2015 ¥4,998 ¥3,178 ¥ 8,698 ¥(172) ¥16,702 ¥ 8,317 ¥ 260 ¥(384) ¥ 8,193 ¥24,895Changes during the year
Cash dividends paid — — (289) — (289) — — — — (289)Net income attributable to
owners of the parent — — 890 — 890 — — — — 890
Purchase of treasury stock — — — (4) (4) — — — — (4)Net changes in items
other than those in shareholders’ equity — — — — — (1,848) 1 32 (1,815) (1,815)
Total changes during the year — — 601 (4) 597 (1,848) 1 32 (1,815) (1,218)Balance as of May 31, 2016 ¥4,998 ¥3,178 ¥ 9,299 ¥(176) ¥17,299 ¥ 6,469 ¥ 261 ¥(352) ¥ 6,378 ¥23,677
Balance as of June 1, 2016 ¥4,998 ¥3,178 ¥ 9,299 ¥(176) ¥17,299 ¥ 6,469 ¥ 261 ¥(352) ¥ 6,378 ¥23,677Changes during the year
Cash dividends paid — — (289) — (289) — — — — (289)Net income attributable to
owners of the parent — — 1,174 — 1,174 — — — — 1,174
Change in scope of equity method application (14) (14) (14)
Purchase of treasury stock — — — (302) (302) — — — — (302)Net changes in items
other than those in shareholders’ equity — — — — — 411 (104) 51 358 358
Total changes during the year — — 871 (302) 569 411 (104) 51 358 927Balance as of May 31, 2017 ¥4,998 ¥3,178 ¥10,170 ¥(478) ¥17,868 ¥ 6,880 ¥ 157 ¥(301) ¥ 6,736 ¥24,604
(Thousands of U.S. dollars) (Note 3)
Shareholders’ equity Accumulated other comprehensive income
Commonstock
Capitalsurplus
Retainedearnings
Treasurystock
Totalshareholders’
equity
Unrealizedholding gain on
securitiesTranslationadjustments
Retirementbenefitsliability
adjustments
Totalaccumulated
othercomprehensive
incomeTotal netassets
Balance as of June 1, 2016 $45,047 $28,636 $83,803 $(1,581) $155,905 $58,303 $2,344 $(3,170) $57,477 $213,382Changes during the year
Cash dividends paid — — (2,605) — (2,605) — — — — (2,605)Net income attributable to owners of the parent — — 10,582 — 10,582 — — — — 10,582
Change in scope of equity method application — — (125) — (125) — — — — (125)
Purchase of treasury stock — — — (2,724) (2,724) — — — — (2,724)Net changes in items
other than those in shareholders’ equity — — — — — 3,696 (931) 459 3,224 3,224
Total changes during the year — — 7,852 (2,724) 5,128 3,696 (931) 459 3,224 8,352Balance as of May 31, 2017 $45,047 $28,636 $91,655 $(4,305) $161,033 $61,999 $1,413 $(2,711) $60,701 $221,734See notes to consolidated financial statements.
TOYO DENKI SEIZO K.K.Consolidated Statements of Income
TOYO DENKI SEIZO K.K.Consolidated Statements of Comprehensive Income
TOYO DENKI SEIZO K.K.Consolidated Statements of Changes in Net Assets
35 Toyo Denki Seizo Report 2017 36
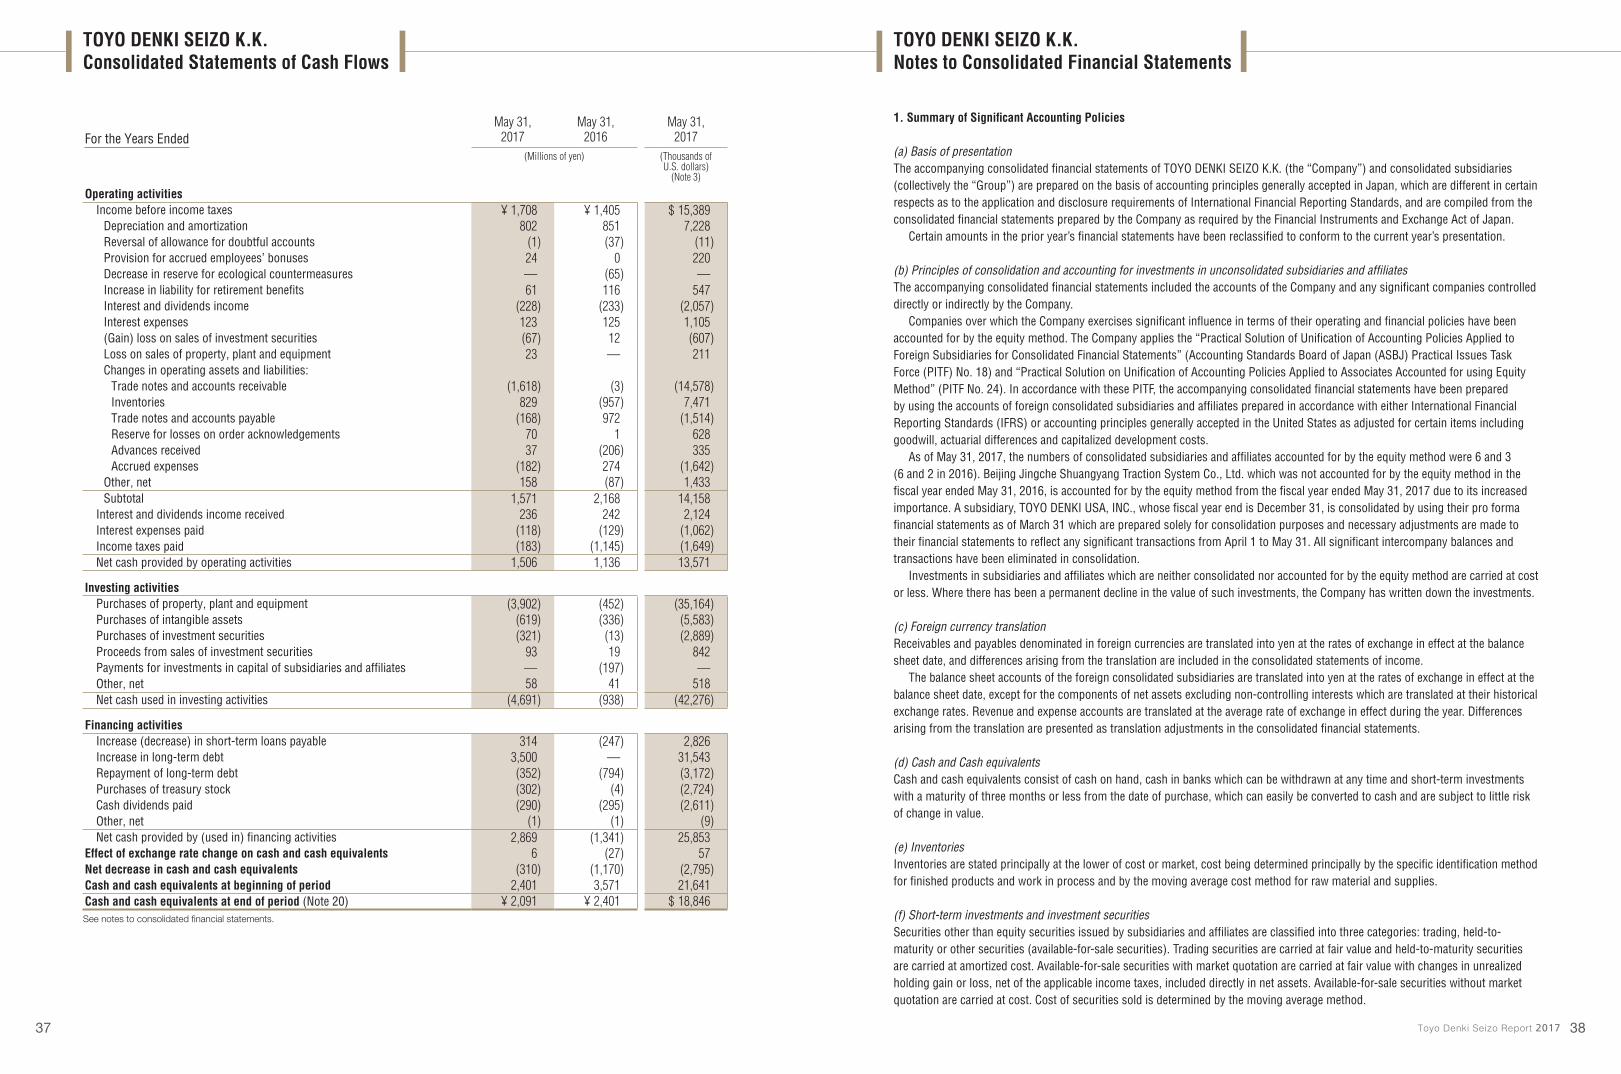
For the Years EndedMay 31,
2017May 31,
2016May 31,
2017(Millions of yen) (Thousands of
U.S. dollars) (Note 3)
Operating activitiesIncome before income taxes ¥ 1,708 ¥ 1,405 $ 15,389
Depreciation and amortization 802 851 7,228Reversal of allowance for doubtful accounts (1) (37) (11)Provision for accrued employees’ bonuses 24 0 220Decrease in reserve for ecological countermeasures — (65) —Increase in liability for retirement benefits 61 116 547Interest and dividends income (228) (233) (2,057)Interest expenses 123 125 1,105(Gain) loss on sales of investment securities (67) 12 (607)Loss on sales of property, plant and equipment 23 — 211Changes in operating assets and liabilities:
Trade notes and accounts receivable (1,618) (3) (14,578)Inventories 829 (957) 7,471Trade notes and accounts payable (168) 972 (1,514)Reserve for losses on order acknowledgements 70 1 628Advances received 37 (206) 335Accrued expenses (182) 274 (1,642)
Other, net 158 (87) 1,433Subtotal 1,571 2,168 14,158
Interest and dividends income received 236 242 2,124Interest expenses paid (118) (129) (1,062)Income taxes paid (183) (1,145) (1,649)Net cash provided by operating activities 1,506 1,136 13,571
Investing activitiesPurchases of property, plant and equipment (3,902) (452) (35,164)Purchases of intangible assets (619) (336) (5,583)Purchases of investment securities (321) (13) (2,889)Proceeds from sales of investment securities 93 19 842Payments for investments in capital of subsidiaries and affiliates — (197) —Other, net 58 41 518Net cash used in investing activities (4,691) (938) (42,276)
Financing activitiesIncrease (decrease) in short-term loans payable 314 (247) 2,826Increase in long-term debt 3,500 — 31,543Repayment of long-term debt (352) (794) (3,172)Purchases of treasury stock (302) (4) (2,724)Cash dividends paid (290) (295) (2,611)Other, net (1) (1) (9)Net cash provided by (used in) financing activities 2,869 (1,341) 25,853
Effect of exchange rate change on cash and cash equivalents 6 (27) 57Net decrease in cash and cash equivalents (310) (1,170) (2,795)Cash and cash equivalents at beginning of period 2,401 3,571 21,641Cash and cash equivalents at end of period (Note 20) ¥ 2,091 ¥ 2,401 $ 18,846See notes to consolidated financial statements.
1. Summary of Significant Accounting Policies
(a) Basis of presentationThe accompanying consolidated financial statements of TOYO DENKI SEIZO K.K. (the “Company”) and consolidated subsidiaries (collectively the “Group”) are prepared on the basis of accounting principles generally accepted in Japan, which are different in certain respects as to the application and disclosure requirements of International Financial Reporting Standards, and are compiled from the consolidated financial statements prepared by the Company as required by the Financial Instruments and Exchange Act of Japan.
Certain amounts in the prior year’s financial statements have been reclassified to conform to the current year’s presentation.
(b) Principles of consolidation and accounting for investments in unconsolidated subsidiaries and affiliatesThe accompanying consolidated financial statements included the accounts of the Company and any significant companies controlled directly or indirectly by the Company.
Companies over which the Company exercises significant influence in terms of their operating and financial policies have been accounted for by the equity method. The Company applies the “Practical Solution of Unification of Accounting Policies Applied to Foreign Subsidiaries for Consolidated Financial Statements” (Accounting Standards Board of Japan (ASBJ) Practical Issues Task Force (PITF) No. 18) and “Practical Solution on Unification of Accounting Policies Applied to Associates Accounted for using Equity Method” (PITF No. 24). In accordance with these PITF, the accompanying consolidated financial statements have been prepared by using the accounts of foreign consolidated subsidiaries and affiliates prepared in accordance with either International Financial Reporting Standards (IFRS) or accounting principles generally accepted in the United States as adjusted for certain items including goodwill, actuarial differences and capitalized development costs.
As of May 31, 2017, the numbers of consolidated subsidiaries and affiliates accounted for by the equity method were 6 and 3 (6 and 2 in 2016). Beijing Jingche Shuangyang Traction System Co., Ltd. which was not accounted for by the equity method in the fiscal year ended May 31, 2016, is accounted for by the equity method from the fiscal year ended May 31, 2017 due to its increased importance. A subsidiary, TOYO DENKI USA, INC., whose fiscal year end is December 31, is consolidated by using their pro forma financial statements as of March 31 which are prepared solely for consolidation purposes and necessary adjustments are made to their financial statements to reflect any significant transactions from April 1 to May 31. All significant intercompany balances and transactions have been eliminated in consolidation.
Investments in subsidiaries and affiliates which are neither consolidated nor accounted for by the equity method are carried at cost or less. Where there has been a permanent decline in the value of such investments, the Company has written down the investments.
(c) Foreign currency translationReceivables and payables denominated in foreign currencies are translated into yen at the rates of exchange in effect at the balance sheet date, and differences arising from the translation are included in the consolidated statements of income.
The balance sheet accounts of the foreign consolidated subsidiaries are translated into yen at the rates of exchange in effect at the balance sheet date, except for the components of net assets excluding non-controlling interests which are translated at their historical exchange rates. Revenue and expense accounts are translated at the average rate of exchange in effect during the year. Differences arising from the translation are presented as translation adjustments in the consolidated financial statements.
(d) Cash and Cash equivalentsCash and cash equivalents consist of cash on hand, cash in banks which can be withdrawn at any time and short-term investments with a maturity of three months or less from the date of purchase, which can easily be converted to cash and are subject to little risk of change in value.
(e) InventoriesInventories are stated principally at the lower of cost or market, cost being determined principally by the specific identification method for finished products and work in process and by the moving average cost method for raw material and supplies.
(f) Short-term investments and investment securitiesSecurities other than equity securities issued by subsidiaries and affiliates are classified into three categories: trading, held-to-maturity or other securities (available-for-sale securities). Trading securities are carried at fair value and held-to-maturity securities are carried at amortized cost. Available-for-sale securities with market quotation are carried at fair value with changes in unrealized holding gain or loss, net of the applicable income taxes, included directly in net assets. Available-for-sale securities without market quotation are carried at cost. Cost of securities sold is determined by the moving average method.
TOYO DENKI SEIZO K.K.Consolidated Statements of Cash Flows
TOYO DENKI SEIZO K.K.Notes to Consolidated Financial Statements
37 Toyo Denki Seizo Report 2017 38

(g) Property, plant and equipment (except for leased assets) and depreciationDepreciation of property, plant and equipment of the Company and its consolidated subsidiaries is calculated principally by the declining-balance method based on the estimated useful lives and the residual value, while buildings except for facilities attached to buildings acquired on or after April 1, 1998 and facilities attached to buildings and structures acquired on or after June 1, 2016 are depreciated by the straight-line method. The estimated useful lives of these assets are as follows:
Buildings and structures: 8 to 60 yearsMachinery and vehicles: 3 to 12 years
Significant renewals and additions are capitalized at cost. Maintenance and repairs are charged to income.
(h) Intangible assets (except for leased assets)Intangible assets are amortized using the straight-line method. Software for internal use is amortized over the internal available period (5 years) using the straight-line method.
(i) LeasesLeased assets capitalized under the finance lease arrangements which do not transfer ownership to the lessee are depreciated over the lease period without any residual value using the straight-line method.
All other lease transactions are accounted for as operating leases and related payments are charged to income as incurred.
(j) Allowance for doubtful accountsAllowance for doubtful accounts is provided based on past experience for normal receivables and on an estimate of the collectability of receivables from companies in financial difficulty.
(k) Accrued directors’ bonusesAccrued directors’ bonuses are provided to cover the current fiscal year’s portion of the estimated amounts to be paid in future for the performance incentive bonuses.
(l) Accrued employees’ bonusesAccrued employees’ bonuses are provided to cover the current fiscal year’s portion of the estimated amounts to be paid in future.
(m) Reserve for losses on order acknowledgementsReserve for losses on order acknowledgements is provided based on the amounts expected to be incurred during the current fiscal year and which are able to estimate the losses reasonably to cover the future losses on order acknowledgements. Provision of reserve for losses on order acknowledgements in the amounts of ¥70 million ($628 thousand) and ¥1 million is included in cost of sales for the years ended May 31, 2017 and 2016, respectively.
(n) Retirement benefitsRetirement benefit obligation is attributed to each period by the benefit formula method over the estimated years of service of the eligible employees.
Prior service cost is amortized as incurred by the straight-line method over a fixed period (10 years) within the average remaining years of service of the employees.
Actuarial differences are amortized in the year following the year in which gain or loss is recognized primarily by the straight-line method over a fixed period (10 years) within the average remaining years of service of the employees.
(o) Income taxesDeferred tax assets and liabilities have been recognized in the consolidated financial statements with respect to the differences between the financial reporting and tax bases of the assets and liabilities, and were measured using the enacted tax rates and laws which will be in effect when the differences are expected to reverse.
(p) Construction revenue and costsConstruction revenue and construction costs are recognized by the percentage-of-completion method, if the outcome of a construction contract can be estimated reliably. The percentage of completion is measured based on the percentage of the costs incurred to the estimated total costs. For other construction contracts, the completed-contract method is applied.
(q) Research and development expensesResearch and development expenses are charged to income when incurred.
(r) Consumption taxesTransactions subject to consumption taxes are recorded at amounts exclusive of consumption taxes.
(s) Derivative financial instrumentsThe Company and certain consolidated subsidiaries enter into various derivative transactions in order to manage certain risks arising from adverse fluctuations in interest rates. Derivative financial instruments are carried at fair value with changes in unrealized gain or loss charged or credited to operations, except for these which meet the criteria for deferred hedge accounting under which unrealized gain or loss is deferred as a component of net assets.
Deferred hedge accounting is adopted for derivatives which qualify as hedges, under which unrealized gain or loss is deferred. Hedging instruments are derivative transactions and hedged items are primarily interest on debts. Hedge effectiveness is not assessed if the substantial terms and conditions of the hedging instruments and the hedged items are the same.
2. Accounting ChangesThe Company and its consolidated subsidiaries in Japan has applied “Practical Solution on a Change in Depreciation Method due to Tax Reform 2016” (ASBJ PITF No. 32, June 17, 2016) effective June 1, 2016 and changed the depreciation method for facilities attached to buildings and structures acquired on or after June 1, 2016 from the declining-balance method to the straight-line method.
The effect on the operating income and income before income taxes for the year ended May 31, 2017 is immaterial.
3. Additional InformationThe Company and its consolidated subsidiaries in Japan applied “Revised Implementation Guidance on Recoverability of Deferred Tax Assets” (ASBJ Guidance No. 26, March 28, 2016) from the fiscal year ended May 31, 2017.
4. U.S. Dollar AmountsThe accompanying consolidated financial statements are expressed in yen, and solely for the convenience of the reader, have been translated into U.S. dollars at the rate of ¥110.96=U.S.$1, the approximate rate of exchange prevailing at May 31, 2017. This translation should not be construed as a representation that all amounts shown could be converted into U.S. dollars at such rate.
5. InventoriesInventories as of May 31, 2017 and 2016 were as follows:
As ofMay 31,
2017May 31,
2016May 31,
2017(Millions of yen) (Thousands of
U.S. dollars)
Merchandise and finished products ¥ 871 ¥1,491 $ 7,849Work in process 3,373 3,172 30,402Raw materials and supplies 2,235 2,657 20,140
¥6,479 ¥7,320 $58,391Inventories are stated at the lower of cost or market and the Company recognized losses on write-down of inventories held for the
ordinary sales purpose due to a decline in profitability in the amount of ¥11 million ($103 thousand) and ¥(205) million for the years ended May 31, 2017 and 2016, respectively. These amounts were included in “Cost of sales.”
Inventories related to construction contracts which are estimated to make losses are stated after deducting the corresponding reserve for losses on order acknowledgements in the following amounts:
As ofMay 31,
2017May 31,
2016May 31,
2017(Millions of yen) (Thousands of
U.S. dollars)
Merchandise and finished products ¥46 ¥ 4 $413Work in process 41 68 375
¥87 ¥72 $788
39 Toyo Denki Seizo Report 2017 40

6. Property, Plant and EquipmentThe following table sets forth the acquisition costs and related accumulated depreciation:
As ofMay 31,
2017May 31,
2016May 31,
2017(Millions of yen) (Thousands of
U.S. dollars)
Buildings and structures ¥ 7,416 ¥ 7,172 $ 66,830Machinery and vehicles 7,030 6,729 63,359Other 3,364 3,281 30,313
17,810 17,182 160,502Accumulated depreciation (13,870) (13,380) (124,998)
¥ 3,940 ¥ 3,802 $ 35,504
Depreciation of property, plant and equipment for the years ended May 31, 2017 and 2016 were as follows:
For the Years EndedMay 31,
2017May 31,
2016May 31,
2017(Millions of yen) (Thousands of
U.S. dollars)
¥802 ¥851 $7,228Accumulated depreciation of property, plant and equipment amounted to ¥13,870 million ($124,998 thousand) and ¥13,380
million as of May 31, 2017 and 2016, respectively.
7. Investments and Other AssetsInvestments in unconsolidated subsidiaries and affiliates included in “Investment securities” as of May 31, 2017 and 2016 were as follows:
As ofMay 31,
2017May 31,
2016May 31,
2017(Millions of yen) (Thousands of
U.S. dollars)
Investments in capital ¥1,345 ¥1,390 $12,121
8. Short-Term Borrowings and Long-Term DebtAs of May 31, 2017 and 2016, short-term borrowings and the current portion of long-term debt consisted of the following:
As ofMay 31,
2017May 31,
2016May 31,
2017(Millions of yen) (Thousands of
U.S. dollars)
Loans, principally from banks ¥ 968 ¥ 666 $ 8,721Current portion of long-term debt 4,002 352 36,067
¥4,970 ¥1,018 $44,788The annual weighted average interest rates applicable to short-term borrowings and current-portion of long-term debt as of May
31, 2017 were 1.831% and 1.215%, respectively.
As of May 31, 2017 and 2016, long-term debts were as follows:
As ofMay 31,
2017May 31,
2016May 31,
2017(Millions of yen) (Thousands of
U.S. dollars)
Long-term debt, excluding current portion, serially due from 2018 through 2032 ¥6,786 ¥7,288 $61,157The annual weighted average interest rate applicable to long-term debt as of May 31, 2017 was 0.995%.
The maturities of long-term debt are summarized as follows:
Years ended May 31 (Millions of yen) (Thousands of U.S. dollars)
2018 ¥ 4,002 $36,0672019 3,356 30,2442020 420 3,7822021 379 3,4212022 and thereafter 2,631 23,710
¥10,788 $97,224
The assets pledged as collateral for short-term borrowings of ¥960 million ($8,649 thousand) and long-term debt of ¥4,676 million ($42,141 thousand) as of May 31, 2017 were as follows:
As of May 31 (Millions of yen) (Thousands of U.S. dollars)
Buildings and structures ¥1,759 $15,852Machinery and vehicles 612 5,515Other property, plant and equipment 346 3,118Land 1,215 10,949
¥3,932 $35,434
The following assets included in the above are set by factory foundation fixed collateral security:
As of May 31 (Millions of yen) (Thousands of U.S. dollars)
Buildings and structures ¥1,759 $15,852Machinery and vehicles 612 5,515Other property, plant and equipment 346 3,118
¥2,717 $24,485
9. Retirement Benefit PlansThe Company and its consolidated subsidiaries have retirement benefit plans combined by defined contribution plans and lump-sum payment plans.
The Company and its consolidated subsidiaries introduced the point system in the lump-sum payment plans, under which retirement benefit amounts are computed based on the accumulated points granted according to the job ranking and performances.
Under the lump-sum payment plans held by certain consolidated subsidiaries, the liability for retirement benefits and retirement benefit expenses are calculated using a simplified method.
The changes in the retirement benefit obligation during the years ended May 31, 2017 and 2016 are as follows:
For the Years EndedMay 31,
2017May 31,
2016May 31,
2017(Millions of yen) (Thousands of
U.S. dollars)
Retirement benefit obligation as of June 1 ¥3,853 ¥3,726 $34,720Service cost 284 287 2,556Interest cost 15 14 133Actuarial loss (1) 10 (0)Retirement benefits paid (238) (184) (2,142)
Retirement benefit obligation as of May 31 ¥3,913 ¥3,853 $35,267
41 Toyo Denki Seizo Report 2017 42

The following table sets forth the funded status of the plans and the amounts recognized in the consolidated balance sheets as of May 31, 2017 and 2016 for the Company’s and the consolidated subsidiaries’ defined benefit plans:
As ofMay 31,
2017May 31,
2016May 31,
2017(Millions of yen) (Thousands of
U.S. dollars)
Unfunded retirement benefit obligation ¥3,913 ¥3,853 $35,267Net liability (asset) for retirement benefits on the consolidated balance sheets 3,913 3,853 35,267
Liability for retirement benefits ¥3,913 ¥3,853 $35,267Net liability (asset) for retirement benefits on the consolidated balance sheets 3,913 3,853 35,267Note: The plan adopting the simplified method is included.
The components of retirement benefit expenses for the years ended May 31, 2017 and 2016 are as follows:
For the Years EndedMay 31,
2017May 31,
2016May 31,
2017(Millions of yen) (Thousands of
U.S. dollars)
Service cost ¥284 ¥287 $2,556Interest cost 15 14 133Amortization of actuarial loss 73 70 663Retirement benefit expenses ¥372 ¥371 $3,352
Retirement benefits liability adjustments included in other comprehensive income (before tax effect) as of May 31, 2017 and 2016 are as follows:
As ofMay 31,
2017May 31,
2016May 31,
2017(Millions of yen) (Thousands of
U.S. dollars)
Actuarial gain ¥74 ¥60 $663Total ¥74 ¥60 $663
Retirement benefits liability adjustments included in accumulated other comprehensive income (before tax effect) as of May 31, 2017 and 2016 are as follows:
As ofMay 31,
2017May 31,
2016May 31,
2017(Millions of yen) (Thousands of
U.S. dollars)
Unrecognized actuarial gain ¥434 ¥507 $3,909Total ¥434 ¥507 $3,909
Major actuarial assumptions (weighted average) used in accounting for the above plans as of May 31, 2017 and 2016 were as follows:
For the Years EndedMay 31,
2017May 31,
2016Discount rate 0.4% 0.4%Note: The Company does not use the expected rate of salary increase in computing retirement benefit obligation since the Company adopts the point system.
The amounts of the required contribution to the defined contribution plans of the Company and its consolidated subsidiaries were ¥117 million ($1,057 thousand) and ¥115 million for the years ended May 31, 2017 and 2016, respectively.
10. Net AssetsInformation regarding changes in net assets for the years ended May 31, 2017 and 2016 is as follows:
a. Shares issued and outstanding/ Treasury stock
For the year ended May 31, 2017
Type of shares
Number of shares as ofJune 1, 2016 Increase Decrease
Number of shares as of
May 31, 2017(Shares)
Shares issued:Common stock 48,675,000 — 38,940,000 9,735,000
Treasury stock:Common stock 493,478 956,297 1,159,206 290,569
Notes: 1. The Company implemented a share consolidation of 5 shares of common stock into 1 share of common stock on December 1, 2016.2. The decrease in the number of shares of common stock issued is due to the share consolidation.
Details of the changes in common stock under treasury stock are as the following:Increase due to purchase of shares of less than standard unit before the share consolidation: 3,529 sharesIncrease due to purchase of shares of less than standard unit after the share consolidation: 768 sharesIncrease due to purchase of treasury stock based on the resolution of the Board of Directors’ meeting: 952,000 sharesDecrease is due to the share consolidation.
For the year ended May 31, 2016
Type of shares
Number of shares as ofJune 1, 2015 Increase Decrease
Number of shares as of
May 31, 2016(Shares)
Shares issued:Common stock 48,675,000 — — 48,675,000
Treasury stock:Common stock 484,737 8,741 — 493,478
Note: Detail of the increase is as the following:
Increase due to purchase of shares of less than standard unit 8,741 shares
b. Dividends
1) Dividends paid
For the year ended May 31, 2017
Resolution Type of shares
Total dividends (Millions of
yen)
Total dividends (Thousands of U.S. dollars)
Dividends per share (Yen)
Dividends per share (U.S.
dollars) Cut-off date Effective dateAnnual general meeting
of the shareholders on August 26, 2016 Common stock ¥289 $2,605 ¥6.00 $0.05 May 31, 2016 August 29, 2016
For the year ended May 31, 2016
Resolution Type of shares
Total dividends (Millions of
yen)Dividends per share (Yen) Cut-off date Effective date
Annual general meeting of the shareholders on August 27, 2015 Common stock ¥289 ¥6.00 May 31, 2015 August 28, 2015
43 Toyo Denki Seizo Report 2017 44

2) Dividends with the cut-off date in the year ended May 31, 2017 and the effective date in the year ending May 31, 2018
Resolution Type of shares
Total dividends
(Millions of yen)
Total dividends (Thousands of U.S. dollars)
Source of dividends
Dividends per share (Yen)
Dividends per share (U.S.
dollars) Cut-off date Effective dateAnnual general meeting
of the shareholders on August 29, 2017
Common stock ¥283 $2,553
Retained earnings ¥30.00 $0.27
May 31, 2017
August 30, 2017
11. Selling, General and Administrative ExpensesThe main components of “Selling, general and administrative expenses” for the years ended May 31, 2017 and 2016 were as follows:
For the Years EndedMay 31,
2017May 31,
2016May 31,
2017(Millions of yen) (Thousands of
U.S. dollars)
Salaries and allowances ¥1,975 ¥1,966 $17,801Provision for accrued directors’ bonuses 33 37 299Provision for accrued employees’ bonuses 404 392 3,640Retirement benefit expenses 217 196 1,960Provision for allowance for doubtful accounts (1) (37) (10)Research and development expenses 927 868 8,358
12. Special Gains (Losses), NetThe components of “Special gains (losses), net” for the years ended May 31, 2017 and 2016 were as follows:
For the Years EndedMay 31,
2017May 31,
2016May 31,
2017(Millions of yen) (Thousands of
U.S. dollars)Special gains:
Gain on sales of investment securities ¥ 67 ¥ — $ 607Special losses:
Loss on sales of property, plant and equipment (23) — (211)Removal expenses for property, plant and equipment — (72) —Loss on sales of investment securities — (12) —Other — (4) —
Total ¥ 44 ¥(88) $ 396
13. Income TaxesIncome taxes in Japan applicable to the Company and its domestic consolidated subsidiaries consist of corporation tax, inhabitants’ taxes and enterprise tax, which, in the aggregate, resulted in a statutory rate of approximately 30.9% and 33.1% for the years ended May 31, 2017 and 2016, respectively. Income taxes of a foreign consolidated subsidiary are based generally on the tax rates applicable in the country of incorporation.
The reconciliation between the effective tax rates reflected in the consolidated statements of income and the effective statutory tax rate for the year ended May 31, 2017 is omitted since the difference was less than 5% of the effective statutory tax rate.
The reconciliation between the effective tax rates reflected in the consolidated statements of income and the effective statutory tax rate for the year ended May 31, 2016 was as follows:
For the Year EndedMay 31,
2016Effective statutory tax rate 33.1%
Effect of:Non-deductible expenses for income tax purpose 2.0Non-taxable income such as dividends income, etc. (1.1)Per capita inhabitant tax 1.9Valuation allowance (11.4)Income from affiliates accounted for by the equity method (1.8)Unrecognized tax benefits from losses of subsidiaries 7.0Effect of income tax rate change 5.6Other 1.4
Effective tax rate 36.7%
The significant components of deferred tax assets and liabilities as of May 31, 2017 and 2016 were as follows:
As ofMay 31,
2017May 31,
2016May 31,
2017(Millions of yen) (Thousands of
U.S. dollars)
Deferred tax assets:Write-down of inventories ¥ 165 ¥ 153 $ 1,491Liability for retirement benefits 1,204 1,186 10,854Accrued employees’ bonuses 301 292 2,709Reserve for losses on order acknowledgements 115 105 1,035Tax loss carryforwards 387 312 3,491Other 431 448 3,884
Total gross deferred tax assets 2,603 2,496 23,464Valuation allowance (703) (684) (6,339)Total deferred tax assets 1,900 1,812 17,125Deferred tax liabilities:
Unrealized holding gain on securities (3,049) (2,857) (27,478)Other (1) (19) (6)
Total deferred tax liabilities (3,050) (2,876) (27,484)Net deferred tax liabilities ¥(1,150) ¥(1,064) $(10,359)
45 Toyo Denki Seizo Report 2017 46

14. Other Comprehensive Income (Loss)The following table presents reclassification adjustments and tax effects allocated to each component of other comprehensive income (loss) for the years ended May 31, 2017 and 2016:
For the Years EndedMay 31,
2017May 31,
2016May 31,
2017(Millions of yen) (Thousands of
U.S. dollars)
Unrealized holding gain (loss) on securities:Amount arising during the year ¥ 669 ¥(2,921) $ 6,032Reclassification adjustments for gains and losses included in net income (67) 11 (607)
Amount before tax effect 602 (2,910) 5,425Tax effect (192) 1,062 (1,729)Unrealized holding gain (loss) on securities 410 (1,848) 3,696
Translation adjustmentsAmount arising during the year (12) 49 (106)
Amount before tax effect (12) 49 (106)Translation adjustments (12) 49 (106)
Retirement benefits liability adjustmentsAmount arising during the year 0 (10) 0Reclassification adjustments for gains and losses included in net income 74 70 663
Amount before tax effect 74 60 663Tax effect (23) (28) (204)Retirement benefits liability adjustments 51 32 459
Share of other comprehensive loss of affiliates accounted for by the equity methodAmount arising during the year (109) (48) (989)
Share of other comprehensive income (loss) of affiliates accounted for by the equity method (109) (48) (989)
Total other comprehensive income (loss) ¥ 340 ¥(1,815) $ 3,060
15. Lease TransactionsThe information about finance leases that do not transfer ownership of the leased property to the lessee is omitted since there is no materiality in terms of value.
16. Contingent LiabilitiesAs of May 31, 2017 and 2016, the Company was committed to provide guarantees on bank borrowings of the following affiliates:
As ofMay 31,
2017May 31,
2016May 31,
2017(Millions of yen) (Thousands of
U.S. dollars)
Hunan Xiangyang Electric Co., Ltd. ¥ — ¥ 30 $ —Changzhou Ruiyang Transmission Technology Co., Ltd. 164 169 1,475Beijing Jingche Shuangyang Traction Co., Ltd. 49 — 440
17. Amounts Per Share
For the Years EndedMay 31,
2017May 31,
2016May 31,
2017(Yen) (U.S. dollars)
Net income:Basic ¥123.87 ¥92.33 $1.12
As ofMay 31,
2017May 31,
2016May 31,
2017(Yen) (U.S. dollars)
Net assets ¥2,605.09 ¥2,457.05 $23.48Notes: 1. Diluted net income per share is omitted since there is no dilution of equity.
2. The Company implemented a share consolidation of 5 shares of common stock into 1 share of common stock on December 1, 2016. Accordingly, above amounts per share are computed as if the share consolidation had been implemented at the beginning of the fiscal year ended May 31, 2016.
The bases for calculation are as follows:
Basic net income per share
For the Years EndedMay 31,
2017May 31,
2016May 31,
2017(Millions of yen) (Thousands of
U.S. dollars)
Net income attributable to owners of the parent ¥1,174 ¥890 $10,582Net income not attributable to common shareholders — — —Net income attributable to owners of the parent related to common stock 1,174 890 10,582
(Thousand shares)
Average number of shares of common stock during the year 9,479 9,636
18. Financial Instruments
Overview
(1) Policy for financial instrumentsThe Group raises its necessary funds for capital investments to reinforce and renew production facilities and working capital principally through bank borrowings. The Group manages temporary cash surpluses through low risk financial assets. The Group uses derivatives in order to avoid the following risks and does not enter into derivatives for speculative or trading purposes.
(2) Types of financial instruments and related riskTrade receivables—trade notes and accounts receivable and electronically recorded receivables—are exposed to credit risk in relation to customers. Trade receivables denominated in foreign currencies arising from international business are exposed to foreign exchange fluctuation risk, but the Group utilizes forward foreign exchange contracts to reduce such risk as a hedging instrument.
Investment securities are composed of mainly the shares of common stock of other companies with which the Group has business relationships and exposed to market risk.
Certain long-term debt raised for the purpose of making capital investments with variable interest rates is exposed to interest rate fluctuation risk. However, to reduce such risk and fix interest expense for long-term debt bearing interest at variable rates, the Group utilizes interest rate swap transactions as a hedging instrument.
Regarding hedging instruments and hedged items in hedge accounting, hedging policy, and assessment of the effectiveness of hedging activities, etc., please see Note 1(s) “Derivative financial instruments.”
47 Toyo Denki Seizo Report 2017 48

(3) Risk management for financial instruments(a) Monitoring of credit risk (the risk that customers or counterparties may default)In accordance with the internal policies of the Group for managing credit risk arising from receivables, each related division monitors credit worthiness of their main customers periodically, and monitors due dates and outstanding balances by individual customer. In addition, the Group is making efforts to identify and mitigate risks of bad debts from customers who are having financial difficulties.
Investment securities are composed of mainly the shares of common stock of highly rated companies with which the Group has business relationships. Accordingly, the Group believes that the credit risk deriving from such investment securities is insignificant.
The Group also believes that the credit risk of derivatives is insignificant as it enters into derivative transactions only with financial institutions which have a sound credit profile.
(b) Monitoring of market risks (the risk arising from fluctuations in foreign exchange rates, interest rates and others)The Group utilizes interest rate swap transactions to reduce interest rate fluctuation risk on long-term debt.
For investment securities, the Group periodically reviews the fair values of such financial instruments and the financial position of the issuers.
In conducting derivative transactions, the division in charge of each derivative transaction follows the internal policies, which set forth delegation of authority and maximum upper limit on positions. Monthly reports including actual transactions data are submitted to the Board of Directors for their review.
(c) Monitoring of liquidation risk (the risk that the Group may not be able to meet its obligations on scheduled due dates)Based on the report from each division, the Group prepares and updates its cash flow plans on a timely basis to manage liquidation risk.
(4) Supplementary explanation of the estimated fair value of financial instrumentsThe fair value of financial instruments is based on their quoted market price, if available. When there is no quoted market price available, fair value is reasonably estimated. Since various assumptions and factors are reflected in estimating the fair value, different assumptions and factors could result in different fair value. In addition, the notional amounts of derivatives in Note 21, Derivative Transactions are not necessarily indicative of the actual market risk involved in derivative transactions.
Estimated Fair value of Financial Instruments
Carrying value of financial instruments on the consolidated balance sheets as of May 31, 2017 and 2016 and estimated fair value are shown in the following table. The following table does not include financial instruments for which it is extremely difficult to determine the fair value (Please refer to Note 2 below):
As of May 31, 2017 Carrying value Fair value Difference(Millions of yen)
Assets1) Cash on hand and in banks ¥ 2,091 ¥ 2,091 ¥—2) Trade notes and accounts receivable 15,831 15,831 —3) Electronically recorded receivables 532 532 —4) Investment securities 17,209 17,209 —Total assets ¥35,663 ¥35,663 ¥—Liabilities5) Trade notes and accounts payable ¥ 3,347 ¥ 3,347 ¥—6) Electronically recorded payables 5,489 5,489 —7) Short-term borrowings 968 968 —8) Long-term debt 10,788 10,803 15Total liabilities ¥20,592 ¥20,607 ¥ 159) Derivative transactions* ¥ — ¥ — ¥—
As of May 31, 2017 Carrying value Fair value Difference(Thousands of U.S. dollars)
Assets1) Cash on hand and in banks $ 18,846 $ 18,846 $ —2) Trade notes and accounts receivable 142,673 142,673 —3) Electronically recorded receivables 4,792 4,792 —4) Investment securities 155,089 155,089 —Total assets $321,400 $321,400 $ —Liabilities5) Trade notes and accounts payable $ 30,161 $ 30,161 $ —6) Electronically recorded payables 49,468 49,468 —7) Short-term borrowings 8,721 8,721 —8) Long-term debt 97,224 97,361 137Total liabilities $185,574 $185,711 $1379) Derivative transactions* $ — $ — $ —*Derivative transactions are presented in a net amount of receivables and payables and net payables are shown in parenthesis.
As of May 31, 2016 Carrying value Fair value Difference(Millions of yen)
Assets1) Cash on hand and in banks ¥ 2,401 ¥ 2,401 ¥ —2) Trade notes and accounts receivable 13,790 13,790 —3) Electronically recorded receivables 966 966 —4) Investment securities 16,757 16,757 —Total assets ¥33,914 ¥33,914 ¥ —Liabilities5) Trade notes and accounts payable ¥ 3,743 ¥ 3,743 ¥ —6) Electronically recorded payables 5,278 5,278 —7) Short-term borrowings 666 666 —8) Long-term debt 7,640 7,724 84Total liabilities ¥17,327 ¥17,411 ¥ 849) Derivative transactions* ¥ 43 ¥ 43 ¥ —*Derivative transactions are presented in a net amount of receivables and payables and net payables are shown in parenthesis
Notes:1. Methods to determine the estimated fair value of financial instruments and other matters related to securities and derivative transactions
Assets:Cash on hand and in banks, trade notes and accounts receivable and electronically recorded receivablesSince these items are settled in a short period of time, their carrying value approximates fair value.However, if they are settled in a long period of time, the fair value of receivables is based on the present value of the receivables classified by definite periods discounted using interest rates on the corresponding period until settlement.
Investment securitiesThe fair value of stocks is based on quoted market prices. Investment securities held by the Group are classified as available-for-sale securities and please see Note 19 “Securities.”
Liabilities:Trade notes and accounts payable, electronically recorded payables and short-term borrowingsSince these items are settled in a short period of time, their carrying value approximates fair value.
Long-term debtThe fair value of long-term debt is based on the present value of the total of principal and interest discounted by the interest rate to be applied if similar new borrowings were entered into. The fair value of long-term debt with variable interest rates, which is hedged by the interest rate swaps and to which hedge accounting is applied (refer to the following paragraph), is based on the present value of the total of principal and interest discounted by the interest rate to be applied if similar new borrowings were entered into.
Derivative transactionsThe fair value of interest rate swaps accounted for by the hedge accounting is included in the fair value of the related long-term debt, since such interest rate swaps are accounted for together with long-term debt as hedged items. The fair value of interest rate swaps accounted for by the normal method is determined based on the price, etc. provided by the financial institutions.
49 Toyo Denki Seizo Report 2017 50
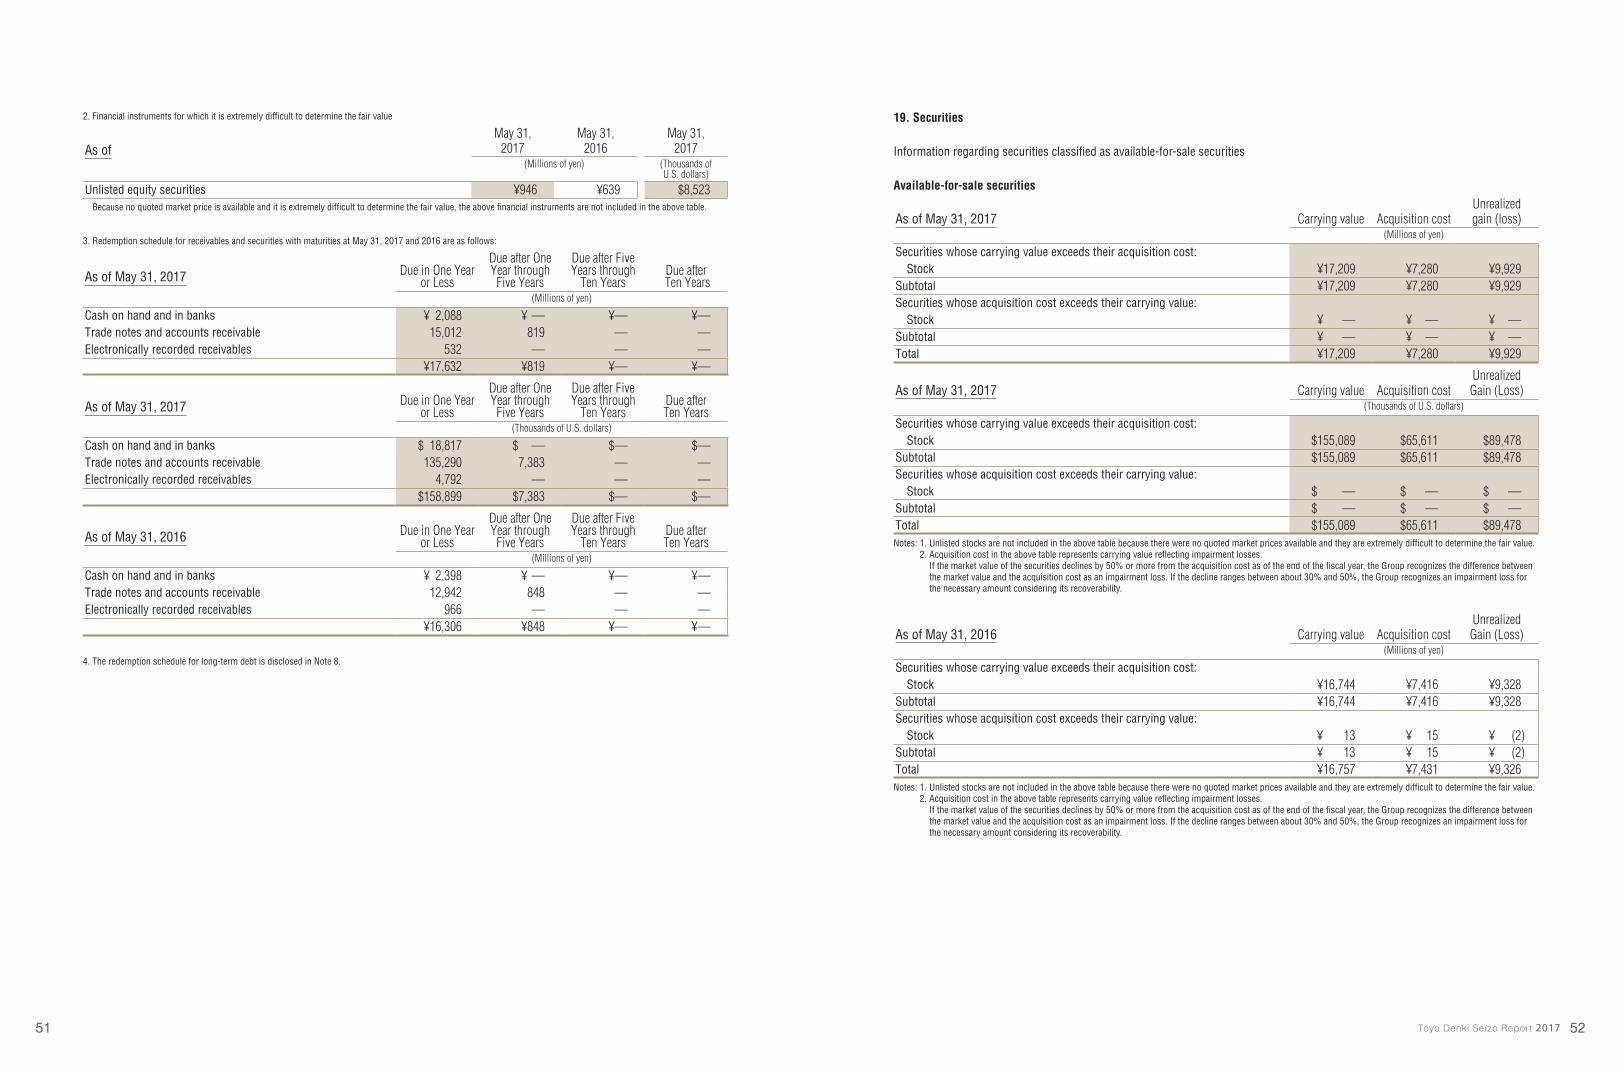
2. Financial instruments for which it is extremely difficult to determine the fair value
As ofMay 31,
2017May 31,
2016May 31,
2017(Millions of yen) (Thousands of
U.S. dollars)
Unlisted equity securities ¥946 ¥639 $8,523Because no quoted market price is available and it is extremely difficult to determine the fair value, the above financial instruments are not included in the above table.
3. Redemption schedule for receivables and securities with maturities at May 31, 2017 and 2016 are as follows:
As of May 31, 2017 Due in One Year or Less
Due after One Year through Five Years
Due after Five Years through
Ten YearsDue after
Ten Years(Millions of yen)
Cash on hand and in banks ¥ 2,088 ¥ — ¥— ¥—Trade notes and accounts receivable 15,012 819 — —Electronically recorded receivables 532 — — —
¥17,632 ¥819 ¥— ¥—
As of May 31, 2017 Due in One Year or Less
Due after One Year through Five Years
Due after Five Years through
Ten YearsDue afterTen Years
(Thousands of U.S. dollars)
Cash on hand and in banks $ 18,817 $ — $— $—Trade notes and accounts receivable 135,290 7,383 — —Electronically recorded receivables 4,792 — — —
$158,899 $7,383 $— $—
As of May 31, 2016 Due in One Year or Less
Due after One Year through Five Years
Due after Five Years through
Ten YearsDue afterTen Years
(Millions of yen)
Cash on hand and in banks ¥ 2,398 ¥ — ¥— ¥—Trade notes and accounts receivable 12,942 848 — —Electronically recorded receivables 966 — — —
¥16,306 ¥848 ¥— ¥—
4. The redemption schedule for long-term debt is disclosed in Note 8.
19. Securities
Information regarding securities classified as available-for-sale securities
Available-for-sale securities
As of May 31, 2017 Carrying value Acquisition costUnrealized gain (loss)
(Millions of yen)
Securities whose carrying value exceeds their acquisition cost:Stock ¥17,209 ¥7,280 ¥9,929
Subtotal ¥17,209 ¥7,280 ¥9,929Securities whose acquisition cost exceeds their carrying value:
Stock ¥ — ¥ — ¥ —Subtotal ¥ — ¥ — ¥ —Total ¥17,209 ¥7,280 ¥9,929
As of May 31, 2017 Carrying value Acquisition costUnrealized Gain (Loss)
(Thousands of U.S. dollars)
Securities whose carrying value exceeds their acquisition cost:Stock $155,089 $65,611 $89,478
Subtotal $155,089 $65,611 $89,478Securities whose acquisition cost exceeds their carrying value:
Stock $ — $ — $ —Subtotal $ — $ — $ —Total $155,089 $65,611 $89,478Notes: 1. Unlisted stocks are not included in the above table because there were no quoted market prices available and they are extremely difficult to determine the fair value.
2. Acquisition cost in the above table represents carrying value reflecting impairment losses.If the market value of the securities declines by 50% or more from the acquisition cost as of the end of the fiscal year, the Group recognizes the difference between the market value and the acquisition cost as an impairment loss. If the decline ranges between about 30% and 50%, the Group recognizes an impairment loss for the necessary amount considering its recoverability.
As of May 31, 2016 Carrying value Acquisition costUnrealized Gain (Loss)
(Millions of yen)
Securities whose carrying value exceeds their acquisition cost:Stock ¥16,744 ¥7,416 ¥9,328
Subtotal ¥16,744 ¥7,416 ¥9,328Securities whose acquisition cost exceeds their carrying value:
Stock ¥ 13 ¥ 15 ¥ (2)Subtotal ¥ 13 ¥ 15 ¥ (2)Total ¥16,757 ¥7,431 ¥9,326Notes: 1. Unlisted stocks are not included in the above table because there were no quoted market prices available and they are extremely difficult to determine the fair value.
2. Acquisition cost in the above table represents carrying value reflecting impairment losses.If the market value of the securities declines by 50% or more from the acquisition cost as of the end of the fiscal year, the Group recognizes the difference between the market value and the acquisition cost as an impairment loss. If the decline ranges between about 30% and 50%, the Group recognizes an impairment loss for the necessary amount considering its recoverability.
51 Toyo Denki Seizo Report 2017 52

Information regarding available-for-sale securities sold
For the Years EndedMay 31,
2017May 31,
2016May 31,
2017(Millions of yen) (Thousands of
U.S. dollars)Stock:Sales proceeds ¥232 ¥ 19 $2,090Gain on sales 67 — 607Loss on sales — 12 —
20. Supplementary Cash Flow InformationCash and cash equivalents in the consolidated statements of cash flows for the years ended May 31, 2017 and 2016 are reconciled to cash on hand and in banks in the consolidated balance sheets as follows:
As ofMay 31,
2017May 31,
2016May 31,
2017(Millions of yen) (Thousands of
U.S. dollars)
Cash on hand and in banks ¥2,091 ¥2,401 $18,846Cash and cash equivalents ¥2,091 ¥2,401 $18,846
21. Derivative Transactions
Hedging policies
The Company utilizes forward foreign exchange contracts and interest rate swaps for the purpose of hedging its exposure to fluctuations in foreign exchange rates and interest rates, respectively. However, based on internal management rules on financial market risk approved by the Company’s Board of Directors, Group companies do not enter into transactions involving derivatives for speculative or trading purposes.
Types and purpose of derivative transactions
The Company primarily uses forward foreign exchange contracts to hedge against the fluctuations in foreign currency exchange rates on trade receivables denominated in foreign currencies and interest rate swaps to hedge against the adverse impact of fluctuations in interest rates on interest-bearing debt.
Derivative transactions to which hedge accounting is not applied:
Currency-related derivatives:
As of May 31, 2017, there were no currency-related derivatives.
As of May 31, 2016 Contract amountMaturing after
one year Fair valueUnrealized gain
(loss)(Millions of yen)
Forward foreign exchange contracts:Sold:
USD ¥486 ¥— ¥43 ¥43Note: Fair value is determined based on the forward foreign exchange rate.
Derivative transactions to which hedge accounting is applied:
Interest-related derivatives:
Notional amount
As of May 31, 2017 Major hedged item Contract amount
Maturing after one year Fair value
(Millions of yen)
Interest rate swaps accounted for by the exceptional method:Receive/floating and pay/fixed Long-term debt ¥7,128 ¥3,216 Note
Notional amount
As of May 31, 2017 Major hedged item Contract amount
Maturing after one year Fair value
(Thousands of U.S. dollars)
Interest rate swaps accounted for by the exceptional method: Receive/floating and pay/fixed Long-term debt $64,239 $28,983 Note
Note: Interest rate swaps which qualify for hedge accounting and meet specific matching criteria are not remeasured at market value, but the differential paid or received under the swap agreement is recognized and included in interest expenses. Accordingly, the fair value of interest rate swaps is included in the fair value of long-term debt. The notional amount of long-term debt includes current portion of long-term debt.
Notional amount
As of May 31, 2016 Major hedged item Contract amount
Maturing after one year Fair value
(Millions of yen)
Interest rate swaps accounted for by the exceptional method: Receive/floating and pay/fixed Long-term debt ¥7,360 ¥7,128 Note
Note: Interest rate swaps which qualify for hedge accounting and meet specific matching criteria are not remeasured at market value, but the differential paid or received under the swap agreement is recognized and included in interest expenses. Accordingly, the fair value of interest rate swaps is included in the fair value of long-term debt. The notional amount of long-term debt includes current portion of long-term debt.
53 Toyo Denki Seizo Report 2017 54

22. Segment InformationThe reportable segments of the Group are components for which discrete financial information is available and whose operating results are regularly reviewed by the Board of Directors to make decisions about resource allocation and to assess performance.
The Group establishes business units by product and each business unit designs domestic and overseas comprehensive strategies for its products and is developing business activities. Accordingly, the Group consists of the three reportable segments by product based on the business units, which are Transportation Systems, Industrial Systems and Information Equipment Systems.
The accounting policies of the segments are substantially same as those described in the significant accounting policies in Note 1. Segment profit is evaluated based on operating income.
Inter-segment sales are recorded at the same prices used in transactions with third parties.
For the year ended May 31, 2017Reportable segments
Other(Note)
Transportation Systems
Industrial Systems
Information Equipment Systems Total Adjustments Consolidated
(Millions of yen)Sales, profits or
losses and asset by reportable segments
Net sales:Sales to third parties ¥28,200 ¥11,073 ¥1,388 ¥ 7 ¥40,668 ¥ — ¥40,668Inter-segment sales
and transfers 38 3 — 672 713 (713) —28,238 11,076 1,388 679 41,381 (713) 40,668
Segment profit ¥ 3,079 ¥ 747 ¥ 305 ¥ 60 ¥ 4,191 ¥ (2,619) ¥ 1,572Segment assets ¥19,926 ¥11,791 ¥ 817 ¥601 ¥33,135 ¥21,793 ¥54,928
Other items:Depreciation ¥ 516 ¥ 172 ¥ 18 ¥ 1 ¥ 707 ¥ 95 ¥ 802Capital expenditures ¥ 518 ¥ 3,520 ¥ 21 ¥ 3 ¥ 4,062 ¥ 544 ¥ 4,606
For the year ended May 31, 2017Reportable segments
Other(Note)
Transportation Systems
Industrial Systems
Information Equipment Systems Total Adjustments Consolidated
(Thousands of U.S. dollars)Sales, profits or
losses and asset by reportable segments
Net sales:Sales to third parties $254,142 $ 99,795 $12,512 $ 62 $ 366,511 $ — $ 366,511Inter-segment sales
and transfers 345 28 — 6,050 6,423 (6,423) —254,487 99,823 12,512 6,112 372,934 (6,423) 366,511
Segment profit $ 27,749 $ 6,734 $ 2,747 $ 538 $ 37,768 $ (23,602) $ 14,166Segment assets $179,581 $106,258 $ 7,363 $5,415 $ 298,617 $ 196,406 $ 495,023
Other items:Depreciation $ 4,649 $ 1,547 $ 168 $ 7 $ 6,371 $ 857 $ 7,228Capital expenditures $ 4,668 $ 31,724 $ 190 $ 25 $ 36,607 $ 4,906 $ 41,513Note: “Other” represents business units which are not included in reportable segments and consists of worker dispatching service related activities, etc.
For the year ended May 31, 2016Reportable segments
Other(Note)
Transportation Systems
Industrial Systems
Information Equipment Systems Total Adjustments Consolidated
(Millions of yen)Sales, profits or
losses and asset by reportable segments
Net sales:Sales to third parties ¥26,758 ¥12,027 ¥955 ¥ 6 ¥39,746 ¥ — ¥39,746Inter-segment sales
and transfers 30 4 — 597 631 (631) —26,788 12,031 955 603 40,377 (631) 39,746
Segment profit ¥ 2,965 ¥ 1,020 ¥ 96 ¥ 31 ¥ 4,112 ¥ (2,473) ¥ 1,639Segment assets ¥19,605 ¥ 8,035 ¥587 ¥569 ¥28,796 ¥21,438 ¥50,234
Other items:Depreciation ¥ 550 ¥ 151 ¥ 20 ¥ 1 ¥ 722 ¥ 129 ¥ 851Capital expenditures ¥ 470 ¥ 126 ¥ 12 ¥ 0 ¥ 608 ¥ 295 ¥ 903Note: “Other” represents business units which are not included in reportable segments and consists of worker dispatching service related activities, etc.
Geographical information
Net sales to third parties by countries or areas grouped according to geographical classification for the years ended May 31, 2017 and 2016 are summarized as follows:
For the Years EndedMay 31,
2017May 31,
2016May 31,
2017(Millions of yen) (Thousands of
U.S. dollars)
Japan ¥27,987 ¥27,094 $252,226China 7,640 8,375 68,850Other 5,041 4,277 45,435Consolidated ¥40,668 ¥39,746 $366,511Note: Net sales information above is based on customers’ location.
Major customer information
Major customer information for the year ended May 31, 2017 is as follows:
Customer Segment(Millions of yen) (Thousands of
U.S. dollars)
Meiji Sangyo Co., Ltd. Transportation Systems ¥4,640 $41,816
Major customer information for the year ended May 31, 2016 is as follows:Customer Segment (Millions of yen)
Meiji Sangyo Co., Ltd. Transportation Systems ¥5,506
23. Significant Subsequent EventsThere were no significant subsequent events to be noted.
55 Toyo Denki Seizo Report 2017 56

20132012 2014 2015 2016FY
1,29
6
612 96
9
902
4,60
6
20132012 2014 2015 2016FY
Japan China Others Overseas net sales ratio
20132012 2014 2015 2016FY
1,14
4
1,00
0
881
850
801
20132012 2014 2015 2016FY
916
665
897
868 92
7
20132012 2014 2015 2016FY
1,06
9
3,62
1
1,51
4
1,13
5 1,50
5
20132012 2014 2015 2016FY
(1,4
57) (7
53)
(988
)
(937
)
(4,6
91)
20132012 2014 2015 2016FY
155
(1,1
99)
18
(1,3
41)
2,86
8
Net sales by region (Unit: Million yen)
Capital investment (Unit: Million yen) Depreciation and amortization (Unit: Million yen) Research and development costs (Unit: Million yen)
Cash flows from operating activities (Unit: Million yen) Cash flows from investing activities (Unit: Million yen) Cash flows from financing activities (Unit: Million yen)
FY 2012 2013 2014 2015 2016
Japan 23,340 25,398 24,547 27,094 28,006
China 5,495 7,118 11,634 8,374 5,882
Others 1,738 2,440 3,435 4,277 6,778
Total 30,575 34,957 39,617 39,746 40,668
Overseas net sales ratio
23.7% 27.3% 38.0% 32.0% 31.1%
Reference Data for Management Indices Report of Independent Auditors
57 Toyo Denki Seizo Report 2017 58
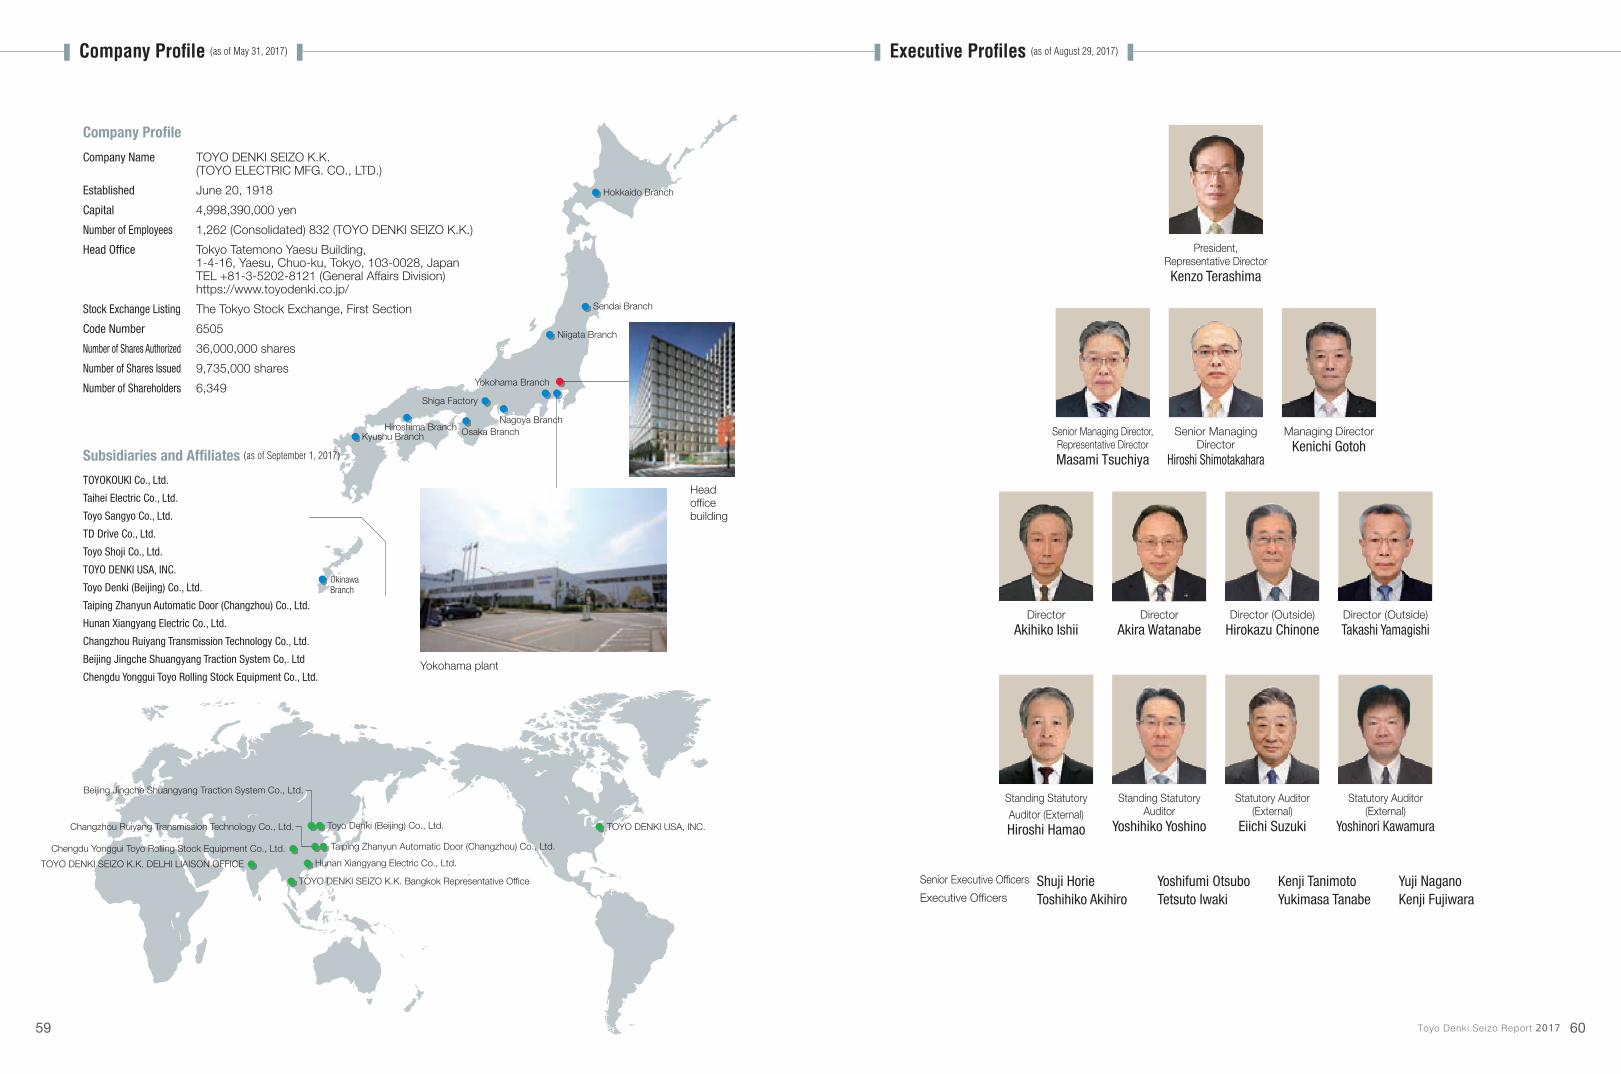
TOYO DENKI USA, INC.Toyo Denki (Beijing) Co., Ltd.Changzhou Ruiyang Transmission Technology Co., Ltd.
Taiping Zhanyun Automatic Door (Changzhou) Co., Ltd.
TOYO DENKI SEIZO K.K. DELHI LIAISON OFFICE Hunan Xiangyang Electric Co., Ltd.
TOYO DENKI SEIZO K.K. Bangkok Representative Office
Head office building
Hokkaido Branch
Sendai Branch
Niigata Branch
Yokohama Branch
Shiga Factory
Nagoya BranchOsaka BranchHiroshima Branch
Kyushu Branch
Okinawa Branch
Yokohama plant
Beijing Jingche Shuangyang Traction System Co., Ltd.
Company Profile
Company Name TOYO DENKI SEIZO K.K.(TOYO ELECTRIC MFG. CO., LTD.)
Established June 20, 1918
Capital 4,998,390,000 yen
Number of Employees 1,262 (Consolidated) 832 (TOYO DENKI SEIZO K.K.)
Head Office Tokyo Tatemono Yaesu Building,1-4-16, Yaesu, Chuo-ku, Tokyo, 103-0028, JapanTEL +81-3-5202-8121 (General Affairs Division)https://www.toyodenki.co.jp/
Stock Exchange Listing The Tokyo Stock Exchange, First Section
Code Number 6505
Number of Shares Authorized 36,000,000 shares
Number of Shares Issued 9,735,000 shares
Number of Shareholders 6,349
Subsidiaries and Affiliates (as of September 1, 2017)
TOYOKOUKI Co., Ltd.
Taihei Electric Co., Ltd.
Toyo Sangyo Co., Ltd.
TD Drive Co., Ltd.
Toyo Shoji Co., Ltd.
TOYO DENKI USA, INC.
Toyo Denki (Beijing) Co., Ltd.
Taiping Zhanyun Automatic Door (Changzhou) Co., Ltd.
Hunan Xiangyang Electric Co., Ltd.
Changzhou Ruiyang Transmission Technology Co., Ltd.
Beijing Jingche Shuangyang Traction System Co,. Ltd
Chengdu Yonggui Toyo Rolling Stock Equipment Co., Ltd.
Chengdu Yonggui Toyo Rolling Stock Equipment Co., Ltd.
President, Representative DirectorKenzo Terashima
Senior Managing Director, Representative DirectorMasami Tsuchiya
Senior Managing Director
Hiroshi Shimotakahara
Managing DirectorKenichi Gotoh
DirectorAkihiko Ishii
DirectorAkira Watanabe
Director (Outside)Hirokazu Chinone
Director (Outside)Takashi Yamagishi
Standing Statutory Auditor
Yoshihiko Yoshino
Standing Statutory Auditor (External)Hiroshi Hamao
Statutory Auditor (External)
Eiichi Suzuki
Statutory Auditor (External)
Yoshinori Kawamura
Senior Executive Officers Shuji Horie Yoshifumi Otsubo Kenji Tanimoto Yuji NaganoExecutive Officers Toshihiko Akihiro Tetsuto Iwaki Yukimasa Tanabe Kenji Fujiwara
Company Profile (as of May 31, 2017) Executive Profiles (as of August 29, 2017)
59 Toyo Denki Seizo Report 2017 60
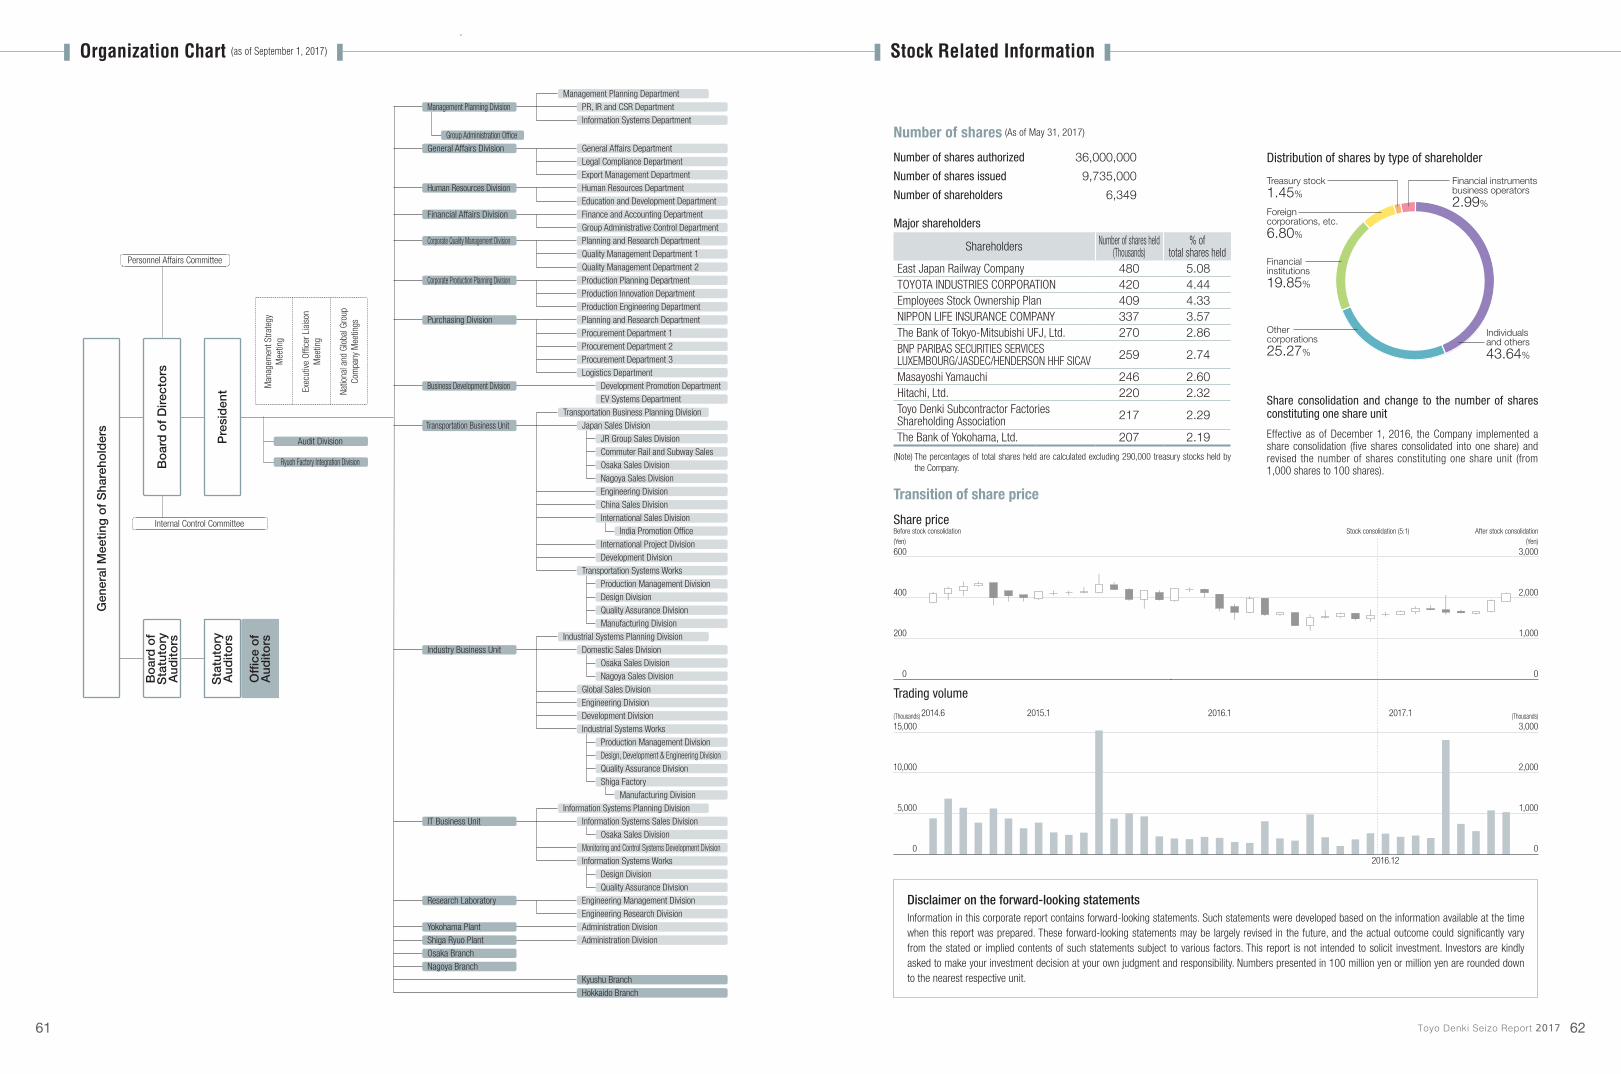
Individualsand others43.64%
Othercorporations25.27%
Foreigncorporations, etc.6.80%
Financialinstitutions19.85%
Treasury stock1.45%
Financial instrumentsbusiness operators2.99%
Number of shares (As of May 31, 2017)
0
5,000
10,000
15,000
0
1,000
2,000
3,000
0
200
400
600
0
1,000
2,000
3,000
2014.6 2015.1 2016.1 2017.1
2016.12
Before stock consolidation(Yen)
Stock consolidation (5:1) After stock consolidation(Yen)
(Thousands) (Thousands)
0
5,000
10,000
15,000
0
1,000
2,000
3,000
0
200
400
600
0
1,000
2,000
3,000
2014.6 2015.1 2016.1 2017.1
2016.12
Before stock consolidation(Yen)
Stock consolidation (5:1) After stock consolidation(Yen)
(Thousands) (Thousands)
Sta
tuto
ry
Aud
itors
Internal Control Committee
Personnel Affairs Committee
Gen
eral
Mee
ting
of
Sha
reho
lder
s
Bo
ard
of
Dire
cto
rsB
oar
d o
f S
tatu
tory
A
udito
rs
Pre
sid
ent M
anag
emen
t Stra
tegy
M
eetin
g
Exec
utive
Offi
cer L
iais
on
Mee
ting
Natio
nal a
nd G
loba
l Gro
up
Com
pany
Mee
tings
Industry Business Unit
IT Business Unit
Research Laboratory
Yokohama PlantShiga Ryuo PlantOsaka BranchNagoya Branch
Transportation Systems WorksProduction Management DivisionDesign DivisionQuality Assurance DivisionManufacturing Division
Osaka Sales DivisionNagoya Sales Division
Engineering Division
Industrial Systems WorksProduction Management DivisionDesign, Development & Engineering DivisionQuality Assurance DivisionShiga Factory
Manufacturing Division
Information Systems Sales Division
Monitoring and Control Systems Development DivisionInformation Systems Works
Design DivisionQuality Assurance Division
Engineering Management DivisionEngineering Research DivisionAdministration DivisionAdministration Division
Kyushu BranchHokkaido Branch
Industrial Systems Planning Division
Global Sales Division
Development Division
Information Systems Planning Division
Transportation Business Unit
Domestic Sales Division
Transportation Business Planning Division
JR Group Sales DivisionCommuter Rail and Subway Sales Osaka Sales DivisionNagoya Sales DivisionEngineering Division
Development Division
China Sales Division
India Promotion OfficeInternational Project Division
International Sales Division
Management Planning DivisionManagement Planning Department
PR, IR and CSR DepartmentInformation Systems Department
Group Administration OfficeGeneral Affairs Division
Human Resources Division
Financial Affairs Division
Corporate Quality Management Division
Business Development Division
General Affairs Department
Human Resources DepartmentEducation and Development DepartmentFinance and Accounting DepartmentGroup Administrative Control Department
Legal Compliance DepartmentExport Management Department
Planning and Research Department
Quality Management Department 2Quality Management Department 1
Corporate Production Planning Division
Purchasing Division
Development Promotion DepartmentEV Systems Department
Production Planning Department
Production Engineering DepartmentProduction Innovation Department
Planning and Research Department
Logistics Department
Procurement Department 1Procurement Department 2Procurement Department 3
Offi
ce o
f A
udito
rs
Japan Sales Division
Audit Division
Ryuoh Factory Integration Division
Osaka Sales Division
Number of shares authorized 36,000,000
Number of shares issued 9,735,000
Number of shareholders 6,349
Major shareholders
Shareholders Number of shares held(Thousands)
% of total shares held
East Japan Railway Company 480 5.08TOYOTA INDUSTRIES CORPORATION 420 4.44Employees Stock Ownership Plan 409 4.33NIPPON LIFE INSURANCE COMPANY 337 3.57The Bank of Tokyo-Mitsubishi UFJ, Ltd. 270 2.86BNP PARIBAS SECURITIES SERVICESLUXEMBOURG/JASDEC/HENDERSON HHF SICAV 259 2.74
Masayoshi Yamauchi 246 2.60Hitachi, Ltd. 220 2.32Toyo Denki Subcontractor Factories Shareholding Association 217 2.29
The Bank of Yokohama, Ltd. 207 2.19
(Note) The percentages of total shares held are calculated excluding 290,000 treasury stocks held by the Company.
Share consolidation and change to the number of shares constituting one share unit
Effective as of December 1, 2016, the Company implemented a share consolidation (five shares consolidated into one share) and revised the number of shares constituting one share unit (from 1,000 shares to 100 shares).
Distribution of shares by type of shareholder
Disclaimer on the forward-looking statementsInformation in this corporate report contains forward-looking statements. Such statements were developed based on the information available at the time when this report was prepared. These forward-looking statements may be largely revised in the future, and the actual outcome could significantly vary from the stated or implied contents of such statements subject to various factors. This report is not intended to solicit investment. Investors are kindly asked to make your investment decision at your own judgment and responsibility. Numbers presented in 100 million yen or million yen are rounded down to the nearest respective unit.
Transition of share price
Share price
Trading volume
Organization Chart (as of September 1, 2017) Stock Related Information
61 Toyo Denki Seizo Report 2017 62