our fundamental goal of debt management policy is to ... · the amount of issuance of jgbi and the...
TRANSCRIPT

What’s New: Meetings of JGB Market Special Participants and JGB Investors p. 2-4 The 75th Meeting of JGB Market Special Participants and the 74th Meeting of JGB
Investors were held on March 22 and March 23, 2018 respectively.
Auction schedules on April-June 2018 of JGBi and Liquidity Enhancement Auction were announced. The amount of issuance of JGBi and the allocation of issuance amount for each zone of Liquidity Enhancement Auction on April-June 2018 are consistent with FY2018 issuance plan.
Reopening schedule of 10-40-year Bonds was also announced.
Monthly Topic: GDP Oct.-Dec. 2017 (2nd Preliminary) and JGB holders p. 5 The real GDP growth rate Oct.-Dec. 2017 was revised up from 0.1% to 0.4%, reflecting
the upward revision of Private Non-Residential Investment, etc.
Breakdown by JGBs (including T-Bills) Holders as of the end of December 2017 was released.
IR Office: To the Middle East p. 6 Our IR activities in March: We visited the Middle East.
(Statistics) JGB Primary Market … p. 7 Liquidity Enhancement Auctions and JGB Buy-Back … p. 8
JGB Secondary Market … p. 9 Investor Trends and JGB Outstanding … p. 11
Economic and Financial Trends … p. 15 Information … p. 16
Monthly Newsletter of the Ministry of Finance, Japan JAPANESE GOVERNMENT BONDS
SUMMARY
The Ministry of Finance www.mof.go.jp
Our fundamental goal of debt management policy is to achieve stable and smooth financing for our national accounts and to minimize medium-to-long term financing costs.
April 2018
-1-

The Meetings of JGB Market Special Participants and JGB Investors The 75th Meeting of JGB Market Special Participants and the 74th Meeting of JGB Investors
were held on March 22 and March 23, 2018, respectively. Considering the opinions in the meetings, the MOF decided on the “Issuance of the Inflation-Indexed Bonds on April-June 2018”, “Issuance Amounts for Liquidity Enhancement Auctions on April-June 2018” and “Issuance and Reopening Schedule of 10-year, 20-year, 30-year and 40-year Bonds (FY2018)” as explained in the meetings. In addition, the participants discussed the latest JGB market situation and the future outlook.
<Issuance of the Inflation-Indexed Bonds on April-June 2018> Issuance Amount on May 2018 will be about 400 billion yen. Reopening method: 1 issue in FY2018
May, August, November 2018 and February 2019 issues will be the issue No. 23. (Maturity:March 10, 2028, Reference CPI:December 2017)
Auction method is Dutch-style-price-competitive (single price) auction (0.05 yen bidding scale).
Auction schedule of issuance and Buy-back Program of Inflation-Indexed Bonds on April-June 2018.
Auction Month Auction amount
April 2018 Buy-back: Approximately 20 billion yen
May 2018 Issuance: Approximately 400 billion yen
June 2018 Buy-back: Approximately 20 billion yen (Note1) Issues eligible for the buy-backs will be those from issue number 17 to 22 for April auction and 17 to 23 for June auction. (Note2) The plan could be changed owing to market conditions and others. (Source) MOF https://www.mof.go.jp/english/jgbs/topics/press_release/20180326-02e.htm
<Issuance Amounts for Liquidity Enhancement Auctions on April-June 2018> The issuance amount at each auction is increased from the previous quarter because the
amount for Liquidity Enhancement Auctions is planned to increase to 12.6 trillion yen in FY2018 (FY2017: 10.8 trillion yen).
April 2018 May 2018 June 2018
(1) Issues with remaining maturities of 1-5 years Not be implemented
Approximately 400 billion yen
Not be implemented
(2) Issues with remaining maturities of 5-15.5 years Approximately 600 billion yen
Approximately 600 billion yen
Approximately 600 billion yen
(3) Issues with remaining maturities of 15.5-39 years Approximately 500 billion yen
Not be implemented
Approximately 500 billion yen
(Note1) Remaining maturities are calculated starting from the first day of each quarter (i.e., April 1). (Note2) Eligible issues for 2-year JGBs in (1)zone will be those with remaining maturities of more than one year as May 1st 2018 for May auction. (Note3) The plan could be changed owing to market conditions and others. * It is supposed that the shortening of the JGB settlement cycle will start from May 1, 2018. (Source) MOF https://www.mof.go.jp/english/jgbs/topics/press_release/20180326-01e.htm
What’s new
-2-

<Issuance and Reopening Schedule of 10-year, 20-year, 30-year and 40-year Bonds (FY2018)> [Issuance and reopening schedule]
(Note1) It is supposed that the shortening of the JGB settlement cycle will start from May 1, 2018. (Note2) The plan could be changed owing to market conditions and others. (Note3) For 10-year Bonds, it will be issued as a new issue in case the gap between the market interest rate on the auction day and
the coupon rate of the issue with the same maturity is more than 0.30%. (Note4) For 40-year Bonds, auction method is Dutch-style-yield-competitive (single yield) auction (0.5 bp bidding scale). (Note5) The month of maturity of 5-30-year Bonds issued in June 2018 will be March (instead of June as in FY2017) because of the introduction
of the T+1 JGB settlement cycle. Note that the month of maturity of Bonds issued in the four months, March, April, May and June in 2018, will be March. After July 2018, the month of maturity of Bonds issued in three months (e.g., July, August and September in 2018) will be the same (e.g., June) under the reopening rule.
(Source) MOF https://www.mof.go.jp/english/jgbs/topics/press_release/20180326-03e.htm (Reference) Q&A: T+1 JGB settlement cycle https://www.mof.go.jp/english/jgbs/publication/newsletter/jgb2017_11e.pdf
Maturity Issue Date Mar-2018 Apr-2018 May-2018 Jun-2018 Jul-2018 Aug-2018 Sep-2018
Issue No.
Maturity Date
Issue No.
Maturity Date
Issue No.
Maturity Date
Issue No. No.10 - No.11 - No.11 - No.11Maturity Date Mar-2057 - Mar-2058 - Mar-2058 - Mar-2058
Maturity Issue Date Oct-2018 Nov-2018 Dec-2018 Jan-2019 Feb-2019 Mar-2019
Issue No.
Maturity Date
Issue No.
Maturity Date
Issue No.
Maturity Date
Issue No. - No.11 - No.11 - No.11Maturity Date - Mar-2058 - Mar-2058 - Mar-2058
No.352
Dec-2048No.61
Dec-2038No.167
Dec-2028No.353
Sep-2048No.60
Sep-2038No.166
Sep-2028
Mar-2038No.164
Mar-2028No.350
Jun-2048No.59
Jun-2038No.165
Jun-2028No.351
Mar-2048No.58
10
20
30
40
10
20
30
40
-3-
<Discussion about auction method> There were various opinions on auction method for 40-year Bonds, which would be a Dutch-style-yield-competitive (single yield) auction in FY2018 instead of a conventional-style-price-competitive (multiple price) auction which is applied to the other maturities. The MOF summarized the opinions in the meetings as follows: Some participants prefer the Dutch-style-yield-competitive (single yield) auction and
others prefer the transition to the conventional-style-price-competitive (multiple price) auction.
The Dutch-style-yield-competitive (single yield) auction is preferred because the investors of 40-year Bonds are limited compared to those for 20-year and 30-year Bonds and, thus, the supply demand balance for 40-year Bonds tends to be biased due to the seasonality and the liquidity is relatively low. In addition, the Dutch-style- yield-competitive (single yield) auction could support smooth issuance because 40-year is at the end of the yield curve.
Transition to the conventional-style-price-competitive (multiple price) auction is preferred because the depth of the secondary market has been improving since the start of the issuance ten years ago. In addition, auction participants are cautious about purchasing 40-year Bonds at a higher price in a Dutch-style-yield-competitive (single yield) auction because the Dutch-style-yield-competitive (single yield) auction often results in higher prices than the market price.
The MOF thinks that the depth of the 40-year Bonds market is emerging now, ten years after the start of the issuance. However, the investor base of 40-year Bonds is still limited compared to that of the other maturities and the price movement tends to become unidirectional. Considering these situations, the MOF suggests that it is better to keep the Dutch-style-yield-competitive (single yield) auction in FY2018 to implement smooth issuance of 40-year Bonds.
-4-
(%)2016 201710~12 1~3 4~6 7~9 10~12
0.3 0.5 0.6 0.6 0.4 *** 1.6-0.1 0.4 0.9 0.1 0.4 *** 1.8
(-0.1) (0.4) (0.9) (0.1) *** (0.4) ***0.1 0.5 0.8 0.2 0.6 (0.4) 2.40.0 0.3 0.9 -0.6 0.5 (0.3) 2.10.0 0.3 0.9 -0.7 0.5 (0.3) 2.1
Excluding Imputed Rent -0.0 0.3 1.1 -0.9 0.6 (0.3) 2.30.8 1.2 0.9 -1.7 -2.6 (-0.1) -10.11.5 0.2 1.2 1.0 1.0 (0.2) 4.2
(-0.2) (0.1) (-0.1) (0.4) *** (0.1) ***-0.6 0.1 1.2 -0.5 -0.0 (-0.0) -0.2-0.2 0.1 0.2 0.1 -0.0 (-0.0) -0.0-1.9 -0.2 4.8 -2.6 -0.2 (-0.0) -0.8
(-0.0) (0.0) (0.0) (-0.0) *** (-0.0) ***(0.4) (0.1) (-0.3) (0.5) *** (-0.0) ***Net Exports of Goods & Services
201710~12
Gross Domestic Product
Domestic Demand
Private DemandPrivate Consumption
Consumption of Households
Change in Private InventoriesPublic Demand
Private Residential InvestmentPrivate Non-Resi. Investment
Government ConsumptionPublic InvestmentChange in Public Inventories
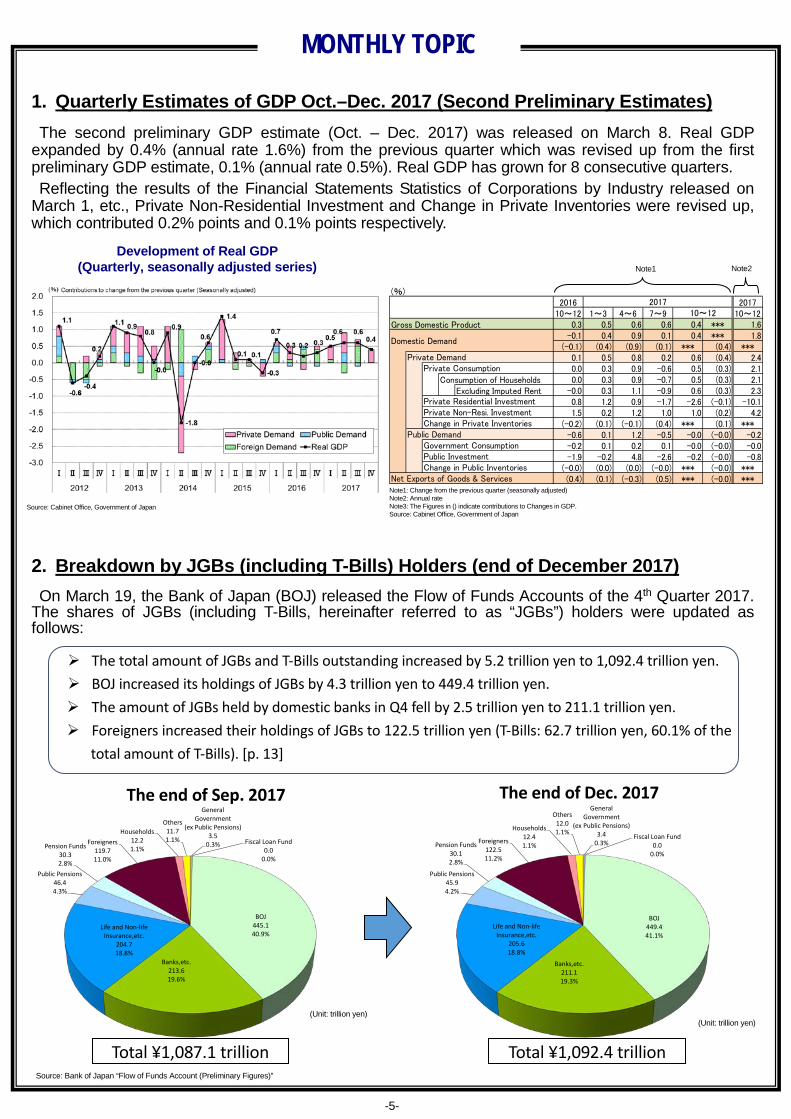
1. Quarterly Estimates of GDP Oct.–Dec. 2017 (Second Preliminary Estimates) The second preliminary GDP estimate (Oct. – Dec. 2017) was released on March 8. Real GDP
expanded by 0.4% (annual rate 1.6%) from the previous quarter which was revised up from the first preliminary GDP estimate, 0.1% (annual rate 0.5%). Real GDP has grown for 8 consecutive quarters. Reflecting the results of the Financial Statements Statistics of Corporations by Industry released on
March 1, etc., Private Non-Residential Investment and Change in Private Inventories were revised up, which contributed 0.2% points and 0.1% points respectively.
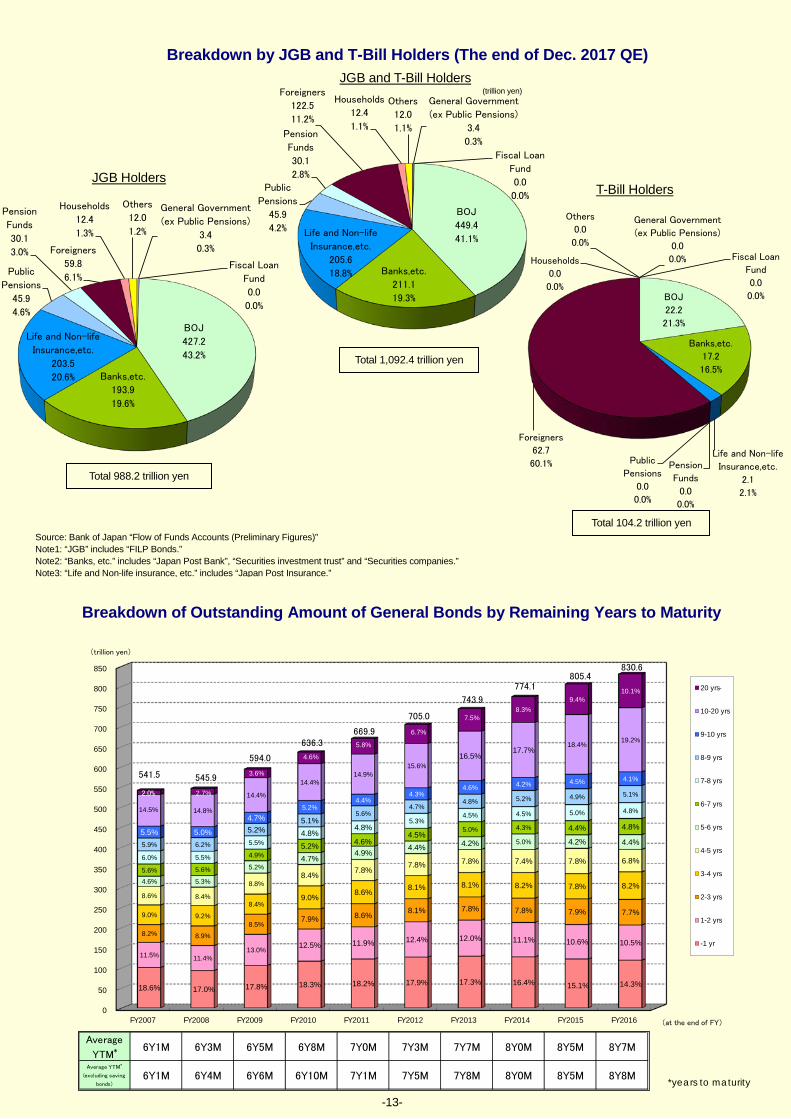
2. Breakdown by JGBs (including T-Bills) Holders (end of December 2017) On March 19, the Bank of Japan (BOJ) released the Flow of Funds Accounts of the 4th Quarter 2017.
The shares of JGBs (including T-Bills, hereinafter referred to as “JGBs”) holders were updated as follows:
Development of Real GDP (Quarterly, seasonally adjusted series)
MONTHLY TOPIC
Note1: Change from the previous quarter (seasonally adjusted) Note2: Annual rate Note3: The Figures in () indicate contributions to Changes in GDP. Source: Cabinet Office, Government of Japan
Source: Cabinet Office, Government of Japan
Note1
Note2
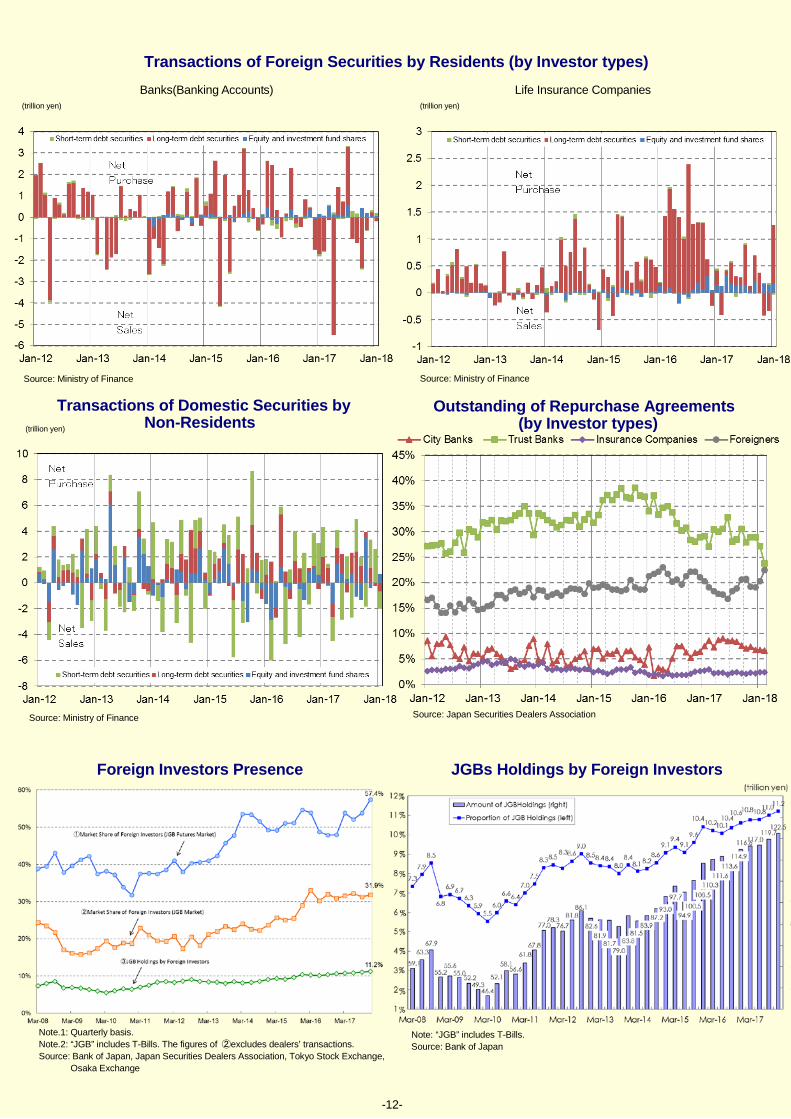
The total amount of JGBs and T-Bills outstanding increased by 5.2 trillion yen to 1,092.4 trillion yen. BOJ increased its holdings of JGBs by 4.3 trillion yen to 449.4 trillion yen. The amount of JGBs held by domestic banks in Q4 fell by 2.5 trillion yen to 211.1 trillion yen. Foreigners increased their holdings of JGBs to 122.5 trillion yen (T-Bills: 62.7 trillion yen, 60.1% of the
total amount of T-Bills). [p. 13]
Total ¥1,087.1 trillion Total ¥1,092.4 trillion Source: Bank of Japan “Flow of Funds Account (Preliminary Figures)”
The end of Sep. 2017 The end of Dec. 2017
(Unit: trillion yen)
(Unit: trillion yen)
-5-
General Government
(ex Public Pensions)3.4
0.3%Fiscal Loan Fund
0.0 0.0%
BOJ449.4 41.1%
Banks,etc.211.1 19.3%
Life and Non-life Insurance,etc.
205.6 18.8%
Public Pensions45.9 4.2%
Pension Funds30.1 2.8%
Foreigners122.5 11.2%
Households12.4 1.1%
Others12.0 1.1%
General Government
(ex Public Pensions)3.5
0.3% Fiscal Loan Fund0.0
0.0%
BOJ445.1 40.9%
Banks,etc.213.6 19.6%
Life and Non-life Insurance,etc.
204.7 18.8%
Public Pensions46.4 4.3%
Pension Funds30.3 2.8%
Foreigners119.7 11.0%
Households12.2 1.1%
Others11.7 1.1%
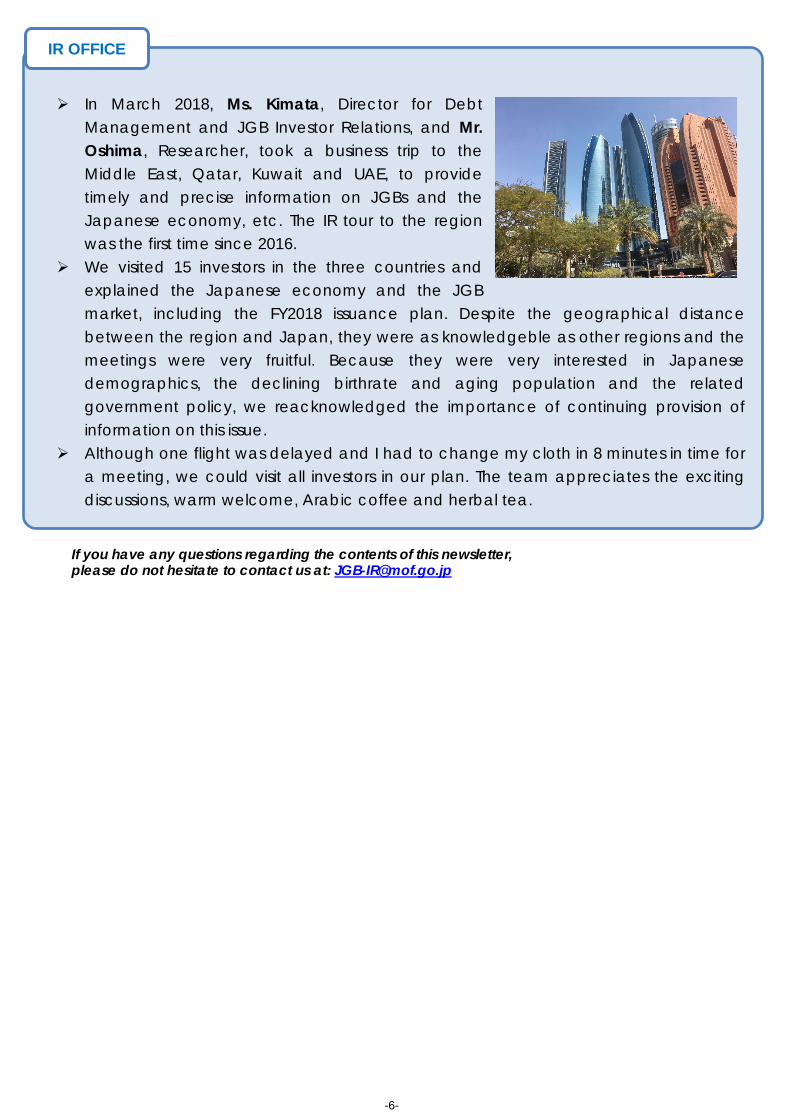
In March 2018, Ms. Kimata, Director for Debt Management and JGB Investor Relations, and Mr. Oshima, Researcher, took a business trip to the Middle East, Qatar, Kuwait and UAE, to provide timely and precise information on JGBs and the Japanese economy, etc. The IR tour to the region was the first time since 2016.
We visited 15 investors in the three countries and explained the Japanese economy and the JGB market, including the FY2018 issuance plan. Despite the geographical distance between the region and Japan, they were as knowledgeble as other regions and the meetings were very fruitful. Because they were very interested in Japanese demographics, the declining birthrate and aging population and the related government policy, we reacknowledged the importance of continuing provision of information on this issue.
Although one flight was delayed and I had to change my cloth in 8 minutes in time for a meeting, we could visit all investors in our plan. The team appreciates the exciting discussions, warm welcome, Arabic coffee and herbal tea.
-6-
IR OFFICE
If you have any questions regarding the contents of this newsletter, please do not hesitate to contact us at: [email protected]

Auction Results
(Bonds)
Auction Date Type of Security Issue Number Maturity Date Nominal
Coupon
Amounts of Competitive
Bids (billion yen)
Amounts of Bids
Accepted (billion yen)
Yield at the Lowest
Accepted Price
Yield at the Average
Price
Amounts of Non-Competitive Bids Tendered
/Accepted (billion yen)
Amounts of Bids Accepted at the
Non-price- competitive Auction Ⅰ (billion yen)
Amounts of Bids Accepted at the
Non-price- competitive Auction Ⅱ (billion yen)
1/10/2018 10-year 349 12/20/2027 0.1% 6,925.3 1,850.7 0.079% 0.078% 0.386 448.1 167.5 1/12/2018 40-year 10 3/20/2057 0.9% 1,835.4 499.6 0.985% - - - 72.5 1/16/2018 5-year 134 12/20/2022 0.1% 9,354.6 1,786.7 ▲0.082% ▲0.084% - 412.2 210.8 1/18/2018 30-year 57 12/20/2047 0.8% 2,475.0 657.0 0.837% 0.832% - 142.1 - 1/25/2018 20-year 163 12/20/2037 0.6% 3,350.6 804.3 0.594% 0.592% - 194.4 70.2 1/30/2018 2-year 385 2/15/2020 0.1% 8,890.7 1,770.3 ▲0.129% ▲0.130% - 428.8 192.6 2/1/2018 10-year 349 12/20/2027 0.1% 8,818.8 1,923.7 0.090% 0.088% 0.386 374.8 157.4 2/6/2018 10-year Inflation-Indexed Bonds 22 3/10/2027 0.1% 1,352.7 400.0 ▲0.464% - - - 40.8 2/8/2018 30-year 57 12/20/2047 0.8% 2,763.1 646.7 0.822% 0.820% - 152.1 113.1 2/14/2018 5-year 134 12/20/2022 0.1% 8,398.8 1,797.7 ▲0.093% ▲0.093% - 401.3 281.8 2/22/2018 20-year 163 12/20/2037 0.6% 3,595.4 809.0 0.563% 0.561% - 189.8 147.1 2/27/2018 2-year 386 3/15/2020 0.1% 10,387.0 1,779.5 ▲0.159% ▲0.160% - 419.8 187.4 3/1/2018 10-year 350 3/20/2028 0.1% 8,430.3 1,859.5 0.062% 0.061% 0.465 438.9 340.1 3/6/2018 30-year 58 3/20/2048 0.8% 2,740.8 647.1 0.753% 0.750% - 152.1 88.1 3/13/2018 5-year 135 3/20/2023 0.1% 7,469.5 1,786.3 ▲0.106% ▲0.108% - 413.0 - 3/15/2018 20-year 164 3/20/2038 0.5% 3,597.3 804.9 0.544% 0.543% - 194.1 127.7 3/27/2018 40-year 10 3/20/2057 0.9% 1,593.5 499.5 0.885% - - - 66.6 3/29/2018 2-year 387 4/15/2020 0.1% 7,919.8 1,704.5 ▲0.137% ▲0.138% - 395.4 -
Auction Results
(Treasury Discount Bills)
Auction Date Type of Security Issue Number Maturity Date
Amounts of Competitive Bids
(billion yen)
Amounts of Bids Accepted
(billion yen)
Yield at the Lowest
Accepted Price
Yield at the Average
Price
Amounts of Bids Accepted at the
Non-price- competitive Auction Ⅰ (billion yen)
1/5/2018 3-month 730 4/9/2018 15,999.70 3,532.48 ▲0.1373% ▲0.1484% 817.50 1/10/2018 6-month 731 7/10/2018 10,307.90 1,908.84 ▲0.1243% ▲0.1324% 391.10 1/11/2018 3-month 732 4/16/2018 14,983.90 3,583.16 ▲0.1162% ▲0.1251% 776.80 1/17/2018 1-year 733 1/21/2019 9,750.90 1,879.47 ▲0.1371% ▲0.1401% 420.50 1/18/2018 3-month 734 4/23/2018 16,649.70 3,588.86 ▲0.1443% ▲0.1559% 831.10 1/25/2018 3-month 735 5/1/2018 15,216.90 3,566.55 ▲0.1487% ▲0.1554% 823.40 2/1/2018 3-month 736 5/7/2018 15,839.90 3,577.95 ▲0.1503% ▲0.1595% 842.00 2/7/2018 6-month 737 8/10/2018 9,728.50 1,888.76 ▲0.1454% ▲0.1495% 411.20 2/8/2018 3-month 738 5/14/2018 15,970.80 3,629.04 ▲0.1479% ▲0.1524% 790.90 2/15/2018 3-month 739 5/21/2018 19,493.30 3,603.72 ▲0.1563% ▲0.1607% 836.20 2/16/2018 1-year 740 2/20/2019 10,826.40 1,867.18 ▲0.1607% ▲0.1627% 432.80 2/22/2018 3-month 741 5/28/2018 17,187.30 3,538.87 ▲0.1764% ▲0.1880% 821.10 3/1/2018 3-month 742 6/4/2018 15,045.16 3,578.08 ▲0.1944% ▲0.2112% 841.90 3/7/2018 6-month 743 9/10/2018 9,656.10 1,884.38 ▲0.1543% ▲0.1623% 415.60 3/8/2018 3-month 744 6/11/2018 13,994.70 3,563.06 ▲0.1824% ▲0.1976% 826.90 3/15/2018 3-month 745 6/18/2018 15,809.76 3,535.38 ▲0.1423% ▲0.1539% 834.60 3/16/2018 1-year 746 3/20/2019 10,318.40 1,885.16 ▲0.1408% ▲0.1427% 414.80 3/22/2018 3-month 747 6/25/2018 15,692.90 3,519.17 ▲0.1503% ▲0.1587% 830.80
Auction Calendar for Apr. 2018 – Jun. 2018 Auction Date Issue Auction Date Issue Auction Date Issue Auction Date Issue
4/3(Tue) T-Bills (3-month) 4/24(Tue) 2-year 5/22(Tue) 20-year 6/14(Thu) T-Bills (3-month)
4/3(Tue) 10-year 4/26(Thu) T-Bills (3-month) 5/24(Thu) Liquidity Enhancement Auction (remaining maturities of 5-15.5 years) 6/19(Tue) T-Bills (1-year)
4/5(Thu) T-Bills (3-month) 5/2(Wed) T-Bills (3-month) 5/25(Fri) T-Bills (3-month) 6/19(Tue) 30-year
4/5(Thu) Liquidity Enhancement Auction (remaining maturities of 15.5-39 years) 5/2(Wed) Liquidity Enhancement Auction
(remaining maturities of 1-5 years) 5/29(Tue) 40-year 6/21(Thu) 5-year
4/6(Fri) T-Bills (6-month) 5/8(Tue) 10-year 5/31(Thu) 2-year 6/22(Fri) T-Bills (3-month)
4/10(Tue) Liquidity Enhancement Auction (remaining maturities of 5-15.5 years) 5/9(Wed) T-Bills (6-month) 6/1(Fri) T-Bills (3-month) 6/26(Tue) 20-year
4/12(Thu) T-Bills (3-month) 5/10(Thu) 10-year Inflation-Indexed Bonds 6/5(Tue) 10-year 6/28(Thu) 2-year 4/12(Thu) 30-year 5/11(Fri) T-Bills (3-month) 6/7(Thu) T-Bills (6-month) 6/29(Fri) T-Bills (3-month)
4/17(Tue) 5-year 5/15(Tue) 30-year 6/7(Thu) Liquidity Enhancement Auction (remaining maturities of 15.5-39 years)
4/18(Wed) T-Bills (1-year) 5/17(Thu) T-Bills (1-year) 6/8(Fri) T-Bills (3-month) 4/19(Thu) T-Bills (3-month) 5/17(Thu) 5-year 6/12(Tue) Liquidity Enhancement Auction
(remaining maturities of 5-15.5 years) 4/19(Thu) 20-year 5/18(Fri) T-Bills (3-month) 6/13(Wed) T-Bills (Approx.2-month)
Top 10 PDs by Total Purchase in Auctions (Calculated by Duration) (Jul. 2017 ~ Dec. 2017) 1 Mitsubishi UFJ Morgan Stanley Securities Co., Ltd. 6 BNP Paribas Securities (Japan) Limited 2 Nomura Securities Co., Ltd. 7 Deutsche Securities lnc. 3 Daiwa Securities Co. Ltd. 8 SMBC Nikko Securities Inc. 4 Mizuho Securities Co., Ltd. 9 Goldman Sachs Japan Co., Ltd. 5 Merrill Lynch Japan Securities Co., Ltd. 10 Morgan Stanley MUFG Securities Co., Ltd.
JGB PRIMARY MARKET
Note.1: The above calendar may be changed or added in light of changes in circumstances. In such cases, it will be announced in advance. Note.2: Each issue amount will be announced about one week prior to each auction date. Note.3: The issue date of Treasury Discount Bills auctioned on June 13, 2018 is June 15, 2018, and the maturity date is August 2, 2018.
(Until 30 March 2018)
(Until 30 March 2018)
-7-
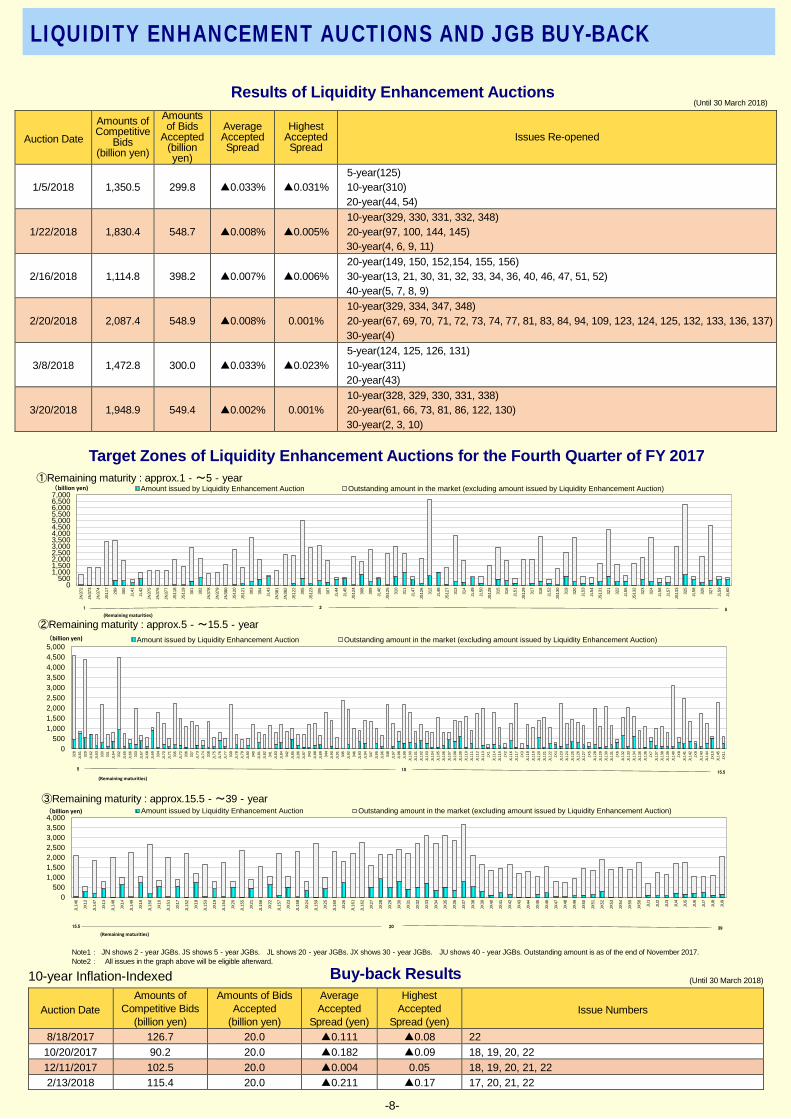
Results of Liquidity Enhancement Auctions
Auction Date Amounts of Competitive
Bids (billion yen)
Amounts of Bids
Accepted (billion yen)
Average Accepted Spread
Highest Accepted Spread
Issues Re-opened
1/5/2018 1,350.5 299.8 ▲0.033% ▲0.031% 5-year(125) 10-year(310) 20-year(44, 54)
1/22/2018 1,830.4 548.7 ▲0.008% ▲0.005% 10-year(329, 330, 331, 332, 348) 20-year(97, 100, 144, 145) 30-year(4, 6, 9, 11)
2/16/2018 1,114.8 398.2 ▲0.007% ▲0.006% 20-year(149, 150, 152,154, 155, 156) 30-year(13, 21, 30, 31, 32, 33, 34, 36, 40, 46, 47, 51, 52) 40-year(5, 7, 8, 9)
2/20/2018 2,087.4 548.9 ▲0.008% 0.001% 10-year(329, 334, 347, 348) 20-year(67, 69, 70, 71, 72, 73, 74, 77, 81, 83, 84, 94, 109, 123, 124, 125, 132, 133, 136, 137) 30-year(4)
3/8/2018 1,472.8 300.0 ▲0.033% ▲0.023% 5-year(124, 125, 126, 131) 10-year(311) 20-year(43)
3/20/2018 1,948.9 549.4 ▲0.002% 0.001% 10-year(328, 329, 330, 331, 338) 20-year(61, 66, 73, 81, 86, 122, 130) 30-year(2, 3, 10)
Target Zones of Liquidity Enhancement Auctions for the Fourth Quarter of FY 2017
10-year Inflation-Indexed
Auction Date Amounts of
Competitive Bids (billion yen)
Amounts of Bids Accepted
(billion yen)
Average Accepted
Spread (yen)
Highest Accepted
Spread (yen) Issue Numbers
8/18/2017 126.7 20.0 ▲0.111 ▲0.08 22 10/20/2017 90.2 20.0 ▲0.182 ▲0.09 18, 19, 20, 22 12/11/2017 102.5 20.0 ▲0.004 0.05 18, 19, 20, 21, 22 2/13/2018 115.4 20.0 ▲0.211 ▲0.17 17, 20, 21, 22
LIQUIDITY ENHANCEMENT AUCTIONS AND JGB BUY-BACK
①Remaining maturity : approx.1‐~5‐year
③Remaining maturity : approx.15.5‐~39‐year
Note1: JN shows 2‐year JGBs. JS shows 5‐year JGBs. JL shows 20‐year JGBs. JX shows 30‐year JGBs. JU shows 40‐year JGBs. Outstanding amount is as of the end of November 2017. Note2: All issues in the graph above will be eligible afterward.
Buy-back Results
(Until 30 March 2018)
(Until 30 March 2018)
②Remaining maturity : approx.5‐~15.5‐year
0500
1,0001,5002,0002,5003,0003,5004,0004,5005,0005,5006,0006,5007,000
JN37
2
JN37
3
JN37
4
JS11
7
299
300
JL41
JL42
JN37
5
JN37
6
JN37
7
JS11
8
JS11
9
301
302
JN37
8
JN37
9
JN38
0
JS12
0
JS12
1
303
304
JL43
JN38
1
JN38
2
JS12
2
305
JS12
3
306
307
JL44
JL45
JS12
4
308
309
JL46
JS12
5
310
311
JL47
JS12
6
312
JL48
JS12
7
313
314
JL49
JL50
JS12
8
315
316
JL51
JS12
9
317
318
JL52
JS13
0
319
320
JL53
JL54
JS13
1
321
322
JL55
JS13
2
323
324
JL56
JL57
JS13
3
325
JL58 326
327
JL59
JL60
Amount issued by Liquidity Enhancement Auction Outstanding amount in the market (excluding amount issued by Liquidity Enhancement Auction)
1 2 5
(Remaining maturities)
(billion yen)
0500
1,0001,5002,0002,5003,0003,5004,0004,5005,000
328
JL61 32
9JL
62JL
63 330
331
JL64 33
2JL
65JL
66 333
JL67
JL68
JL69 33
4JL
70JL
71 335
JL72 33
633
7JL
73JL
74 338
JL75
JL76
JL77 33
9JL
78JL
79JL
80 340
JL81
JL82 34
1JL
83JL
84 342
JL85
JL86
JL87 34
3JL
88JL
89 344
JL90
JL91 34
5JL
92 346
JL93
JL94 34
7JL
95JL
96 348
JL97
JL98
JL99
JL10
0JL
101
JL10
2JL
103
JL10
4JL
105
JL10
6JL
107
JL10
8JL
109
JL11
0JL
111
JL11
2JL
113
JX1
JL11
4JL
115
JX2
JL11
6JL
117
JX3
JL11
8JL
119
JL12
0JL
121
JL12
2JX
4JL
123
JL12
4JL
125
JL12
6JL
127
JX5
JL12
8JL
129
JL13
0JL
131
JX6
JL13
2JL
133
JL13
4JL
135
JL13
6JX
7JL
137
JL13
8JL
139
JL14
0JX
8JL
141
JL14
2JX
9JL
143
JL14
4JX
10JL
145
JX11
Amount issued by Liquidity Enhancement Auction Outstanding amount in the market (excluding amount issued by Liquidity Enhancement Auction)
5 1015.5
(Remaining maturities)
(billion yen)
0500
1,0001,5002,0002,5003,0003,5004,000
JL14
6
JX12
JL14
7
JX13
JL14
8
JX14
JL14
9
JX15
JL15
0
JX16
JL15
1
JX17
JL15
2
JX18
JL15
3
JX19
JL15
4
JX20
JL15
5
JX21
JL15
6
JX22
JL15
7
JX23
JL15
8
JX24
JL15
9
JX25
JL16
0
JX26
JL16
1
JL16
2
JX27
JX28
JX29
JX30
JX31
JX32
JX33
JX34
JX35
JX36
JX37
JX38
JX39
JX40
JX41
JX42
JX43
JX44
JX45
JX46
JX47
JX48
JX49
JX50
JX51
JX52
JX53
JX54
JX55
JX56 JU1
JU2
JU3
JU4
JU5
JU6
JU7
JU8
JU9
Amount issued by Liquidity Enhancement Auction Outstanding amount in the market (excluding amount issued by Liquidity Enhancement Auction)(billion yen)
(Remaining maturities)15.5 20 39
-8-
-0.5%
0.0%
0.5%
1.0%
1.5%
2.0%
2.5%
Jan-13 Jan-14 Jan-15 Jan-16 Jan-17 Jan-18
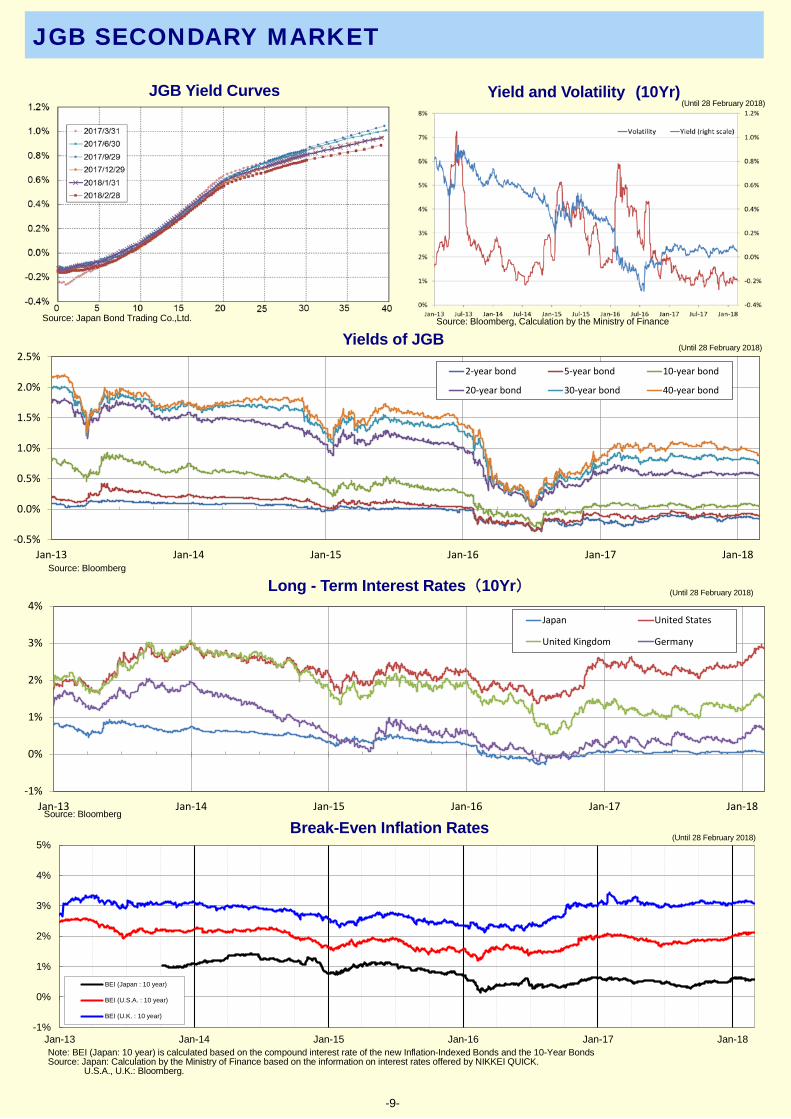
2-year bond 5-year bond 10-year bond
20-year bond 30-year bond 40-year bond
-1%
0%
1%
2%
3%
4%
Jan-13 Jan-14 Jan-15 Jan-16 Jan-17 Jan-18
Japan United States
United Kingdom Germany
-1%
0%
1%
2%
3%
4%
5%
Jan-13 Jan-14 Jan-15 Jan-16 Jan-17 Jan-18
BEI (Japan : 10 year)
BEI (U.S.A. : 10 year)
BEI (U.K. : 10 year)
Note: BEI (Japan: 10 year) is calculated based on the compound interest rate of the new Inflation-Indexed Bonds and the 10-Year Bonds Source: Japan: Calculation by the Ministry of Finance based on the information on interest rates offered by NIKKEI QUICK.
U.S.A., U.K.: Bloomberg.
JGB SECONDARY MARKET
JGB Yield Curves
Source: Japan Bond Trading Co.,Ltd.
Yields of JGB
Long - Term Interest Rates (10Yr) Source: Bloomberg
Source: Bloomberg
-9-
Yield and Volatility (10Yr)
Break-Even Inflation Rates
Source: Bloomberg, Calculation by the Ministry of Finance
(Until 28 February 2018)
(Until 28 February 2018)
(Until 28 February 2018)
(Until 28 February 2018)
0
100
200
300
400
500
600
700
800
900
1,000
1,100
1,200
Jan-13 Jan-14 Jan-15 Jan-16 Jan-17 Jan-18
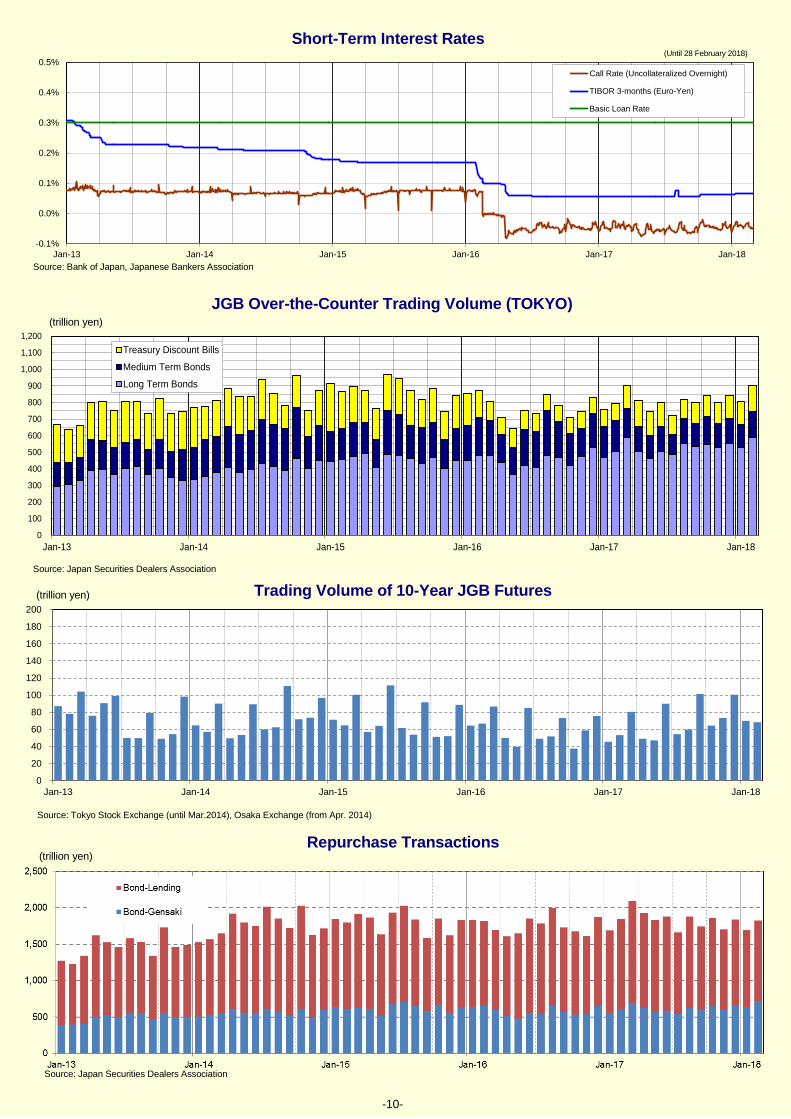
Treasury Discount BillsMedium Term BondsLong Term Bonds
0
20
40
60
80
100
120
140
160
180
200
Jan-13 Jan-14 Jan-15 Jan-16 Jan-17 Jan-18
Short-Term Interest Rates
Source: Bank of Japan, Japanese Bankers Association
JGB Over-the-Counter Trading Volume (TOKYO)
Trading Volume of 10-Year JGB Futures
Repurchase Transactions
-10-
Source: Japan Securities Dealers Association
Source: Tokyo Stock Exchange (until Mar.2014), Osaka Exchange (from Apr. 2014)
Source: Japan Securities Dealers Association
(trillion yen)
(trillion yen)
(trillion yen)
(Until 28 February 2018)
-0.1%
0.0%
0.1%
0.2%
0.3%
0.4%
0.5%
Jan-13 Jan-14 Jan-15 Jan-16 Jan-17 Jan-18
Call Rate (Uncollateralized Overnight)
TIBOR 3-months (Euro-Yen)
Basic Loan Rate

Super long-term
Long-term
Medium-term
T-bills
-9.0
-7.0
-5.0
-3.0
-1.0
1.0
3.0
5.0
7.0
Jan Apr Jul OctJan Apr Jul OctJan Apr Jul OctJan Apr Jul OctJan Apr Jul OctJan
City Banks
Net Purchase
Net Sale
2013 2014 2015 2016 2017 2018
-1.0
-0.5
0.0
0.5
1.0
1.5
2.0
Jan Apr Jul OctJan Apr Jul OctJan Apr Jul OctJan Apr Jul OctJan Apr Jul OctJan
Regional banks
Net Purchase
Net Sale
2013 2014 2015 2016 2017 2018
-1.0
-0.5
0.0
0.5
1.0
1.5
2.0
2.5
3.0
3.5
Jan Apr Jul OctJan Apr Jul OctJan Apr Jul OctJan Apr Jul OctJan Apr Jul OctJan
Life and non-life insurance companies
Net Purchase
Net Sale
2013 2014 2015 2016 2017 2018
-4.0
-2.0
0.0
2.0
4.0
6.0
8.0
10.0
12.0
14.0
16.0
18.0
20.0
22.0
24.0
Jan Apr Jul OctJan Apr Jul OctJan Apr Jul OctJan Apr Jul OctJan Apr Jul OctJan
Foreigners
Net Purchase
Net Sale
2013 2014 2015 2016 2017 2018
(unit: trillion yen)(unit: trillion yen)
(unit: trillion yen) (unit: trillion yen)
0
10
20
30
40
50
Jan-09 Jan-10 Jan-11 Jan-12 Jan-13 Jan-14 Jan-15 Jan-16 Jan-17 Jan-18
190200210220230240250260
-11-
Trends in Bank Assets by Types
INVESTOR TRENDS AND JGB OUTSTANDING Trends in JGBs Transactions (by investor type)
BOJ Trends
Regional Banks City Banks
Source: Bank of Japan
(trillion yen) (trillion yen)
Loans
Cash and Deposits
Government Bonds
Municipal Bonds
Corporate Bonds
Equities
Foreign Securities
Source: Bank of Japan
Source: Japan Securities Dealers Association
-12-
JGBs Holdings by Foreign Investors
Banks(Banking Accounts) Life Insurance Companies
Transactions of Domestic Securities by Non-Residents
Note: “JGB” includes T-Bills. Source: Bank of Japan
Source: Ministry of Finance Source: Japan Securities Dealers Association
Outstanding of Repurchase Agreements (by Investor types)
Transactions of Foreign Securities by Residents (by Investor types)
Source: Ministry of Finance
Foreign Investors Presence
Note.1: Quarterly basis. Note.2: “JGB” includes T-Bills. The figures of ②excludes dealers’ transactions. Source: Bank of Japan, Japan Securities Dealers Association, Tokyo Stock Exchange,
Osaka Exchange
(trillion yen)
(trillion yen)
(trillion yen)
Source: Ministry of Finance
0
50
100
150
200
250
300
350
400
450
500
550
600
650
700
750
800
850
FY2007 FY2008 FY2009 FY2010 FY2011 FY2012 FY2013 FY2014 FY2015 FY2016
18.6% 17.0% 17.8% 18.3% 18.2% 17.9% 17.3% 16.4% 15.1% 14.3%
11.5% 11.4%13.0% 12.5% 11.9% 12.4% 12.0% 11.1% 10.6% 10.5%
8.2% 8.9%8.5%
7.9% 8.6% 8.1% 7.8% 7.8% 7.9% 7.7%9.0% 9.2%
8.4%9.0% 8.6% 8.1% 8.1% 8.2% 7.8% 8.2%
8.6% 8.4%
8.8%8.4% 7.8%
7.8% 7.8% 7.4% 7.8% 6.8%
4.6% 5.3%
5.2%4.7%
4.9%4.4% 4.2% 5.0% 4.2% 4.4%
5.6% 5.6%
4.9%5.2% 4.6%
4.5%5.0% 4.3% 4.4% 4.8%
6.0% 5.5%
5.5%4.8%
4.8%5.3%
4.5% 4.5% 5.0% 4.8%
5.9% 6.2%
5.2%5.1%
5.6%4.7%
4.8% 5.2% 4.9% 5.1%
5.5% 5.0%
4.7%5.2%
4.4%4.3%
4.6% 4.2% 4.5% 4.1%
14.5% 14.8%
14.4%
14.4%14.9%
15.6%16.5%
17.7%18.4% 19.2%
2.0% 2.7%
3.6%
4.6%
5.8%
6.7%
7.5%8.3%
9.4%10.1% 20 yrs-
10-20 yrs
9-10 yrs
8-9 yrs
7-8 yrs
6-7 yrs
5-6 yrs
4-5 yrs
3-4 yrs
2-3 yrs
1-2 yrs
-1 yr
(trillion yen)
(at the end of FY)
541.5 545.9
594.0
636.3669.9
705.0
743.9
774.1805.4
*years to maturity
Average
YTM* 6Y1M 6Y3M 6Y5M 6Y8M 7Y0M 7Y3M 7Y7M 8Y0M 8Y5M 8Y7M
Average YTM*
(excluding saving
bonds)6Y1M 6Y4M 6Y6M 6Y10M 7Y1M 7Y5M 7Y8M 8Y0M 8Y5M 8Y8M
830.6
General Government
(ex Public Pensions)
3.4
0.3%
Fiscal Loan
Fund
0.0
0.0%
BOJ
449.4
41.1%
Banks,etc.
211.1
19.3%
Life and Non-life
Insurance,etc.
205.6
18.8%
Public
Pensions
45.9
4.2%
Pension
Funds
30.1
2.8%
Foreigners
122.5
11.2%
Households
12.4
1.1%
Others
12.0
1.1%
General Government
(ex Public Pensions)
3.4
0.3%
Fiscal Loan
Fund
0.0
0.0%
BOJ
427.2
43.2%
Banks,etc.
193.9
19.6%
Life and Non-life
Insurance,etc.
203.5
20.6%
Public
Pensions
45.9
4.6%
Pension
Funds
30.1
3.0% Foreigners
59.8
6.1%
Households
12.4
1.3%
Others
12.0
1.2%
JGB and T-Bill Holders
Breakdown by JGB and T-Bill Holders (The end of Dec. 2017 QE)
Source: Bank of Japan “Flow of Funds Accounts (Preliminary Figures)” Note1: “JGB” includes “FILP Bonds.” Note2: “Banks, etc.” includes “Japan Post Bank”, “Securities investment trust” and “Securities companies.” Note3: “Life and Non-life insurance, etc.” includes “Japan Post Insurance.”
(trillion yen)
Breakdown of Outstanding Amount of General Bonds by Remaining Years to Maturity
T-Bill Holders
Total 104.2 trillion yen
JGB Holders
Total 988.2 trillion yen
Total 1,092.4 trillion yen
-13-
General Government
(ex Public Pensions)
0.0
0.0% Fiscal Loan
Fund
0.0
0.0%BOJ
22.2
21.3%
Banks,etc.
17.2
16.5%
Life and Non-life
Insurance,etc.
2.1
2.1%
Public
Pensions
0.0
0.0%
Pension
Funds
0.0
0.0%
Foreigners
62.7
60.1%
Households
0.0
0.0%
Others
0.0
0.0%
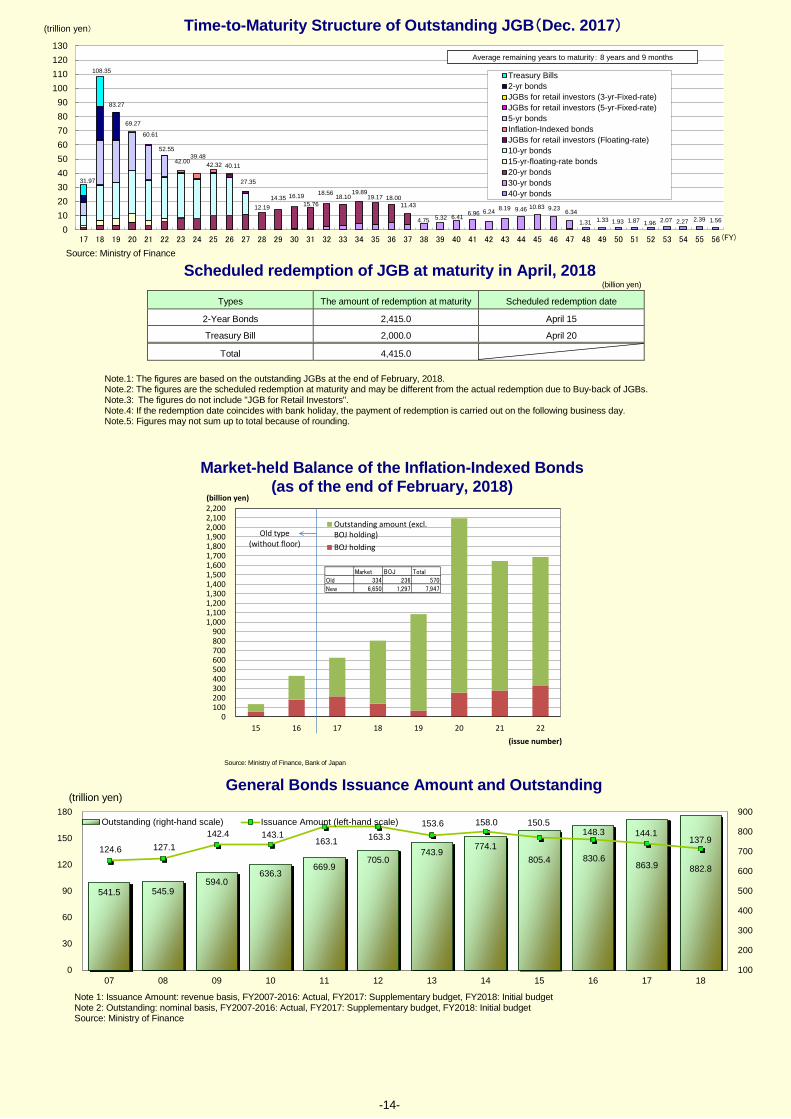
Types The amount of redemption at maturity Scheduled redemption date
2-Year Bonds 2,415.0 April 15
Treasury Bill 2,000.0 April 20
Total 4,415.0
Source: Ministry of Finance
Time-to-Maturity Structure of Outstanding JGB(Dec. 2017)
General Bonds Issuance Amount and Outstanding
Note 1: Issuance Amount: revenue basis, FY2007-2016: Actual, FY2017: Supplementary budget, FY2018: Initial budget Note 2: Outstanding: nominal basis, FY2007-2016: Actual, FY2017: Supplementary budget, FY2018: Initial budget Source: Ministry of Finance
Market-held Balance of the Inflation-Indexed Bonds (as of the end of February, 2018)
(trillion yen)
Scheduled redemption of JGB at maturity in April, 2018
Note.1: The figures are based on the outstanding JGBs at the end of February, 2018. Note.2: The figures are the scheduled redemption at maturity and may be different from the actual redemption due to Buy-back of JGBs. Note.3: The figures do not include "JGB for Retail Investors". Note.4: If the redemption date coincides with bank holiday, the payment of redemption is carried out on the following business day. Note.5: Figures may not sum up to total because of rounding.
(billion yen)
-14-
Source: Ministry of Finance, Bank of Japan
31.97
108.35
83.27
69.27
60.61
52.55
42.0039.48
42.32 40.11
27.35
12.1914.35 16.19
15.76
18.56 18.1019.89
19.17 18.0011.43
4.75 5.32 6.41 6.96 6.24 8.19 9.46 10.83 9.23 6.341.31 1.33 1.93 1.87 1.96 2.07 2.27 2.39 1.56
0102030405060708090
100110120130
17 18 19 20 21 22 23 24 25 26 27 28 29 30 31 32 33 34 35 36 37 38 39 40 41 42 43 44 45 46 47 48 49 50 51 52 53 54 55 56
(trillion yen)
(FY)
Treasury Bills2-yr bondsJGBs for retail investors (3-yr-Fixed-rate)JGBs for retail investors (5-yr-Fixed-rate)5-yr bondsInflation-Indexed bondsJGBs for retail investors (Floating-rate)10-yr bonds15-yr-floating-rate bonds20-yr bonds30-yr bonds40-yr bonds
Average remaining years to maturity: 8 years and 9 months
541.5 545.9594.0
636.3669.9
705.0743.9 774.1
805.4 830.6863.9 882.8
124.6 127.1 142.4 143.1
163.1 163.3 153.6 158.0 150.5
148.3 144.1 137.9
100
200
300
400
500
600
700
800
900
0
30
60
90
120
150
180
07 08 09 10 11 12 13 14 15 16 17 18
Outstanding (right-hand scale) Issuance Amount (left-hand scale)
0100200300400500600700800900
1,0001,1001,2001,3001,4001,5001,6001,7001,8001,9002,0002,1002,200
15 16 17 18 19 20 21 22
(billion yen)
(issue number)
Outstanding amount (excl.BOJ holding)BOJ holding
Old type(without floor)
Market BOJ TotalOld 334 236 570New 6,650 1,297 7,947

1.5%
0.3%
-1
0
1
2
3
4
Jan-12 Jul-12 Jan-13 Jul-13 Jan-14 Jul-14 Jan-15 Jul-15 Jan-16 Jul-16 Jan-17 Jul-17 Jan-18
(%)
CPI
CPI excluding food (excludingalcohilic beverages) and energy
Change from the previous year
Apr.4, 2013BOJ released QQE
70
80
90
100
110
120
130
140
150
160
Jan-
09
May
-09
Sep-
09
Jan-
10
May
-10
Sep-
10
Jan-
11
May
-11
Sep-
11
Jan-
12
May
-12
Sep-
12
Jan-
13
May
-13
Sep-
13
Jan-
14
May
-14
Sep-
14
Jan-
15
May
-15
Sep-
15
Jan-
16
May
-16
Sep-
16
Jan-
17
May
-17
Sep-
17
Jan-
18
(2010 average=100・Seasonally Adjusted Index)
Production Shipments
Inventory Inventory Ratio
0.4
0.6
0.8
1
1.2
1.4
1.6
1.0%
1.5%
2.0%
2.5%
3.0%
3.5%
4.0%
4.5%
5.0%
5.5%
6.0%
Jan-09 Jan-10 Jan-11 Jan-12 Jan-13 Jan-14 Jan-15 Jan-16 Jan-17 Jan-18
(ratio)
Feb, 20181.58 times
Feb, 20182.5%
Aug, 20090.42times
Jul, 20095.5%
Job opening-to-application ratio(right scale)
Unemployment rate(left scale)
4.7
-2.5-1.5
0.8
4.73.7
3.2
-0.2
3.6
-6.8
-0.1
2.6
5.5
0.2 0.4
-1.1
2.71.3
0.9 1.11.9
2.42.4
1.6
-12.0
-10.0
-8.0
-6.0
-4.0
-2.0
0.0
2.0
4.0
6.0
8.0
Ⅰ Ⅱ Ⅲ Ⅳ Ⅰ Ⅱ Ⅲ Ⅳ Ⅰ Ⅱ Ⅲ Ⅳ Ⅰ Ⅱ Ⅲ Ⅳ Ⅰ Ⅱ Ⅲ Ⅳ Ⅰ Ⅱ Ⅲ Ⅳ
2012 2013 2014 2015 2016 2017
(%)
Private Demand Public Demand
Foreign Demand Real GDP
Annualized rate of Change from the previous quarter (Seasonally adjusted)
(CY)
2.3
3.2
4.3 3.8
5.4
4.4
5.5
4.1
4.3
1.8
3.3
0.9
2.1
1.1 1.6
-0.0
1.6 2.1
1.7
-1.0 -0.5
0.9
2.0 1.6
4.3
3.9
4.9
3.1
5.9
4.6
5.8
4.1
6.0
4.6
7.0
4.3
-8
-6
-4
-2
0
2
4
6
8
2009
Q120
09Q2
2009
Q320
09Q4
2010
Q120
10Q2
2010
Q320
10Q4
2011
Q120
11Q2
2011
Q320
11Q4
2012
Q120
12Q2
2012
Q320
12Q4
2013
Q120
13Q2
2013
Q320
13Q4
2014
Q120
14Q2
2014
Q320
14Q4
2015
Q120
15Q2
2015
Q320
15Q4
2016
Q120
16Q2
2016
Q320
16Q4
2017
Q120
17Q2
2017
Q320
17Q4
Primary Income Trade BalanceServices Secondary IncomeCurrent Account
-70%
-60%
-50%
-40%
-30%
-20%
-10%
0%
10%
20%
30%
Jan-
09
May
-09
Sep-
09
Jan-
10
May
-10
Sep-
10
Jan-
11
May
-11
Sep-
11
Jan-
12
May
-12
Sep-
12
Jan-
13
May
-13
Sep-
13
Jan-
14
May
-14
Sep-
14
Jan-
15
May
-15
Sep-
15
Jan-
16
May
-16
Sep-
16
Jan-
17
May
-17
Sep-
17
(Diffusion index)
Large enterprises/Manufacturing
Large enterprises/Non-Manufacturing
Small enterprises/Manufacturing
Small enterprises/Non-Manufacturing
Real GDP Growth Rate
Employment Conditions
Prices
Changes in Current Account
Monetary Base Indices of Industrial Production
Total Value of Machinery Orders (Private Sector exc. Volatile orders)
TANKAN (Business Conditions)
Source: Cabinet Office "Quarterly Estimates of GDP"
Source: Ministry of Internal Affairs and Communications “CPI”
Source: Ministry of Health, Labour and Welfare “Employment Referrals for General Workers “, Ministry of Internal Affairs and Communications “Labour Force Survey”
Source: Ministry of Finance “Balance of Payments"
Source: Ministry of Economy, Trade and Industry "Indices of Industrial Production”
Source: Cabinet Office, Government of Japan "Orders Received for Machinery"
(trillion yen)
ECONOMIC AND FINANCIAL TRENDS
Source: Bank of Japan "Monetary Base"
Source: Bank of Japan "Tankan"
-15-

English Publications on JGBs Frequency URL Debt Management
Message from the Financial Bureau As needed https://www.mof.go.jp/english/jgbs/debt_management/message.htm
About JGBs As needed https://www.mof.go.jp/english/jgbs/debt_management/guide.htm
About the Debt Management Policy As needed https://www.mof.go.jp/english/jgbs/debt_management/about.htm
JGB Issuance Plan As needed https://www.mof.go.jp/english/jgbs/debt_management/plan/index.htm
Auction Calendar
Auction Calendar Monthly https://www.mof.go.jp/english/jgbs/auction/calendar/index.htm
Historical Data of Auction Results Each Auction https://www.mof.go.jp/english/jgbs/auction/past_auction_results/index.html
Topics
Product Characteristics of the JGB As needed https://www.mof.go.jp/english/jgbs/topics/bond/index.html
Treasury Discount Bills (T-Bills) Annual https://www.mof.go.jp/english/jgbs/topics/t_bill/index.htm
Japanese Government Guaranteed Bonds Annual https://www.mof.go.jp/english/jgbs/topics/gov_guaranteed_bonds/index.htm
Interest Rate Swap Semiannual https://www.mof.go.jp/english/jgbs/topics/swap/index.htm
Taxation of Government Bonds As needed https://www.mof.go.jp/english/jgbs/topics/taxation2016/index.html
For Individual Investors As needed https://www.mof.go.jp/english/jgbs/topics/individual/index.htm
Data
Central Government Debt Quarterly https://www.mof.go.jp/english/jgbs/reference/gbb/index.htm
Interest Rate Daily https://www.mof.go.jp/english/jgbs/reference/interest_rate/index.htm
STRIPS Monthly https://www.mof.go.jp/english/jgbs/reference/jgbstat/index.htm
Dialogue with the market
Advisory Councils on Government Debt Management Each Meeting https://www.mof.go.jp/english/about_mof/councils/gov_debt_management/index.html
Meeting of JGB Market Special Participants Each Meeting https://www.mof.go.jp/english/about_mof/councils/jgbsp/index.html
Meeting of JGB Investors Each Meeting https://www.mof.go.jp/english/about_mof/councils/jgb_investor/index.html
Publications
Debt Management Report Annual https://www.mof.go.jp/english/jgbs/publication/debt_management_report/index.htm
JGB Newsletter Monthly https://www.mof.go.jp/english/jgbs/publication/newsletter/index.htm
Debt Management Policy Division, Financial Bureau, Ministry of Finance 3-1-1 Kasumigaseki, Chiyoda-ku, Tokyo 100-8940 Japan
Phone: 81-3-3581-4111 Web: www.mof.go.jp
To subscribe to our Newsletter mailing list, please email: [email protected]
-16-
INFORMATION