otential for drip and sprinkler irrigation in ndia · 2016-03-22 · irrigation and sprinkler...
TRANSCRIPT
1
POTENTIAL FOR DRIP AND SPRINKLER IRRIGATION IN INDIA
A. NARAYANAMOORTHY*
Abstract The water use efficiency under conventional flood method of irrigation, which is predominantly practised in Indian agriculture, is very low due to substantial conveyance and distribution losses. Recognizing the fast decline of irrigation water potential and increasing demand for water from different sectors, a number of demand management strategies and programmes have been introduced to save water and increase the existing water use efficiency in Indian agriculture. One such method introduced relatively recently in Indian agriculture is micro-irrigation, which includes both drip and sprinkler method of irrigation. Micro-irrigation (MI) is proved to be an efficient method in saving water and increasing water use efficiency as compared to the conventional surface method of irrigation, where water use efficiency is only about 35-40 percent. Though both drip and sprinkler irrigation methods are in use over the last two decades or so, not many studies seem to have studied the potential and prospects of micro-irrigation covering different states in India. In this study, therefore, an attempt is made to (a) study the current research on micro-irrigation, (b) study the past trends in drip and sprinkler irrigated area across states, (c) analyse the efficiency of drip and sprinkler irrigation, (d) estimate the potential area for drip and sprinkler irrigation in different states and (e) study the reasons for the slow adoption of micro irrigation as well as to suggest policy/technical interventions for increasing the adoption of WSTs in the future. This study shows that the benefits of micro-irrigation in terms of water saving and productivity gains are substantial in comparison to the same crops cultivated under flood method of irrigation. Micro-irrigation is also found to be reducing energy (electricity) requirement, weed problems, soil erosion and cost of cultivation. Investment in micro-irrigation also appears to be economically viable, even without availing State subsidy. Despite this, as of today, the coverage of drip (2.13 percent) and sprinkler (3.30 percent) method of irrigation is very meager to its total potential, which is estimated to be 21.01 million hectares for drip and 50.22 million hectares of sprinkler irrigation method. It is identified that slow spread of MI is not mainly due to economic reasons, but due to less awareness among the farmers about the real economic and revenue-related benefits of it. Therefore, apart from promotional schemes, the study suggests various technical and policy interventions for increasing the adoption of these two water saving technologies.
* - Dr. A. Narayanamoorthy is working as Reader, Gokhale Institute of Politics and Economics (Deemed University), Pune – 411 004, India. Tel: +91-20-25650287/25654288; Fax: 25652579; E-mail: [email protected]

2
POTENTIAL FOR DRIP AND SPRINKLER IRRIGATION IN INDIA
A. NARAYANAMOORTHY 1. Introduction: Studies carried out across different countries including India have confirmed that irrigation plays a paramount role in increasing the use of yield increasing inputs and enhancing cropping intensity as well as productivity of crops (Dhawan, 1988; Vaidyanathan, et al., 1994). Apart from benefiting the farmers, irrigation development also helps to increase the employment opportunities and wage rate of the agricultural landless labourers, both of which are essential to reduce the poverty among the landless labour households (Saleth, 2004; Narayanamoorthy, 2001a; Bhattarai and Narayanamoorthy, 2003; Narayanamoorthy and Deshpande, 2003). However, water is becoming increasingly scarce worldwide due to various reasons (Rosegrant, et al., 2002). With the fast decline of irrigation water potential and continued expansion of population and economic activity in most of the countries located in arid and semi-arid regions, the problems of water scarcity is expected to be aggravated further (see, Biswas, 1993 and 2001; Rosegrant, 1997; Rosegrant, et al., 2002). Macro-level estimate carried out by the International Water Management Institute (IWMI), Colombo, indicates that one-third of the world population would face absolute water scarcity by the year 2025 (Seckler, et al., 1998; Seckler, et al., 1999). As per this estimate, the worst affected areas would be the semi-arid regions of Asia, the Middle-East and Sub-Saharan Africa, all of which are already having heavy concentration of population living below poverty line. In spite of having the largest irrigated area in the world, India too has started facing sever water scarcity in different regions. Owing to various reasons the demand for water for different purposes has been continuously increasing in India, but the potential water available for future use has been declining at a faster rate (Saleth, 1996; CWC, 2005). The agricultural sector (irrigation), which currently consumes over 80 percent of the available water in India, continues to be the major water-consuming sector due to the intensification of agriculture (see, Saleth, 1996; MOWR, 1999, Iyer, 2003). Though India has the largest irrigated area in the world, the coverage of irrigation is only about 40 percent of the gross cropped area as of today. One of the main reasons for the low coverage of irrigation is the predominant use of flood (conventional) method of irrigation, where water use efficiency is very low due to various reasons. Available estimates indicate that water use efficiency under flood method of irrigation is only about 35 to 40 percent because of huge conveyance and distribution losses (Rosegrant, 1997; INCID, 1994). Considering the water availability for future use and the increasing demand for water from different sectors, a number of demand management strategies and programmes (water pricing, warabandhi, waters users’ association, etc) have been introduced since late seventies in India to increase the water use efficiency, especially in the use of surface irrigation water. While the various strategies introduced to improve the water use efficiency have been continuing, the net impact of these strategies in increasing the water use efficiency is not very impressive as of today. One of the demand management strategies introduced relatively recently to control water consumption in Indian agriculture is micro irrigation (MI), which includes mainly drip and sprinkler irrigation method. Under micro-irrigation, unlike flood method of irrigation (FMI), water is supplied at a

3
required interval and quantity using pipe network, emitters and nozzles. Therefore, the conveyance and distribution losses are reduced completely which result in higher water use efficiency under MI. Though both drip and sprinkler irrigation method of irrigation are treated as MI, there are distinct characteristics differences between the two in terms of flow rate, pressure requirement, wetted area and mobility (Kulkarni, 2005). While drip method supplies water directly to the root zone of the crop through a network of pipes with the help of emitters, sprinkler irrigation method (SIM) sprinkles water similar to rainfall into the air through nozzles which subsequently break into small water drops and fall on the field surface. Unlike flood irrigation method, DIM supplies water directly to the root zone of the crop, instead of land, and therefore, the water losses occurring through evaporation and distribution are completely absent (INCID, 1994, Narayanamoorthy, 1996; 1997; Dhawan, 2002). The on-farm irrigation efficiency of properly designed and managed drip irrigation system is estimated to be about 90 percent, while the same is only about 35 to 40 percent for surface method of irrigation (INCID, 1994). In sprinkler irrigation method, water saving is relatively low (up to 70 percent) as compared to drip irrigation since SIM supplies water over the entire field of the crop (INCID, 1998; Kulkarni, 2005). Micro-irrigation is introduced primarily to save water and increase the water use efficiency in agriculture. However, it also delivers many other economic and social benefits to the society. Reduction in water consumption due to drip method of irrigation over the surface method of irrigation varies from 30 to 70 percent for different crops (INCID, 1994, Narayanamoorthy, 1997; Postal, 2001). According to data available from research stations, productivity gain due to use of micro-irrigation is estimated to be in the range of 20 to 90 percent for different crops (see, INCID, 1994; 1998). While increasing the productivity of crops significantly, it also reduces weed problems, soil erosion and cost of cultivation substantially, especially in labour-intensive operations. The reduction in water consumption in micro-irrigation also reduces the energy use (electricity) that is required to lift water from irrigation wells (see, Narayanamoorthy, 1995 and 2001).
India has enormous potential for both DIM and for SIM. Two of the INCID (1994 and 1998) reports, which present an overview about the development of drip irrigation and sprinkler irrigation in India indicate that about 80 crops, both narrow and widely spaced crops, can be grown under micro-irrigation. Although DIM is considered to be highly suitable for wide spaced and high value commercial crops, it is also being used for cultivating oilseeds, pulses, cotton and even for wheat crop (INCID, 1994). Closely grown crops such as millets, pulses, wheat, sugarcane, groundnut, cotton, vegetables, fruits, flowers, spices and condiments have been found to be suitable to cultivate under sprinkler irrigation. Importantly, an experimental study suggests that sprinkler irrigation can also be used successfully even for cultivating paddy crop (Kundu, et al., 1998).
Micro-irrigation can also be adopted in all kind of lands, which is not generally
possible through flood irrigation method. Research suggests that DIM is not only suitable for those areas that are presently under cultivation, but it can also be operated efficiently in undulating terrain, rolling topography, hilly areas, barren land and areas which have shallow soils (Sivanappan, 1994). Given the population growth and increasing requirement of agricultural commodities, there is a need to increase the area

4
under cultivation. Micro-irrigation can be one of the viable options for expanding area under cultivation. In spite of having many economic and other advantages over the method of flood irrigation, the coverage of area under micro-irrigation is not appreciable in India, except for a few states as of today. While DIM has been in practice since early seventies in India, SIM has been in use over since mid-seventies. However, an appreciable improvement in the adoption of DMI has taken place only from the eighties, mainly because of various promotional programmes introduced by the Central and State governments. The area under DMI has increased from a mere 1500 ha in 1985 to 70,859 ha in 1991-92 and further to 5,00,000 ha as of March 2003 (INCID, 1994; GOI, 2004). Similarly, the area under SIM has increased from 0.23 mha in 1985-86 to 0.67 mha in 1997-98 and further to 1.63 mha in 2004-05. Though remarkable growth has been achieved over the last 15 years in adopting micro-irrigation, its share to the gross irrigated area of the country is only negligible percent as of today. Among the various reasons for the slow progress of adoption of this new technology, its capital-intensive nature seems to be one of the main deterrent factors. Micro-irrigation technology requires fixed investment that varies from Rs. 20,000 to Rs. 55,000 per hectare depending upon the nature of crops (wide or narrow spaced) and the material to be used for the system. Since the Indian farmers have been getting water for low cost from the public irrigation system and also from well irrigation (because of free and flat-rate electricity tariff), there is less incentive to them to adopt this capital-intensive technology unless it is necessary. Moreover, since it involves fixed investment, farmers often ask questions like what will be the water saving and productivity gains? Is investment on drip irrigation economically viable? What will be the pay back period of the drip investment? These issues are raised because of the following two reasons. First, the awareness of the farmers about this technology is very low due to poor extension service. Second, most of the studies available on micro-irrigation in India is based on experimental data collected from different regions, which generally do not present the field level position (see, Verma and Rao, 1998; INCID, 1994; Dhawan, 2002). Some of the studies have shown that the results derived from research station data are substantially different from that of survey data (see, Narayanamoorthy, 1997; 2001; 2005). In the absence of reliable field studies, it is difficult to judge the actual economic viability of drip method of irrigation In spite of the fact that micro-irrigation is economically viable and environmentally feasible, but not many studies seem to have attempted to study the potential and prospects of drip and sprinkler irrigation covering different states in India at the macro-level. In this study, using the available secondary information, an attempt is made to study the followings: (a) the current research on micro-irrigation, (b) the past trends of drip and sprinkler irrigated area across states, (c) efficiency of drip and sprinkler irrigation, (d) potential area for drip and sprinkler irrigation in different states and (e) the reasons for the slow adoption of micro irrigation as well as to suggest policy/technical interventions for increasing adoption of WSTs in the future. The paper is organised into seven sections. Following introduction, section two presents the current research on drip and sprinkler irrigation in India. A discussion on the past trends in area under micro-irrigation across different States in India as well as its coverage in different crops is presented in section three. While the efficiency (conveyance and application) of micro-irrigation is presented in section four, an estimate on potential area for SIM and DIM from different States is presented in section five. The reasons for

5
slow adoption of micro-irrigation and the required policy/technical interventions for increasing the adoption in future are discussed in section six. A brief conclusion is presented in the last section. 2. Research on Water Saving Technologies:
Considering the limited potential of water resources as well as growing demand for water from different purposes, it has become essential to adopt Water Saving Technologies (WSTs) so as to avoid the water stress in the future. It has been proved by studies that drip and sprinkler method of irrigation helps to save water and improves water use efficiency (INCID, 1994 and 1998). While reducing water consumption, it also reduces substantial amount of electricity required for irrigation purpose, by reducing working hours of irrigation pumpsets (Narayanamoorthy, 1996; 2004). Over the last ten years or so, quite a few scholars have researched the impact of WSTs on water use pattern, productivity gain and other parameters, either by using farm level data or experimental research data. In this section, we present the findings of the research studies that have been carried out particularly in the Indian context. Research on Drip Irrigation:
Considering the importance of drip method of irrigation in the sustainable use of irrigation water, efforts are being made to propagate the adoption of DIM from 1970 onwards in India (INCID, 1994). Special subsidy schemes were introduced during the eighties by the central and state governments for promoting this technology since DIM is considered to be a relatively capital-intensive technology. Though studies using field level data are rarely available focusing water use efficiency and water saving of DIM, many research stations situated in different parts of the country have evaluated the water saving capacity of DIM for different crops. We have presented the water requirements, saving of water and water use efficiency under DIM and FIM for different crops in Table 1 based on the data from experimental stations.
For the purpose of analysis, we have divided the crops into three groups as
vegetable crops, fruit crops and other commercial crops. This is done specifically to understand how the saving of water varies across different crop groups. The water saving capacity of DIM is expected to be different for various crops as the consumption and the requirement of water varies from crop to crop. As expected, the water saving for vegetable crops varies from 12 percent to 84 percent per hectare over the conventional method of irrigation. Similarly, water saving varies from 45 percent to 81 percent per hectare in fruit crops. In crops like cotton, coconut and groundnut, water saving varies from 40 percent to 60 percent per hectare. Importantly, water saving in sugarcane, which is one of the water-intensive crops, is over 65 percent per hectare when compared to conventional method of irrigation.
Similarly, the experimental studies carried out by the Precision Farming Development Centre (PDCs) also clearly demonstrate that water saving due to DIM is substantial over the method of surface irrigation in different crops (GOI, 2004). There are three main reasons for enormous water saving under drip method of irrigation. First, since water is supplied through a network of pipes, the evaporation and distribution losses of water are very minimum or completely absent under DIM. Second, unlike FIM, water is supplied under DIM at a required time and required level and thus, over-irrigation is

6
totally avoided. Third, under the conventional method of irrigation, water is supplied for the whole cropland, whereas DIM irrigates only the plants. Though the results of the experimental data discussed above clearly suggest that water saving due to DIM is substantial, one cannot completely rely on these results because the conditions that are prevailing under experimental stations are totally different from that of the farmers’ field. Table1: Water Saving and Productivity Gains under Drip Method of Irrigation: India.
Water Consumption
(mm/ha)
Yield (tonne/ha) Water Use Efficiency
(yield/ha)/(mm/ha)
Crop’s Name
FIM DIM FIM DIM
Water Saving
over FIM (%)
Yield Increase over FIM
(%) FIM DIM Vegetables: Ash gourd 840 740 10.84 12.03 12 12 0.013 0.016 Bottle gourd 840 740 38.01 55.79 12 47 0.045 0.075 Brinjal 900 420 28.00 32.00 53 14 0.031 0.076 Beet root 857 177 4.57 4.89 79 7 0.005 0.028 Sweet potato 631 252 4.24 5.89 61 40 0.007 0.023 Potato 200 200 23.57 34.42 Nil 46 0.118 0.172 Lady’s finger 535 86 10.00 11.31 84 13 0.019 0.132 Onion 602 451 9.30 12.20 25 31 0.015 0.027 Radish 464 108 1.05 1.19 77 13 0.002 0.011 Tomato 498 107 6.18 8.87 79 43 0.012 0.083 Chillies 1097 417 4.23 6.09 62 44 0.004 0.015 Ridge gourd 420 172 17.13 20.00 59 17 0.041 0.116 Cabbage 660 267 19.58 20.00 60 2 0.030 0.075 Cauliflower 389 255 8.33 11.59 34 39 0.021 0.045 Fruit Crops: Papaya 2285 734 13.00 23.00 68 77 0.006 0.031 Banana 1760 970 57.50 87.50 45 52 0.033 0.090 Grapes 532 278 26.40 32.50 48 23 0.050 0.117 Lemon 42 8 1.88 2.52 81 35 0.045 0.315 Watermelon 800 800 29.47 88.23 Nil 179 0.037 0.110 Mosambi* 1660 640 100.00 150.00 61 50 0.060 0.234 Pomegranate* 1440 785 55.00 109.00 45 98 0.038 0.139 Other Crops: Sugarcane 2150 940 128.00 170.00 65 33 0.060 0.181 Cotton 856 302 2.60 3.26 60 25 0.003 0.011 Coconut -- -- -- -- 60 12 -- -- Groundnut 500 300 1.71 2.84 40 66 0.003 0.009
Notes: * - yield in 1000 numbers Sources: INCID (1994) and NCPA (1990).
Apart from reducing water consumption, drip method of irrigation also helps reducing cost of cultivation and improving productivity of crops as compared to the same crops cultivated under flood method of irrigation. Quite a few studies have attempted to study the impact of drip method of irrigation on productivity of crops, mainly using experimental data. INCID (1994) report presents the results of various crops carried out at different locations in the country (see, Table 1). It shows that the productivity of different crops is significantly higher under DIM when compared to FIM. Productivity increase due to drip method of irrigation is noticed over 40 percent in vegetable crops such as bottle gourd, potato, onion, tomato and chillies, whereas the same is noticed over 70 percent in many fruit crops. Productivity difference is also found to be over 33 percent in sugarcane cultivated under DIM over the same crop cultivated under FIM. Specific experiments carried out at Punjabrao Krishi Vidyapeeth (Akola, Maharashtra State) on

7
vegetable crops such as cauliflower, tomato and brinjal also suggest that productivity enhancement due to DIM is substantial. Similar kinds of results have also been noted at different experimental stations located in different states.1 Table 2: Field Survey Results of Drip Irrigation: Banana, Grapes and Sugarcane
Method of Irrigation Benefit over FIM Particulars
Crop’s Name DIM FIM In percent In value Banana 7884.70 11130.30 29.20 3245.60 Grapes 3310.40 5278.40 37.30 1968.00
Water Consumption (HP/hours/ha)
Sugarcane 1767.00 3179.98 44.43 1412.98 Banana 679.50 526.35 29.10 153.20 Grapes 243.25 204.29 19.10 38.96
Productivity (quintal/ha)
Sugarcane 1383.60 1124.40 23.05 259.20 Banana 5913.33 8347.75 29.16 2434.42 Grapes 2482.77 3958.78 37.28 1476.01
Electricity Consumption (Kwh/ha)
Sugarcane 1325.25 2384.99 44.43 1059.74 Banana 11.60 21.10 45.10 9.50 Grapes 13.60 25.80 47.30 12.20
Water Use Efficiency (HP hours/quintal)
Sugarcane 1.28 2.83 5.48 1.55 Banana 51437 52740 2.50 1303 Grapes 134506 147915 9.10 13409
Cost of Cultivation (Rs/ha)
Sugarcane 41993 48540 13.49 6547 Banana 134044 102935 30.22 31109 Grapes 247817 211038 17.40 36779
Gross Income (Rs/ha)
Sugarcane 106366 85488 24.00 20878 Banana 33595 -- -- -- Grapes 32721
Capital Cost of Drip-set (Rs/ha) (without subsidy)
Sugarcane 52811 -- -- -- Banana 241753 -- -- -- Grapes 540240
Net Present Worth (Rs/ha)*
(without subsidy) Sugarcane 169896 -- -- -- Banana 2.288 -- -- -- Sugarcane 1.909 Benefit-Cost Ratio*
(without subsidy) Grapes 1.767 -- -- --
Notes: Banana and grapes data relate to the year 1993-94 and sugarcane data relate to the year 1998-99; * - 15 percent of discount rate is considered for computing benefit cost ratio. Source: Computed using Narayanamoorthy (1996; 1997 and 2001).
A number of studies have also been carried out in the context of sugarcane using experimental data, which have found a substantial water saving and productivity gains due to drip method of irrigation in sugarcane cultivation (Venugopal and Rajkumar, 1998; Dash, 1998; Sankpal, et al., 1998; Dhonde and Banger, 1998; Deshmukh, et al., 1998; Hapase, et al., 1992; Batta and Singh, 1998; Parikh et al., 1993). Single cane weight, cane girth, cane length, number of inter-nodes, leaf length and leaf breadth were also found to be higher with sugarcane cultivated under drip method of irrigation when compared to that cultivated under flood method of irrigation (Venugopal and Rajkumar, 1998). Because of less moisture stress under DMI, the recovery rate of sugarcane cultivated under DMI was found to be higher when compared to the crop cultivated using FIM (Sankpal, et al., 1998; Dhonde and Banger, 1998; Banger, 1998). Importantly, a study carried out on heavy soils and sub-humid climatic conditions of South Gujarat region suggests that a large scale adoption of drip method of irrigation in sugarcane in South Gujarat area can help to solve
1 The results of experiments carried out in different locations and in various crops are available in INCID (1994 and 1998) and Narayanamoorthy (2005).

8
the problem of water logging and secondary salinization which are increasing in this region (Parikh, et al., 1993).
It is clear from the above that the adoption of drip method of irrigation in crop cultivation not only increases water saving and productivity of crops but also reduces the cost of cultivation and weed problems. Importantly, DIM also helps to increase the germination of seed (cane) and the recovery rate of sugarcane. Though drip method of irrigation is proved to be an effective technology for increasing crop productivity, one can always question the credibility of the results of research station based studies as the conditions prevailing at farmers’ field are totally different from research station where trails are carried out. However, studies available based on filed level data also suggest that drip irrigation is economically suitable for different crops. A few studies carried out using farm level data in high value crops like banana, grapes and sugarcane also suggest that DIM increases water use efficiency, productivity and reduces cost of cultivation for different operations (see, Table 2) Significant amount of saving in electricity use due DIM has also been observed using field data. Importantly, these field based studies found that the investment in drip irrigation technologies is economically viable for farmers even at 15 percent discount rate, without availing subsidy from government (Narayanamoorthy, 1996, 1997, 2001). Research on Sprinkler Irrigation:
Among the two micro-irrigation technologies, the research on sprinkler irrigation appears to have not much developed as compared to drip irrigation (Dhawan, 2002). In fact, unlike drip irrigation method, studies using field level data (published in standard journals for Indian context) are seldom available. Most of the studies are mainly used experimental data for its analysis, which of course may not completely reflect the farm level condition.
The available results suggests that yield improvement and water saving in sprinkler irrigation is less striking, though the picture does vary considerably across crops and across space (Dhawan, 2002). This can be seen from the results of experimental data presented in INCID (1998) report pertaining to 15 crops carried out in different locations in India. The crops are grouped into three categories namely foodgrains, oilseeds and other crops for the purpose of comparison. Except for a few crops reported in Table 3, considerable amount of water saving and yield improvement has been noted in all other crops. Not surprisingly, water saving due to SIM is found to be relatively higher among foodgrain crops, whereas relatively higher yield gain is observed in oilseed crops. Sugarcane, a water-intensive crop, does not show any impressive result in terms of water saving and yield gain due to the adoption of SIM, implying that the sugarcane is not very much suitable for cultivation under SIM. Similarly, cotton crop also shows not substantial gain due to the adoption of SIM.
A large number of individual evaluation studies on sprinkler irrigation have also been carried out in different crops. Let us briefly understand the impact of SIM in each crop. Using three years experimental data, a study was carried out in Udaipur district of Rajasthan on MAIZE and WHEAT crops to know the economic feasibility of SIM. The result of the study shows the average incremental yield in maize and wheat was 4.45 and 6.95 percent respectively over flood irrigation method (FIM). Water saving due to SIM was 14.48 and 16.89 percent respectively for maize and wheat (Acharyna et al., 1993).

9
Similarly, another experimental result of three year trail conducted in Gujarat with winter MAIZE indicates the superiority of sprinkler irrigation over flood irrigation method. The trail shows about 40 percent of water saving and 30 percent of productivity gain over the conventional method of irrigation (Patel, et al., 1993).
In order to find out the relative economics of SIM over FIM in FENUGREEK crop, a three year trail was conducted in North Gujarat. The study shows that under the conditions of normal water availability, the use of SIM can result in 29 percent water saving along with 35 percent yield increase. Importantly for farmers, the net income per mm of water used rose from Rs. 2.80 with surface method to Rs. 9.57 with sprinkler method of irrigation (Mehta, et al., 1993).
Table 3: Farm Research Data on Sprinkler Irrigation in Comparison to Conventional Surface Irrigation
Yield (q/ha) Irrigation water
(cm) Water Use efficiency
(q\ha\cm) Benefits over
FIM (%) Crops
Location FIM SIM FIM SIM FIM SIM water Yield
Rahuri 32.41 36.39 35.00 20.25 0.93 1.79 42.14 12.28 Udaipur 26.61 33.02 33.02 14.52 0.81 2.27 56.03 24.09
1. Wheat Hissar 44.80 48.70 33.94 32.68 1.32 1.49 3.89 8.70 2. Bajra Rahuri 6.97 8.33 17.78 7.82 0.39 1.07 56.02 19.51 3. Jowar Rahuri 4.92 6.62 25.40 11.27 0.19 0.59 55.63 34.55 4. Sorghum (k) Rahuri 44.12 54.97 18.00 12.00 2.45 4.58 33.33 24.59 5. Maize (k) Udaipur 15.62 18.10 12.80 9.00 1.22 2.01 33.00 15.88
Bikaner 24.09 28.15 17.78 7.82 1.35 3.59 56.01 16.85 6. Barley Hissar 35.10 34.80 23.87 21.88 1.47 1.59 8.34 -0.85 7. Gram Hissar 6.55 9.91 17.78 7.82 0.37 1.27 56.02 51.29 Foodgrains (Avg) 24.12 27.90 23.54 14.51 1.05 2.03 40.04 20.69 8. Oilseeds Delhi 8.33 9.34 60.00 30.00 0.14 0.31 50.00 12.12
Rahuri 23.24 28.98 90.00 62.00 0.26 0.47 31.11 24.69 Junagarh 13.00 16.00 91.00 65.00 0.14 0.25 28.57 23.08 Dharwad 33.96 39.86 76.30 63.60 0.45 0.63 16.64 17.37 Punjab 5.50 11.90 68.60 50.20 0.08 0.24 26.82 116.38 Navsari 31.00 30.00 56.00 44.00 0.55 0.68 21.43 -3.22
9. Groundnut(s) Rahuri (k) 18.31 22.15 21.00 14.00 0.87 1.58 33.33 20.97 10. Sunflower (r) Rahuri 16.02 19.19 30.00 20.00 0.53 0.96 33.33 19.79 Oilseeds (Avg) 18.67 22.18 61.61 43.60 0.38 0.64 30.15 28.90
Pune 17.41 21.52 36.00 24.00 0.48 0.89 33.33 23.61 11. Chillies (k) Rahuri 17.15 20.91 39.00 26.00 0.44 0.80 33.33 21.92 12. Garlic Rahuri 69.99 73.99 84.00 60.00 0.83 1.23 28.57 5.71 13. Onion (s) Rahuri 334.90 412.70 78.00 52.00 4.29 7.94 29.69 23.23
Navsari 6.99 7.04 40.64 29.65 0.17 0.24 27.04 0.71 14. Cotton Punjab 10.00 15.00 91.10 58.60 0.12 0.26 35.68 50.00
Rahur 792.10 866.30 245.00 188.00 3.23 4.61 23.26 9.37 15. Sugarcane Dharwad 55.70 48.00 51.40 43.50 1.08 1.10 33.33 -13.82 Others (Avg) 163.03 183.18 83.14 60.22 1.33 2.13 30.53 15.09
Source: INCID (1998).
An exploratory experiment carried out to study the comparative performance of micro-tube, sprinkler and furrow method of irrigation in SUGARCANE at Vasantdada Sugar Institute as well as in Co-operative sugar factories in Maharashtra shows that water saving due to use of micro-tube irrigation is almost two fold as compared to sprinkler irrigation. This relatively more water saving in micro-tube was attributed to less water evaporation and required water quantity applied at the root zone of the crop with maximum frequency. The increase in yield with micro-tube irrigation was also found to be higher (172.12
10
MT/ha) as compared to SIM (142.30/ha) and FIM (135.50). The water use efficiency of micro-tube was observed nearly 2.5 times more than FIM irrigated sugarcane (Hapase, et al., 1993).
A field experiment conducted in south Gujarat during 1989 to 1991 to explore the
feasibility of adoption of mini sprinkler irrigation system for ONION crop during rabi season shows a considerable increase of yield and water saving over the method of flood irrigation (Desai, et al., 1993). Similar to onion, another experimental study carried out in south Gujarat to study the feasibility of mini sprinkler in SAFFLOWER also shows that its gain in increasing yield (about 13 percent), water saving (20.31 percent) and water use efficiency (47.61 percent) as compared to conventional method of irrigation (Patel, P.G., et al., 1993). Similar results were also reported by Abrol and Sharma (1990) in SUNFLOWER crop.
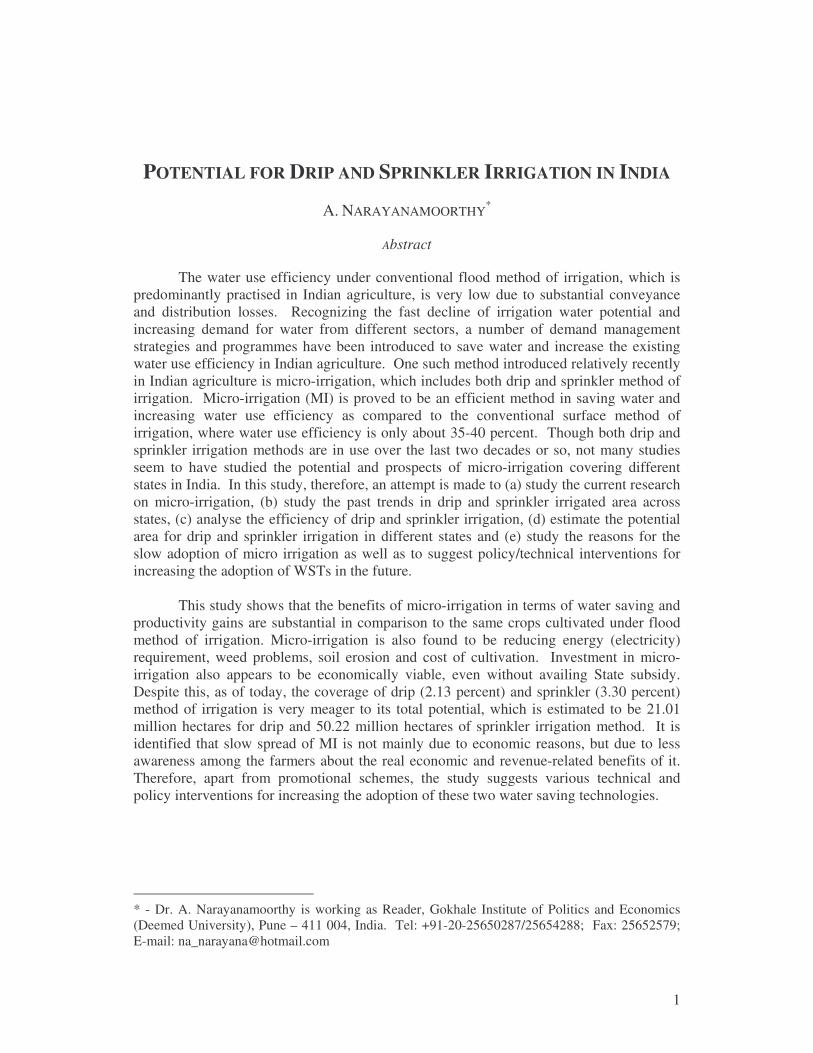
On groundnut, Gujarat Agricultural University, Sardar Krushinagar conducted an experimental study during three summer seasons of 1990, 1991 and 1992, which shows that sprinkler irrigation is highly suitable for GROUNDNUT cultivation. Water use efficiency was found to be higher in all schedules of sprinkler and save 9.6 to 53.9 percent of irrigation when compared to surface irrigation method. The net income per mm water used was found to be more under all the sprinkler irrigation schedules over surface method of irrigation (Patel, I, S., et al., 1993). Dhawan (2002) mentions, using the experimental data on summer GROUNDNUT from farm research station of the Dharward campus of the University of Agricultural Sciences, about 17 percent improvement in groundnut yield and a like amount of water saving owing to use of sprinkler instead of surface irrigation, but a 40 percent improvement in water use efficiency. Similarly, a field experiment conducted at Anand, Gujarat (Mehta, et al., 1993) in GROUNDNUT crop also shows considerable increase in yield and water use efficiency of groundnut over the flood method of irrigation, which are presented in Table 4. Table 4: Yield of Groundnut under different Treatments of Sprinkler and Surface Irrigation Method
Treatment Pod yield Kg/ha Net realisation Rs/ha
BCR
Sprinkler irrigation at 0.45 IW/CPE
1285 1182 1299 1255 2275 1.22
Sprinkler Irrigation at 0.60 IW/CPE
1462 1990 1563 1671 5667 1.54
Sprinkler Irrigation at 0.75 IW/CPE
1875 2493 1854 2074 9562 1.87
Surface Irrigation 1181 1448 1347 1459 6626 1.77 Source: Mehta, H.M., et al., (1993).
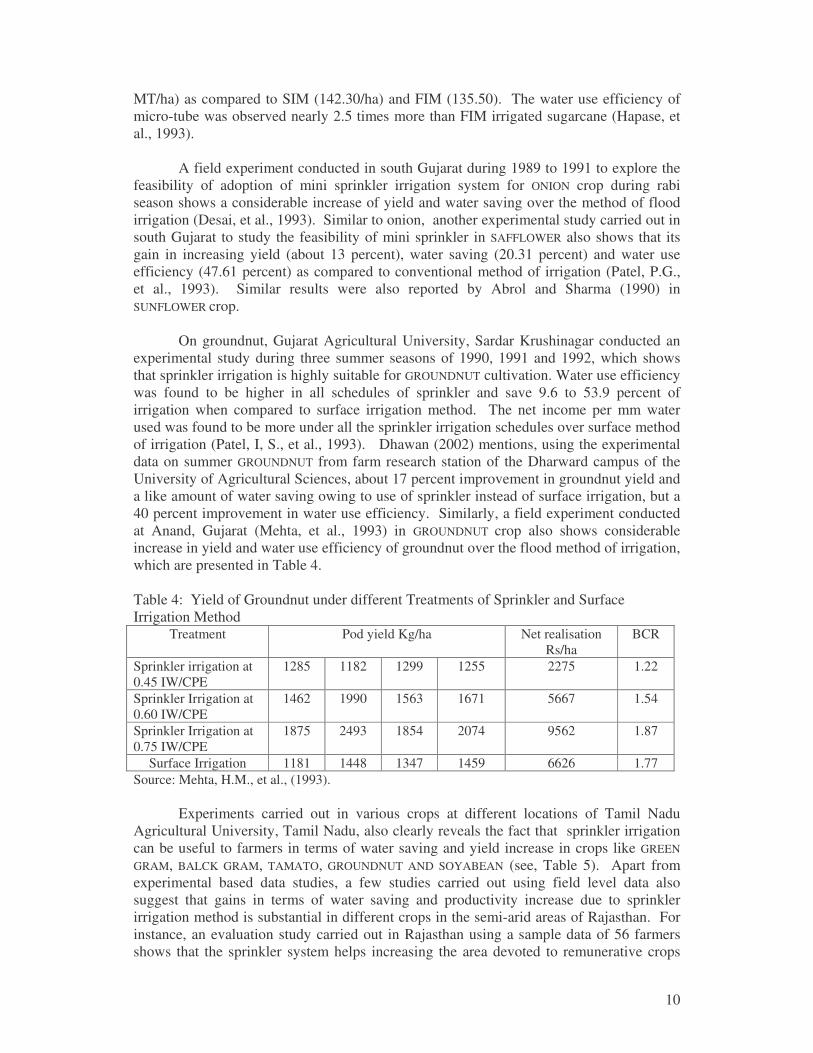
Experiments carried out in various crops at different locations of Tamil Nadu Agricultural University, Tamil Nadu, also clearly reveals the fact that sprinkler irrigation can be useful to farmers in terms of water saving and yield increase in crops like GREEN GRAM, BALCK GRAM, TAMATO, GROUNDNUT AND SOYABEAN (see, Table 5). Apart from experimental based data studies, a few studies carried out using field level data also suggest that gains in terms of water saving and productivity increase due to sprinkler irrigation method is substantial in different crops in the semi-arid areas of Rajasthan. For instance, an evaluation study carried out in Rajasthan using a sample data of 56 farmers shows that the sprinkler system helps increasing the area devoted to remunerative crops
11
like HYV WHEAT and MUSTARD in rabi seasons. The increased irrigated area also generated additional income to the adopters of sprinkler irrigation, besides substantially increasing the wage employment. The study further underlines that the benefits could have perhaps been higher had the power supply been available for a longer duration during the cropping seasons (NABARD, 1989). On the same line, an another study carried out in Barmer district of Rajasthan also indicates that the adoption of sprinkler irrigation increases the gross irrigated area, cropping intensity and helps farmers to switch over to cash crops like CUMIN, ISABGOLE, MUSTARD, etc. Understandably, the study reveals that the SIM is used mainly for irrigating rabi crops, though it was used sparingly for kharif crops like BAJRA in case of monsoon failure (NABARD, 1997). Table 5: Yield and Water Use under Drip and Sprinkler Irrigation Method
Gain over SIM (in %)
Crop Irrigation Method Yield (kg/ha)
Water used (cm)
Yield Water
Water use efficiency (kg/ha/m3)
Sprinkler method 841 14.80 39.70 49.80 5.68 Green gram Surface method 602 29.50 -- -- 2.04 Sprinkler method 2.50cm/0.5 ratio
1405 34.30 3.30 30.40 4.07 Black gram
Surface method 5.0cm/1.0 ratio
1360 49.30 -- -- 2.89
Sprinkler method 2.50cm/0.5 ratio
12167 55.70 -26.21 30.96 21.83 Tamato
Surface method 5.0cm/1.0 ratio
16489 80.70 -- -- 20.42
Sprinkler method 3cm/0.6 ratio
1756 59.10 19.00 -6.70 2.90 Groundnut
Surface method 5cm/0.6 ratio
1476 55.10 -- -- 2.68
Sprinkler method 5cm/1.0 ratio
1634 22.50 -2.00 29.02 3.42 Soyabean
Surface method 5.0cm/1.0 ratio
1636 31.70 -- -- 3.41
Source: Compiled from Rajagopal (1998).
Though a large number of studies showed that SIM is suitable even for foodgrain crops such as wheat, maize, pulses and groundnut, etc, these studies have mainly dealt with the impact of sprinkler irrigation on water saving and yield gain. Seldom studies have dealt with the economic viability of sprinkler investment in foodgrain and oilseed crops, especially using field level data. Given the vast potential of sprinkler irrigation, properly designed field based studies need to be carried out particularly on food grain crops so as to understand the real impact of it. What is the impact of MI on the over-exploitation of groundwater is an another issue, which also needs to be probed using filed level data.

12
3. Trends in Area under Drip and Sprinkler Irrigation2:
The main objective of this section is to explain the past trends in area under micro-irrigation across different states in India. As mentioned earlier, though drip and sprinkler irrigation are classified under micro-irrigation, the trends in the adoption of these new methods of irrigation are not the same across crops and regions. While the adoption of drip is largely found in states like Maharashtra, Andhra Pradesh and Tamil Nadu, sprinkler is largely adopted in states like Haryana, Rajasthan and Madhya Pradesh (INCID, 1994; 1998 and GOI, 2004). Crops that are cultivated under these two methods of irrigation are also not the same. Therefore, the trends in area under these two systems are studied separately. Drip method of irrigation was introduced in India during the early seventies at the Agricultural Universities and other Research Institutions. The scientists at the Tamil Nadu Agricultural University (TNAU), Coimbatore, who are considered to be the pioneers in drip irrigation research in India, have conducted large-scale demonstration in the farmers’ field for various crops, which received encouraging response from the farmers (INCID, 1994). However, the adoption of drip method of irrigation was very slow till mid-eighties mainly because of lack of promotional activities from the State and Central governments. The formation of the National Committee on the Use of Plastics in Agriculture (NCPA) by the Ministry of Petroleum, Chemicals and Fertilisers, Government of India, during 1981 under the Chairmanship of Dr. G. V. K. Rao is termed as the first milestone for the development of micro-irrigation in India (GOI, 2004). With the establishment of 17 different Plasticulture Development Centres (PDCs) across different agro-climatic regions in the country, the NCPA has played a crucial role in the technological development of micro-irrigation in India.3 Besides recommending policy measures to the government, the NCPA also played an important role in promoting drip method of irrigation through conducting seminars focusing on micro-irrigation (GOI, 2004). Apart from the government efforts, some research institutes and private drip set manufactures have also been playing an important role in promoting drip method of irrigation in India. For instance, The Report of Task Force on Micro Irrigation mentions “Jain Irrigation Systems Ltd., Jalgaon has been playing a pioneering role since its inception in 1989 for promoting micro irrigation” (GOI, 2004, p. 124). The establishment of the Jain Irrigation Systems Limited in 1988-89 marked a watershed in the spread of this technology. Their approach was unique, committed, scientific and persistent. A “Systems approach” from concept to commissioning was adopted by them. Since drip irrigation is a new technology and a capital-intensive venture, government operates schemes for drip irrigation with subsidy. In states like Maharashtra, both the Central and State governments are operating schemes for promoting drip method
2 One of the serious constraints faced by the researchers working on micro-irrigation is the data availability. Though most of the area currently cultivated under micro-irrigation is established through various government sponsored schemes, coverage of area under MI by states and by crops are seldom published by any single agency. This does not allow the researchers to study the trends and determinants of micro-irrigation across states in detail. This section is written with great data constraint. 3 NCPA was latter renamed as the National Committee on Plasticulture Applications in Horticulture (NCPAH) due to the prominent role plasticulture plays in the productivity of horticultural crops.

13
of irrigation. Central scheme was started during 1982-83 (during the Sixth Plan) by the Ministry of Water Resources (Minor irrigation Division), Government of India. Through this scheme, the Government of India provided a subsidy of 50 percent to the farmers with the matching contribution from the State governments for installation of micro-irrigation devices. Of the total amount of subsidy, 75 percent was allocated for small and marginal farmers and the balance of 25 percent for other group of farmers. Government of Maharashtra has made pioneering efforts for the successful adoption of drip irrigation system and to make cost effective by providing subsidies to small and marginal farmers to the extent of Rs. 2282.35 lakh during the period from 1986-93 (INCID, 1994). As per the latest information available from the Economic Survey of Maharashtra: 2002-03, an amount of Rs. 432 crore (Rs. 332 for drip irrigation and Rs. 100 crore for sprinkler irrigation) have been distributed to the cultivators in the form of subsidy by the government to promote micro-irrigation up to March 2002 (GOM, 2003). However, the Central scheme of drip irrigation did not get good response during the Seventh Plan since the subsidy was limited to only small and marginal farmers and due to capital paucity this group could not afford the drip systems even at the subsided rate. After knowing the ground realities, many new measures were incorporated under the new scheme introduced during the eighth plan. Under the new schemes, the subsidy amount is limited to either 50 percent of the cost or Rs. 15000/ha whichever is lower. The government of India has contributed the entire 50 percent of subsidy upto the financial year 1994-95 and thereafter the State governments have to contribute 10 percent towards subsidy for the years 1995-96 and 1996-97, which will add upto 50 percent with Centre’s contribution for 40 percent. However, a beneficiary can avail subsidy for a maximum area of one hectare only.
F ig u r e 1 : A r e a u n d e r D r ip M e t h o d o f I r r ig a t io n : In d ia
0
5 0 0 0 0
1 0 0 0 0 0
1 5 0 0 0 0
2 0 0 0 0 0
2 5 0 0 0 0
3 0 0 0 0 0
3 5 0 0 0 0
4 0 0 0 0 0
4 5 0 0 0 0
1985
-86
1986
-87
1987
-88
1988
-89
1989
-90
1990
-91
1991
-92
1992
-93
1993
-94
1994
-95
1995
-96
1996
-97
1997
-98
1998
-99
1999
-200
0
2000
-01
2001
-02
2002
-03
Are
a
The subsidy scheme has undergone lot of changes over the years. As of 1999-2000, the Government of India provided assistance of drip installation for horticultural crops at 90 percent of the cost of the system or Rs. 25000 per hectare, whichever is less for small and marginal, SC/ST and women farmers and 70 percent of the total cost or Rs.

14
25000 per hectare, whichever is less for other category of farmers. Assistance was also provided for drip demonstration at Rs. 22500 or 75 percent of the system cost per hectare whichever is less (GOI, 2004). Government of Maharashtra has also been providing subsidy under State schemes since 1986-87. It varies from 30 to 50 percent of the capital cost or Rs. 12250 to 20500/ha depending upon the landholding size and community of the farmers. The Government of Maharashtra announced in 1992 that subsidy would be given for all farmers irrespective of their landholding. That is, currently both the schemes (Central and State sponsored schemes) supply 50 percent of the capital cost as subsidy for all types of farmers in Maharashtra. Coverage of Drip Irrigation in India: Drip method of irrigation was initially introduced in the early seventies by the agricultural universities and other research institutions in India with the aim to increase the water use efficiency in crop cultivation. The development of drip irrigation was very slow in the initial years and significant development has been achieved especially since 1990s. Due to various promotional schemes introduced by the Government of India and states like Maharashtra, area under drip method of irrigation has increased from 1500 ha in 1985 to 70589 ha in 1991-92 and further to 246000 ha in 1997-98 (INCID, 1994; AFC, 1998). According to the latest information, the area under DMI estimated to have been increased to about 4.50 lakh hectares, which includes about 3.50 lakh hectares covered under the Government of India Schemes (see, Figure 1). This estimate is based on the information available from GOI departments, which have been operating subsidy schemes for promoting drip method of irrigation. However, as mentioned in the Report of the Task Force on Microirrigation, a large number of institutions, commercial organisations, universities, large public/private sector companies, NGOs, etc., have taken up drip irrigation in the country for their farms/crops, which do not get reflected in the data available with GOI departments. Therefore, approximately, another 1,00,000 hectares are covered under drip systems by these organisations, whereby the total area under drip irrigation system in the country would be about 5,00,000 hectares as of March 2003 (GOI, 2004, pp. 130-131). Table 6: State-wise Area under Drip Method of Irrigation
State Area (‘000 ha) Percent to Total Area 1991-92 1997-98 2000-01 1991-92 1997-98 2000-01 Maharashtra 32.92 122.995a 160.28 44.64 50.00 53.16 Karnataka 11.41 40.800b 66.30 16.17 16.58 18.03 Tamil Nadu 5.36 34.100 55.90 7.59 13.86 15.20 Andhra Pradesh 11.59 26.300 36.30 16.41 10.70 9.88 Gujarat 3.56 7.000 7.60 5.05 2.85 2.07 Kerala 3.04 4.865 5.50 4.30 1.98 1.50 Orissa 0.04 2.696 1.90 0.06 1.10 0.52 Haryana 0.012 1.900 2.02 0.17 0.77 0.55 Rajasthan 0.30 1.600 6.00 0.43 0.65 1.63 Uttar Pradesh 10.11 1.500 2.50 0.16 0.61 0.68 Punjab 0.02 1.100 1.80 0.03 0.45 0.49 Other States 2.127 1.150 5.40 3.00 0.47 1.47 Total 70.59 246.006 367.70 100.00 100.00 100.00
Notes: a- includes state subsidy scheme area of 58498 ha.; b- includes area under central and state schemes for development of oil palm and sugarcane. Sources: AFC (1998) and GOI (2004).

15
Despite having enormous potential and prospects, the development of drip irrigation does not match the expectations in most of the states. Table 6 presents state-wise area under drip method of irrigation for three time points: 1991-92, 1997-98 and 2000-01. It is evident from the table that drip irrigated area has increased substantially between 1991-92 and 2000-01 in all the states of India. In all three-time points, Maharashtra state alone accounted for nearly 50 percent of India’s total drip irrigated area followed by Karnataka, Tamil Nadu and Andhra Pradesh.4 Over the last ten years, significant growth has been achieved in area under drip method of irrigation in absolute term in many states. However, drip irrigated area constitutes a very meager percentage in relation to gross irrigated area in all the states in India. For instance, during 2000-01, the share of drip-irrigated area to gross irrigated area was just 0.48 percent and about 1.09 percent in relation to total groundwater irrigated area of the country. Table 7: Crop-wise Area under Drip Method of Irrigation in India: 1997-98.
Crop’s Name Area Leading States Coconut 48360
(19.66) Karnataka (24.00, Tamil Nadu (21.20)
Grapes 29630 (12.04)
Maharashtra (24.10), Andhra Pradesh (2.20), Karnataka (3.00)
Banana 26460 (10.76)
Maharashtra (24.50)
Citrus 22210 (9.03)
Maharashtra (15.00), Andhra Pradesh (4.80)
Mango 21860 (8.89)
Andhra Pradesh (9.22), Maharashtra (5.00), Karnataka (2.30), Tamil Nadu (4.00), Gujarat (1.20)
Pomegranate 15250 (6.20)
Maharashtra (11.40), Karnataka (2.00)
Other crops 82236 (33.43)
Total all crops 246006 (100.00)
Note: Total will not tally as we have not included all the crops here. Figures in brackets are percentage to total area. Source: AFC (1998). In terms of crop-wise coverage of DIM, although over 80 crops are proved to be suitable for drip method of irrigation, only a few crops have been dominating in the total area under drip irrigation so far. As of 1997-98, crops like coconut, grapes, banana, citrus, mango and pomegranate together have accounted for nearly 67 percent of total drip irrigated area (see, Table 7). In all these crops, states like Maharashtra, Andhra Pradesh,
4 A number of factors are responsible for the rapid development of drip irrigation in Maharashtra. First, state government is very keen in promoting drip irrigation on a large scale by providing subsidy, technical and extension services to the farmers. Maharashtra government has been providing subsidy since 1986-87 onwards through state schemes. Second, area under irrigation from both surface and groundwater is quite low and hence, many farmers have adopted drip method of irrigation to avoid water scarcity largely in divisions like Nashik, Pune, etc. Third, owing to continuous depletion of groundwater, farmers were not able to cultivate wide spaced and more lucrative crops like grapes, banana, pomegranate, orange, mango, etc. by using surface method of irrigation in many regions. As a result, farmers had to adopt drip irrigation as these crops are most suitable for drip method of irrigation. Importantly, the farmers who adopted drip irrigation initially for certain crops have realised the importance of drip irrigation in increasing the water saving and productivity of crops. This has further induced many farmers to adopt drip method in some of the regions in Maharashtra.

16
Tamil Nadu and Karnataka account for a major share of the area. More importantly, out of 26,460 ha of banana’s total area, Maharashtra state alone accounted for as much as 93 percent at the end of 1997-98. It clearly suggests that despite having severe water scarcity in different regions in the country, the adoption of drip method of irrigation is very much concentrated only in a few States. If we really want to avoid aggravating supply-demand gap in irrigation water in the future, it is essential to bring more water-intensive crops under drip method of irrigation.
Table 8: Scheme-wise Area under Drip Method of Irrigation: 1997-98 Scheme Area (ha) Percent to Total Centrally Sponsored Scheme 186644 64.64 Maharashtra State Scheme 58498 19.32 Oil palm and Sugarcane 884 0.29 Without Subsidy (private) 56780 18.75 Total 302806 100.00
Source: AFC (1998). Studies based on research station data as well as farm level sample survey data have proved that drip method of irrigation has the capacity to increase water saving and productivity of crops significantly when compared to the crops cultivated under flood method of irrigation (INCID, 1994). However, drip method of irrigation is still essentially considered to be the scheme of the government. As of 1997-98, area under DMI other than government schemes (without subsidy) accounted for only about 18 percent of India’s total drip irrigated area (see, Table 8). Studies need to be carried out as to why the individual farmers without subsidy are not willing to adopt drip method of irrigation despite substantial benefits from it. Trends in Area under Sprinkler Irrigation: Sprinkler irrigation method is relatively old for Indian farmers as compared to drip irrigation method. Available information suggests that sprinkler was introduced in India during the mid-fifties for plantation crops like coffee and tea. During mid-seventies, progressive farmers in Narmada valley in MP, southern part of Haryana and north east part of Rajasthan started using sprinkler particularly during summer to avoid the shortage of water (INCID, 1998). Over the years, the adoption of sprinkler system penetrated into larger area in states like Haryana, Rajasthan, MP, Maharashtra and Karnataka. Unlike drip irrigation, detailed and accurate statistics are lacking for sprinkler irrigation. The gross area under sprinkler irrigation has increased from 0.23 mha in 1985 to 0.67 mha in 1998. According to the latest information compiled by the National Committee on Plasticulture Applications in Horticulture (NCPAH), the total area under sprinkler in the country is estimated to have increased to 1.63 mha. This is almost 300 percent higher than the present area under drip method of irrigation.
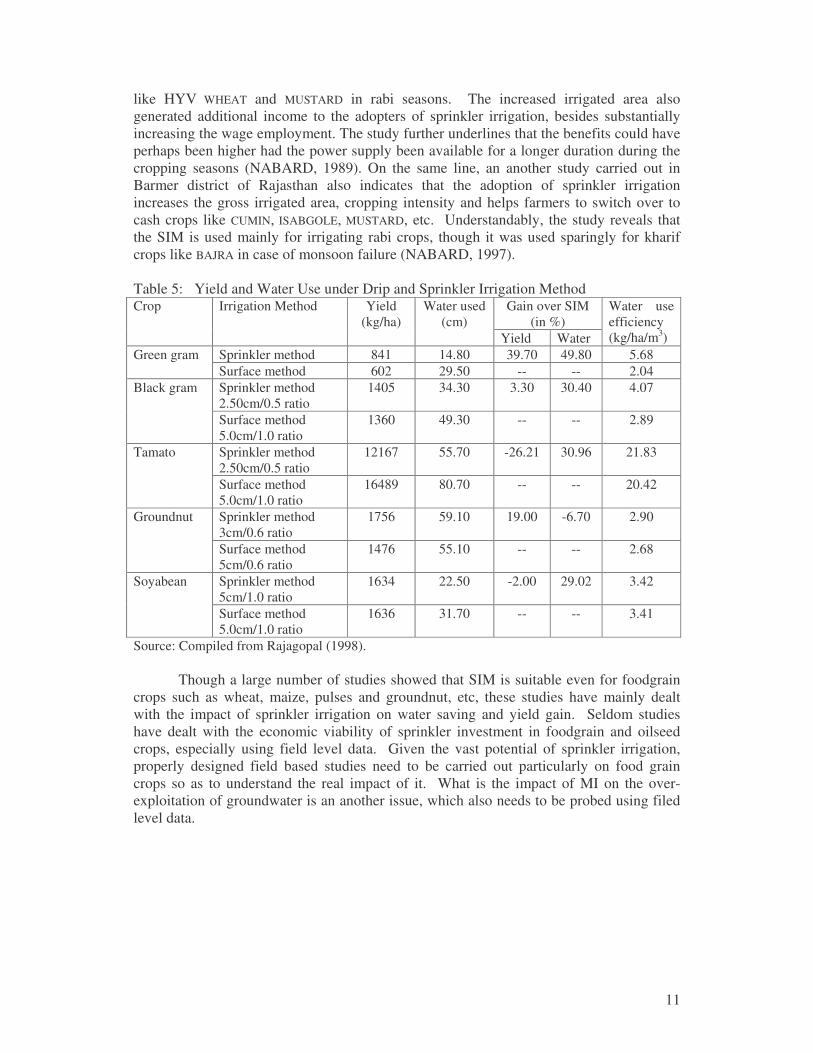
As in the case of drip irrigation method, the spread of sprinkler irrigation is also not the same across the states. State-wise area under sprinkler irrigation shows that it is mainly concentrated in Central and northern part of the country (Table 9). During the year 2004-05, states like Haryana (0.49 mha), Rajasthan (0.42 mha), West Bengal (0.14 mha) and Maharashtra (0.11 mha) together accounted for about 70 percent of India’s total drip irrigated area. The reasons for large adoption of sprinkler irrigation are different for different states. Though MP receives medium rainfall, factors like unpredictable rainfall
17
and long dry spells during the summer encouraged the farmers to adopt sprinkler irrigation for crops like soyabean in various part of the state. In the case of Haryana, the soil condition, topography and the climates that are prevailing in the south western part of the state especially in districts of Bhiwani, Mahindergarh, Rothak, Sirsa and Hisar have prompted the adoption of sprinkler irrigation. Similarly, favourable cropping pattern and water scarcity during the summer season are found to be the main reasons for the relatively higher adoption of sprinkler irrigation in Rajasthan (INCID, 1998). Table 9: State-wise Area under Sprinkler Irrigation: 1997-98 and 2004-05
Area Percent to Total Area States 1997-98 2004-05* 1997-98 2004-05*
1. Madhya Pradesh 149980 85000 22.78 5.20 2. West Bengal 120040 135000 18.23 8.26 3. Assam 90000 125000 13.67 7.65 4. Haryana 83600 490000 12.70 29.97 5. Rajasthan 47850 425000 7.27 25.99 6. Karnataka 41900 125000 6.36 7.65 7. Maharashtra 33120 110000 5.03 6.73 8. Tamil Nadu 32130 10000 4.88 0.61 9. Gujarat 27740 11,000 4.21 0.67 10. Andhra Pradesh 17090 55000 2.60 3.36 11. Uttar Pradesh 7360 10000 1.12 0.61 12. Kerala 5800 8000 0.88 0.49 13. Bihar 160 500 0.02 0.03 14. Himachal Pradesh 70 250 0.01 0.02 15. Jammu & Kashmir 30 150 0.00 0.01 16. Orissa 400 12000 0.06 0.73 17. Punjab 200 10000 0.03 0.61 18. Others 500 23097 0.08 1.41 Total 658500 1634997 100.00 100.00
Note: * - Figures are approximate estimated based on graph provided by NCPAH. Source: INCID (1998) and NCPAH (2005).
Though the area under sprinkler irrigation is much higher than those under drip irrigation method, there are no reliable details available about the composition of crops that are cultivated presently using this method of irrigation. INCID (1998) report presents a whole lot of information about the sprinkler method, but does not provide where and what crops are cultivated under this method. In fact, reliable and time series data on micro-irrigation is seldom available even for research purpose. Agencies involved in promoting MI should make all efforts to publish the data on the development of micro-irrigation in terms of crop composition, area by state, districts and different size class, area by state promoted scheme and other schemes. Unless the present development of MI is clearly known, it may not be easily possible to suggest the ways and means for increasing the adoption of these water saving technologies. 4. Efficiency of Drip and Sprinkler Irrigation: One of the main reasons for adopting micro-irrigation in crop cultivation is to save water and increase the efficiency of water use. Over centuries all over the world, irrigation water has been predominantly applied for crops using flood/gravity method. Generally, under conventional (flood/gravity) method of irrigation, water is supplied

18
through unlined canal and field channels for crops where controllability of water is not easily possible and therefore, conveyance and distribution losses are substantial. Unlike conventional method of irrigation, both sprinkler and drip irrigation supply water to crop using pipe network along with drippers, emitters and nozzles. As a result of supplying water directly to the crop or to the field, the conveyance and distribution losses are found to be completely absent under micro-irrigation method. Table 10: Irrigation Efficiencies under Different Methods of Irrigation (Percent)
Methods of Irrigation Irrigation Efficiencies Surface Sprinkler Drip
Conveyance efficiency 40-50 (canal) 60-70 (well)
100
100
Application efficiency 60-70 70-80 90 Surface water moisture evaporation 30-40 30-40 20-25 Overall efficiency 30-35 50-60 80-90
Source: Sivanappan (1998).
It is difficult to measure the water use efficiency under different methods of irrigation at the farmers’ field as each farmer uses different types of pumpsets (where efficiency varies considerably) and pipe network. Estimates carried out at different research stations under different methods of irrigation reveal the comparative efficiency of irrigation under different methods (see, Table 10). While the conveyance efficiency under surface method of irrigation is estimated to be only in the range of 40-50 percent in canal and 60-70 percent in well, the same is estimated to be 100 percent in both sprinkler and drip method of irrigation. As mentioned earlier, the higher level of conveyance efficiency under micro-irrigation is mainly because of application of water by pipe network, where seepage and other leakages are also completely absent. A less than 50 percent of conveyance efficiency in surface irrigation method suggests that by converting all the surface method of irrigation into micro-irrigation, we would be able to double the irrigated area without constructing any new irrigation projects. Table 11: Water Use Efficiency (q/ha/cm) in Surface, Sprinkler and Drip Irrigated Crop
Sprinkler Vs. Flood Method Drip Vs. Flood Method Water Use efficiency Water Use efficiency Crops FMI SMI Crops FMI DIM 1. Wheat 0.93 1.79 Papaya 0.57 3.13 2. Bajra 0.39 1.07 Ashgourd 1.29 1.63 3. Jowar 0.19 0.59 tomato 1.24 8.29 4. Sorghum (kharif) 2.45 4.58 ladys finger 1.87 13.15 5. Maize (kharif) 1.22 2.01 Brinjal 3.11 6.67 6. Barley 1.35 3.59 Sweet potato 0.67 2.34 7. Gram 0.37 1.27 Radish 0.23 1.10 8. Oilseeds 0.14 0.31 Beet 0.07 0.50 9. Groundnut(summer) 0.26 0.47 Potato 11.79 17.21 10. Sunflower (rabi) 0.53 0.96 Watermelon 3.68 11.03 11. Chillies (kharif) 0.48 0.89 Chillies 0.39 1.46 12. Garlic 0.83 1.23 Bottlegourd 4.53 7.54 13. Onion (summer) 4.29 7.94 Onion 1.54 2.03 14. Cotton 0.17 0.24 cotton 0.25 0.61 15. Sugarcane 3.23 4.61 Sugarcane 8.10 21.27
Source: Computed from INCID (1994 and 1998).

19
Application efficiency refers to water use at the farm level. Estimates suggests that there are wide variation here too in the level of efficiency. Water can be applied at a required quantity and time under micro-irrigation and therefore, the application efficiency is always higher under micro-irrigation as compared to conventional surface irrigation method. The overall application efficiency is estimated to be 60-70 percent in surface irrigation, whereas the same comes to 70-80 percent for sprinkler and 90 percent for drip irrigation method. Because of flooding of water under surface irrigation method, large quantity of water is wasted in the form of evaporation and seepage losses and thus, the application efficiency is always lower while applying water by surface method. Since water is applied directly to the root zone of the crop at a required quantity by drip method of irrigation, the application efficiency is always nearing 100 percent. The application efficiency is estimated to be relatively lower under sprinkler irrigation as compared to drip method because of two reasons. First, sprinkler irrigation is often affected by wind interference which ultimately reduces the efficiency. Second, unlike drip method, sprinkler supplies water to whole of cropped area and therefore, water losses would obviously be higher. Unlike application efficiency, there are no variations between surface method and sprinkler method of irrigation in the case of surface water moisture evaporation. In both surface and sprinkler method, it is estimated to be the same, varying from 30 to 40 percent. In the case of drip, the surface water moisture evaporation is only 20-25 percent. Drip method of irrigation does not allow water to spread beyond the root zone of the crop and therefore, the water moisture evaporation is very less in drip irrigation. Because of very high level of conveyance and application efficiency and low water moisture evaporation, the overall water use efficiency is very high (80-90 percent) under drip method of irrigation as compared to sprinkler (50-60 percent) and surface method of irrigation (30-35 percent). Therefore, drip irrigation appears to be the most efficient method of irrigation in terms of absolute use of water for crop cultivation. Drip irrigation method also appears to be efficient method in terms of moisture availability to crops (see, Figure 2).
Apart from increasing water use efficiency in absolute term, there is also a need to increase water use efficiency in terms of productivity (water productivity) because of fast decline of irrigation water potential and growing demand for water from different
Figure 2: Moisture Availability for Crops in Different Irrigation Methods
DRIP METHOD
SPRINKLER METHOD
SURFACE METHOD
0 5 10 15 20
MO
ISTU
RE
CO
NTE
NT
DAYS
WILTING POINT (15 atm)

20
sectors. In order to satisfy the growing demand for various agricultural commodities, it is essential to increase the water productivity from the existing level. Available studies based on experimental data suggest that the crops being cultivated under micro-irrigation require relatively less amount of water to produce one unit of output. Data presented in Table 11 on various crops clearly confirms that the water productivity is much higher under both sprinkler and drip irrigation as compared to flood irrigation method. Among sprinkler and drip method of irrigation, drip method appears to be more efficient in terms of producing output per unit of water. Since the application efficiency of water is much higher in drip irrigation method, the water use efficiency in terms of productivity is also substantially higher in drip method. Net gain in terms of money value from each unit of water is also estimated to be higher under micro-irrigation method as compared to surface and other improved methods (see, Table 12). Table 12: Water Use Efficiency as Net Benefit in Rs. Per mm of Water Use
Improved Surface Irrigation Crop Surface Sprinkler Drip With PVC network
With field channel
Cotton 18.40 28.11 -- 33.70 25.50 Pigeon pea 21.36 18.49 -- 33.62 28.71 Wheat 7.28 9.16 -- 11.56 8.50 Sorghum (R) 9.90 15.45 -- 18.19 13.20 Gram 13.77 22.21 -- 25.47 18.38 Sunflower (R) 7.83 12.08 -- 14.32 10.41 Maize 7.79 11.66 -- 14.12 10.30 Groundnut (HW) 14.71 27.11 -- 28.61 20.28 Sugarcane 12.52 21.91 18.03 23.70 17.21 Sweet Orange 61.82 119.98 116.02 122.76 86.88 Source: Holsambre, et al., (1998).
On the whole, the estimates presented above suggest that the efficiency of water use is substantially higher under SIM and DIM in comparison to the efficiency of flood irrigation method, mainly because of reduction in conveyance and distribution losses. It also clearly suggests that the present level of water use efficiency under surface irrigation method is very low, which can be increased substantially by focusing more on demand management strategies such as drip and sprinkler. This would also help increasing the irrigated area without exploiting the limited irrigation potential.
5. Potential Area for Drip and Sprinkler Irrigation in India:
It is clear from the foregoing chapters that drip and sprinkler method of irrigation has many advantages over flood method of irrigation, which is predominantly followed in most of the countries. Despite the fact that micro-irrigation involves relatively larger fixed investment, benefit-cost ratio estimated using farm level data clearly suggests that the investment in micro-irrigation is economically viable to farmers, even without any states’ subsidy. Although micro-irrigation has proved to be a very useful method for sustainable use of irrigation water, not many studies have attempted to estimate the total potential area for drip and sprinkler method of irrigation for different states in India. Besides helping to understand the overall potential of the country, this kind of estimate would be useful for making policy decision, fixing targets and allocation of funds for utilising the potential.

21
Therefore, in this section, we try to estimate the total potential area for drip and sprinkler irrigation method across different states as well as for the country as a whole. Available Estimate on Potential Area:
A few attempts have already been made to estimate the potential area for drip and sprinkler irrigation for the country as a whole. Let us briefly discuss the available estimates before getting into our own estimate. While the NCPA (1990) estimated about 18.20 mha as a potential area for DIM, the Task Force on Micro-Irrigation (GOI, 2004) estimated about 27 mha as a potential area for the country as a whole. In the case of sprinkler irrigation, the potential estimated is much higher than drip irrigation method. As per the estimate of INCID (1998), the total potential area comes to 42.5 mha, but the Task Force on Micro-Irrigation placed an area of 69.5 mha as potential for sprinkler irrigation (see, Table 13).
Table 13: Available Estimate on Potential Area for Drip and Sprinkler Irrigation in India Crop INCID
(sprinkler) TFMI (drip) TFMI
(sprinkler) Cereals 27.6 -- 27.6 Pulses 4.2 -- 7.6 Oilseeds 11.1 3.8 4.9 Cotton 2.6 7.0 8.8 Vegetables 2.5a 3.6 6.0 Spice and condiments 1.2 1.4 2.4 Flowers, Medicinal and aromatic plants -- -- 1.0 Sugarcane 3.3 4.3 4.3 Fruits -- 3.9 3.9 Coconut, plantation crops, oil palm -- 3.0 3.0 Total 42.5 27.0 69.5 Note: a – includes fruits and vegetables; Sources: INCID (1998) and GOI (2004).
There appears to be some limitations with the available estimates. First of all,
there are clear discrepancies in the estimates between the sources. INCID (1998) placed 42.5 mha as potential area for sprinkler irrigation, whereas TFMI recorded 69.5 mha as potential. Why is this wide variation? Second, while making any estimate, it is necessary to provide the procedures that are followed for the same. However, both the sources have not provided any explanation as to what method is followed for estimating the potential area. Third, it is not very clear whether this estimate includes irrigated cropped area alone or irrigated plus un-irrigated cropped area. It appears that TFMI estimate includes both irrigated and un-irrigated cropped area (example cotton area). Since water sources are needed to use micro-irrigation, one should not include un-irrigated cropped area while estimating potential area for drip and sprinkler irrigation. Moreover, both the estimates have not provided state-wise potential, which are essential for making policy decision on micro-irrigation for different states. Keeping in view the limitations of the existing estimates, we have made a fresh attempt to estimate the potential area for drip and sprinkler irrigation separately covering all the major states. Potential Area for Drip Irrigation:
As reported elsewhere in the paper, India has enormous potential for drip method of irrigation. Potential area for DIM is also expected to increase faster due to fast decline

22
of irrigation potential in different regions in the country. Various crops that are highly suitable for drip method of irrigation are extensively cultivated in different parts of India. Available information shows that about 80 crops, both narrow and wide spaced crops, can be grown under drip method of irrigation in India. Due to various measures taken by the central and state governments along with the support of drip-set manufactures, the area under DIM has increased phenomenally in recent years. However, the achievement of area seems to be very less compared to the total potential area that exists in India.
Table 14: State-wise Potential for Drip Method of Irrigation: 2000-01
(area in ‘000 ha)
States Pulses S.cane C &S F & V Oil
seeds Cotton Others Total 1. AP 21 360 233 328 423 192 127 1684 (8.02) 2. Assam - - - - 2 - 0 2 (0.01) 3. Bihar 19 33 8 286 55 - 13.7 415 (1.97) 4. Gujarat 68 255 173 295 727 631 116 2265 (10.78) 5. Haryana 59 140 5 58 350 554 0 1166 (5.55) 6. HP 6 1 2 14 3 @ 0 26 (0.12) 7. J & K 4 @ 1 20 55 @ 1 81 (0.39) 8. Karnataka 80 417 160 200 500 73 72 1502 (7.15) 9. Kerala - 3 36 29 166 - 0 234 (1.11) 10. MP 937 74 117 145 207 144 0 1624 (7.73) 11. Maharashtra 267 595 135 599 232 131 6 1965(9.35) 12. Orissa 64 31 50 210 53 - 4 412(1.96) 13. Punjab 49 116 4 137 116 721 9 1152(5.48) 14. Rajasthan 382 13 410 89 1311 496 1 2702(12.86) 15. TN 60 315 73 276 553 65 8 1350(6.43) 16. UP 624 1844 30 743 719 5 13 3978(18.93) 17. WB - 8 - - 326 - 0 334 (1.59)
INDIA 2652 (12.62)
4217 (20.07)
1446 (6.88)
3508 (16.07)
5826 (27.73)
3013 (14.34)
347 (1.65)
21009 (100)
Notes: S.cane- sugarcane; C&S – condiments & spices; F & R – fruits & vegetables; Figures in brackets are percentages to total; @ - below 500 hectares. Sources: Computed using GOI (2003); www.agricoop.nic.in
Micro-irrigation is not only suitable for those areas that are presently under cultivation, but it can also be operated efficiently in undulating terrain, rolling topography, hilly areas, barren lands and areas which have shallow soils (Sivanappan, 1994). Since most of the potential areas are not under cultivation presently, we can broadly divide the total potential into two categories as “distant potential” and “core potential” for the purpose of analysis. “Distant potential” refers to all those areas that are suitable for drip method of irrigation, but may not be under cultivation presently. Lands (area) that are falling under the categories of barren and unculturable lands, culturable wastelands and fallow lands can be treated as “distant potential” of DIM. In India, as per the land utilisation data of 2000-01, about 56.28 million hectares of lands are available in these categories. Unlike FIM, land-leveling and ploughing are not necessary for cultivating crops (especially horticultural crops) under DIM. Therefore, without incurring heavy expenditures on land reclamation activities, these areas can be brought under cultivation using drip method of irrigation in a phased manner by a properly designed special development programme.

23
However, since some source of irrigation is essential for adopting micro-irrigation, we have excluded all those areas that are suitable for drip irrigation, but not currently under irrigation. That is, only those suitable crops that are currently cultivated under irrigation is treated as potential area for drip irrigation. The important crops that are suitable for DIM are pulses, groundnut and other oilseed crops, sugarcane, fruits, vegetables, flowers, condiments and spices, cotton, etc. The state-wise area under these crops presented in Table 14 shows that the total potential area for drip irrigation is about 21.01 mha for the country as whole, which is almost six million hectares less than the estimate made by the Task Force on Micro Irrigation (GOI, 2004)5. Of the total potential area, oilseed crops alone accounts for 27.70 percent, followed by sugarcane (20.07 percent), fruits and vegetables (16.70 percent). As expected the potential area available from each state varies considerably, because of varied cropping pattern and irrigation facility. Among the states, Uttar Pradesh has more potential followed by Rajasthan, Gujarat, Maharashtra, Punjab and Madhya Pradesh. In fact, Uttar Pradesh, Rajasthan and Punjab together account for about 50.26 percent of India’s total potential area for drip method of irrigation. Potential for Sprinkler Irrigation:
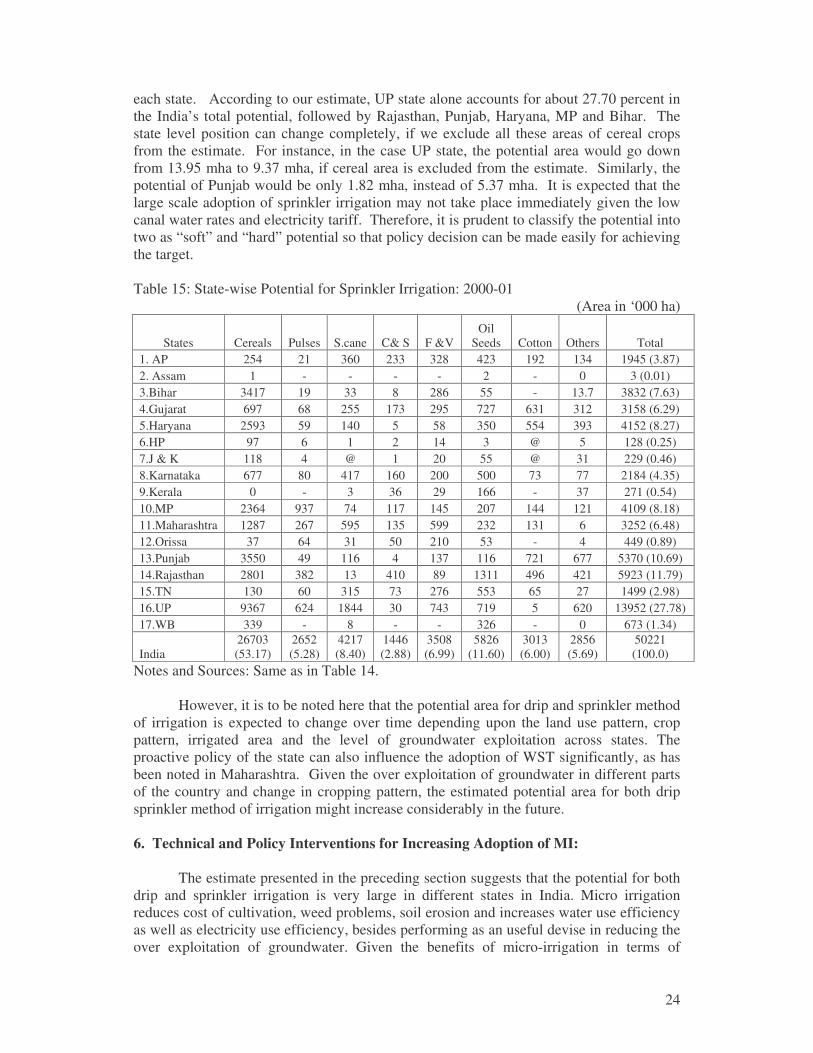
It is mentioned earlier that the characteristics of sprinkler irrigation method are somewhat different from drip method of irrigation. While drip method of irrigation is highly suitable for wide spaced horticulture and other crops, sprinkler irrigation can be used closely grown crops like cereals and millets besides using for horticultural crops. Therefore, the potential area for sprinkler irrigation in countries like India would be much higher than those available for drip irrigation, because of predominant cultivation of cereal crops under irrigated condition. As in the case of drip irrigation, sprinkler irrigation can also be used in all kind of terrain conditions - undulating terrain, rolling topography, hilly areas, barren lands and areas which have shallow soils (INCID, 1998). However, since these areas are not currently under cultivation, we have excluded these from the estimate. In order to estimate the total potential area for sprinkler irrigation, we have considered only those suitable crops presently cultivated under irrigated condition. The only major difference in the crop pattern of drip and sprinkler is cereal crops. Though some experimental studies suggest that sprinkler irrigation can also be used efficiently for cultivating paddy crop (Kundu, et al., 1998), we have excluded it from the estimate as we have not seen any study on paddy based on Indian condition. The estimate presented in Table 15 shows that the India’s total potential for sprinkler irrigation would be about 50.22 mha. If we exclude the area under cereal crops from the estimate, the total potential would only be about 23.52 mha, which is almost equivalent to the potential area available for drip irrigation method. The total potential can go up to 74.23 mha, if paddy area is included for estimation. Among different crops suitable for SIM, cereal crops alone accounts for 53.17 percent followed by oilseeds (11.60 percent), sugarcane (8.40 percent), fruits and vegetables (7.00) and cotton (6.00). The crop-wise estimate suggests that the water can be substantially saved, if we are able to bring all those cereal crops under sprinkler irrigation method.
Similar to drip potential area, the potential area available for SIM also varies across the states, because of differences in cropping pattern and irrigation availability in
5 This estimate is also matching with the country level estimate earlier made by Narayanamoorthy (2004).
24
each state. According to our estimate, UP state alone accounts for about 27.70 percent in the India’s total potential, followed by Rajasthan, Punjab, Haryana, MP and Bihar. The state level position can change completely, if we exclude all these areas of cereal crops from the estimate. For instance, in the case UP state, the potential area would go down from 13.95 mha to 9.37 mha, if cereal area is excluded from the estimate. Similarly, the potential of Punjab would be only 1.82 mha, instead of 5.37 mha. It is expected that the large scale adoption of sprinkler irrigation may not take place immediately given the low canal water rates and electricity tariff. Therefore, it is prudent to classify the potential into two as “soft” and “hard” potential so that policy decision can be made easily for achieving the target. Table 15: State-wise Potential for Sprinkler Irrigation: 2000-01
(Area in ‘000 ha)
States Cereals Pulses S.cane C& S F &V Oil
Seeds Cotton Others Total 1. AP 254 21 360 233 328 423 192 134 1945 (3.87) 2. Assam 1 - - - - 2 - 0 3 (0.01) 3.Bihar 3417 19 33 8 286 55 - 13.7 3832 (7.63) 4.Gujarat 697 68 255 173 295 727 631 312 3158 (6.29) 5.Haryana 2593 59 140 5 58 350 554 393 4152 (8.27) 6.HP 97 6 1 2 14 3 @ 5 128 (0.25) 7.J & K 118 4 @ 1 20 55 @ 31 229 (0.46) 8.Karnataka 677 80 417 160 200 500 73 77 2184 (4.35) 9.Kerala 0 - 3 36 29 166 - 37 271 (0.54) 10.MP 2364 937 74 117 145 207 144 121 4109 (8.18) 11.Maharashtra 1287 267 595 135 599 232 131 6 3252 (6.48) 12.Orissa 37 64 31 50 210 53 - 4 449 (0.89) 13.Punjab 3550 49 116 4 137 116 721 677 5370 (10.69) 14.Rajasthan 2801 382 13 410 89 1311 496 421 5923 (11.79) 15.TN 130 60 315 73 276 553 65 27 1499 (2.98) 16.UP 9367 624 1844 30 743 719 5 620 13952 (27.78) 17.WB 339 - 8 - - 326 - 0 673 (1.34)
India 26703 (53.17)
2652 (5.28)
4217 (8.40)
1446 (2.88)
3508 (6.99)
5826 (11.60)
3013 (6.00)
2856 (5.69)
50221 (100.0)
Notes and Sources: Same as in Table 14. However, it is to be noted here that the potential area for drip and sprinkler method of irrigation is expected to change over time depending upon the land use pattern, crop pattern, irrigated area and the level of groundwater exploitation across states. The proactive policy of the state can also influence the adoption of WST significantly, as has been noted in Maharashtra. Given the over exploitation of groundwater in different parts of the country and change in cropping pattern, the estimated potential area for both drip sprinkler method of irrigation might increase considerably in the future. 6. Technical and Policy Interventions for Increasing Adoption of MI: The estimate presented in the preceding section suggests that the potential for both drip and sprinkler irrigation is very large in different states in India. Micro irrigation reduces cost of cultivation, weed problems, soil erosion and increases water use efficiency as well as electricity use efficiency, besides performing as an useful devise in reducing the over exploitation of groundwater. Given the benefits of micro-irrigation in terms of
25
productivity increase, water and electricity saving, the gross benefits to the country would be very large, if the available potential is utilised. Obviously, the water scarcity problem being encountered in different regions in the country can also be eliminated by utilising the available potential of micro-irrigation. In spite of having many economic and other advantages, the growth of area under micro-irrigation is not appreciable compared to the total potential. As of today, only about 2.13 percent of India’s total drip irrigation potential area and 3.30 percent of sprinkler irrigation potential is utilised, most of which are also developed with the subsidy support from State agency. A number of policy and technical reasons have been identified for the slow growth in adopting WSTs in India (see, Box I). Given the vast potential benefits of micro-irrigation and fast decline of irrigation water potential in the country, a number of technical and policy interventions are required to be introduced so as to increase the adoption of micro-irrigation in India. The needed interventions are presented below: 1. Sprinkler irrigation is mostly promoted through subsidy schemes and not as an on-farm water and land management strategy. In certain sates (example Maharashtra), under subsidy scheme, no consideration is given in respect of field size, shape, topography, type and location of water source, seasonal fluctuations, type of soil and crop to be grown. The design aspect is ignored so as to reduce the cost of the system. According to Kulkarni (2005), “in most cases the subsidy sets do not match the site specific situations of an individual farmer. As a result, the sets do not operate satisfactorily”(p.5). This can discourage the farmers not to adopt sprinkler irrigation. Therefore, subsidy scheme needs to be modified without ignoring the design aspect of the system. 2. In the case of fully portable hand move sprinkler system, laterals are required to be shifted twice or thrice a day, which is a labour-intensive operation. It is a cumbersome job particularly during the night hours, where farmers get electricity in most of the states. Therefore, it is necessary to explore the possibility of using semi-portable or mechanized sprinkler systems like traveling gun through enhanced research and developmental activities. In order to popularize the system, both fixed as well as recurring costs required for the system to be cut down so as to increase the adoption of the system even by resource poor farmers. 3. Kulkarni (2005) stresses that R & D should focus on the following areas so as to increase wide scale adoption of sprinkler irrigation in the country:
� Strategies for achieving higher (> 80% ) distribution uniformity (DU); Evaluating effect of discharge variations within the system on DU and recommending appropriate values for practicable purpose,
� Minimizing spray losses due to evaporation and wind drift, � Evaluating optimum spacing arrangements of sprinkler heads viz., rectangular,
square, and triangular; Optimising the overlapping of wetted diameters under low and high wind situations,
� Fertigation through sprinkler system, � Evaluating wear of nozzle bores; performance of single nozzle and twin nozzle
sprinklers and their use, � Promoting use of plastic impact sprinklers, part circle sprinklers, pressure
regulating valves, � Design and development of low cost hose drag system for small and irregular
shaped fields,

26
� Design and development of small scale mechanized sprinkler systems like travelling rain gun, side roll and centre pivot suiting to Indian condition,
� Design and development of simple automation and remote control applications.
4. Both drip and sprinkler irrigation are driven through state and central governments sponsored subsidy schemes. In order to earn quick profit from the subsidy programmes, many companies are marketing various sub-standard components in the market. Often the sub-standard components affect the working condition of the system which creates enormous doubt about the functioning of the system among the farmers’ mind. It is to be ensured that only good quality components having certification of Bureau of Indian Standards (BIS/ISO) are supplied to the farmers. There is also a need to establish a Central Testing Facility (CTF) to deal comprehensively with the design, development and testing of all equipments, devices, machines used in sprinkler and micro systems using state-of art technology (Kulkarni 2005; GI, 2004).
5. There has been a significant development in sprinkler technology all over the world. Several variations of sprinkler irrigation system, with improved design and components are available in those countries, where it is popularly used. Efforts should be made to manufacture those improved sprinkler system through joint ventures, with the condition that the imported components and technology would be transferred to indigenous manufacture within a period of two years. This would help reducing the cost of the system and increasing the adoption of micro-irrigation at a large scale. As suggested by TFMI, at least one percent of the outlay on micro-irrigation needs to be earmarked for micro-irrigation research.
6. One of the major reasons for the slow growth of micro-irrigation in India is the high
initial investment. In spite of availability of subsidy from state agencies, majority of the farmers are reluctant to invest in micro-irrigation system even in horticulture crops, which is highly suitable for drip irrigation. Therefore, as suggested by TFMI, there is a need to look into the technological options of which crop geometry modification is the most important one. Instead of adopting traditional spacing, adoption of paired row planting has been found to reduce the cost of the system by 40 percent in many crops including tomato, brinjal, okra, etc. Therefore, micro-irrigation system should be tailored made, i.e., planned
BOX 1: REASONS FOR SLOW GROWTH OF AREA UNDER DRIP AND SPRINKLER IRRIGATION
• High capital cost required for the system • Subsidy is not easily available for farmers • Subsidy is not available for sugarcane crop • Poor awareness about the importance of WSTs • Not suitable for marginal & small farmers following subsistence farming • After sale service is not satisfactory • Free electricity and low price of canal water • Fear about system clogging among the farmers • Promotional schemes are not available in many states • Poor extension and training facilities to farmers • Benefit-cost of WSTs has not been adequately demonstrated to farmers • State machinery (officials) is not keen to promote MI without subsidy

27
and designed based on location specific parameters. Standard procedure provided under subsidy scheme may not always help to reduce the cost of the system.
7. It is understood from field studies that capital cost required to install drip irrigation is relatively high. Because of this reason, considerable percentage of farmers have expressed that they are unable to adopt this technology for low value crops. If drip system is made available with low cost, area under drip irrigation can be increased at a faster rate. Therefore, measures can primarily be taken to reduce the fixed cost of drip irrigation by promoting research and development activities. By recognizing drip industry as an infrastructure industry as well as announcing tax holiday for specific time periods to all those drip set industries which produce genuine drip materials, the competition can be increased that will ultimately bring down the cost of the system. Some companies have come out with low cost drip irrigation system which can be adopted even by the farmers having less than one acre of land. Studies need to be carried out to find out the feasibility of low cost drip materials including its environment feasibility using field level data.
8. The centrally sponsored scheme of drip irrigation does not provide subsidy for
sugarcane crop. The logic behind this is not clearly known. Since it is an important and also a heavy water-consuming crop, this restriction should be removed to increase the drip irrigated area at a faster rate. This would also ultimately help to reduce the water crisis faced by various States to some extent.
9. The rate of subsidy provided through government schemes is fixed uniformly for
both water-intensive as well as less water-intensive crops. This needs to be restructured. Special subsidy programme may be introduced for water-intensive crops like sugarcane, banana, vegetables, etc. Differential subsidy rates can be fixed based on the types of crops and the rate of consumption of water. Uniform level of subsidy schemes currently followed for water-scarce and water-abundant areas need to be changed and higher subsidy should be provided for those regions where the scarcity of water is acute and exploitation of groundwater is very high as well.
10. Though there was no delay in sanctioning subsidy for those farmers adopting micro-irrigation, Maharashtra State’s experience indicates that farmers have to wait at least six months to receive the amount of subsidy from the concerned department. This increases farmers’ debt burden as majority of the farmers use bank loan for installing drip system in their field. In order to encourage the adoption of drip technology, adequate arrangements should be made to distribute the amount of subsidy within one or two months.
11. Sugar industries always try to increase the area under sugarcane to increase
their capacity utilisation in almost all the States in India. They are least bothered about the method of cultivation of sugarcane. Since sugar industries have close contact with sugarcane cultivators, some kind of target may be fixed for each sugar industry to bring cultivation of sugarcane under drip method of irrigation. Apart from saving of water, this would also help to achieve cultivation of sugarcane in sustainable manner. Despite irrigation water shortage in many States, not only does the area under sugarcane continue to grow at a relatively faster rate, but it is cultivated predominantly under flood method of irrigation. This puts additional pressure on our limited water resources. In order to avoid huge demand-supply gap in irrigation water in future, concerted policies should be formulated to bring all possible areas of sugarcane under drip method of irrigation.

28
12. Inadequate information about the operation, maintenance as well as the
usefulness of drip irrigation is one of the main reasons for its uneven spread across regions in India. Farmers still do not have full knowledge regarding the usefulness of drip irrigation. Even the adopters do not know fully how much of subsidy is available per hectare for different crops. Owing to poor exposure, farmers are reluctant to invest such huge money on micro-irrigation. In fact, many farmers do not know the fact that drip irrigation can also be used efficiently and economically for crops like sugarcane, cotton, vegetables, etc. Giving wide publicity and strengthening the existing extension services can remove these problems. The extension network currently operated mainly by government agencies does not seem to be making significant impact on the adoption of this technology. Therefore, there is a need to revamp the whole extension network by involving the drip set manufactures in order to increase the quality of extension service.
13. Drip sets manufacturers should be asked to involve intensively in promoting
micro-irrigation by introducing frequent demonstration at farmers’ field. Since the use of micro-irrigation is still in the take-off stage in India, active role of the manufacturers’ is essential in promoting drip irrigation as well as developing confidence among the farmers about the usefulness of this new technology. The micro-system manufacturers should be involved in providing advice on agronomic packages to the farmers so as to encourage the adoption of WSTs at a large scale.
14. For a speedy growth of micro-irrigation, a special package scheme can be
introduced where priority can be given in providing bank loan for digging wells and electricity connection (pump-set) for those farmers who are ready to adopt micro- irrigation for cultivating any crop.
15. Groundwater is the only source of water being used for drip method of
irrigation in India. Unlike other countries, water from surface sources (dams, reservoirs, etc) is not used for drip method of irrigation. Since water use efficiency under surface sources is very low owing to heavy losses through conveyance and distribution, farmers should be encouraged to use water from surface sources for drip method of irrigation. This can be done by allocating certain proportion of water from each irrigation projects only for the use of micro-irrigation.
16. One of the important reasons for the low spread of this technology even in the
water-scarce area is the availability of highly subsidized canal water as well as electricity for irrigation pumpsets. Appropriate pricing policies on these two inputs may encourage the farmers to adopt this technology.
17. Though micro-irrigation has been in use in different States since mid-eighties,
State-wise potential area is not estimated as of today. Therefore, it is essential to prepare State-wise and crop-wise potential area for DMI. A detailed estimate on State-wise potential would be useful to fix the target to be achieved and also for formulating schemes for promoting micro-irrigation.
18. Except in Maharashtra and Andhra Pradesh, no other state has separate state
sponsored schemes for promoting micro-irrigation as of today. All other states have been operating schemes mainly with the support of Central government (which is known as centrally sponsored schemes), which started in 1990-91. Considering the water shortage in

29
different states, it is essential to have separate State sponsored schemes in each state by following the experience of Maharashtra state. 17. Clogging of drippers mainly due to poor quality of water has been a inherent problem observed in certain parts of the country. It is realised that the normal acid treatment does not help to mitigate the problem. Therefore, studies need to be carried out to devise de-logging measures in such areas. 18. Training facilities for farmers are essential to increase the adoption of micro-irrigation. Therefore, it should be made obligatory on all registered suppliers under Government Schemes to have facilities for training for farmers in operation and maintenance of the systems and also rendering extension services. The training should include aspects such as crop water requirements, fertigation schedules and periodicity as well as the intensity of water application (GOI, 2004). 19. It is understood from the field studies that the officials who are involving in promoting micro-irrigation have inadequate knowledge about the technical and other details of it (Narayanamoorthy, 1996). Therefore, as recommended by the TFMI, “the state government extension staff will have to undergo ‘Refresher Courses’ to understand and appreciate the intricacies of micro-irrigation and enabling role it can play in modernising agriculture by optimising land and water resources” (GOI, p. 164). 20. It is observed that the price of micro-irrigation accessories such as emitters, filters, laterals, etc. vary between shops and places. Sometimes farmers do face problem in getting spare parts in time. It is necessary to provide quality drip materials in time for farmers for the speedy adoption of micro-irrigation. To avoid price variation and non-availability problem of spare parts, special efforts should be undertaken in the advanced districts head quarters, taluk head quarters and even at block level. 7. Conclusion:
In this study an attempt is made to study the potential and prospects of micro-irrigation in India using the available information. The study shows that that micro-irrigation increases water saving and productivity of crops and that too with reduced cost of cultivation. While water saving due to adoption of drip irrigation is found in the range of 12-84 percent in different crops, the same is found to be in the range of 8-60 percent in sprinkler irrigation method. Water saving is found to be relatively higher among the water-intensive crops like sugarcane, banana and vegetable crops. Similarly, productivity gain is found in almost all the crops cultivated under micro-irrigation as compared to the same cultivated under conventional irrigation method. Besides these benefits, research also indicates that MI can also reduce weed problems, electricity consumption (required for lifting water from well and other sources), over-exploitation of groundwater, etc. Available results suggest that water saving including water use efficiency and productivity gains are relatively higher in those crops cultivated under DIM as compared to SIM. INCID (1994 and 1998) reports mention that about 80 crops can be cultivated under drip and sprinkler irrigation method. While DIM is highly suitable for wide spaced horticulture and other crops, closely grown crops are found to be highly suitable for sprinkler irrigation method. The capital cost required for installing the system varies with crops depending upon space followed for cultivating the selected crops. Wide space crops

30
generally require relatively less capital cost as compared to the crops that are grown closely.
Owing to promotional schemes introduced by the state and central governments,
the area under drip method of irrigation has increased from just 1500 ha in 1985-86 to over 4.50 lakh ha in 2003-04, while the area under sprinkler irrigation increased from 0.23 mha in 1985-86 to 1.63 mha in 2004-05. In spite of having many advantages over conventional method of irrigation, the area under micro-irrigation presently occupies only very negligible percent in comparison to the total irrigated area as well as to its total potential area. The total potential area for drip and sprinkler irrigation is estimated to be 21.09 mha and 50.22 mha respectively. As per the latest information, only 2.13 percent of total drip potential and 3.30 percent of sprinkler potential area has only been utilised.
It has been argued that the adoption of micro-irrigation cannot be increased
without providing subsidy because of its capital-intensive nature. There is no doubt that micro-irrigation is a capital-intensive technology, but it does not mean that its adoption of cannot be increased without subsidy. Subsidy can be a necessary condition for encouraging the adoption of micro-irrigation, but cannot be a sufficient condition for sustaining the growth of it, as many other factors determine the adoption of the same. Studies carried out using field level data from Maharashtra on three crops clearly show that the investment on drip irrigation is economically viable even without government subsidy. The estimated benefit-cost (BC) ratio varies from 1.73 to 2.23 among the three crops under without subsidy condition (see, Narayanamoorthy, 1997; 2004; 2005). Even though subsidy is not needed to enhance the economic viability of the system, it is still needed to enhance the incentive for the widespread adoption of MI particularly among the resource poor farmers (marginal and small categories). Subsidy can be phased out eventually once the new irrigation technology covered an adequate enough to expand subsequently through the demonstration effect.
Therefore, there is a need to find out the ways and means to convince the farmers
about the economic and social feasibility of micro-irrigation. Since it involves relatively higher amount of fixed investment, farmers often ask the questions such as what will be the payback period? Whether investment will be viable? How much will be the water saving? and What will be the productivity gains? It appears that these questions arise mainly because of poor exposure about the social and economic advantages of drip technology. Thus, efforts are needed to convince the farmers through quality extension network, as India’s highly successful green revolution was also the result of extension innovations as much as technology. Considering the fast decline of irrigation potential and competing demand for water from different sectors, all possible efforts are needed to increase the adoption of water saving technologies so as to avoid water scarcity in the future.
References: Abrol, I.P and Sharma, B.R. (1990),“Efficient Water Management in Crucial for Achieving Self-Sufficiency in Food”, Indian Farming, Vol. 40, No. 7, pp. 25-27.
Acharyna, M.S.; Singh, J; Gupta, A.P and Singh, A.K. (1993), “Economic Analysis of Sprinkler Irrigation in Southern Rajasthan”, in CBIP (1993), Sprinkler and Drip Irrigation Systems, Central Board of Irrigation and Power, New Delhi, pp. 74-76.

31
AERT and DSI (1988), Techno-Economic Feasibility Study of Drip Irrigation with Special Reference to Sugarcane, Agri-Energy Round Table (AERT), India and Deccan Sugar Institute (DSI), Pune.
AFC (1998), Evaluation of Drip Irrigation System, Agricultural Finance Corporation (AFC) Limited, Mumbai, October.
Batta, R.K. and S.R. Singh (1998), “Adoption of Drip Irrigation in Sugarcane in India”, in Varma and Rao (Eds.), pp. VII 27 – VII 45.
Bhattarai, M and A. Narayanamoorthy (2003), “Impact of Irrigation on Rural Poverty in India: An Aggregate Panel-Data Analysis”, Water Policy, Vol. 5, Nos.5-6, pp. 443-458.
Biswas, A. K (1993), “Water for Sustainable Development in the Twenty-First Century: A Global Perspective”, in Biswas, A. K.; M. Jellali and G. Stout (Eds.), Water for Sustainable Development in the 21st Century, Water Resources Management Series: 1, Oxford University Press, Delhi.
Biswas, A. K. (2001), “Water Policies in Developing World”, Water Resources Development, Vol. 17, No. 4, pp. 489-499.
Central Board of Irrigation and Power (CBIP) (1993), Proceedings: Workshop on Sprinkler and Drip Irrigation Systems, New Delhi.
Chaudhri, D.P. (1979), Education, Innovation and Agricultural Development: A Study of North India (1961-72), Vikas Publisher, New Delhi.
CWC (1996; 1998; 2002 and 2004), Water and Related Statistics, Ministry of Water Resources, Central Water Commission (CWC), Government of India, New Delhi.
Daniel, Charles (1992), “Drip Irrigation (Typhoon)”, in Indian Petrochemical Corporation Ltd., National Seminar on Drip Irrigation, Oxford and IBH Publishing Company Private Limited, New Delhi, pp.66-68.
Dash, N.K. (1998), “Drip Irrigation and Micro-Irrigation Potential and Prosperity for Sugarcane Cultivation with Reference to Orissa”, in VSI, pp. III 7 – III 12.
Desai, N.D., et al., (1993), “Feasibility of Mini Sprinkler in Onion”, in CBIP (1993), pp. 121-123.
Deshmukh, A.S.; P.P. Shinde and S.S. Katake (1998), “Role of Drip Irrigation in Increasing Water Use Efficiency for Sugarcane Crop”, in VSI, pp. III 34 – III 46.
Deshpande, R. S. and Narayanamoorthy, A. (2001). Issues Before the Second Irrigation Commission of Maharashtra. Economic and Political Weekly. 36 (12), 1034-1043.
Dhawan, B. D. (2002), Technological Change in Indian Irrigated Agriculture: A Study of Water Saving Methods, Commonwealth Publishers, New Delhi.
Dhawan, B.D. (1988), “Role of Irrigation in Raising Intensity of Cropping”, Journal of Indian School of Political Economy, Vol.3, No.4, October-December, pp.632-671.
Dhonde, R.M. and A.R. Banger (1998), “Peoples Participation in Drip Irrigation System for Suru Sugarcane in Kukadi and Krishna Commands of Maharashtra: An Overview”, in VSI, pp.III 25 – III 33.
Gittinger J, Price. (1984), Economic Analysis of Agricultural Projects, Second Edition, The Johns Hopkins University Press, London.

32
GOI. (1994), Report of Task Force on Microirrigation, (Chairman: N. Chandrababu Naidu), Ministry of Agriculture, Government of India, January.
GOM. (2003), Economic Survey of Maharashtra: 2002-03, Planning Department, Government of Maharashtra, Mumbai.
Hapase, D.G.; A.S. Deshmukh and P.P. Shinde (1993), “Micro-Irrigation in Sugarcane Agriculture”, in CBIP, pp. 86-89.
Holsambre, D.G.; B.M. Sahni and P.S. Bhalage (1998), “Developing Interface of Pressurised Irrigation in Canal Command in Maharashtra”, in Varma, C.V.J. and A.R.G. Rao (Eds.), pp. VII 46 – VII 64.
Hapase, D.G., et al., (1993), “Micro irrigation in Sugarcane Cultivation”, in CBIP (1993), pp. 86-89.
INCID. (1994), Drip Irrigation in India, Indian National Committee on Irrigation and Drainage, New Delhi.
INCID. (1998), Sprinkler Irrigation in India, Indian National Committee on Irrigation and Drainage, New Delhi.
Iyer, Ramasamy, R. (2003), Water: Perspectives, Issues, Concerns, Sage Publications, New Delhi.
Kulkarni, S. A. (2005), “Looking Beyond Eight Sprinklers”, Paper presented at the National Conference on Micro-Irrigation, G. B. Pant University of Agriculture and Technology, Patnagar, India, June 3-5, 2005.
Kulkarni, S.Y. (1987), “Sprinkler and Drip Irrigation System”, Sinchan, No.3, October, pp.56-61.
Kundu, D.K; H.U. Neue and R. Singh (1998), “Comparative Effects of Flooding and Sprinkler Irrigation on Growth and Mineral Composition of Rice in an Alfisol”, proceedings of the National Seminar on Micro-Irrigation Research in India: Status and Perspective for the 21st Century, Bhubaneswar, July 27-28, 1998.
Magar, S.S. et al., (1988), “Importance of Drip Irrigation”, Sinchan, No.2, July, pp.61-62.
Mehta K. G., et al., (1993), “Feasibility of Sprinkler Irrigation in Fenugreek”, in CBIP (1993), pp. 79-80.
Mehta, H M., et al., (1993), “Comparative Study of Sprinkler Versus Flood Irrigation in Summer Groundnut”, in CBIP (1993), pp. 167.168
Menon K, Amernath (1995), “Micro Irrigation: Profits in the Pipeline”, India Today, May 15, p.20.
MOWR (1999), Report of the Working Group on Water Availability for Use, National Commission for Integrated Water Resources Development Plan, Ministry of Water Resources, Government of India, New Delhi.
NABARD. (1989), Sprinkler Irrigation in Semi-Arid Areas of Rajasthan: An Ex-Post Evaluation Study, Evaluation Study Series, No.36, National Bank for Agriculture and Rural Development, Bombay.
NABARD (1989), An Ex-Post Evaluation of Sprinkler Irrigation Schemes in Barmer District of Rajasthan, Evaluation Study Series Jaipur No. 7, National Bank for Agriculture and Rural Development, Regional Office, Jaipur, April.

33
Narayanamoorthy, A. (1996), Evaluation of Drip Irrigation System in Maharashtra, Mimeograph Series No. 42, Agro-Economic Research Centre, Gokhale Institute of Politics and Economics, Pune, Maharashtra.
Narayanamoorthy, A. (1996c), “Impact of Drip Irrigation on Consumption of Water and Electricity”, The Asian Economic Review, Vol.38, No.3, December, pp.350-364.
Narayanamoorthy, A. (1997), “Economic Viability of Drip Irrigation: An Empirical Analysis from Maharashtra”, Indian Journal of Agricultural Economics, Vol.52, No.4, October-December, pp.728-739.
Narayanamoorthy, A. (1997a), “Drip Irrigation: A Viable Option for Future Irrigation Development”, Productivity, Vol.38, No.3, October-December, pp. 504-511.
Narayanamoorthy, A. (1997b), “Beneficial Impact of Drip Irrigation: A Study Based on Western India”, Water Resource Journal, No.ST/ESCAP/SER.C/195, December, pp. 17-25.
Narayanamoorthy, A. (1999), “Drip Irrigation for Sustainable Agriculture”, Productivity, Vol.39, No.4, January-March, pp. 672-680.
Narayanamoorthy, A. (2001), Impact of Drip Irrigation on Sugarcane Cultivation in Maharashtra, Agro-Economic Research Centre, Gokhale Institute of Politics and Economics, Pune, June.
Narayanamoorthy, A. (2001a), “Irrigation and Rural Poverty Nexus” A Statewise Analysis”, Indian Journal of Agricultural Economics, Vol.56, No.1, January-March, pp.40-56.
Narayanamoorthy, A. (2002), “Indian Irrigation: Five Decades of Development”, Water Resources Journal, No. 212, June, pp. 1-29.
Narayanamoorthy, A. (2003), “Averting Water Crisis by Drip Method of Irrigation: A Study of Two Water-Intensive Crops”, Indian Journal of Agricultural Economics, Vol. 58, No. 3, July-September, pp. 427-437.
Narayanamoorthy, A. (2004), “Drip Irrigation in India: Can it Solve Water Scarcity?”, Water Policy, Vol. 6, No.2 pp. 117-130.
Narayanamoorthy, A. (2004a), “Impact Assessment of Drip Irrigation in India: The Case of Sugarcane”, Development Policy Review, Vol. 22, No. 4, pp. 443-462.
Narayanamoorthy, A. (2005), Efficiency of Irrigation: A Case of Drip Irrigation, Occasional Paper: 45, Department of Economic Analysis and Research, National Bank for Agriculture and Rural Development, Mumbai, India.
Narayanamoorthy, A. and R.S. Deshpande (1998), “Micro-Irrigation for Sustainable Agriculture”, The Hindu, Madras, January 8, p. 28.
Narayanamoorthy, A and R. S. Deshpande (2003), “Irrigation Development and Agricultural Wages: An Analysis Across States”, Economic and Political Weekly, Vol. 38, No. 35, August 30, pp. 3716-3722.
Narayanamoorthy, A. & R. S. Deshpande (1997), Economics of Drip Irrigation: A Comparative Study of Maharashtra and Tamil Nadu, Mimeograph Series No. 47, Agro-Economic Research Centre, Gokhale Institute of Politics and Economics, Pune, India.
NCPA (1987), Proceedings of the National Seminar on Use of Plastics in Agriculture, Organised jointly by the Directorate of Extension (Ministry of Agriculture) and the

34
National Committee on the Use of Plastics in Agriculture (Ministry of Industry), Government of India, New Delhi, February 6.
NCPA (1990), Status, Potential and Approach for Adoption of Drip and Sprinkler Irrigation Systems, National Committee on the Use of Plastics in Agriculture, Pune, India.
NHB (1998), Indian Horticulture Data Base, National Horticultural Board, Ministry of Agriculture, Government of India, New Delhi, India:
Padhye, A.H. (1989), “Micro and Sprinkler Irrigation in India”, Proceedings of the International Congress on the Use of Plastics in Agriculture, New Delhi.
Parikh, M.M.; P.J. Shrivastava; N.G. Savani and S. Raman (1993), “Feasibility Study of Drip in Sugarcane”, in CBIP, pp.124-127. Patel G. J., et al., (1993), “Relative Efficiency of Sprinkler Irrigation in Winter Maize”, in CBIP (1993), pp. 77-78.
Patel, P. G, et al., (1993), “Response of Safflower to Irrigation Scheduling Based on IW/CPE Ratios under Surface and Mini-Sprinkler Methods on Vertisol of South Gujarat”, in CBIP (1993), pp. 128-129.
Patel, I.S., et al., 1993), “Studies on Sprinkler Vs Surface Method of Irrigation in Summer Groundunt Cv.GG-2”, in CBIP (1993), pp. 150-152.
Patil, B.P. (1988), “Crop Response to Sprinkler and Drip Irrigation with Special Reference to Konkan Area”, Sinchan, No.2, July, pp.58-60.
Postal, S., Polak, P., Gonzales, F., & Keller, J. (2001), “Drip Irrigation for Small Farmers: A New Initiative to Alleviate Hunger and Poverty”, Water International, Vol. 26, No. 1.
Postal, S. (1999), Pillar of Sand: Can the Irrigation Miracle Last?, W.W. Norton and Company, New York.
Puranik, R.P. et al., (1992), “Constraints and Problems as perceived by non-adopters and adopters of Drip Irrigation System”, Agricultural Situation in India, Vol. XLVII, No, 1, April, pp. 33-34.
Rajagopal, A. (1998), “Sprinkler System of Irrigation for Water Economy in Scarcity Areas”, in Verma C V.J and Rao, ARG (eds.), Micro Irrigation and Sprinkler Irrigation Systems, Central Board of Irrigation and Power, New Delhi, pp. IV1-IV7.
Raut, Rajesh and Kamal Kachotia (1998), “Sugarcane Cultivation Under ‘Fan-Jet’ Micro-Irrigation System – A Case Study”, in Varma C.V.J. and A.R.G. Rao (Eds.), pp. VII 4 – VII 7.
Rosegrant, W. Mark (1997), Water Resources in the Twenty-First Century: Challenges and Implications for Action, Food and Agriculture, and the Environment Discussion Paper 20, International Food Policy Research Institute, Washington D.C., U.S.A., March.
Rosegrant W. M.; Ximing Cai and Sarah A. Cline (2002), World Water and Food to 2020: Dealing with Scarcity, International Food Policy Research Institute, Washington, D.C., USA and International Water Management Institute, Colombo, Sri Lanka.
Rosegrant, W. Mark and Ruth S. Meinzen-Dick (1996), “Water Resources in the Asia-Pacific Region: Managing Scarcity”, Asian-Pacific Economic Literature, Vol.10, No.2, November, pp. 32-53.
Saleth, R. Maria. (1996), Water Institutions in India: Economics, Law and Policy, Commonwealth Publishers, New Delhi.

35
Sankpal, V.Y.; N.J. Danawale; K.K. Khade and D.S. Bhoite (1998), “Response of Sugarcane Varieties to Drip Irrigation During Suru Season”, in VSI , pp. III 13-III 24.
Seckler, D; U. Amarasinghe; D. Molden; R. de Silva and R. Barker (1998), World Water Demand and Supply, 1990 to 2025: Scenarios and Issues, Research Report 19, International Water Management Institute, Colombo, Sri Lanka.
Seckler, D; R. Barker and U. A. Amarasinghe (1999), “Water Scarcity in Twenty-First Century”, International Journal of Water Resources Development, Vol.15, Nos. 1-2, pp. 29-42.
Shinde P.P.; A.S. Deshmukh and S.B. Jadhav (1998), “Fertigation Studies under Drip Irrigation in Sugarcane Agriculture”, in VSI, pp. III 47 – III 58.
Shreshta, R.B. and C. Gopalakrishnan (1993), “Adoption and Diffusion of Drip Irrigation Technology: An Econometric Analysis”, Economic Development and Cultural Change, Vol.41, No.2, January, pp.407-418.
Singh, H.P; S. P. Kaushish; A. Kumar; T.S. Murthy and J.C. Samuel (eds.) (2001), Microirrigation, Central Board of Irrigation and Power, New Delhi.
Sivanappan, R.K. (1994a), “Prospects of Micro Irrigation in India”, Irrigation and Drainage System, Vol.8, No. 1 pp. 49-58.
Sivanappan, R.K. (1998), “Irrigation Water Management for Sugarcane”, in VSI, pp. II 100 – II 125.
Sudhakar, M.S. (1994), “New Joint Ventures in Drip Irrigation: Drip Irrigation Technology Comes of Age in India”, in Agriculture and Industry Survey: 1993-94, Vadamalai Media Limited, Coimbatore, Tamil Nadu.
Vaidyanathan, A.; A. Krishnakumar; A. Rajagopal and D. Varatharajan (1994), “Impact of Irrigation on Productivity of Land”, Journal of Indian School of Political Economy, Vol.6, No.4, October-December, pp.601-645.
Vaidyanathan, A. (1998), Water Resource Management: Institutions and Irrigation Development in India, Oxford University Press, New Delhi.
Vasantdada Sugar Institute (VSI) (1998), Proceedings of the National Seminar on Irrigation Water Management for Sugarcane, VSI, Pune, 5-6 June.
Venugopal, R. and M. Rajkumar (1998), “Drip Irrigation System – New Concept in Sugarcane Culture at Baramba of Orissa state”, in VSI, pp. III 7 – III 12.
Varma, C.V.J., & Rao, A.R.G. (Eds.) (1998), Micro-Irrigation and Sprinkler Irrigation Systems, Central Board of Irrigation and Power, New Delhi.
Varma, C.V.J. and A.R.G. Rao (Eds.) (1998) Proceedings: Workshop on Micro Irrigation and Sprinkler Irrigation Systems, Central Board of Irrigation and Power, New Delhi.
World Bank (1991), Irrigation Sector Review, Vol. I and II, Report No. 9518-IN, The World Bank, Washington D.C., December.