otc otc-23981-ms - 2hoffshore.com · against the risk of fatigue failure of the ... subsea...
TRANSCRIPT

OTC OTC-23981-MS
Evaluation of Wellhead Fatigue Using In-Service Structural Monitoring Data Phil Ward, Alex Rimmer and Hugh Howells, 2H Offshore
Copyright 2013, Offshore Technology Conference This paper was prepared for presentation at the Offshore Technology Conference held in Houston, Texas, USA, 6–9 May 2013. This paper was selected for presentation by an OTC program committee following review of information contained in an abstract submitted by the author(s). Contents of the paper have not been reviewed by the Offshore Technology Conference and are subject to correction by the author(s). The material does not necessarily reflect any position of the Offshore Technology Conference, its officers, or members. Electronic reproduction, distribution, or storage of any part of this paper without the written consent of the Offshore Technology Conference is prohibited. Permission to reproduce in print is restricted to an abstract of not more than 300 words; illustrations may not be copied. The abstract must contain conspicuous acknowledgment of OTC copyright.
Abstract
To conduct offshore drilling activities safely there is an increasing requirement to understand the strength and durability of
subsea wellheads and conductors. The use of modern drilling rigs, with larger BOP stacks and drill-through trees, combined
with longer well durations and multiple intervention operations is now producing far greater levels of fatigue loading on
subsea wellheads.
The prediction of the fatigue response using numerical analysis has traditionally taken a conservative approach to mitigate
against the risk of fatigue failure of the drilling riser and wellhead equipment. However, using this conservative approach, the
allowable fatigue design limits are often predicted to be exceeded before the target operation durations are achieved. This can
lead to costly last-minute design changes, the necessity for which often remains unproven.
To improve the understanding of the fatigue behaviour of these systems, 2H has utilised in-situ monitoring of the drilling
riser and wellhead response on recent projects in the Gulf of Mexico and the North Sea for a number of Operators. Wellhead
fatigue life predictions, for which minimal in-service validation has traditionally been available, have been found to be
conservative by factors of 10 or greater based on the field measurement data collected. Understanding the root causes of
these levels of conservatism allows a critical view to be taken of analytical models and fatigue results. This in turn facilitates
the safe removal of conservatisms from the analytical approach and associated cost savings for field operators. Further, in-
situ monitoring allows management of fatigue during drilling with real-time tracking of fatigue accumulation providing
feedback for safer planning of operations.
This paper describes the use of wellhead response monitoring programmes on a recent drilling campaign in the North Sea.
Comparisons are drawn between the measured response and the analytically predicted wellhead fatigue results. Where
differences are identified, the back-analysis activities conducted to identify the causes of those differences are discussed.
Finally, the applicability and limitations of those findings for the refinement of wellhead fatigue predictions in other
applications are outlined.
Background
Loading of Subsea Equipment
A subsea wellhead, the component installed at the top of a well conductor, acts as the interface between the conductor, its
internal casings and the marine drilling riser system. As such, it is exposed to significant loads that are imparted into the well
conductor from environmental interaction with the vessel and drilling riser as well as the axial loads associated with hang-off
of the internal casings. These loads will include components of the following, the majority of which vary with time:
Static motion of the vessel through error margins associated with its dynamic positioning system or slack in mooring
lines;
Dynamic vessel response to wave and wind action transferred to the riser as well as direct wave-action on the riser
itself;
Static response to current loading both on the vessel and directly on the riser;
Learn more at www.2hoffshore.com

2 OTC OTC-23981-MS
Well construction loads, mud weights, internal and external pressures and occasional snag loading.
The position of the wellhead, usually a few feet above the seabed, places it in the region of high bending moments generated
as these loads are dissipated into the soil around the conductor. A plot of a typical distribution of bending moment in the
seabed region is presented in Figure 1. It is shown that the bending moment peak is centered just below the seabed (usually
5m to 10m below the seabed surface) and that the wellhead may experience a significant percentage of that peak moment.
The different lines on the chart represent bending moments for different lateral vessel offsets from mean well centre
expressed as a percentage of water depth.
Figure 1 – Typical Bending Moment Distribution in Seabed Region
Fatigue of Subsea Equipment
Fatigue is a mechanism of progressive and localised structural damage and only occurs when a material is subjected to cyclic
loading. Fatigue damage can occur even when a structure experiences loads that generate stresses significantly below the
elastic yield strength of the material. As subsea wellheads are exposed to constantly varying loads of high magnitude, their
fatigue response is of particular concern.
The fatigue life of a component is greatly affected by both the likelihood that flaws exist within it and the complexity of its
geometry. If welds are included in the manufacturing process of a component, or are used to join components together, crack-
like flaws will be introduced. Alternatively, the presence of sharp corners, notches, holes or threads - such as are
commonplace in connectors and couplings - leads to concentrations of stress in certain areas of a component. The ratio of the
maximum stress in such an area, or ‘fatigue hot-spot’, to the average stress in the component is termed the ‘stress
concentration factor’ (SCF) or ‘stress amplification factor’ (SAF). The higher the SCF/SAF is, the shorter the fatigue life
becomes under a given regime of load cycling.
There are two primary mechanisms by which environmental loads cause fatigue of offshore structures. These are vortex-
induced vibration (VIV) fatigue, driven by current loads and wave-induced fatigue, caused by wave loading. VIV fatigue
occurs if the frequency with which vortices are shed from the leeward side of the riser, a natural effect for a cylindrical body
placed in flow, matches one or more of the natural frequencies of vibration of the riser and conductor system. In this case,
‘lock-on’ of the vortex shedding frequency to a system natural frequency and the subsequent oscillations it causes, may result
in large translation motions typically of a size up to the outer diameter of the excited component. These rapid oscillations
generate significant stress fluctuations and hence can cause large fatigue damage very quickly. By contrast, wave-induced
fatigue is a constant effect but generally results in lower fatigue damage rates at the wellhead. This is because wave loading
will excite the upper portion of the riser creating loads and motions that are transmitted down to the wellhead. Hydrodynamic
damping and inertia associated with the lower riser portion will act to reduce these motions. Typically, a displacement range
less than ±100mm is experienced by the wellhead.
Learn more at www.2hoffshore.com

OTC OTC-23981-MS 3
Fatigue in Wellheads
The minimum fatigue life for the wellhead and conductor system is usually either the body of the wellhead, the body of the
uppermost conductor connector, or the weld between the wellhead and the conductor. In the body of components, geometric
characteristics such as threads, notches and alike will form regions of concentrated stress. Such regions are found in number
in a typical wellhead – for example, around hang-off shoulders for internal casings, locking rings between inner and outer
housings and pressure seals. The SCF associated with these regions in wellheads may cause such regions to demonstrate
critical fatigue performance. Alternatively, the reduced amount of material in the thinner wall sections as the wellhead body
tapers down towards the weld to the adjacent conductor pipe may lead to larger stresses at that point. If the bending peak is
lower in the soil, the uppermost conductor connector may dominate the fatigue response. This component will also include
several sources of stress concentrations at threads, gaskets and locking dogs.
As well as the wellhead and connector, other areas of concern include the welds between the wellhead and the adjacent pipe
and the seam weld in the conductor pipe. A typical SCF in one of these welds is around 1.3, generated primarily from the
geometric misalignment and ovality of the components on either side of the weld. However, due to flaws and residual
stresses induced by the welding process, the minimum fatigue life may occur in the weld despite the lower SCF.
Subsea wellheads are positioned below the blow-out preventer (BOP), the primary control mechanism for the well, and
therefore, are critical to ensure well control can be maintained. Furthermore, inspection of these components for flaws after
installation is not feasible. These factors lead to the application of a safety factor, typically 10, that can cause analytical
fatigue life predictions to fall short of the target life.
A Worsening Problem?
Offshore drilling operations have been completed successfully in harsh environmental conditions, such as the Northern North
Sea and West of Shetland for several decades. Despite this, the current trend in analytical predictions of fatigue in subsea
wellheads is such that fatigue performance is predicted to be a concern for increasing numbers of operations. There are
several contributing factors to this, including:
Operations are moving into new and often harsher environments, increasing the magnitude of the environmental
loads the drilling riser systems must endure. This leads to larger translational motions of the riser and its
components, particularly the BOP stack;
The later generations of mobile offshore drilling unit (MODU) vessels are getting larger and carry taller and heavier
BOP stacks. This leads to an increase in the magnitude of loading imparted into the subsea wellhead by motion of
the stack. A comparison of the weights and heights typical of 3rd
, 4th
and 6th
generation MODUs is presented in
Table 1. The associated effect on displacement at the mudline and hence fatigue damage of the example presented
by Lim et al in [1] is shown in Figure 2. Here the choice of vessel is shown to affect fatigue damage prediction by a
factor of over 50 in the worst cases;
Well operations are becoming more complex, with longer side-tracks and deeper wells being drilled. This additional
complexity increases the duration of the operation and hence lengthens the target fatigue life for the operation.
The value of oil justifies maximising the return from a well, involving greater durations with the BOP connected for
workover and sidetracking operations later in life.
Vessel BOP Stack Height
(ft, m)
BOP Stack Weight in
Air (kips, Te)
BOP Stack Natural
Period (s)
3rd Generation Vessel 33.0, 10.1 338.7, 153.6 4.4
4th Generation Vessel 46.2, 14.1 411.7, 186.7 5.3
6th Generation Vessel 53.3, 16.3 639.6, 290.1 6.4
Table 1 – Example BOP Stack Properties [1]
Learn more at www.2hoffshore.com

4 OTC OTC-23981-MS
Figure 2 – Effect of BOP Stack Size [1]
Exacerbating these effects are greater regulatory and Operator procedural requirements, post-Macondo, to verify the fitness
for purpose of offshore drilling systems. Successful finite element analysis of these systems requires a complete and accurate
set of input data, which is often unavailable. It is typical for analysis to proceed on assumptions for soil stiffness, current and
wave data or indeed vessel response rather than data verified for the specific operation to be analysed. In these scenarios,
worst-case parameters from the appropriate range are used to ensure that the results are conservative. Further, the codes and
standards to whose requirements analysis is conducted, are largely based on the response of the riser and not the wellhead or
sub-seabed components. The combination of all of these factors often leads to a conservative approach. Whilst some
analytical sensitivity studies can be conducted to define and reduce the conservatism, this can only be justified to a certain
extent due to the remaining uncertainties about the system.
As a result, conventional wellhead systems are frequently found to show poor fatigue responses in analytical predictions
whereas in decades gone-by these systems would not have been analysed. In the intervening period, fatigue failures have
occurred only rarely whilst these systems have been in operation. Such consistent ‘cry of wolf’ undermines client confidence
in analytical fatigue results and deflects attention away from those systems that genuinely do have a marginal fatigue life.
Therefore an additional method of increasing confidence in analytical predictions of wellhead fatigue and a method of
quantifying the level of conservatism inherent in them is required. Moreover, if the root-causes of that conservatism can be
identified, analysis methodologies can be improved for future operations. Structural monitoring, if used successfully, has the
potential to form such a method.
Structural Monitoring Overview
The success of a structural monitoring campaign is dependent on a full and thorough consideration of various factors,
including:
What and where measurements should be recorded;
Availability of resources, including hardware, time and budget;
How the measured data will be used.
Each of these factors is dependent on the others and thus all factors must be considered together during system specification.
Specification of a VIV Monitoring System
A decision tree describing the specification of an ideal system to monitor VIV response is presented in Figure 3. In this case,
a displacement monitoring system may be the most appropriate way to capture the on-off nature of VIV response as lock-on
would be expected to generate a recordable increase in the magnitude of system displacement. To provide greater certainty,
data processing in the frequency domain will allow the engineer to identify narrow-banded responses centred on or around
the natural modes of vibration of the structure that would be expected if VIV lock-on did occur.
DISPLACEMENT AT MUDLINECyclic Motions with 0.5m Amplitude at Top of Riser, 840m Water Depth,
36" Condcutor
0
0.5
1
1.5
2
2.5
3
3.5
4
3 4 5 6 7 8 9 10 11 12
Period (s)
Dis
pa
lce
me
nt
Am
pli
tud
e a
t M
ud
lin
e
(in
ch
)
3rd Generation Rig 4th Generation Rig 6th Generation Rig
Example Wave or VIV PeriodsAt 6s,
1.4x more displacement
3.8x more fatigue damage
4th to 6th Generation
At 6s,
3.0x more displacement
81x more fatigue damage
3rd to 6th Generation
Learn more at www.2hoffshore.com

OTC OTC-23981-MS 5
The engineer must then consider whether or not the output of the system will be critical for operations – in which case a real-
time system is required; or if the fatigue life margin is large enough that a remote system, with the associated delay in
collating the data for processing, is acceptable. If the engineer is concerned with lock-on of only one or two individual mode
shapes, spacial positioning of just a few displacement sensors may allow identification of the excited modes. However, if
lock-on of a wide range of modes is a concern, a much larger number of sensors may be necessary.
Figure 3 – Specification of a System to Monitor VIV Response
Specification of a Wave-induced Fatigue Monitoring System
A decision tree for the monitoring of wave-induced fatigue is presented in Figure 4. Here, accurate measurement of the
constant accrual of fatigue damage is required. Therefore, measurement of any system parameter that can be used directly in
a fatigue damage calculation is acceptable. Ideally, this would be direct strain measurement of critical components. The
applicability of this technique in subsequent back-analysis will depend on the analysis methodology used. If the riser and
conductor are both included in a single model the transfer of riser loads to the wellhead is modelled directly. Therefore, if
strain measurements at the wellhead are taken during operations a comparison between these measured strains and those
predicted if the analysis model is forced with an equivalent seastate is possible. Measurement of wellhead motion can be used
but whether the root cause of any discrepancy between measured and predicted results lies in the model or the input data may
not be immediately apparent.
Learn more at www.2hoffshore.com
6 OTC OTC-23981-MS
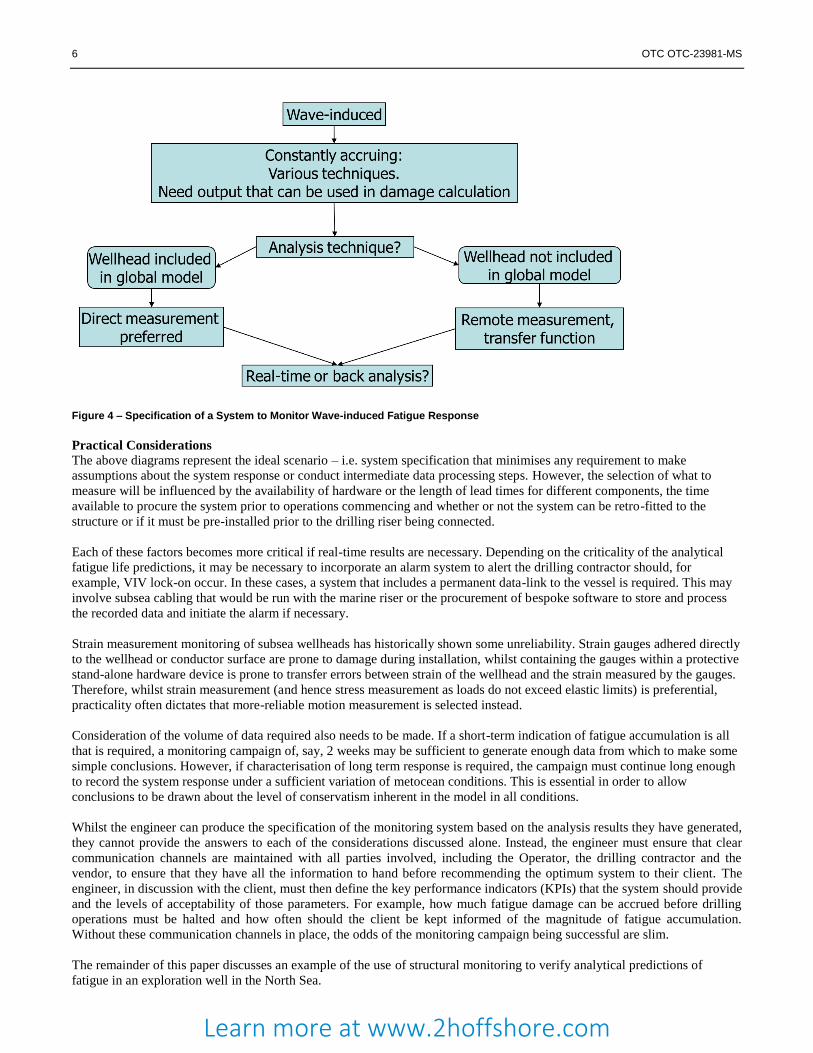
Figure 4 – Specification of a System to Monitor Wave-induced Fatigue Response
Practical Considerations
The above diagrams represent the ideal scenario – i.e. system specification that minimises any requirement to make
assumptions about the system response or conduct intermediate data processing steps. However, the selection of what to
measure will be influenced by the availability of hardware or the length of lead times for different components, the time
available to procure the system prior to operations commencing and whether or not the system can be retro-fitted to the
structure or if it must be pre-installed prior to the drilling riser being connected.
Each of these factors becomes more critical if real-time results are necessary. Depending on the criticality of the analytical
fatigue life predictions, it may be necessary to incorporate an alarm system to alert the drilling contractor should, for
example, VIV lock-on occur. In these cases, a system that includes a permanent data-link to the vessel is required. This may
involve subsea cabling that would be run with the marine riser or the procurement of bespoke software to store and process
the recorded data and initiate the alarm if necessary.
Strain measurement monitoring of subsea wellheads has historically shown some unreliability. Strain gauges adhered directly
to the wellhead or conductor surface are prone to damage during installation, whilst containing the gauges within a protective
stand-alone hardware device is prone to transfer errors between strain of the wellhead and the strain measured by the gauges.
Therefore, whilst strain measurement (and hence stress measurement as loads do not exceed elastic limits) is preferential,
practicality often dictates that more-reliable motion measurement is selected instead.
Consideration of the volume of data required also needs to be made. If a short-term indication of fatigue accumulation is all
that is required, a monitoring campaign of, say, 2 weeks may be sufficient to generate enough data from which to make some
simple conclusions. However, if characterisation of long term response is required, the campaign must continue long enough
to record the system response under a sufficient variation of metocean conditions. This is essential in order to allow
conclusions to be drawn about the level of conservatism inherent in the model in all conditions.
Whilst the engineer can produce the specification of the monitoring system based on the analysis results they have generated,
they cannot provide the answers to each of the considerations discussed alone. Instead, the engineer must ensure that clear
communication channels are maintained with all parties involved, including the Operator, the drilling contractor and the
vendor, to ensure that they have all the information to hand before recommending the optimum system to their client. The
engineer, in discussion with the client, must then define the key performance indicators (KPIs) that the system should provide
and the levels of acceptability of those parameters. For example, how much fatigue damage can be accrued before drilling
operations must be halted and how often should the client be kept informed of the magnitude of fatigue accumulation.
Without these communication channels in place, the odds of the monitoring campaign being successful are slim.
The remainder of this paper discusses an example of the use of structural monitoring to verify analytical predictions of
fatigue in an exploration well in the North Sea.
Learn more at www.2hoffshore.com

OTC OTC-23981-MS 7
Case Study
Riser and Vessel Arrangement
The well monitored is an exploration well in a water depth of approximately 400m and is drilled using a 4th
generation
moored semi-submersible MODU. Prior to operations, analysis was conducted to investigate both the strength and fatigue
response of the system. The fatigue assessment included both first-order fatigue and VIV fatigue analysis. A schematic of the
drilling riser and monitoring system is presented in Figure 5.
Predicted Response
The first-order (wave) fatigue analysis predicted minimum fatigue lives of approximately 20 days in the weld between the
low pressure wellhead housing and the conductor and of approximately 75days in the conductor seam weld. With an
appropriate factor of safety applied, these results dropped to 2 and 7 days respectively. Both results fall well below the design
target of 300 days for well operations with the BOP connected to the wellhead. These poor results were thought to be caused
by resonance of the system and the BOP in particular, induced by the frequencies of the most commonly occurring waves
matching the natural frequency of the system. By contrast, the minimum factored VIV fatigue life, also in the weld between
the outer wellhead housing and the conductor, was found to be in excess of 3.5 years and therefore not a concern.
In light of predicted first-order fatigue lives being inadequate, recommendations were made for improving the fatigue life
prediction through removal of conservatisms in the analysis model. The sensitivity studies recommended included
consideration of varying mud weight, directionality of wave loading and improvement in the accuracy of the hydrodynamic
properties assigned to the subsea BOP stack. Despite some improvement being generated by these studies the improvement in
fatigue life was insufficient to remove all concern over the performance of the system. Thus, a structural monitoring system
was procured to allow the response of the drilling riser to be recorded. From these measurements, conclusions relating to the
conservatism in the analysis and hence the actual fatigue performance of the wellhead would be inferred. The operator could
also determine if it was safe to proceed with operations considering the accumulated fatigue damage.
Monitoring System Description
As initial conversations with equipment vendors indicated that there was insufficient time to procure and install a monitoring
system to directly record the strain response of the wellhead or conductor prior to the conductor being installed, an indirect,
retro-fit system was required. This system would measure the riser response at two locations; one near the seabed and one in
the upper riser region to establish whether the analytical predictions of these parameters were accurate. It would incorporate
two hardware components:
A strain gauge array installed just below the splash zone;
An array of six accelerometers, divided into two standalone groups of three installed above and below the centre of
rotation of the lower flex-joint.
It is the accelerometer data from which the fatigue performance of the wellhead and conductor can be inferred using linear
relationships between riser and conductor response predicted by the analysis. These relationships suggested that any
conservatism in lower riser response would be matched in the wellhead response. Each group of 3 accelerometers is installed
such that the acceleration of the structure in two horizontal directions and the vertical direction is measured. The two sets of
three accelerometers are time-synchronised so that the relative rotation of the structure on either side of the lower flex-joint
(and hence the flex-joint rotation) at any given timestep can be back calculated through trigonometry once the accelerometers
are recovered. The lower accelerometer set also gives a direct estimate of acceleration of the top of the BOP. Comparing this
to the analysis allows the over or under prediction of stress in the wellhead from excitation of the BOP to be estimated. In
turn, this allows a conclusion on the conservatism of the wellhead fatigue prediction to be drawn.
The strain gauge array records the dynamic curvature of the upper riser in two orthogonal vertical planes in real time. The
device contains two bridges of four strain gauges, one bridge for each plane of measurement, capable of recording strain
fluctuations relating to both positive and negative curvature. From these readings, the bending moment and fatigue in the
upper riser can be calculated in real time to offer an input to operational decision making on-deck. By measuring the riser
response at locations at either extent of the water column, any spacial variation in conservatism could also be identified
which would assist in narrowing down the selection of modelling changes most likely to improve the accuracy of the analysis
results.
Learn more at www.2hoffshore.com

8 OTC OTC-23981-MS
Figure 5 – Schematic of Drilling Riser and Monitoring System
DRILL FLOOR
Upper flex-joint
Telescopic joint inner barrel
Telescopic joint outer barrel
MSL ~400m
Pup joint
Strain gauge array
Slick joints
Buoyant joints
Slick joints
Accelerometer array
Buoyant joint
Pup joint ~ 17m
Lower flex-joint
LMRP
BOP
Wellhead
Learn more at www.2hoffshore.com

OTC OTC-23981-MS 9
Data Processing
The nature of the accelerometer arrangement is such that direct reading of BOP inclination or lower flex-joint angle is not
possible. Therefore, the accelerations alone are used to infer conclusions about the behaviour of the lower riser. Whilst taking
accelerations directly ensures that no intermediate processing steps are required to convert the recorded data into the
parameter of use, and therefore no assumptions or calculation errors are introduced, it must be noted that the recorded
accelerations are g-contaminated. This is due to any rotation of the BOP causing one or both of the nominally horizontal
accelerometers to become partly inclined towards the vertical and hence register a component of gravitational acceleration.
The g-contamination component of the results can be removed from the raw acceleration reading using trigonometry if the
inclination of the device is known. However, in this case, no measurements of angular rate or inclination are recorded.
Therefore, the measured accelerations are expected to be larger than the accelerations actually experienced by the BOP as a
result of translational or rotational displacement. The two orthogonal horizontal accelerations are converted to resultant
acceleration at 5° intervals around the circumference of the riser pipe through trigonometric addition of the relevant
components of each timetrace. The maximum acceleration at any of these points is taken to be the representative acceleration
at the strain gauge array location.
On-board software is used to convert the raw data measured by the strain gauge array into curvature in each strain gauge
bridge at each recorded timestep. The bending moments in the upper riser are calculated by assuming that the curvature
recorded arises purely from bending of the riser in each plane and applying the elastic beam theory formula given in Equation
1.
Equation 1
Where:
E is the Young's modulus of the riser pipe material
I is the second moment of area about a principal axis through the centroid
M is the applied bending moment around the same axis
Δk is the difference in curvature between the instantaneous recorded value and the installed condition (assumed to be
zero curvature)
The resulting bending moments at 5° intervals around the circumference of the riser pipe are calculated as per a similar
method to that described above for acceleration. The maximum of these is taken to be the representative riser bending
moment at the strain gauge array location.
Comparison of Measured and Predicted Results
Comprehensive weather data at the well location, including current profiles through depth, significant and maximum wave
heights and peak and mean zero crossing wave periods is available for the period of operations. Both wave and current data
are given with associated flow directions. This data is used to perform a comparison between the measured and predicted
results with a view to establishing the conservatism inherent in the wellhead fatigue life prediction.
The comparison between measured and predicted results is conducted by running first-order fatigue analysis with the full
wave scatter measured during the operations. This results in a predicted fatigue life in the riser at the location of the strain
gauge array of approximately 22 years. The cumulative fatigue damage calculated from the curvature data recorded by the
strain gauge array equates to an annual fatigue damage of 2% and hence a fatigue life of approximately 47 years. Based on
this comparison the original analysis model is shown to over-predict fatigue damage, in the riser at least, by a factor of
approximately 2.11.
The value of this conclusion for verifying wellhead fatigue is limited as it is plausible that the discrepancy between measured
and predicted response will vary along the riser and conductor system. In order to investigate the wellhead response in more
detail, the acceleration output of the analysis is compared to the measured data for five individual 3-hour seastates. The five
seastates are chosen to ensure a variety of weather events which contribute to fatigue loading are represented. The wave and
current conditions associated with these seastates are summarised in Table 2.
A half-hour analysis simulation is run for each of the 5 seastates shown in Table 2 using the original analysis model. A
JONSWAP wave spectrum is developed around the given Hs and Tp combination and a full timetrace of BOP inclination is
created. A half-hour simulation is regarded as sufficient duration for a good representation of the full wave spectrum to be
included in the analysis. The wave and current profile are applied in the directions recorded in the field rather than aligned
with each other in a default direction. Current directionality includes the specification of direction at each depth coordinate in
Learn more at www.2hoffshore.com
10 OTC OTC-23981-MS
the profile.
Seastate
Number
Wave Height (m) Peak Period
(s)
Wave Direction
(°)1
Surface Current
Hmax Hs Speed (m/s) Direction (°)1
1 2.0 1.3 10.7 270 0.20 135
2 6.0 3.3 11.8 360 0.65 350
3 12.6 7.0 14.0 340 0.50 200
4 9.6 6.0 11.5 160 0.40 340
5 13.3 6.5 10.0 180 0.20 120
Notes:
1\ Bearing from true North
Table 2 – Statistics of Chosen Seastates
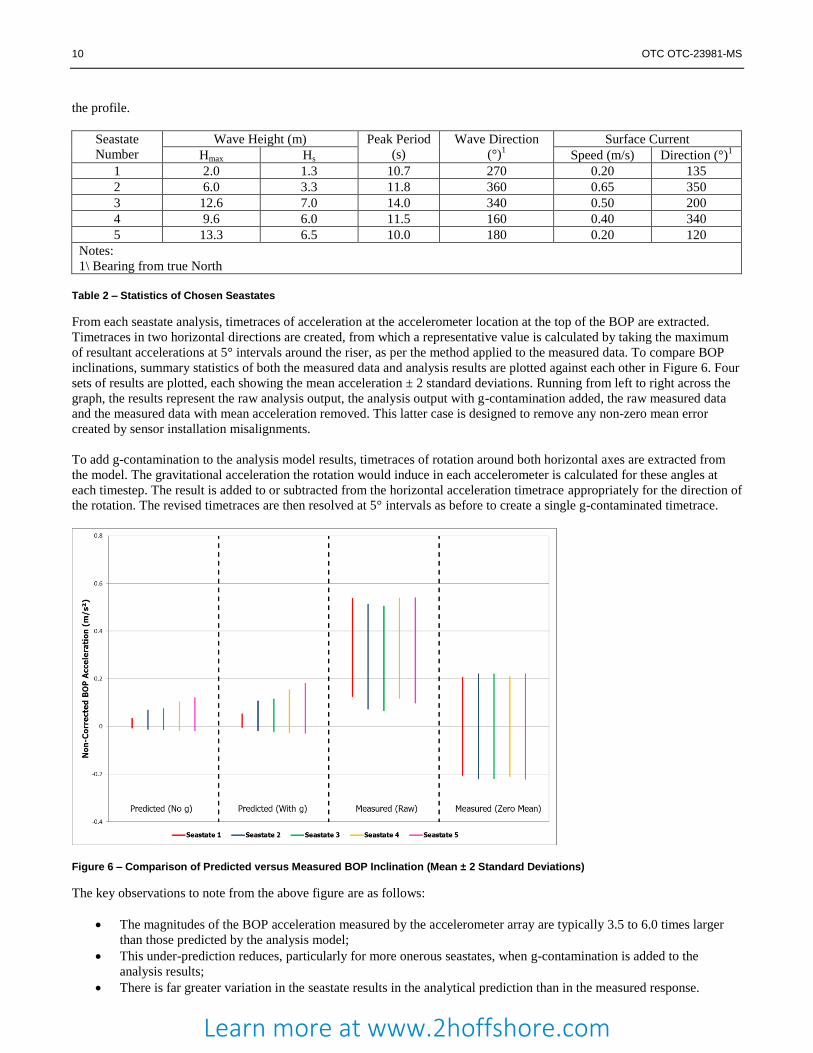
From each seastate analysis, timetraces of acceleration at the accelerometer location at the top of the BOP are extracted.
Timetraces in two horizontal directions are created, from which a representative value is calculated by taking the maximum
of resultant accelerations at 5° intervals around the riser, as per the method applied to the measured data. To compare BOP
inclinations, summary statistics of both the measured data and analysis results are plotted against each other in Figure 6. Four
sets of results are plotted, each showing the mean acceleration ± 2 standard deviations. Running from left to right across the
graph, the results represent the raw analysis output, the analysis output with g-contamination added, the raw measured data
and the measured data with mean acceleration removed. This latter case is designed to remove any non-zero mean error
created by sensor installation misalignments.
To add g-contamination to the analysis model results, timetraces of rotation around both horizontal axes are extracted from
the model. The gravitational acceleration the rotation would induce in each accelerometer is calculated for these angles at
each timestep. The result is added to or subtracted from the horizontal acceleration timetrace appropriately for the direction of
the rotation. The revised timetraces are then resolved at 5° intervals as before to create a single g-contaminated timetrace.
Figure 6 – Comparison of Predicted versus Measured BOP Inclination (Mean ± 2 Standard Deviations)
The key observations to note from the above figure are as follows:
The magnitudes of the BOP acceleration measured by the accelerometer array are typically 3.5 to 6.0 times larger
than those predicted by the analysis model;
This under-prediction reduces, particularly for more onerous seastates, when g-contamination is added to the
analysis results;
There is far greater variation in the seastate results in the analytical prediction than in the measured response.
Learn more at www.2hoffshore.com
OTC OTC-23981-MS 11
On first-inspection, these results imply that the predicted wellhead fatigue life may in fact be under-conservative as the
acceleration variations of the BOP in the model are significantly lower than those measured. Hardware failure is ruled out as
a source of error through post-retrieval testing that confirmed the performance of the sensors to match that recorded during
pre-deployment testing. Therefore, in order for larger motion of the BOP to occur, some inaccuracies must be present in the
model.
As described above, both soil stiffness and vessel motion can have a significant effect on the shape and magnitude of the
expected bending moment peak at the seabed. Inaccuracies in the modelling of vessel motion response would have caused
similar discrepancies in the upper riser response. However, as the upper riser bending response has been shown to be over-
predicted by a factor of around 2, rather than under-predicted by a factor of 3.5-6, it is unlikely that vessel motion is the most
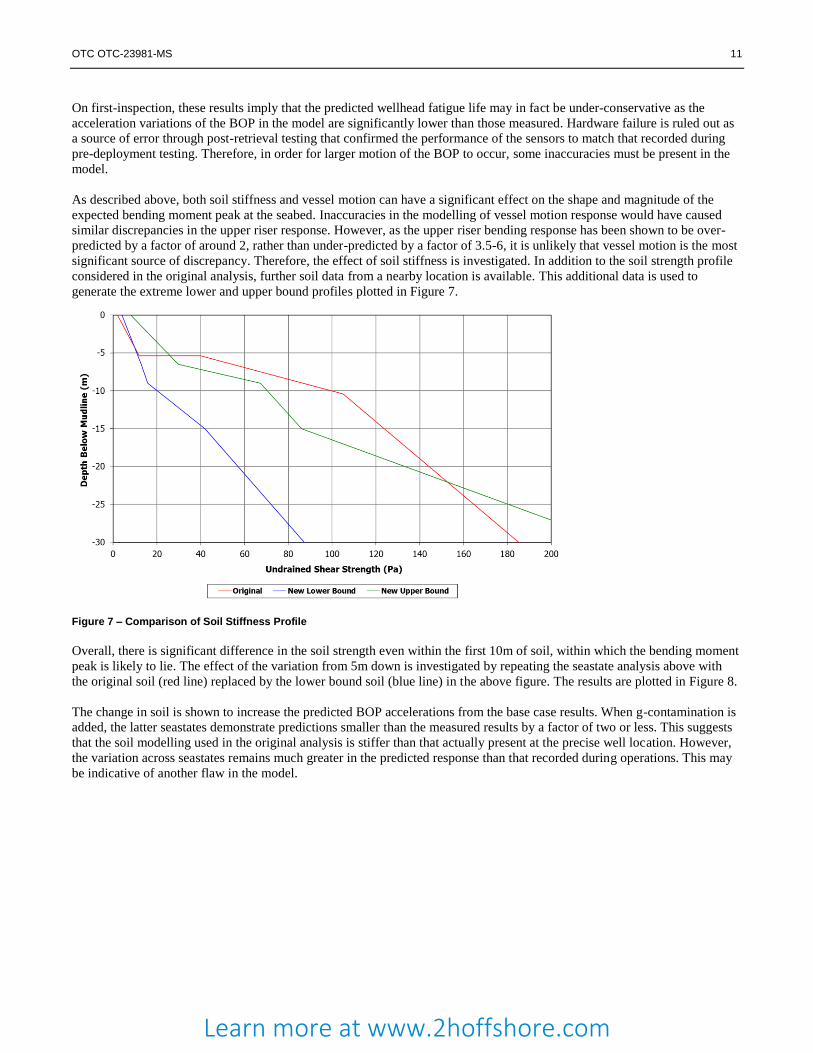
significant source of discrepancy. Therefore, the effect of soil stiffness is investigated. In addition to the soil strength profile
considered in the original analysis, further soil data from a nearby location is available. This additional data is used to
generate the extreme lower and upper bound profiles plotted in Figure 7.
Figure 7 – Comparison of Soil Stiffness Profile
Overall, there is significant difference in the soil strength even within the first 10m of soil, within which the bending moment
peak is likely to lie. The effect of the variation from 5m down is investigated by repeating the seastate analysis above with
the original soil (red line) replaced by the lower bound soil (blue line) in the above figure. The results are plotted in Figure 8.
The change in soil is shown to increase the predicted BOP accelerations from the base case results. When g-contamination is
added, the latter seastates demonstrate predictions smaller than the measured results by a factor of two or less. This suggests
that the soil modelling used in the original analysis is stiffer than that actually present at the precise well location. However,
the variation across seastates remains much greater in the predicted response than that recorded during operations. This may
be indicative of another flaw in the model.
Learn more at www.2hoffshore.com
12 OTC OTC-23981-MS
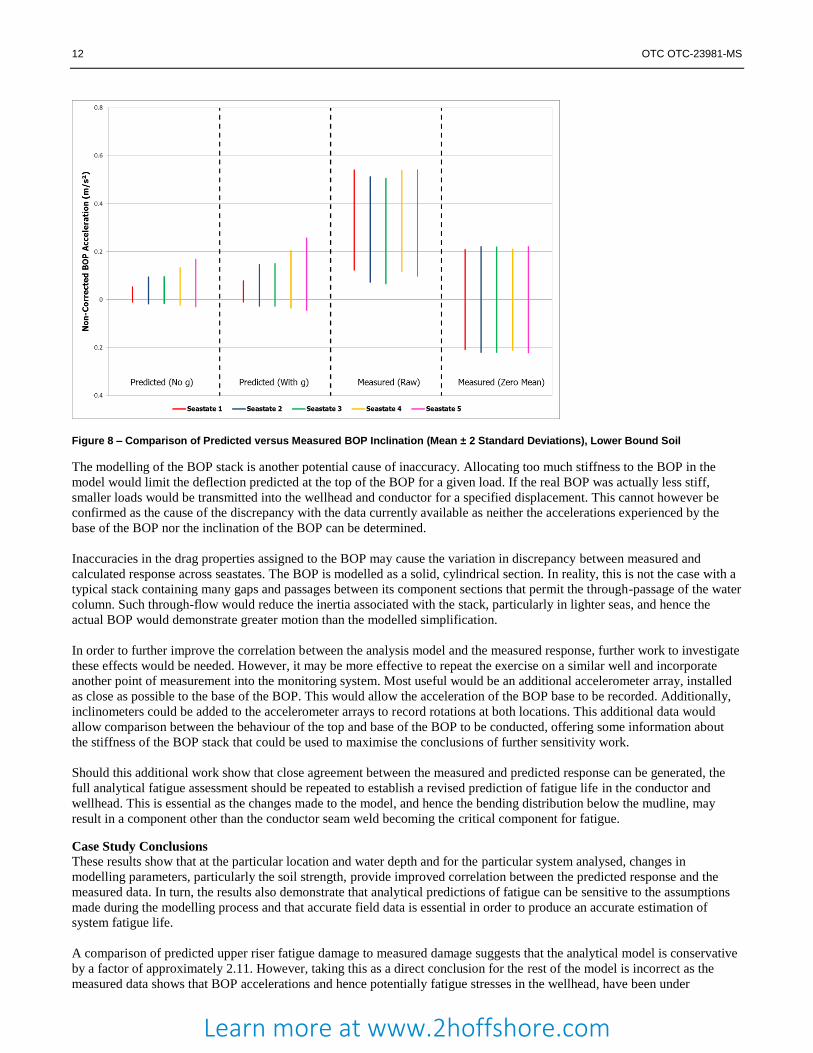
Figure 8 – Comparison of Predicted versus Measured BOP Inclination (Mean ± 2 Standard Deviations), Lower Bound Soil
The modelling of the BOP stack is another potential cause of inaccuracy. Allocating too much stiffness to the BOP in the
model would limit the deflection predicted at the top of the BOP for a given load. If the real BOP was actually less stiff,
smaller loads would be transmitted into the wellhead and conductor for a specified displacement. This cannot however be
confirmed as the cause of the discrepancy with the data currently available as neither the accelerations experienced by the
base of the BOP nor the inclination of the BOP can be determined.
Inaccuracies in the drag properties assigned to the BOP may cause the variation in discrepancy between measured and
calculated response across seastates. The BOP is modelled as a solid, cylindrical section. In reality, this is not the case with a
typical stack containing many gaps and passages between its component sections that permit the through-passage of the water
column. Such through-flow would reduce the inertia associated with the stack, particularly in lighter seas, and hence the
actual BOP would demonstrate greater motion than the modelled simplification.
In order to further improve the correlation between the analysis model and the measured response, further work to investigate
these effects would be needed. However, it may be more effective to repeat the exercise on a similar well and incorporate
another point of measurement into the monitoring system. Most useful would be an additional accelerometer array, installed
as close as possible to the base of the BOP. This would allow the acceleration of the BOP base to be recorded. Additionally,
inclinometers could be added to the accelerometer arrays to record rotations at both locations. This additional data would
allow comparison between the behaviour of the top and base of the BOP to be conducted, offering some information about
the stiffness of the BOP stack that could be used to maximise the conclusions of further sensitivity work.
Should this additional work show that close agreement between the measured and predicted response can be generated, the
full analytical fatigue assessment should be repeated to establish a revised prediction of fatigue life in the conductor and
wellhead. This is essential as the changes made to the model, and hence the bending distribution below the mudline, may
result in a component other than the conductor seam weld becoming the critical component for fatigue.
Case Study Conclusions
These results show that at the particular location and water depth and for the particular system analysed, changes in
modelling parameters, particularly the soil strength, provide improved correlation between the predicted response and the
measured data. In turn, the results also demonstrate that analytical predictions of fatigue can be sensitive to the assumptions
made during the modelling process and that accurate field data is essential in order to produce an accurate estimation of
system fatigue life.
A comparison of predicted upper riser fatigue damage to measured damage suggests that the analytical model is conservative
by a factor of approximately 2.11. However, taking this as a direct conclusion for the rest of the model is incorrect as the
measured data shows that BOP accelerations and hence potentially fatigue stresses in the wellhead, have been under
Learn more at www.2hoffshore.com

OTC OTC-23981-MS 13
predicted. Whilst this is concerning in this case, it is important to note that the full fatigue analysis would need to be repeated
to re-establish the critical component and the minimum wellhead fatigue life under the revised bending moment profile
generated in the improved model. It is plausible that the peak bending region may exhibit a deeper but shallower profile in
the revised model, due to the reduction in soil strength 5m and deeper below the mudline.
Additional functionality in the monitoring system, to record BOP inclination or accelerations at a point closer to the
wellhead, may allow better conclusions to be drawn about the effect of the discrepancies in lower riser response on the
fatigue life of the system. As the system was thought the best achievable in the lead time available, this demonstrates the
importance of commencing the process of specifying a monitoring system as early as possible.
Conclusions
This paper has shown that
Analytical predictions of wellhead fatigue have been found to fall below the target duration of drilling operations
and thus an additional method of proving fitness for purpose of the system is required. The frequency of this
conclusions is likely to increase as well operations become more complex;
Structural monitoring is one method of providing additional confidence in the fatigue performance of the wellhead
and other un-inspectable subsea components, although as seen in a case study, results may sometimes indicate
response in some parts of a system is under-predicted;
Using the acceleration response of the BOP stack to infer conclusions about the response of the wellhead and
conductor has been shown to be possible. This is useful in circumstances where direct measurement of strain in the
conductor is impractical.
To optimise such a system, measurements should ideally be taken at two locations with one as close to the wellhead
as possible. Recording the inclination of the BOP at each location is also beneficial as conclusions about the
stiffness of the BOP stack can be inferred.
Nomenclature
BOP – Blow-out Preventer
Fatigue Hot-spot – Area of concentrated stress within a component
Fatigue Life – Time required for a flaw to grow to a size at which failure is deemed to have occurred
JONSWAP – An irregular wave spectrum developed specifically to represent North Sea conditions
KPI – Key Performance Indicator
Lock-on – The alignment of the vortex-shedding frequency with one or more natural frequencies of vibration of the structure
MODU – Mobile Offshore Drilling Unit
SCF – Stress Concentration Factor
VIV – Vortex-induced Vibration
E – Young’s modulus of the riser pipe material
I – Second moment of area about a principal axis through the centroid
M – Applied bending moment around the same axis
Δk – Difference in curvature between the instantaneous recorded value and the installed condition (assumed to be zero
curvature)
References [1] Lim, T.K., Tellier, E. and Howells, H. 2012. Wellhead, Conductor and Casing Fatigue – Causes and Mitigation. Paper presented
at Deep Offshore Technology (DOT), Perth, Australia, 27th-29th November 2012.
Learn more at www.2hoffshore.com