otc 14192 green water evaluation for fpsos in the gulf of ... otc 14192 greenwater... · use of the...
TRANSCRIPT

Copyright 2002, Offshore Technology Conference This paper was prepared for presentation at the 2002 Offshore Technology Conference held in Houston, Texas U.S.A., 6–9 May 2002. This paper was selected for presentation by the OTC Program Committee following review of information contained in an abstract submitted by the author(s). Contents of the paper, as presented, have not been reviewed by the Offshore Technology Conference and are subject to correction by the author(s). The material, as presented, does not necessarily reflect any position of the Offshore Technology Conference or its officers. Electronic reproduction, distribution, or storage of any part of this paper for commercial purposes without the written consent of the Offshore Technology Conference is prohibited. Permission to reproduce in print is restricted to an abstract of not more than 300 words; illustrations may not be copied. The abstract must contain conspicuous acknowledgment of where and by whom the paper was presented.
Abstract Estimation of green water occurrence and the associated loading on exposed structures is an important design consideration for FPSOs [Floating (Production) Storage and Offloading] in harsh environments. As FPSO concepts are being developed for deep and ultra-deep water Gulf of Mexico, this phenomenon must be understood for hurricane conditions and designs developed to alleviate its impact.
This paper provides a mechanism for understanding and evaluating the green water phenomenon for FPSOs in harsh environments, both at the bow of the vessel and along its sides. The paper utilizes recently developed analysis and design methodologies, and presents criteria specifically developed for the Gulf of Mexico hurricane environment. A case study is used to discuss an FPSO for the Gulf of Mexico designed to resist green water occurrence, and the development of design environmental criteria from a long-term response analysis. The case study is also used to illustrate the design methodology developed, and to show the sensitivity of the green water loading as a function of freeboard exceedence allowed. Finally the paper presents guidelines that provide a strong foundation for the evaluation of green water for FPSO concepts in the Gulf of Mexico.
Introduction With the expansion to deep and ultra-deepwater developments in the Gulf of Mexico, several Floating Production System (FPS) concepts are being considered to safely and effectively exploit the fields. FPSO [Floating (Production) Storage and Offloading] systems are a mature floating system technology for harsh environments, having been successfully deployed in the North Sea, the Grand Banks, and the South China Sea. These systems are attractive for the deepwater Gulf of Mexico, especially where the pipeline infrastructure is limited
or non-existent. This is demonstrated by the interest in this floating production technology over the past five years and the fact that they are considered in most concept selection studies for the deepwater Gulf of Mexico.
The main focus of most floating deepwater production facilities is on the subsea, mooring and riser systems, and other challenges associated with deep and ultra-deepwater. However, some important aspects in the design and operation of Floating Production Systems (FPS) are still related to the interface with the environment, especially in harsh environments. For FPSOs this applies to the weathervaning performance, tandem offloading with shuttle tankers, vessel motions, and green water loading.
Obviously offloading to shuttle tankers and weathervaning performance are FPSO specific issues and do not apply to other FPS. However, vessel motions and green water related issues are shared between all floating systems, albeit to different degrees. A major design consideration for platforms in the Gulf of Mexico is the wave run-up and deck overtopping of deep draft caisson and semi-submersible platforms, and the airgap between wave elevation and the bottom of the deck for Tension Leg Platforms (TLP), semi-submersibles, and jacket platforms. A similar wave-structure interaction design phenomenon exists with FPSOs, commonly referred to as green water loading. Simply stated green water is the flow of solid water on the deck of a vessel, resulting when the wave elevation exceeds the freeboard of the vessel. This creates a fast-moving flow over the deck of the vessel that can result in large loads on objects in its path. This, along with the related phenomenon of keel and bow structure slamming, is a common design condition for trading tankers and container ships, and has unique considerations for weathervaning FPSOs.
Green water loading has become an important aspect in the evaluation of FPSOs in harsh environments such as the North Sea and is reviewed by regulatory bodies such as the HSE in the UK and the NPD in Norway. Recent experience in the North Sea in both the UK and Norwegian sectors confirms the occurrence and importance of the green water problem. As reported by Morris, Millar and Buchner [1], from 1995 to date seventeen green water incidents have been identified on twelve UK FPSOs. Some installations have experienced more than one incident. Ersdal and Kvitrud [2] also report damage incidents in the Norwegian North Sea. In January 2000 the
OTC 14192
Green Water Evaluation for FPSOs in the Gulf of Mexico B. Buchner and A. J. Voogt, MARIN, and A. S. Duggal and C. N. Heyl, FMC SOFEC

2 B. BUCHNER, A. J. VOOGT, A. S. DUGGAL AND C. N. HEYL OTC 14192
living quarters on the bow of the Varg FPSO was hit by green water. This resulted in the damage of a window on the second floor, flooding the area behind it.
It was also found that in non-collinear wind, waves and current conditions, green water occurred from overtopping of the sides of the FPSO [1,3]. Although the damage generally concerns smaller structures (handrails, piping, cable trays, staircases, etc.), this damage can still result in safety problems on board. It is also a serious problem for people working on the deck, especially because it can occur unexpectedly in lower sea states than the “design storm” sea states. As reported by Vestbøstad [4], green water along the side of the Norne FPSO resulted in damage to the piping system in 1998. Further analysis of the vessel also showed that the bow was vulnerable to freeboard exceedence resulting in operational draft restrictions to minimize the green water.
With the introduction of FPSOs in the Gulf of Mexico, the question arises how systems for this region can be designed such that green water loading can be prevented or minimized in hurricane conditions. This paper addresses this by making use of the results of the MARIN Joint Industry Project ‘FPSO Green Water Loading’, and developing a case study for a typical FPSO for the deepwater Gulf of Mexico. The case study focuses on the:
�� Development of design environmental criteria for green water loading utilizing the results of a long-term response study of a “typical” FPSO for the Gulf of Mexico;
�� Description of a typical new-build FPSO hull for the Gulf of Mexico, with features designed to minimize the impact of green water loading and the associated issues;
�� Possible effects of green water on the bow for peak hurricane conditions. The effect of the bow shape and the typical loading on equipment on the deck will be discussed, together with options to protect important equipment against excessive loading; and
�� Important effect of green water from the side in non-collinear (crossed) conditions, such as they can occur in loop current or off-peak hurricane conditions.
Prior to developing and discussing the case study for the
Gulf of Mexico an overview will be provided of the results obtained from previous studies including the JIP ‘FPSO Green Water Loading’. These studies have helped to identify the critical parameters that influence the green water occurrence and associated loading, and to develop a semi-empirical design methodology to evaluate the green water loading on various structures. The case study is then used to demonstrate the design methodology and the sensitivity of green water loading to freeboard exceedence and various philosophies to minimize or eliminate it.
Design Considerations for Green Water Evaluation As green water is a wave-structure interaction phenomenon it comes as no surprise that it is a function of environmental parameters, vessel hull form and above water design, and the
weathervaning performance of the FPSO system. Typical floating system global analysis utilizes the 100-
year environmental conditions as the first input in analyzing the system for extreme events. Typically these conditions are defined by the 100-year wave height and its associated period. For a hurricane environment most of the focus is on the peak hurricane conditions with fairly collinear wind, wave and current. For a non-linear system like a FPSO it is not necessarily true that these conditions results in the extreme loading, motions or green water occurrence. A more refined approach is to use the 100-year wave contours where a series of wave height and period combinations, all with the same 100-year return period, are defined. This allows the system to be studied for a range of wave height and period rather than one significant wave height with a small variation of peak period. This is especially true for green water occurrence where it is not necessarily the maximum wave height that results in the maximum green water but typically smaller wave heights and shorter periods [5].
For green water along the side of the vessel, the orientation of the vessel with respect to the waves is important, and thus is dependent on the alignment of wind, wave and current, and the weathervaning performance of the FPSO. Typically the large crossed conditions occur for off-peak environmental conditions where neither the wind nor the waves are at their 100-year intensity level but have a large degree of separation in direction. This can cause run-up and overtopping along the side of the vessel as the wave progresses along the length of the hull.
The length and underwater hull shape of the FPSO also have a significant effect on the relative wave elevations around the bow and consequently on green water loading. Typically the largest relative wave elevations occur when the wavelength is equal to the ship length. The bow shape also has a strong effect on the relative wave elevations as discussed below:
�� The effect of the buoyancy on the pitch motions - with a thin bow the pitch motions are significantly larger than with a full bow, which plays a role at the peak of the relative wave Response Amplitude Operator (RAO).
�� The reflection of the waves from the bow - the reflection is the largest for full cylindrical bows and plays an important role in the shorter waves (high frequency tail of the RAO)
An optimum FPSO bow accounts for both effects described above - a bow that is not too full, but with sufficient buoyancy. This typically results in an elliptical type water line. Figure 1 compares the relative wave RAOs of FPSOs with a thin triangular bow, an elliptical bow, and a full cylindrical bow. In Figure 2 the relative wave RAO of the “typical” Gulf of Mexico FPSO bow described in the case study is shown.
Bow flare (and rake) typically reduces the amount of water coming onto the deck as the flare pushes the water away from the deck. However, large flare/rake angles (above 40 degrees, say) are not recommended because they can cause significant

OTC 14192 GREEN WATER EVALUATION FOR FPSOS IN THE GULF OF MEXICO 3
bow flare slamming at the hull plating. The results from the ‘FPSO Green Water Loading’ JIP illustrate that a flare angle of approximately 30 degrees is optimum, with the elevation of the foc’sle deck dependent on the estimated relative wave elevations and the philosophy for allowable green water on deck (described in more detail later).
In addition to the vessel bow, the vessel freeboard is important in minimizing the green water from the side. Due to the large length of the vessel and the build-up of crest elevation as the wave progresses along the vessel, it is difficult to avoid overtopping all together. Care must be taken to avoid the placement of sensitive equipment near the edge of the vessel and to locate topsides equipment and piping at an elevation above the deck where green water is minimized. This is also important in locating lifeboats, muster stations, and evacuation tunnels along the side of the vessel.
Another area that requires protection from green water is the vessel stern. Typically the estimated relative wave elevations are lower than those at the bow, but depending on the vessel freeboard the poop deck may need to be elevated to minimize green water near the accommodations (if located aft) and near the offloading equipment.
In addition to building up the vessel to minimize green water it is important to recognize that vessel operation philosophy can play a part in minimizing the green water occurrence. For example, during the hurricane season in the Gulf of Mexico, it may be possible to place a draft restriction where the maximum allowable draft provides sufficient freeboard to allow adequate green water protection. Of course, the implementation of this requirement has to be developed to ensure that the minimum storage requirements are fulfilled. Green Water Evaluation Methodology Although numerical prediction methods utilizing computational fluid dynamics (CFD) for green water loading are under development [7,8], they cannot be used as practical prediction methods at this time. Therefore a semi-empirical method for the prediction of green water loading is used, based on the early research presented in [9,10,11] and the systematic model test series in the 'FPSO Green Water Loading' JIP [5,6]. The method is semi-empirical as the basis for the evaluation of the green water problem is a linear diffraction calculation at zero speed, coupled with results from a model test database. The linear diffraction model makes it possible to take into account the main characteristics of the vessel, such as its main dimensions, underwater hull shape and weight distribution. If necessary this linear diffraction calculation can be corrected for the effects of current speed. The model test database provides information that is used to define the non-linear interaction between the fluid and the structure.
This methodology is used in the computer program GreenLab that was a by-product of the ‘FPSO Green Water Loading’ JIP. Figure 3 provides a schematic of the green water evaluation methodology developed in [5]. The figure provides a flow chart that identifies the input required, the analysis to be performed, and the output that can be obtained. The dashed
lines in Figure 3 represent the input required:
�� Vessel particulars with specific information on the parameters that influence green water occurrence.
�� Information from Metocean specialists to allow development of design environmental criteria specific to green water occurrence.
The following analyses are performed as represented by the blocks in the figure:
1. Calculate relative wave motion RAOs with linear 3D diffraction analysis with correction for possible effects of current.
2. Calculation of the heading of the vessel with respect to the wave direction due to the combined wind, wave drift and current forces. This is an important parameter for the problem of green water from the side, which increases significantly when the angle between the waves and vessel increases.
3. Calculate linear relative wave motions for the wave spectra of interest resulting in the standard deviation (s) of the relative wave motions.
4. Perform a non-linear correction of the extreme relative wave motions, including the typical discontinuity at the freeboard level as presented in [6] and investigate the effects of bow flare angle and wave period. The methodology is based on a systematic model test series with different bow shapes (full or thin), bowflare angles (0, 10, 30 and 50 degrees with the vertical) and spectral peak periods (12, 14 and 16 s). The output is the expected maximum freeboard exceedence (h).
5. Determination of water height (H) and velocity (u) on the deck using the extreme freeboard exceedence (h) as input. These are also based on the empirical relations for different bow flare angles. The water height on the deck, H, was found to be a linear function of the freeboard exceedence at the bow according to:
H = . haH
The parameter aH is dependent on position at the deck and the bow flare angle. The velocity of the water over the deck is related to the square root of the water height at the fore perpendicular H0 according to:
u = H0au
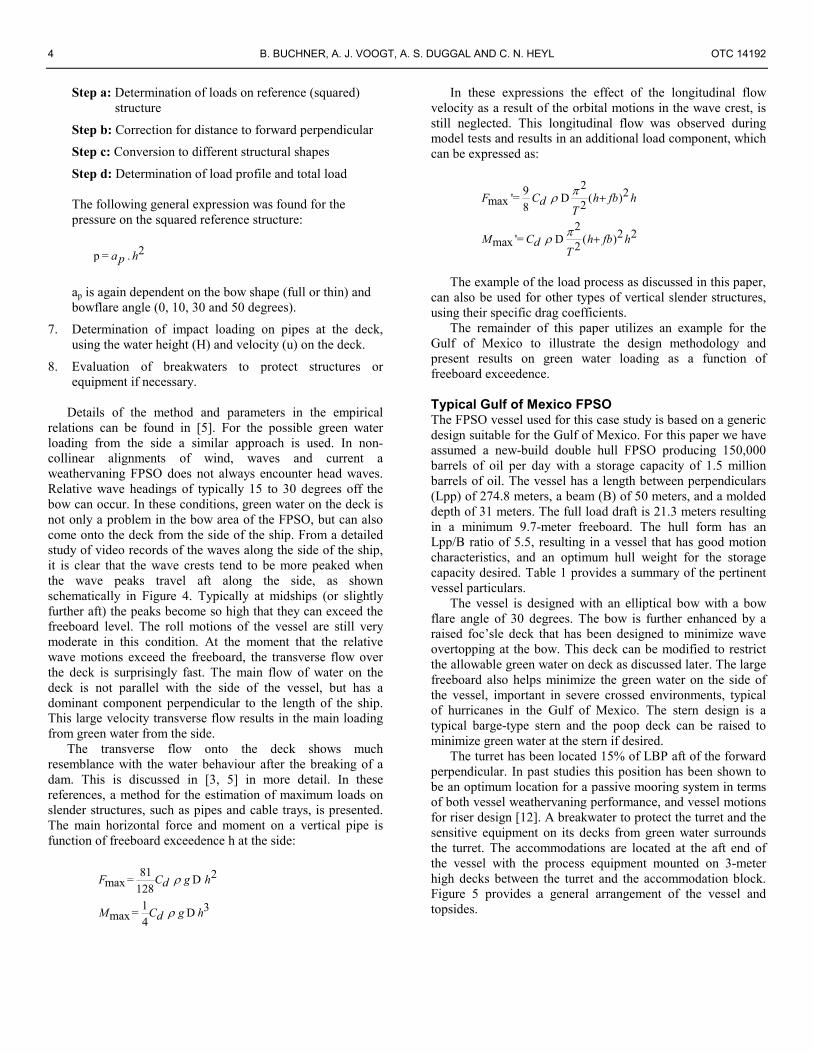
6. Determination of impact loading on structures at the deck that interact with the green water flow. This is possible for different structural shapes and includes a prediction of the maximum pressure over the height of the structure. The loading of structures on the deck has to be determined in a number of steps:
4 B. BUCHNER, A. J. VOOGT, A. S. DUGGAL AND C. N. HEYL OTC 14192
Step a: Determination of loads on reference (squared) structure
Step b: Correction for distance to forward perpendicular
Step c: Conversion to different structural shapes
Step d: Determination of load profile and total load The following general expression was found for the pressure on the squared reference structure:
2p = . a hp
ap is again dependent on the bow shape (full or thin) and bowflare angle (0, 10, 30 and 50 degrees).
7. Determination of impact loading on pipes at the deck, using the water height (H) and velocity (u) on the deck.
8. Evaluation of breakwaters to protect structures or equipment if necessary.
Details of the method and parameters in the empirical
relations can be found in [5]. For the possible green water loading from the side a similar approach is used. In non-collinear alignments of wind, waves and current a weathervaning FPSO does not always encounter head waves. Relative wave headings of typically 15 to 30 degrees off the bow can occur. In these conditions, green water on the deck is not only a problem in the bow area of the FPSO, but can also come onto the deck from the side of the ship. From a detailed study of video records of the waves along the side of the ship, it is clear that the wave crests tend to be more peaked when the wave peaks travel aft along the side, as shown schematically in Figure 4. Typically at midships (or slightly further aft) the peaks become so high that they can exceed the freeboard level. The roll motions of the vessel are still very moderate in this condition. At the moment that the relative wave motions exceed the freeboard, the transverse flow over the deck is surprisingly fast. The main flow of water on the deck is not parallel with the side of the vessel, but has a dominant component perpendicular to the length of the ship. This large velocity transverse flow results in the main loading from green water from the side.
The transverse flow onto the deck shows much resemblance with the water behaviour after the breaking of a dam. This is discussed in [3, 5] in more detail. In these references, a method for the estimation of maximum loads on slender structures, such as pipes and cable trays, is presented. The main horizontal force and moment on a vertical pipe is function of freeboard exceedence h at the side:
81 2= D max 128
F C g hd �
1 3= D max 4M C g hd �
In these expressions the effect of the longitudinal flow velocity as a result of the orbital motions in the wave crest, is still neglected. This longitudinal flow was observed during model tests and results in an additional load component, which can be expressed as:
29 2'= D ( )max 28
F C h fb hdT
�� �
2 2 2'= D ( )max 2M C h fb hdT
�� �
The example of the load process as discussed in this paper,
can also be used for other types of vertical slender structures, using their specific drag coefficients.
The remainder of this paper utilizes an example for the Gulf of Mexico to illustrate the design methodology and present results on green water loading as a function of freeboard exceedence.
Typical Gulf of Mexico FPSO The FPSO vessel used for this case study is based on a generic design suitable for the Gulf of Mexico. For this paper we have assumed a new-build double hull FPSO producing 150,000 barrels of oil per day with a storage capacity of 1.5 million barrels of oil. The vessel has a length between perpendiculars (Lpp) of 274.8 meters, a beam (B) of 50 meters, and a molded depth of 31 meters. The full load draft is 21.3 meters resulting in a minimum 9.7-meter freeboard. The hull form has an Lpp/B ratio of 5.5, resulting in a vessel that has good motion characteristics, and an optimum hull weight for the storage capacity desired. Table 1 provides a summary of the pertinent vessel particulars.
The vessel is designed with an elliptical bow with a bow flare angle of 30 degrees. The bow is further enhanced by a raised foc’sle deck that has been designed to minimize wave overtopping at the bow. This deck can be modified to restrict the allowable green water on deck as discussed later. The large freeboard also helps minimize the green water on the side of the vessel, important in severe crossed environments, typical of hurricanes in the Gulf of Mexico. The stern design is a typical barge-type stern and the poop deck can be raised to minimize green water at the stern if desired.
The turret has been located 15% of LBP aft of the forward perpendicular. In past studies this position has been shown to be an optimum location for a passive mooring system in terms of both vessel weathervaning performance, and vessel motions for riser design [12]. A breakwater to protect the turret and the sensitive equipment on its decks from green water surrounds the turret. The accommodations are located at the aft end of the vessel with the process equipment mounted on 3-meter high decks between the turret and the accommodation block. Figure 5 provides a general arrangement of the vessel and topsides.

OTC 14192 GREEN WATER EVALUATION FOR FPSOS IN THE GULF OF MEXICO 5
Development of Design Criteria for the Gulf of Mexico As described earlier the extreme relative wave elevations are a function of the relative wave heading of the vessel and the characteristics of the sea state (combination of significant wave height and spectral peak period, and intensity of the current). Metocean data typically consists of a 100-year significant wave height with an associated peak period, but what is more appropriate are so-called design sea states that cause the extreme responses at their target return period. For extreme relative wave heights these design criteria consist of a description of the environment in the form of wave and current intensities and their relative directions.
Design criteria can be derived from the long-term description of the response parameter. Several methods exist to perform a long-term response analysis, the one described by Forristal et al. [13] is used here since it is simple to implement and was specifically developed for the Gulf of Mexico.
In this method the joint metocean conditions are modeled using a hurricane hindcast database for the Gulf of Mexico. The desired long-term response distribution is obtained by calculating the short-term response distribution of the extreme relative wave height at each location for each storm in the database and then to average these distributions over all the locations and all the storms. The distribution for a given return period is then obtained using the assumption that the arrival of hurricanes in the Gulf of Mexico is Poisson distributed. A simple but effective manner to derive response-based criteria is to filter the database of short-term responses to obtain sea states that yield the desired 100-year long-term target response [14]. Based on the filtered results, an “educated guess” can be made of the desired response-based design storm and subsequently calibrated through a few trial and error runs.
Using the method described above, long-term response distributions were calculated for 96 points around the waterline of the vessel at full load draft. The hurricane hindcast database that was used contains 11,322 sea states representing 35 hurricanes that occurred in the Gulf of Mexico during a period of 85 years.
For each of the 11,322 sea states in the hurricane database, the mean relative wave heading of the vessel was determined. Wind and current load coefficients were taken from an in-house database containing wind tunnel test data from recent FPSO projects. Figure 6 presents the histogram of relative wave heading from all 11,322 sea states. It can be observed from the graph that the predominant relative wave heading is not bow-on (180 degrees) but with waves � 20 degrees off the bow. The reason for this is the spreading between the dominant wind, wave and current directions inherent to the data present in the hindcast database. The exact relative wave heading distribution depends mainly on the turret location and the ratios between wind load moments and current load moments, which in turn are dependent on vessel draft and the layout of topsides equipment. Figure 7 shows the joint distribution for significant wave height and relative wave heading. From this graph it can be seen that the larger relative
wave angles are associated with wave heights smaller than the typical 100-year Gulf of Mexico hurricane waves (typical significant wave height of 12.2 meters).
For each of the 96 points, the short-term responses were calculated for each of the 11,322 sea states in the hurricane hindcast database. From the short term responses, the 100-year response distributions were determined, from which the “most probable maximum” response is found at the appropriate exceedence level. The distribution of the 100-year maximum relative wave heights along the length of the vessel is presented in Figure 8. The observed difference between the maxima for port and starboard sides of the vessel confirms the asymmetry of the distribution of relative wave headings presented in Figure 6 and Figure 7. As pointed out earlier, this pattern will be dependent on vessel draft and topsides layout.
Based on the distribution of the long-term maximum relative wave height along the length of the vessel (Figure 8) three characteristic locations are selected for further analysis. These locations are characteristic in the sense that the relative wave elevation at that location is the highest in that area. The locations are 1) the bow, 2) just aft of amidships and 3) near the stern of the vessel.
Design criteria for the 100-year extreme relative wave height were derived for the three characteristic locations on the vessel. These response based design criteria are presented in Table 2. Using linear theory, short-term maximum relative wave elevations were calculated for the same three locations on the vessel. The short-term maxima were evaluated for two wave conditions and vessel headings. The wave conditions, which correspond to the 100-year hurricane and the 100-year loop current, are summarized in Table 3. For the 100-year loop current condition, the relative vessel heading was determined assuming that the current direction is perpendicular to the wind and wave directions. For the 100-year hurricane condition, two different relative vessel headings (180 and 200 degrees) were used since in a typical design effort, the designer will evaluate both collinear and crossed conditions.
Table 4 shows the comparison between the short-term responses and the long-term responses. As can be seen from the results, using the short-term design criteria will lead to an unconservative estimate of the extreme relative wave elevations. For the bow area, the difference between long-term and short-term response is 2.9 meters or 13%. For the area just aft of amidships, using a short-term design criteria and a relative vessel heading of 200 degrees, the difference is 3.1 meters or 20%. For the area near the stern of the vessel, the difference is 3.5 meters or 22%. For the loop current condition it is observed that the freeboard exceedence is approximately 2 meters, even though the significant wave height is only 6 meters. These results indicate that especially for relative wave elevations on the side of the vessel, a long-term analysis should be part of a detailed design effort.
Evaluation of Green Water on the Bow Using the three identified critical combinations of environmental conditions and positions at the vessel (see

6 B. BUCHNER, A. J. VOOGT, A. S. DUGGAL AND C. N. HEYL OTC 14192
Table 2), a further detailed evaluation of the green problem was conducted using the green water evaluation methodology and the GreenLab software package described earlier.
Figure 9 shows the probability of exceedence of the relative wave motions for the bow region. The figure shows both the Rayleigh distribution (based on a linear response) and the results using a modified Rayleigh distribution based on extensive model test data. If we look at the Most Probable Maximum (MPM) relative motion and resulting freeboard exceedence in a 3-hour storm, it is clear that the linear prediction significantly over predicts the relative motions at the bow - 7.1 meters instead of the 4.5 meters with the non-linear prediction. The non-linear prediction is realistic as it properly takes into account non-linearities in the waves around the bow and the effect of the green water on the vessel motions.
Inclusion of the effect of current results in a small increase in the relative motions - 8.2 meters freeboard exceedence in the linear prediction and 5 meters with the non-linear prediction.
It is of course important to know which part of these 5 meters of freeboard exceedence actually results in green water heights on the deck. Figure 10 shows this water height as function of the distance from the forward perpendicular. At the forward perpendicular the water height at the deck is 3.7 meters, which reduces to 2.9 meters and 2.8 meters further aft.
As an example the green water loading is applied for the turret breakwater structure. Assuming a squared box-type shape for the turret protection structure at the bow, the method is able to predict the impact loading on the structure. The local peak pressure at the low part of the structure (which is hit directly by the green water), is estimated to be 78 kPa and the total horizontal load on the structure is 2356 kN. Figure 11 shows the related pressure profile over the height of the structure: a high (concentrated) impact pressure at the lower part and a lower quasi-static pressure at the upper part. Although these loads are significant, it should be noted that with an increase in the freeboard exceedence the loading increases quadratically. If the extreme freeboard would be 10m instead of 5m (not an unrealistic extreme value for other vessels in other conditions), the impact pressure would be in the order of 312 kPa.
The green water can also induce significant loading on slender structures on the deck, such as piping. As an example we have estimated the impact load on a 30cm diameter pipe 0.5m above deck with the freeboard exceedence of 5.0m. This load is 21.7kN/m (per meter length of pipe), which is a significant load that requires special attention to the stresses in the pipe and its supports.
There are different ways to deal with the green water phenomena in the design of an FPSO:
1. Design the structures at the deck to the load levels predicted.
2. Reduce the amount of green water coming onto the deck by increasing the (local) freeboard.
3. Optimize the structure at the deck to minimize the loading.
4. Protect critical equipment by using breakwaters or similar structures.
The last 3 options will be discussed below.
Reduce the amount of green water coming onto the deck by increasing the (local) freeboard In principle it is possible to increase the freeboard to such a level that no (or a negligible amount of) green water comes onto the deck. For the present vessel and design environmental conditions and using the GreenLab methodology, this results in an extreme freeboard height of 22m.
However, the question is whether such an increase is really necessary. Equipment on the decks of ships (designed according to normal ship rules) are designed to accept a certain amount green water loading and therefore it is not required to keep the deck completely dry. Although exact levels cannot be defined, it was proposed in [1] to define typical susceptibility levels for green water loading:
0 - 3 meter freeboard exceedence: low 3 - 6 meter freeboard exceedence: medium 6 meter and higher freeboard exceedence: high In general it is found that for freeboard exceedences lower
than 3m, the resulting loading is relatively low and can be handled by structures designed according to existing rules. For freeboard exceedences higher than 3 m, it is recommended to assess the loading on sensitive equipment in detail. This becomes critical for freeboard exceedence in excess of 6m.
In the present paper a freeboard exceedence of 2.5m is assumed to the acceptable. This acceptable freeboard exceedence requires an increase of the foc’sle deck by 3.4m for a total of 18.7m. This increase (3.4m) is larger than the required decrease of freeboard exceedence (2.5m) due to the (realistic) discontinuity of the modified Rayleigh distribution at the freeboard level. A larger freeboard also results in larger relative wave motions around the bow, making the freeboard increase less effective in reducing the freeboard exceedence.
With the freeboard of 18.7 m the water heights on deck are reduced to between 1.9 and 1.4m and the pressure on the turret protection structure is reduced to 20.4kPa.
Optimize the structure at the deck to minimize the loading Instead of increasing the freeboard, it is also possible to optimize the structure at the deck to minimize the green water impact loading. The magnitude of the loads on large structures on the deck is dependent on the shape of the structures relative to the flow direction. Structures deflect the high velocity flow, resulting in loads caused by the change in momentum. For structures that deflect the flow more gradually, impact loads are reduced significantly.
Two options are considered as part of the present study:

OTC 14192 GREEN WATER EVALUATION FOR FPSOS IN THE GULF OF MEXICO 7
�� A triangular structure with semi-angles of 45 degrees. In this case the local peak pressure at the lower part of the structure is reduced from 78 kPa to only 15.7 kPa and the total horizontal load on the structure is reduced from 2356 kN to 737 kN.
�� It is also possible to place the front of the structure under angle with the vertical. When the front is placed under an angle of 30 degrees, the local pressure reduces to 44.3 kPa and the total horizontal load to 1421 kN.
Protect critical equipment, using breakwaters Another option is to use breakwaters in front of the turret structure. Based on the results presented in [5], two breakwater types were considered for the present FPSO:
�� A traditional V-type breakwater, which completely blocks the fluid moving towards the structure. This can, however, result in run up of water in front of the breakwater, which reduces the effective (protective) height of the breakwater
�� A vane-type breakwater [14], designed as an open structure with vertical vanes, which deflects the fluid away from critical structures on deck, but not completely blocking the fluid flow. This prevents the run up in front of the breakwater and also the loading on the breakwater itself because not all of the fluid momentum is destroyed by the breakwater.
The different breakwater shapes are shown in Figure 12. Evaluation of the two breakwater types results in the following comparison:
�� To protect against the water height of 2.8m on the deck, the traditional breakwater needs to be 3.3m high. The vane type breakwater height can be limited to 3.0m.
�� The horizontal load on the traditional breakwater is 2962 kN (moment 5691 kNm), whereas the horizontal load on the vane type breakwater is only 1104 kN (moment 1839 kNm).
It can be concluded that the vane-type breakwater is an interesting concept, because it combines its protective features with an open access to the deck and low loads on the structure itself. The traditional breakwater has a larger horizontal load than that on the structure to be protected itself, due to its larger width. This load also needs to be supported by the underlying deck structure.
Evaluation of Green Water along the Side For the two critical positions along the side of the vessel at 0.4Lpp and 0.14Lpp from the aft perpendicular (see Table 2), a more detailed analysis was carried out, based on the methodology presented earlier.
For green water from the side non-linear relative motions can be predicted. However, for the short wave periods with a Tp between 11 and 12 seconds, it has been shown that non-linear methods give very similar results to the linear
prediction. Therefore the linear results were used in the analysis for this case study. This will be different for longer periods, for which the non-linear contribution to the relative wave motions along the side is much larger, see [3, 5].
With a freeboard of 9.7m along the length of the vessel, the freeboard exceedences predicted are 5.75m (around midships) and 6.15m (at the stern), which are quite significant. Based on these freeboard exceedences, the maximum water height profile across the width of the deck can be estimated using the methods presented in [5]. Figure 13 shows this profile for the maximum freeboard exceedence of 6.15m. The fact that the water height increases again after reaching a minimum somewhere midships, is due to water coming in from the leeward side of the vessel. This figure clearly shows that even 10m inboard there still is 4m of water height on the deck. This type of result can be used to determine the minimum height of lifeboats above the deck, or to determine the possibility of water hitting the process equipment.
Green water from the side is the most damaging for equipment and structures close to the deck level and the side of the vessel. Using the expressions presented in the green water evaluation methodology, the maximum loads on vertical pipes can be estimated based on the predicted freeboard exceedence of 6.15m. For a vertical pipe with a 30cm diameter the following maximum loads are predicted:
Fmax = 79kN Fmax’ = 46kN Ftotal = 125kN Similar predictions can be made for other slender
structures such as cable trays. It is clear that these load levels are very critical for equipment that are not designed for use on the deck of ships, such as topside production structures.
For the design of sensitive equipment along the length of the vessel, using common sense is the best method. It is very important to keep sensitive equipment and piping above the deck and as far away from the side as reasonably practicable. If piping cannot be prevented close to the side of the vessel, it needs to be designed for impulsive loading or protective structures need to be placed in front of them, to deflect the water.
In general it will not be feasible to increase the freeboard along the length of the vessel to a sufficiently high level to keep the deck dry. Placing closed bulwark type structures along the side of the vessel is not an option either, because of the ventilation requirements under the process deck. A number Norwegian FPSOs have an interesting alternative along the sides: a grid of horizontal beams at a certain distance from each other that still allows ventilation, but significantly minimizes the amount and velocity of the green water on the deck.

8 B. BUCHNER, A. J. VOOGT, A. S. DUGGAL AND C. N. HEYL OTC 14192
Conclusions The paper provides a description of the green water phenomenon for turret-moored FPSOs, and a design methodology to address green water loading at the bow and along the sides. The paper also provides guidelines that can be used to evaluate green water for FPSOs in harsh environments. The paper addresses the green water evaluation for FPSOs in the Gulf of Mexico by defining a typical new-build FPSO hull form and developing response-based design environmental criteria. This example is used to present the application of the design methodology and provide examples of green water loading and prevention as a function of freeboard exceedence.
This paper demonstrates the importance of understanding the wave-structure interaction phenomenon, and thus the appropriate design of the FPSO vessel and the use of the environmental criteria. It has been shown that the criteria developed from the long-term response based analysis are different from the 100-year environmental conditions, commonly used for platform design in the Gulf of Mexico, and are also different if evaluating green water at the bow or from the side. It is not unusual for waves with smaller significant wave heights but higher steepnesses that the traditional 100-year wave conditions to result in more extreme green water loading on structures on the deck. The paper also addresses the philosophy of protecting systems from green water loading and provides some examples that illustrate the loading as a function of freeboard exceedence. It is important to recognize that operational limitations, for example draft restrictions, may be used during hurricane season to provide the desired freeboard to minimize green water loading.
The design methodology and analysis presented in this paper is based on a semi-empirical method where relative wave elevations are predicted using diffraction theory, and extreme response and loading calculated by using semi-empirical extreme value distributions and equations to develop green water elevations on deck and the resulting loading on structures. Most of the information used to develop these estimates is based on a comprehensive and systematic model test program applicable for a wide range of vessel type and components on deck. However, as the phenomenon is non-linear and specific to the local fluid-structure interaction process, at times it is appropriate to use model testing or numerical methods (if applicable) to accurately assess the impact of this phenomenon. Many FPSO systems in harsh environments are commonly tested in wave basins to determine mooring loads and vessel motions, and with very little effort and cost the model test can also be used to evaluate green water and the associated loading. The guidelines and methods described in this paper provide a good foundation for planning such work.
References 1 Morris, W.D.M., Millar, J. and Buchner, B. (2000) “Green
Water Susceptibility of North Sea FPSO/FSUs,” 15th Conference on Floating Production Systems (FPS), London.
2 Ersdal, G. and Kvitrud, A. (2000) “Green water on Norwegian Production Ships,” ISOPE2000, Seattle.
3 Buchner, B. (1999) “Green water from the side of a weathervaning FPSO,” OMAE’99, St. Johns.
4 Vestbøstad, T.M. (1999) “Relative Wave Motions Along the Side of an FPSO Hull,” OMAE99, St.Johns.
5 Buchner, B. (2002) “Green Water on Ship-type Offshore Structures,” PhD-thesis Delft University of Technology, 2002.
6 Buchner, B. (1998) “A New Method for the Prediction of Non-Linear Relative Wave Motions,” OMAE98, Lisbon.
7 Ortloff, C.R. and Krafft, M.J. (1997), “Numerical Test Tank: Simulation of Ocean Engineering Problems by Computational Fluid Dynamics,” OTC 8269, OTC 1997, Houston.
8 Veldman, A.E.P., Fekken, G. and Buchner, B. (1999), “Simulation of Green Water Flow Using the Navier-Stokes Equations,” Seventh International Conference on Numerical Ship Hydromechanics, Nantes.
9 Buchner, B. (1995a) “The Impact of Green Water on FPSO Design,” OTC paper 7698, OTC 1995, Houston.
10 Buchner, B. (1995b) “On the Impact of Green Water Loading on Ship and Offshore Unit Design,” PRADS '95, Seoul.
11 Buchner, B. (1996) “The Influence of the Bow Shape of FPSOs on Drift Forces and Green Water,” OTC paper 8073, OTC 1996, Houston.
12 Petruska D.J., Zimmermann, C.A., Krafft, K.M., Thurmond, B.F., Duggal, A.S., (2002) “Riser System Selection and Design for a Deepwater FSO in the Gulf of Mexico”, Proc., 34rd Annual OTC, Houston, Paper OTC 14154.
13 Forristall, G., Larrabee, R.D. and Mercier, R.S., (1991) “Combined Oceanographic Criteria for Deepwater Structures in the Gulf of Mexico,” Proc., 23rd Annual OTC, Houston, Paper OTC 6541.
14 Baar, J.J.M., Heyl, C.N., Rodenbush G., (2000) “Extreme Responses of Turret Moored Tankers,” Proc., 32rd Annual OTC, Houston, Paper OTC 12147.
15 Beynet, Pierre: 1994, Personal communication on vane type breakwater.
16 Hellan, Ø., Hermunstad, O.A. and Standsberg, C.T. (2001) “Design Tool for Green Sea, Wave Impact, and Structural Response on Bow and Deck Structures,” OTC 13213, OTC2001, Houston.

OTC 14192 GREEN WATER EVALUATION FOR FPSOS IN THE GULF OF MEXICO 9
Table 1 Main Vessel Particulars
Parameter Value Unit Displacement 256,236 metric tons Length between Perpendiculars 274.80 meter Breadth 50.00 meter Depth 31.00 meter Draft 21.30 meter Metacentric Height 2.35 meter
Table 2 Response Based Design Criteria
Table 3 Typical short-term design criteria for GOM
Parameter 100yr wave loop current Unit significant wave height 12.2 6.1 meter spectral peak period 14.2 11 seconds JONSWAP gamma 2.4 2.0 - relative wave heading 180/200 131 deg
Table 4 Comparison between short-term and long-term responses
Location X/Lpp Hs Tp gamma beta (-) (m) (s) (-) (deg)
Fore 1.00 14.6 15.0 2.0 175 Mid 0.40 10.0 11.9 2.9 220 Aft 0.14 9.6 11.1 2.9 210 where: beta = relative vessel wave heading zeta = relative vessel current heading
Maximum Relative Wave Elevation (Linear) (m) long-term short-term Location
100-yr design criteria 100-yr wave loop current Bow 22.5 22.2 19.4/19.6 10.2 Midships 15.2 15.5 9.6/12.1 11.4 Stern 15.7 15.9 8.4/12.2 9.8
0
0.5
1
1.5
2
2.5
3
3.5
4
0 0.5 1 1.5
wave frequency in rad/s
Rel
ativ
e m
otio
n R
AO
(m/m
)
0
0.5
1
1.5
2
2.5
0 0.5 1 1.5
wave frequency in rad/s
Rel
ativ
e m
otio
n R
AO
(m/m
)
Figure 1 Relative Wave RAO at the bow for cylindrical (blocks), elliptical (circles) and thin triangular bow (triangles).
Figure 2 Response Amplitude Operator of relative wave motions for the typical Gulf of Mexico FPSO bow.

10 B. BUCHNER, A. J. VOOGT, A. S. DUGGAL AND C. N. HEYL OTC 14192
Lineardiffraction
Headingcalculation
Spectralanalysis
Extremerelativemotions
Water heightWater velocity
Breakwater
Structures
RAOs RAO s h H
hH
Designer
Metocean specialist
Weight data
Hull shape
Current/w
indcoefficients
Heading control
Freeboard
Flare angle
Position
Shape
Extremerelativemotionsside andstern
s hW
ind
V a
nd d
irC
urre
nt V
and
dir
Wav
e H
s,Tp,
dir
Slenderstructures
Stor
m d
urat
ion
QTFs heading
Figure 3 Overview of green water evaluation method (Buchner, 2002)
Figure 4 Typical development of wave contours along the side
Figure 5 General arrangement of case study FPSO

OTC 14192 GREEN WATER EVALUATION FOR FPSOS IN THE GULF OF MEXICO 11
0
250
500
750
1000
1250
90 120 150 180 210 240 270Relative Heading (deg)
Freq
uenc
y
Figure 6 Histogram of relative wave heading
7
8
9
10
11
12
13
14
15
16
120 150 180 210 240Relative Wave Heading (deg)
Hs
(m)
Figure 7 Joint distribution of wave height andrelative wave heading
0
2.5
5.0
7.5
10.0
12.5
15.0
17.5
20.0
22.5
0 0.1 0.2 0.3 0.4 0.5 0.6 0.7 0.8 0.9 1.0
StarboardPort
X/Lpp
MPM
Rel
ativ
e W
ave
Hei
ght (
m)
Figure 8 100-year maximum relative wave elevation

12 B. BUCHNER, A. J. VOOGT, A. S. DUGGAL AND C. N. HEYL OTC 14192
Figure 9 Probability of exceedence of relative wave motions at the bow
Figure 10 Water heights on deck as function of distance from the fore perpendicular

OTC 14192 GREEN WATER EVALUATION FOR FPSOS IN THE GULF OF MEXICO 13
Figure 12 Different types of breakwaters
Figure 13 Profile of maximum waterheights over the width of the vessel
Figure 11 Vertical profile of peak pressures on the squared (box-type) turret protection structure