osteocytes regulate primary lymphoid organs and fat … · 2 1 summary 2 osteocytes act as...
TRANSCRIPT

Instructions for use
Title Osteocytes Regulate Primary Lymphoid Organs and Fat Metabolism
Author(s) Sato, Mari; Asada, Noboru; Kawano, Yuko; Wakahashi, Kanako; Minagawa, Kentaro; Kawano, Hiroki; Sada, Akiko;Ikeda, Kyoji; Matsui, Toshimitsu; Katayama, Yoshio
Citation Cell metabolism, 18(5): 749-758
Issue Date 2013-11-05
Doc URL http://hdl.handle.net/2115/54128
Type article (author version)
File Information Cell Metab.18(5).final.pdf
Hokkaido University Collection of Scholarly and Academic Papers : HUSCAP

1
Short Article 1 2 Osteocytes regulate primary lymphoid organs and fat 3 metabolism 4 5 Mari Sato1,2, Noboru Asada1, Yuko Kawano1, Kanako Wakahashi1, Kentaro 6 Minagawa1, Hiroki Kawano1, Akiko Sada1, Kyoji Ikeda3, Toshimitsu Matsui1, and 7 Yoshio Katayama1,4 8 9 1 Hematology, Department of Medicine, Kobe University Graduate School of Medicine, 10 7-5-1 Kusunoki-cho, Chuo-ku, Kobe 650-0017, Japan 11 2 Biochemistry and Molecular Biology, Graduate School of Dental Medicine, Hokkaido 12 University, North 13, West 7, Sapporo 060-8586, Japan 13 3 Department of Bone and Joint Disease, National Center for Geriatrics and Gerontology 14 (NCGG), 35 Gengo, Morioka, Obu, Aichi 474-8511, Japan 15 4 PRESTO, Japan Science and Technology Agency, 4-1-8 Honcho, Kawaguchi, 16 Saitama 332-0012, Japan 17 18 19 20 Running Title: Remote organ control by osteocytes 21 22 23 24 25 26 27 *Correspondence: 28 Yoshio Katayama, MD, PhD 29 Hematology, Department of Medicine, 30 Kobe University Graduate School of Medicine 31 7-5-1, Kusunoki-cho, Chuo-ku, Kobe 650-0017, Japan 32 Phone: +81-78-382-6912 33 Fax: +81-78-382-6910 34 e-mail: [email protected] 35
36

2
Summary 1
Osteocytes act as mechanosensors to control local bone volume. However, their 2
roles in the homeostasis of remote organs are largely unknown. We show that 3
ablation of osteocytes in mice (osteocyte-less (OL) mice) leads to severe 4
lymphopenia due to lack of lymphoid-supporting stroma in both the bone marrow 5
and thymus, and complete loss of white adipose tissues. These effects were 6
reversed when osteocytes were replenished within the bone. In contrast, neither 7
in vivo supply of T cell progenitors and humoral factors via shared circulation 8
with a normal parabiotic partner, nor ablation of specific hypothalamic nuclei 9
rescued thymic atrophy and fat loss in OL mice. Furthermore, ablation of the 10
hypothalamus in OL mice led to hepatic steatosis, which was rescued by 11
parabiosis with normal mice. Our results define a role for osteocytes as critical 12
regulators of lymphopoiesis and fat metabolism, and suggest that bone acts as a 13
central regulator of multiple organs.14

3
Introduction 1
The bone is a sensory organ consisting of osteocytes and osteoblasts. 2
Osteocytes comprise more than 90% of all bone cells and form a comprehensive 3
network throughout skeletal tissues. Osteocytes contribute to bone homeostasis 4
by converting mechanical stress to biological signals; hence the major players in 5
bone turnover, osteoblasts and osteoclasts, are regulated locally on the bone 6
surface (Bonewald, 2011; Klein-Nulend et al., 2013). Reduced mechanical 7
stress to the bones of astronauts or bedridden patients leads to rapid 8
progression of osteoporosis and impaired immunity (Belavy et al., 2011; Crucian 9
and Sams, 2009; Gueguinou et al., 2009; Lang et al., 2004). However, it remains 10
to be elucidated whether osteocytes are also critical for homeostasis of the 11
immune system and even other organs. Here we address this issue, using a 12
mouse model, in which targeted ablation of osteocytes induces osteoporosis 13
with defective mechanotransduction (Tatsumi et al., 2007). 14
15
Results 16
Osteocyte ablation caused reversible lymphopenia and lymphoid organ atrophy 17

4
We first confirmed that local microgravity on the hind limbs during 1
mouse tail suspension system, which is known to induce local bone loss (Globus 2
et al., 1984), suppressed the osteocyte network formation in the bone and 3
reduced the number of lymphocytes in the bone marrow (BM) of unloaded bone 4
but not in the systemic circulation (Figures S1A-D). However, the hematopoietic 5
phenotype in this system could not be due to the decreased stimulatory signals 6
to osteocyte network by microgravity alone, but other factors could be 7
responsible as well, e.g. less blood flow. To directly address the question if the 8
osteocyte network is indispensable not only for the bone but also for other 9
organs, we utilized transgenic (Tg) mouse model with targeted expression of 10
diphtheria toxin receptor (DTR) under the promoter of dentin matrix protein-1 11
(DMP-1) (Tatsumi et al., 2007). Fifteen-week-old wild type (WT) and Tg 12
littermate mice were injected with a single dose of diphtheria toxin (DT). The 13
osteocyte-less (OL) mice showed a comparable lacunocanalicular interstitial 14
fluid space with WT mice, and there was a marked reduction in neuron-like 15
osteocyte network formed by projections at 3 weeks (Figures 1A, S1E, and S1F). 16
Importantly, osteocytes seemed to be damaged in terms of reduced nuclear size, 17
but they were not depleted in this experiment. The term “OL” in this study is 18

5
defined as the condition wherein some osteocytes are killed and ablated while 1
others are tentatively compromised. The body weight declined steadily during 2
the 3 weeks following DT injection (27.1 ± 2.0g and 20.8 ± 1.5g for WT and OL 3
mice, respectively, n=10-11, p<0.05). Peripheral blood leukocyte count was 4
significantly reduced in OL mice due to severe B and T lymphopenia (Figure 1B). 5
A recent report has shown that the deletion of Gsα specifically in osteocytes 6
strongly enhanced myelopoiesis due to the excess production of granulocyte 7
colony-stimulating factor (G-CSF) presumably from osteocytes (Fulzele et al., 8
2013). However, OL mice showed no alteration in myelopoiesis, which implies 9
that G-CSF from osteocytes during steady-state may not be indispensable. 10
Drastic thymic atrophy with reduction of thymocytes by 90% was also found in 11
OL mice (Figure 1C), as well as splenic atrophy (Figure 1D). These were not due 12
to direct damage by DT in view of the specific expression of DMP-1/DTR in the 13
bone (Figure S1G). The osteocytic network was restored at 100 days following 14
DT administration in Tg mice (Figure 1E) presumably by embedding of intact 15
osteoblasts then terminal differentiation to new osteocytes or from contribution of 16
osteocytes which recovered from the damage. Consequently, lymphopenia and 17
lymphoid organ atrophy were completely normalized (Figures 1F-H). These 18

6
results suggest a functional communication between the bone and lymphoid 1
organs. 2
3
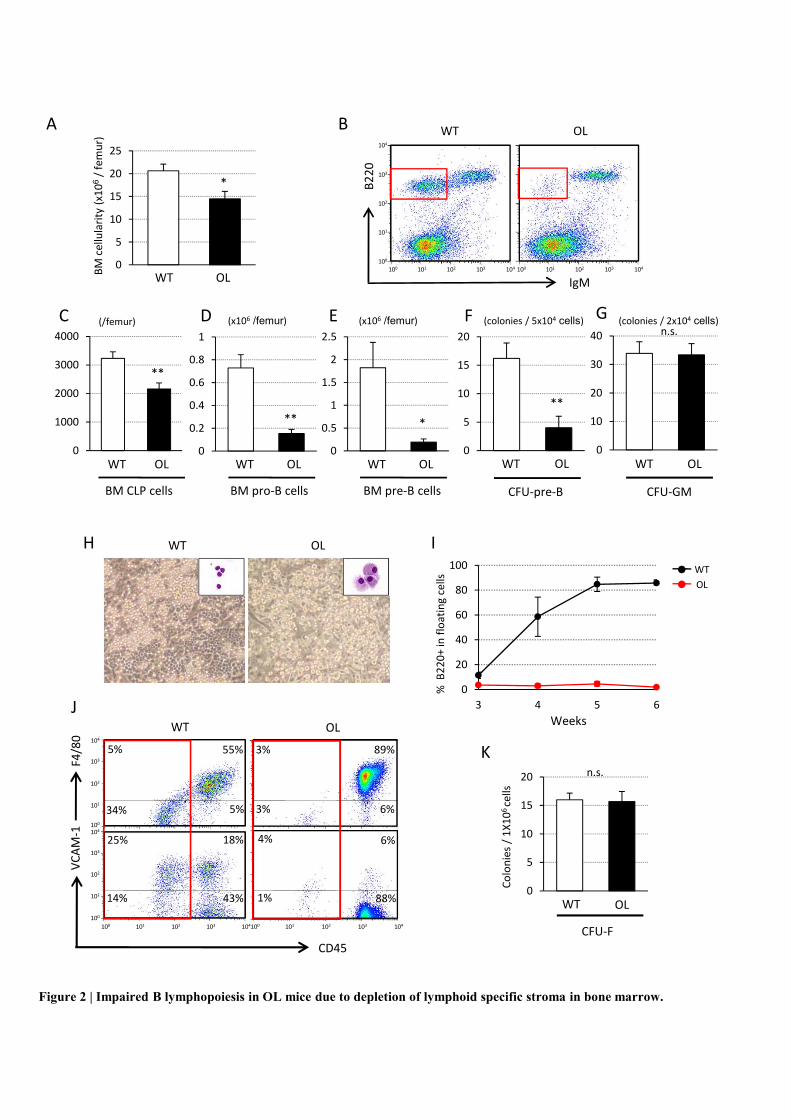
Impaired B lymphopoiesis in OL mice caused by depletion of lymphoid-specific 4
stroma in bone marrow 5
We next evaluated lymphopoiesis in the BM, which is the primary organ 6
for B-lymphogenesis. Although BM cellularity decreased only slightly, 7
B220+/IgM-immature B cell fraction was markedly depleted in OL mice (Figures 8
2A and 2B). Hematopoietic stem cells (HSCs) were not affected in OL mice 9
because the number of lineage-/IL-7Rα-/Sca-1+/c-kit+ cells was normal (Figure 10
S2A). Furthermore, in the competitive repopulation assay, the chimerism of BM 11
cells from OL mice was comparable to those from control mice (Figures S2B and 12
S2C), which indicated that the lymphoid-specific defect in OL mice was ascribed 13
to the hematopoietic microenvironment, but not to HSCs. While common 14
lymphoid progenitors (CLP; lineage-/IL-7Rα+/Sca-1+/c-kit+) decreased only 15
modestly, pro-B (B220+/IgM-/CD43+) and pre-B (B220+/IgM-/CD43-) cells were 16
markedly reduced in numbers (Figures 2C-E). Results of colony-forming unit 17
(CFU) assays were consistent with a lymphoid-specific defect; wherein, the 18

7
number of CFU-pre-B was greatly reduced in OL BM (Figure 2F), while myeloid 1
CFU-granulocyte/macrophage (GM) was normal (Figure 2G). Thus, the marked 2
decrease in B cells in the BM of OL mice took place at an early important step 3
during B-lymphogenesis when the support by the specific stroma was required 4
(Hardy et al., 1991). A key factor for B lymphopoiesis, CXCL12 (Egawa et al., 5
2001), was not decreased at neither the protein nor the mRNA level in OL mice 6
BM (data not shown). Furthermore, to examine whether the impairment of 7
B-lymphopoiesis was due to the decrease in osteocyte-secreted factors, we 8
cultured WT BM cells on the layer of osteolineage cell lines, namely ST2 9
(mesenchymal stromal cells), MC3T3-E1 (osteoblastic cells), and MLO-Y4 10
(osteocytic cells). The results showed that B-lymphoid progenitor cells 11
(B220+IgM- cells) were well maintained on the ST2 but not on the MC3T3-E1 12
and MLO-Y4 (Figure S2D). These data suggested that neither 13
osteocyte-secreted molecules nor direct contact with osteocytes may be 14
essential for the maintenance of B-lymphogenesis. 15
To investigate BM stromal cell function, we performed long-term BM 16
cultures that specifically support B-lymphopoiesis (B-LTBMC) and myelopoiesis 17
(M-LTBMC). Under B-LTBMC condition, BM cells from normal mice formed a 18

8
stromal layer and supported the production of small lymphoid-appearing B220+ 1
cells. Strikingly, OL BM cultures did not produce small lymphoid-like cells but 2
instead generated similar numbers of macrophages throughout the 6-week 3
culture period (Figures 2H and 2I). In contrast, cultures from OL BM grown under 4
M-LTBMC conditions were indistinguishable from those of normal mice (Figures 5
S2E and S2F). The control adherent layer grown under B-LTBMC conditions 6
contained approximately 30-40% of non-hematopoietic stromal cells 7
(CD45-F4/80- and CD45-VCAM-1+), and the rest were macrophages 8
(CD45+F4/80+). Noticeably, the vast majority of adherent cells in OL BM 9
cultures were macrophages, and the non-hematopoietic stromal fraction was 10
almost depleted (Figure 2J). Under M-LTBMC conditions, non-hematopoietic 11
stromal cells were comparable between control and OL cultures (Figure S2G). 12
Mesenchymal progenitors, as assessed by fibroblast colony-forming units 13
(CFU-F) assay, were normal in OL BM (Figure 2K), and the switch from M- into 14
B-LTBMC conditions gave rise to B cells together with normal stromal 15
components (Figures S2H-J). These results suggested that the severe 16
impairment of B-lymphopoiesis in OL BM was due to a depletion of 17
B-lymphoid-specific stromal cells. 18
9
1
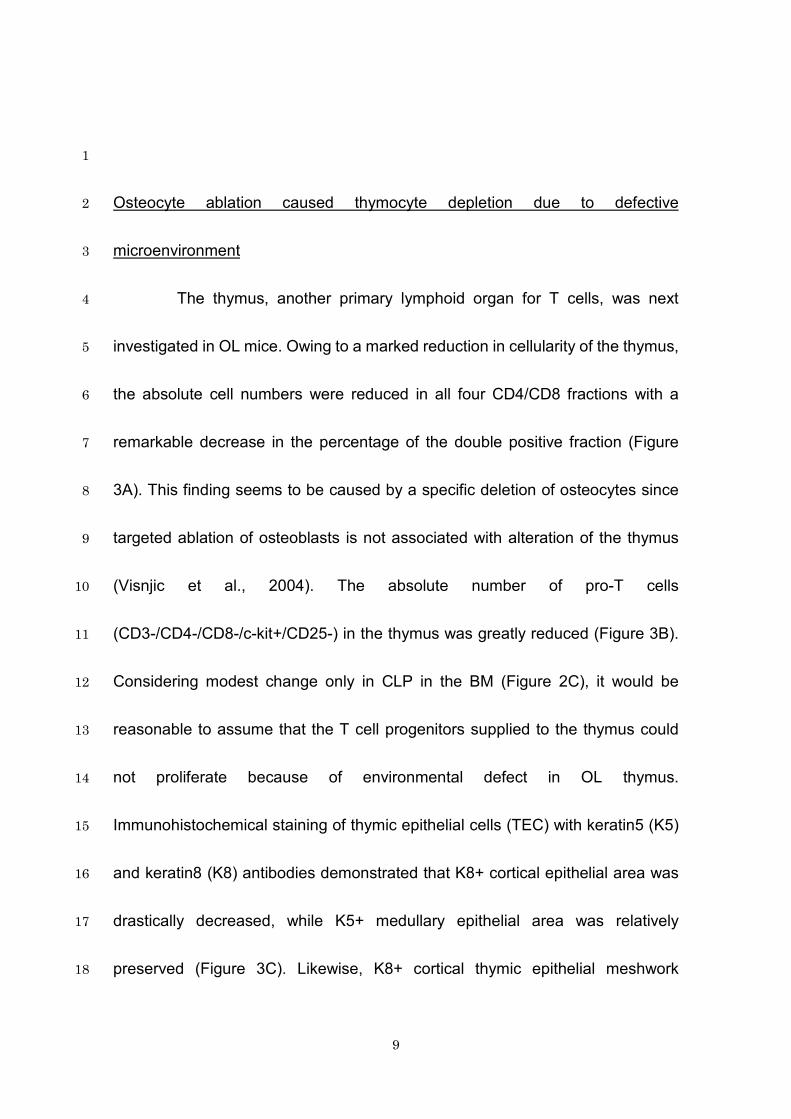
Osteocyte ablation caused thymocyte depletion due to defective 2
microenvironment 3
The thymus, another primary lymphoid organ for T cells, was next 4
investigated in OL mice. Owing to a marked reduction in cellularity of the thymus, 5
the absolute cell numbers were reduced in all four CD4/CD8 fractions with a 6
remarkable decrease in the percentage of the double positive fraction (Figure 7
3A). This finding seems to be caused by a specific deletion of osteocytes since 8
targeted ablation of osteoblasts is not associated with alteration of the thymus 9
(Visnjic et al., 2004). The absolute number of pro-T cells 10
(CD3-/CD4-/CD8-/c-kit+/CD25-) in the thymus was greatly reduced (Figure 3B). 11
Considering modest change only in CLP in the BM (Figure 2C), it would be 12
reasonable to assume that the T cell progenitors supplied to the thymus could 13
not proliferate because of environmental defect in OL thymus. 14
Immunohistochemical staining of thymic epithelial cells (TEC) with keratin5 (K5) 15
and keratin8 (K8) antibodies demonstrated that K8+ cortical epithelial area was 16
drastically decreased, while K5+ medullary epithelial area was relatively 17
preserved (Figure 3C). Likewise, K8+ cortical thymic epithelial meshwork 18
10
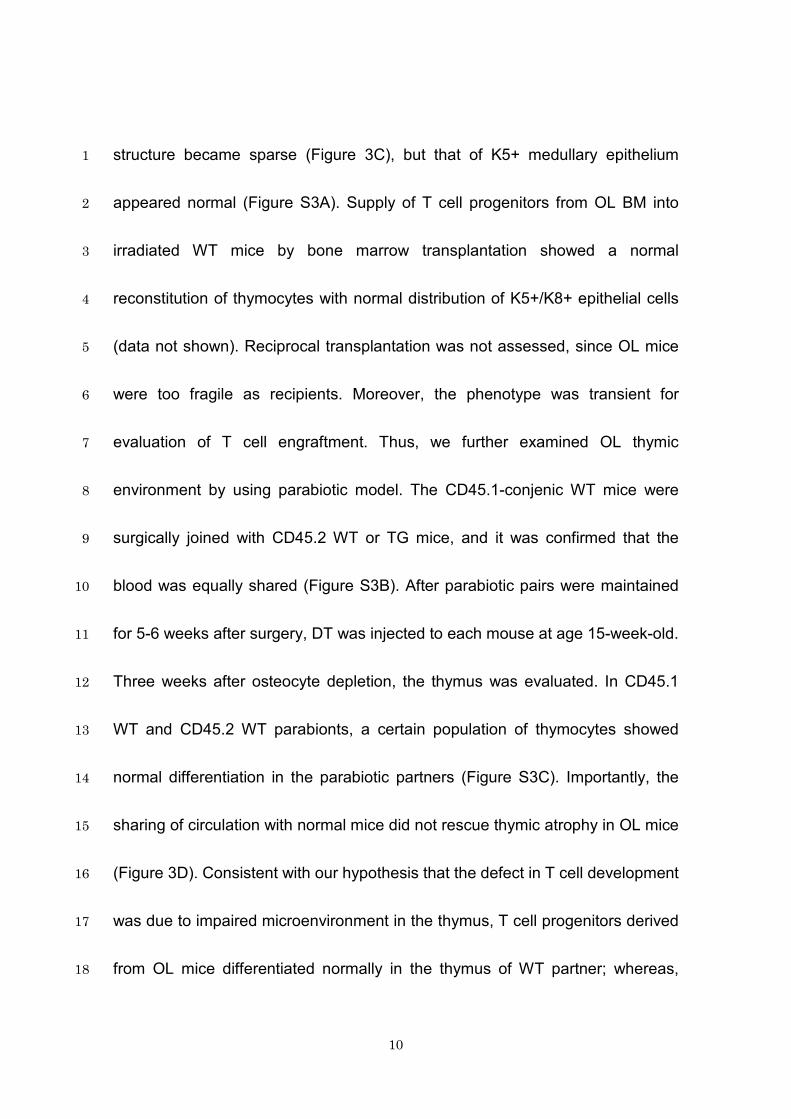
structure became sparse (Figure 3C), but that of K5+ medullary epithelium 1
appeared normal (Figure S3A). Supply of T cell progenitors from OL BM into 2
irradiated WT mice by bone marrow transplantation showed a normal 3
reconstitution of thymocytes with normal distribution of K5+/K8+ epithelial cells 4
(data not shown). Reciprocal transplantation was not assessed, since OL mice 5
were too fragile as recipients. Moreover, the phenotype was transient for 6
evaluation of T cell engraftment. Thus, we further examined OL thymic 7
environment by using parabiotic model. The CD45.1-conjenic WT mice were 8
surgically joined with CD45.2 WT or TG mice, and it was confirmed that the 9
blood was equally shared (Figure S3B). After parabiotic pairs were maintained 10
for 5-6 weeks after surgery, DT was injected to each mouse at age 15-week-old. 11
Three weeks after osteocyte depletion, the thymus was evaluated. In CD45.1 12
WT and CD45.2 WT parabionts, a certain population of thymocytes showed 13
normal differentiation in the parabiotic partners (Figure S3C). Importantly, the 14
sharing of circulation with normal mice did not rescue thymic atrophy in OL mice 15
(Figure 3D). Consistent with our hypothesis that the defect in T cell development 16
was due to impaired microenvironment in the thymus, T cell progenitors derived 17
from OL mice differentiated normally in the thymus of WT partner; whereas, 18
11
those from WT mice failed to differentiate in the thymus of OL partner (Figure 1
3E). These results indicate that in the absence of normal osteocyte network 2
within the bone, microenvironment of the thymus is impaired, and the phenotype 3
is not rescued by humoral factors from normal partners in the parabiotic 4
experimental system. 5
6
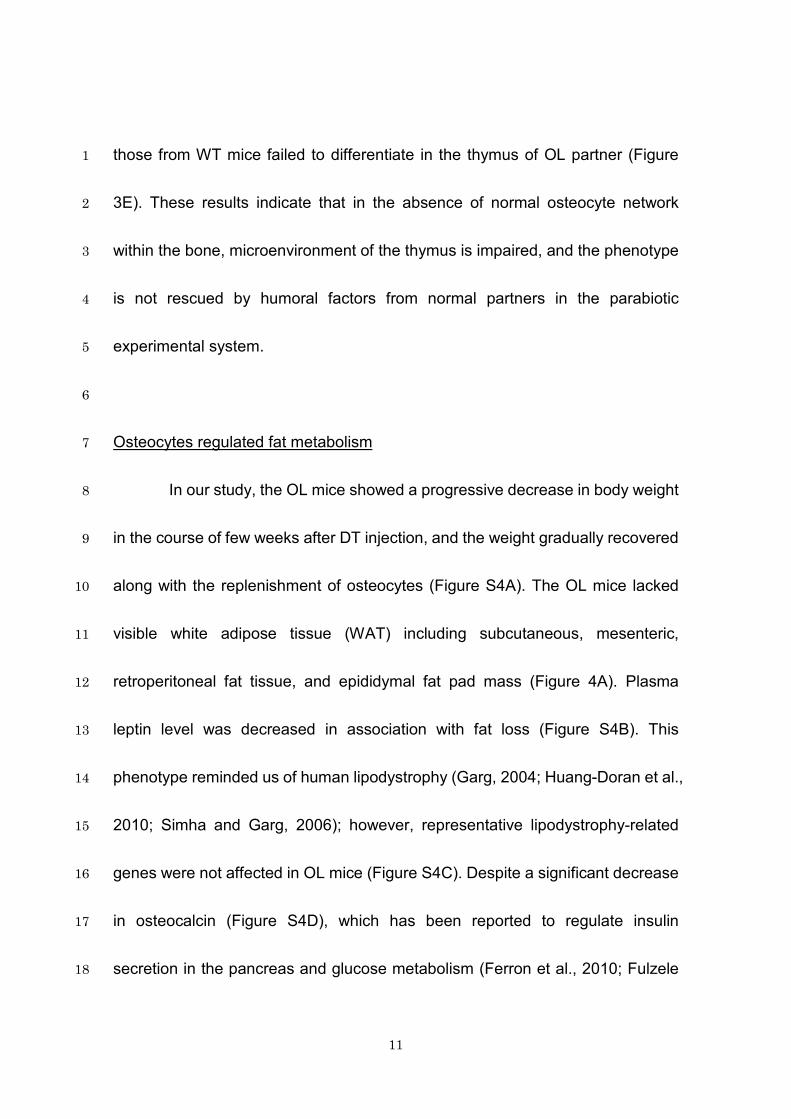
Osteocytes regulated fat metabolism 7
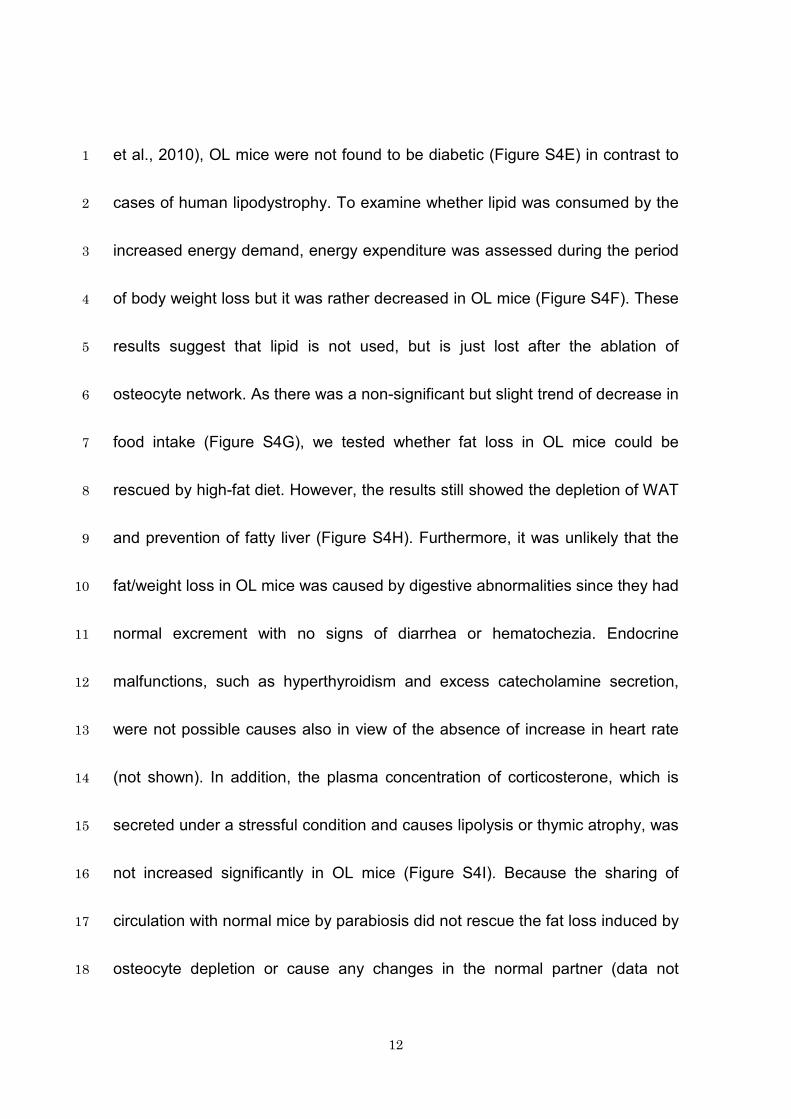
In our study, the OL mice showed a progressive decrease in body weight 8
in the course of few weeks after DT injection, and the weight gradually recovered 9
along with the replenishment of osteocytes (Figure S4A). The OL mice lacked 10
visible white adipose tissue (WAT) including subcutaneous, mesenteric, 11
retroperitoneal fat tissue, and epididymal fat pad mass (Figure 4A). Plasma 12
leptin level was decreased in association with fat loss (Figure S4B). This 13
phenotype reminded us of human lipodystrophy (Garg, 2004; Huang-Doran et al., 14
2010; Simha and Garg, 2006); however, representative lipodystrophy-related 15
genes were not affected in OL mice (Figure S4C). Despite a significant decrease 16
in osteocalcin (Figure S4D), which has been reported to regulate insulin 17
secretion in the pancreas and glucose metabolism (Ferron et al., 2010; Fulzele 18
12
et al., 2010), OL mice were not found to be diabetic (Figure S4E) in contrast to 1
cases of human lipodystrophy. To examine whether lipid was consumed by the 2
increased energy demand, energy expenditure was assessed during the period 3
of body weight loss but it was rather decreased in OL mice (Figure S4F). These 4
results suggest that lipid is not used, but is just lost after the ablation of 5
osteocyte network. As there was a non-significant but slight trend of decrease in 6
food intake (Figure S4G), we tested whether fat loss in OL mice could be 7
rescued by high-fat diet. However, the results still showed the depletion of WAT 8
and prevention of fatty liver (Figure S4H). Furthermore, it was unlikely that the 9
fat/weight loss in OL mice was caused by digestive abnormalities since they had 10
normal excrement with no signs of diarrhea or hematochezia. Endocrine 11
malfunctions, such as hyperthyroidism and excess catecholamine secretion, 12
were not possible causes also in view of the absence of increase in heart rate 13
(not shown). In addition, the plasma concentration of corticosterone, which is 14
secreted under a stressful condition and causes lipolysis or thymic atrophy, was 15
not increased significantly in OL mice (Figure S4I). Because the sharing of 16
circulation with normal mice by parabiosis did not rescue the fat loss induced by 17
osteocyte depletion or cause any changes in the normal partner (data not 18
13
shown), fat/weight loss could not be attributed to the humoral mechanism. These 1
results lead us to speculate that the integrity of osteocyte network is required for 2
fat maintenance, and raise the possibility that osteocyte network within the bone 3
controls fat metabolism through the central nervous system (CNS). 4
It is recognized that certain areas of the brain, such as the ventromedial 5
hypothalamic nucleus (VMH) and arcuate nucleus (ARC), also control bone 6
metabolism via the sympathetic nervous system in response to leptin signaling 7
(Elefteriou et al., 2005; Takeda et al., 2002). Thus, we hypothesized that 8
osteocytes might cooperate with the CNS to regulate fat metabolism. To test this, 9
the VMH was ablated before osteocyte depletion. As expected, VMH ablation 10
induced drastic obesity with high amount of WAT in both WT and Tg mice. After 11
DT injection, thymic atrophy and peripheral WAT loss occurred in Tg mice 12
irrespective of VMH ablation (Figures S4J and S4K). Strikingly, the liver of OL 13
mice with ablated VMH became markedly enlarged and whitish in color due to 14
severe fat accumulation (Figure 4B). This model of aberrant fat distribution 15
recapitulates the phenotype of the human generalized lipodystrophy with hepatic 16
steatosis (Garg, 2004). The sharing of circulation between VMH-ablated OL 17
mice and normal partners by parabiosis, although the recovery of peripheral 18
14
WAT loss was not observed (data not shown), rescued the severe accumulation 1
of fat in the liver (Figure 4C) suggestive of impaired fat clearance machinery in 2
the liver. The expression of sterol regulatory element-binding protein-1c 3
(SREBP1c) (Horton et al., 2002), a key lipogenic activator in non-alcoholic 4
steatohepatitis (NASH), was markedly suppressed in VMH-ablated OL mice 5
(Figure 4D) perhaps due to a negative feedback mechanism. The Fbxw7 6
(Onoyama et al., 2011), a ubiquitin ligase that promotes the degradation of 7
SREBP1c, was not critically affected by VMH-ablation or osteocyte depletion. 8
Importantly, the expression of microsomal triglyceride transfer protein (MTP), a 9
main player in the fat clearance from the liver, and apoB (Letteron et al., 2003; 10
Shindo et al., 2010) was increased by VMH-ablation most likely to dispose an 11
increased fat intake, but the increase was cancelled by the depletion of 12
osteocytes (Figure 4D). Ablation of ARC also induced obesity, and ARC-ablated 13
OL mice exhibited fat loss and hepatic steatosis (data not shown). The 14
expression of fat clearance genes in the liver, such as MTP and apoB, was 15
suppressed by ARC-ablation (Figure 4D). Although each part of the brain may 16
affect fat clearance from the liver through different mechanisms, a large amount 17
of fat that flows out of peripheral WAT following osteocyte depletion may 18

15
accumulate in the liver, where the fat clearance system is impaired by the 1
ablation of hypothalamic nuclei or osteocytic network. Levels of plasma free fatty 2
acid (FFA) and triglyceride were severely decreased by osteocyte depletion; 3
however, these levels were restored by the ablation of the VMH perhaps in 4
association with fat accumulation in the liver (Figure S4L). 5
These data suggest that osteocytes may control fat maintenance in the 6
whole body including the circulation, and the hypothalamus may cooperate with 7
this system by regulating the liver function. 8
9
Bone environment after osteocyte depletion 10
This OL mouse model is known to not only induce osteocyte ablation, 11
but also osteoclast activation (Tatsumi et al., 2007). One could think that rapid 12
bone remodeling by the drastic activation of osteoclasts or inflammatory 13
cytokines as triggered by damaged osteocytes might affect lymphopoiesis and 14
fat metabolism. To address this concern, we examined the bone environment. 15
As previously described (Tatsumi et al., 2007), the RANKL mRNA and the 16
number of osteoclasts were slightly elevated in OL mice (Figures S4M and S4N). 17
However, bone remodeling rate, as assessed by the calcein double labeling, did 18
16
not differ between WT and OL mice (Figure S4O). In addition, ovariectomy, 1
known as a model of heightened bone remodeling, augments B lymphopoiesis 2
and body weight according to the literature (Chen and Heiman, 2001; Erben et 3
al., 1998; Wronski et al., 1986). Conversely, as a model of lowered bone 4
remodeling, we assessed aged Tg mice (48-54 -week-old). After DT injection, 5
similar phenotype as in 18-week-old mice was observed, including the drastic 6
decrease of lymphoid progenitors and, to a lesser extent, fat loss (Figure S4P). 7
Next, the level of inflammatory cytokines in the plasma and bone marrow 8
extracellular fluid was measured, and there was no difference between WT and 9
OL mice (Figures S4Q and S4R). Although the effect of osteocyte ablation on 10
lymphopoiesis and fat metabolism could be partially influenced by the rate of 11
bone remodeling or by the minor subpopulations of DMP-1-expressing cells in 12
the thymic stroma or brain, these results suggested that majority of the 13
phenotype in OL mice was a direct result of the lack of osteocyte function. 14
15
Discussion 16
This study reveals unexpected roles for bone osteocytes. The results 17
suggest that bone governs lymphopoiesis through the regulation of the 18

17
microenvironment in primary lymphoid organs, and also controls fat metabolism 1
throughout the body in cooperation with the brain (Figure 4E). Considering the 2
reduced number of lymphocytes in the marrow of unloaded bone (Figures 3
S1A-D), signals in the osteocyte network activated by gravity may be 4
indispensable for the maintenance of multiple distant organs. 5
Although the signaling mechanism that links the bone with lymphoid 6
organs or fat tissues remains to be elucidated, one potential candidate is the 7
nervous system, given our previous observation of a rapidly progressive 8
lymphopenia due to a lymphoid-specific stromal defect in UDP-galactose 9
ceramide galactosyltransferase-deficient (cgt-/-) mice (Katayama and Frenette, 10
2003). The key enzyme for synthesis of major glycolipids in myelin sheath is cgt. 11
The fact that cgt-/- mice display impaired neural conduction suggests that 12
stromal-dependent lymphopoiesis is regulated by the nervous system. To 13
examine whether osteocytes affect lymphopoiesis and fat metabolism through 14
the nervous system, we performed chemical and surgical denervation such as 15
adrenergic nerve destruction by 6-hydroxydopamine treatment, interception of 16
the vagus nerve that innervates the thymus, or disruption of afferent nerves by 17
capsaicin treatment before osteocyte depletion. However, none of these 18

18
interventions rescued the defect in OL mice (data not shown). In addition, nerve 1
conduction velocity was normal in OL mice (data not shown). Further studies on 2
humoral factors that cannot be supplied by parabiosis, as well as interaction of 3
bone with the nervous system may be necessary. 4
Osteoblasts are now thought to be key players not only in bone 5
homeostasis, but also in the maintenance of other organs (Karsenty and Ferron, 6
2012). Several genetic models of osteoblast-specific depletion by using 7
osteocalcin promoter have been published to investigate the role of osteoblasts 8
in vivo. However, osteocalcin promoter has high activity in differentiated 9
osteoblasts but is also active in osteocytes which terminally differentiate from 10
osteoblasts (O'Brien et al., 2004). In a model, inducible ablation of 11
osteocalcin-expressing cells resulted in the alteration of both glucose and fat 12
metabolisms (Yoshikawa et al., 2011). Interestingly, the administration of 13
recombinant osteocalcin in this model reversed many of the abnormalities in 14
glucose homeostasis but not the decreased fat in the gonad and liver. Together 15
with our observations on OL mice, in which glucose metabolism does not appear 16
to be altered but fat loss is prominent, osteoblasts and osteocytes may 17
preferentially regulate glucose and fat metabolisms, respectively. 18

19
Our current findings imply that signals in the osteocyte network induced by 1
the sensation of gravity are important for the maintenance of whole organ 2
homeostasis and systemic health. Although the brain has been recognized as 3
the central control of all organs, this study suggests that bone may also act as a 4
central regulator of multiple organs. 5
20
Experimental Procedures 1
Mice 2
The DMP-1 DTR Tg mice (Tatsumi et al., 2007) were backcrossed for more than 3
nine generations into C57BL/6 background before use. Fifteen-week-old WT 4
and Tg littermate mice were injected with a single dose of DT (20μg/kg, i.p., 5
Sigma-Aldrich Japan, Tokyo, Japan), and then samples were harvested and 6
examined 3 weeks later (at 18-week-old) unless otherwise indicated. The 7
C57BL/6-CD45.1 congenic mice were purchased from The Jackson Laboratory 8
(BarHarbor, ME). All mice were fed a normal diet except the high fat diet 9
experiment for Figure S4H. All animal experiments were approved by the 10
Institutional Animal Care and Use Committee and were carried out according to 11
the Kobe University Animal Experimentation Regulations. 12
13
Flow Cytometry 14
Antibodies: biotin mouse lineage panel, PE-anti-B220 (clone RA3-6B2), 15
PE-anti-CD3ε (clone 145-2C11), PE-anti-c-kit (clone 2B8), FITC-anti-Sca-1 16
(clone E13-161.7), FITC-anti-CD45.2 (104), biotin-anti-CD45.1 (A20), 17
21
PE-anti-CD4 (GK1.5), FITC-anti-CD8 (53-6.7), and biotin-anti-CD25 (7D4) were 1
from BD Pharmingen (San Diego, CA). FITC-anti-IgM was from Southern 2
Biotech (Birmingham, AL). PE-Cy5-anti-IL-7R (A7R34), APC-anti-CD45.2 (104), 3
biotin-anti-F4/80 (BM8), biotin-anti-VCAM-1 (429), APC-streptavidin, and 4
PE-streptavidin were from eBioscience (San Diego, CA). Cells were suspended 5
in PBS/0.5% BSA/2mM EDTA. Adherent cells in long-term BM cultures were 6
stained after trypsinization and were analyzed using high-side scatter gating as 7
previously described (Katayama and Frenette, 2003). Cell analyses were 8
performed on a FACSCalibur flow cytometer with CellQuest software (Becton 9
Dickinson, Mountain View, CA) and MoFloTM XDP flow cytometer with summit 10
software (Beckman Coulter, Harbor Blvd, CA). 11
12
Cell Isolation and CFU Assays 13
Bone marrow cells were harvested by flushing the femora aseptically in RPMI, 14
and single-cell suspension was obtained by gentle aspiration several times. The 15
suspension volume was measured with a graduated pipette. The CFU-GM 16
assays were done by inoculating bone marrow mononuclear cells into Methocult 17
22
M3534 media (StemCell Technologies, Vancouver, Canada) according to 1
manufacturer’s recommendation. The IL-7-dependent CFU-pre-B assays were 2
done using Methocult M3630, and CFU-F cells were assayed in MesenCult 3
Basal Medium supplemented with Mesenchymal Stem Cell Stimulatory 4
Supplement (StemCell Technologies). 5
6
Co-cultures of bone marrow cells with osteolineage cell lines 7
ST2 (mesenchymal stromal cells), MC3T3-E1 (osteoblastic cells), and MLO-Y4 8
(osteocytic cells) were grown to semi-confluence in αMEM supplemented with 9
10% fetal bovine serum (FBS) in six-well culture plates. The medium was 10
removed, and 1x10⁶ adherent cell-depleted bone marrow samples from 7-week 11
old WT mice were cultured with or without the osteolineage cell layer in 12
RPMI1640 supplemented with 5% FBS and 5x10⁻⁵ M 2-mercaptoethanol at 37℃ 13
for 4 days. Floating cells were analyzed for B220/IgM expression by flow 14
cytometry. 15
16

23
Long-Term Bone Marrow Cultures 1
The B- and M-LTBMC were performed exactly as previously described 2
(Katayama and Frenette, 2003). 3
4
Generation of chimeric mice 5
Chimeric mice were generated by injection of 5 x 10⁶ WT or OL mice (CD45.2) 6
bone marrow nucleated cells (BMNCs) into lethally-irradiated (14 Gy, split dose) 7
CD45.1 mice. Reconstitution by donor cells was confirmed in all mice by blood 8
cell count and CD45.1/CD45.2 chimerism of peripheral blood leukocytes 9
monthly. For competitive reconstitution, 1 x 10⁶ BMNCs from DT-injected WT or 10
OL mice (CD45.2) were injected together with 1 x 10⁶ fresh BM competitor cells 11
(CD45.1) into lethally-irradiated (14Gy, split dose) C57BL/6-CD45.1 congenic 12
mice. Blood was harvested monthly from recipient mice, and the expressions of 13
CD45.1 and CD45.2 were assessed by flow cytometry. 14
15
Parabiosis 16
24
Pairs of 9-10-week-old mice were anaesthetized and prepared for surgery. 1
Mirror image incisions at the left and right flanks, respectively, were made 2
through the skin. The skin of the adjacent parabiont was sutured together. 3
Cross-circulation was determined in a subset of parabiotic pairs by measuring 4
the frequency of blood cells from one partner (CD45.1) in the blood of the other 5
partner (CD45.2). Each mouse, including WT partner, was injected with DT 5-6 6
weeks after the surgery (at 15-week-old) and then euthanized 3 weeks after DT 7
injection. Blood chimerism at the time of euthanization was typically between 8
40% and 60%. 9
10
Histological analysis 11
Liver tissue was frozen in OCT compound (Sakura Fine Technical, Tokyo, 12
Japan) and stained with H&E and Oil red O according to standard procedures. 13
Femoral bones were fixed overnight in 4% paraformaldehyde (PFA), frozen in 14
OCT compound, sectioned and stained for TRAP with TRAP/ALP Stain Kit 15
(Wako, Tokyo, Japan). Histological staining to visualize bone interstitial fluid 16
space using FITC was performed as described (Ciani et al., 2009). Bone labeling 17
with peritoneal injection of calcein (20mg/kg body weight; Dojinwako, Tokyo, 18

25
Japan) was performed at 5 and 2 days before death in mice used for 1
histomorphometry. The fluorescent signal derived from calcein labeling was 2
analyzed using LSM510 confocal laser scanning (CLS) microscopy system (Carl 3
Zeiss, Oberkochen, Germany). 4
5
Immunofluorescence Microscopy 6
Femoral bones were decalcified in 10% EDTA (pH 7.4) for 2 weeks, snap-frozen 7
in liquid nitrogen-chilled hexane, and sectioned at 10μm thickness. Sections 8
were fixed with 4% PFA for 10min, stained with anti-CD44 (BD Pharmingen) 9
followed by donkey Alexa-488-anti-rat IgG (Invitrogen, Carlsbad, CA), and 10
mounted in Vectashield Mounting Medium with 4,6-diamidino-2-phenylindole 11
(DAPI) (Vector Laboratories, Burlingame, CA). For phalloidin staining, the 12
sections were stained with Alexa488-conjugated phalloidin (Life Technologies 13
Japan, Tokyo, Japan) and mounted with Vectashield Mounting Medium with 14
DAPI. Images were captured using LSM510 CLS microscopy system (Carl 15
Zeiss). Thymic cryosections (5μm) were fixed with 4% PFA and stained with 16
anti-mouse keratin 5 (Troma-1; Developmental Studies Hybridoma Bank, 17

26
University of Iowa, Iowa City, IA) and anti–keratin 8 (Covance Research 1
Products, Berkeley, CA). Goat Alexa-488-anti-rat IgG and goat 2
Alexa-555-anti-rabbit IgG (Invitrogen) were used as secondary antibodies. 3
Images were captured using KEYENCE BZ-9000 fluorescent microscope 4
(Keyence, Osaka, Japan). 5
6
RNA Extraction and Q-PCR 7
Total RNA was extracted from BMNCs using TRIzol solution (Invitrogen). The 8
bone carcass and other tissues were then immersed in liquid nitrogen, and 9
pulverized into powder followed by RNA extraction with TRIzol. Total RNA (2μg) 10
was treated with DNaseI (Invitrogen), and reverse transcribed using first strand 11
cDNA synthesis with random primers (Promega, Madison, WI). The Q-PCR was 12
performed using SYBRGreen (Life Technologies Japan) on LightCycler® 480 13
System (Roche Diagnostics, Mannheim, Germany). Primers used are listed in 14
Table S1. All experiments were done in triplicate and normalized to β-actin. 15
16
Pharmacological disruption of neurons or CNS 17

27
Ablation of VMH and ARC was done as described elsewhere (Takeda et al., 1
2002). Briefly, to ablate VMH, four-week-old mice were given a single 2
intraperitoneal injection with Gold thioglucose (GTG) (0.5 mg/g of body weight, 3
Research Diagnostics, Inc., NJ). To ablate ARC, 2-day-old C57BL/6 pups were 4
given daily subcutaneous injections of monosodium glutamate (MSG) (2 mg/g, 5
Sigma-Aldrich Japan) for 9 days. DT was injected at the age of 15-week-old. 6
7
Metabolic studies 8
The energy expenditure measurements were obtained using an 8-chamber 9
Oxymax system (Columbus Instruments, Columbus, OH). After 5 days 10
acclimation to the apparatus, data for 24hr measurement were exported to 11
Comma Separated Value (CSV) files and analyzed as recommended by 12
manufacturer. 13
Plasma leptin, plasma insulin, and osteocalcin concentrations in the plasma and 14
bone marrow extracellular fluid (BMEF; obtained as previously described 15
(Katayama et al., 2006)) were measured with ELISA kits (BioVendor Candler, 16
NC; Shibayagi, Gunma, Japan; Biomedical Technologies Inc., Stoughton, MA, 17

28
respectively). Plasma corticosterone levels were determined by liquid 1
chromatography-tandem mass spectrometry (LC-MS/MS). Plasma FFA and 2
triglyceride concentrations were measured with NEFA C test and Triglyceride E 3
test (Wako), respectively. Blood glucose levels were determined by glucose 4
oxidase method using Glutest Sensor Neo (Sanwa Kagaku, Kyoto, Japan). 5
6
Measurement of inflammatory cytokines 7
The levels of cytokines (TNF-α, IL-12p70, IL-6, IFN-γ, IL-10, MCP-1, and IL-1 8
beta) in the plasma and BMEF from WT and OL mice were quantitated using a 9
mouse inflammation cytometric bead array (CBA) kit (BD Biosciences) and 10
mouse IL-1 beta FlowCytomix (eBioscience), according to the manufacturer’s 11
instructions. Data were acquired with a FACSCan flow cytometer (Becton 12
Dickinson) and analyzed with BD CBA Software (BD Biosciences). 13
14
Statistical Analysis 15

29
All values were given as mean ± SEM. Comparisons between groups were 1
made by Student’s t-test. 2
3
Supplemental Information 4
Supplemental information includes four supplemental figures and one 5
supplemental table, and can be found with this article online. 6
7
Acknowledgments 8
We thank Prof. Lynda Bonewald (University of Missouri- Kansas City) for 9
providing MLO-Y4 cells; Drs. T. Suzuki and S. Ishii for their help with mouse 10
maintenance; Ms. C. Fukui for her technical assistance. This work was 11
supported by the Grants-in-Aid for Young Scientist Start-up (#21890142 to M. 12
Sato), Research Fellowships for Young Scientists (#22-481 to M. Sato), and 13
Scientific Research (#23390251 to Y. Katayama) from Japan Society for the 14
Promotion of Science; and the Grants-in-Aid for Scientific Research on 15
Innovative Areas from the Ministry of Education, Culture, Sports, Science and 16

30
Technology in Japan (#23118517 to Y. Katayama), and also by Mochida 1
Memorial Foundation and Takeda Science Foundation (to Y. Katayama). 2
Conflict-of-interest disclosure: The authors declare no competing financial 3
interests. 4
31
References 1
2
Belavy, D.L., Beller, G., Armbrecht, G., Perschel, F.H., Fitzner, R., Bock, O., Borst, H., 3 Degner, C., Gast, U., and Felsenberg, D. (2011). Evidence for an additional effect of 4 whole-body vibration above resistive exercise alone in preventing bone loss during prolonged 5 bed rest. Osteoporosis international : a journal established as result of cooperation between 6 the European Foundation for Osteoporosis and the National Osteoporosis Foundation of the 7 USA 22, 1581-1591. 8 9 Bonewald, L.F. (2011). The amazing osteocyte. Journal of bone and mineral research : the 10 official journal of the American Society for Bone and Mineral Research 26, 229-238. 11 12 Chen, Y., and Heiman, M.L. (2001). Increased weight gain after ovariectomy is not a 13 consequence of leptin resistance. American journal of physiology Endocrinology and 14 metabolism 280, E315-322. 15 16 Ciani, C., Doty, S.B., and Fritton, S.P. (2009). An effective histological staining process to 17 visualize bone interstitial fluid space using confocal microscopy. Bone 44, 1015-1017. 18 19 Crucian, B., and Sams, C. (2009). Immune system dysregulation during spaceflight: clinical 20 risk for exploration-class missions. Journal of leukocyte biology 86, 1017-1018. 21 22 Egawa, T., Kawabata, K., Kawamoto, H., Amada, K., Okamoto, R., Fujii, N., Kishimoto, T., 23 Katsura, Y., and Nagasawa, T. (2001). The earliest stages of B cell development require a 24 chemokine stromal cell-derived factor/pre-B cell growth-stimulating factor. Immunity 15, 25 323-334. 26 27 Elefteriou, F., Ahn, J.D., Takeda, S., Starbuck, M., Yang, X., Liu, X., Kondo, H., Richards, 28 W.G., Bannon, T.W., Noda, M., et al. (2005). Leptin regulation of bone resorption by the 29 sympathetic nervous system and CART. Nature 434, 514-520. 30 31 Erben, R.G., Raith, S., Eberle, J., and Stangassinger, M. (1998). Ovariectomy augments B 32 lymphopoiesis and generation of monocyte-macrophage precursors in rat bone marrow. The 33 American journal of physiology 274, E476-483. 34 35
32
Ferron, M., Wei, J., Yoshizawa, T., Del Fattore, A., DePinho, R.A., Teti, A., Ducy, P., and 1 Karsenty, G. (2010). Insulin signaling in osteoblasts integrates bone remodeling and energy 2 metabolism. Cell 142, 296-308. 3 4 Fulzele, K., Krause, D.S., Panaroni, C., Saini, V., Barry, K.J., Liu, X., Lotinun, S., Baron, R., 5 Bonewald, L., Feng, J.Q., et al. (2013). Myelopoiesis is regulated by osteocytes through 6 Gsalpha-dependent signaling. Blood 121, 930-939. 7 8 Fulzele, K., Riddle, R.C., DiGirolamo, D.J., Cao, X., Wan, C., Chen, D., Faugere, M.C., Aja, 9 S., Hussain, M.A., Bruning, J.C., et al. (2010). Insulin receptor signaling in osteoblasts 10 regulates postnatal bone acquisition and body composition. Cell 142, 309-319. 11 12 Garg, A. (2004). Acquired and inherited lipodystrophies. The New England journal of 13 medicine 350, 1220-1234. 14 15 Globus, R.K., Bikle, D.D., and Morey-Holton, E. (1984). Effects of simulated weightlessness 16 on bone mineral metabolism. Endocrinology 114, 2264-2270. 17 18 Gueguinou, N., Huin-Schohn, C., Bascove, M., Bueb, J.L., Tschirhart, E., Legrand-Frossi, C., 19 and Frippiat, J.P. (2009). Could spaceflight-associated immune system weakening preclude 20 the expansion of human presence beyond Earth's orbit? Journal of leukocyte biology 86, 21 1027-1038. 22 23 Hardy, R.R., Carmack, C.E., Shinton, S.A., Kemp, J.D., and Hayakawa, K. (1991). 24 Resolution and characterization of pro-B and pre-pro-B cell stages in normal mouse bone 25 marrow. The Journal of experimental medicine 173, 1213-1225. 26 27 Horton, J.D., Goldstein, J.L., and Brown, M.S. (2002). SREBPs: activators of the complete 28 program of cholesterol and fatty acid synthesis in the liver. The Journal of clinical 29 investigation 109, 1125-1131. 30 31 Huang-Doran, I., Sleigh, A., Rochford, J.J., O'Rahilly, S., and Savage, D.B. (2010). 32 Lipodystrophy: metabolic insights from a rare disorder. The Journal of endocrinology 207, 33 245-255. 34 35

33
Karsenty, G., and Ferron, M. (2012). The contribution of bone to whole-organism physiology. 1 Nature 481, 314-320. 2 3 Katayama, Y., Battista, M., Kao, W.M., Hidalgo, A., Peired, A.J., Thomas, S.A., and Frenette, 4 P.S. (2006). Signals from the sympathetic nervous system regulate hematopoietic stem cell 5 egress from bone marrow. Cell 124, 407-421. 6 7 Katayama, Y., and Frenette, P.S. (2003). Galactocerebrosides are required postnatally for 8 stromal-dependent bone marrow lymphopoiesis. Immunity 18, 789-800. 9 10 Klein-Nulend, J., Bakker, A.D., Bacabac, R.G., Vatsa, A., and Weinbaum, S. (2013). 11 Mechanosensation and transduction in osteocytes. Bone 54, 182-190. 12 13 Lang, T., LeBlanc, A., Evans, H., Lu, Y., Genant, H., and Yu, A. (2004). Cortical and 14 trabecular bone mineral loss from the spine and hip in long-duration spaceflight. Journal of 15 bone and mineral research : the official journal of the American Society for Bone and 16 Mineral Research 19, 1006-1012. 17 18 Letteron, P., Sutton, A., Mansouri, A., Fromenty, B., and Pessayre, D. (2003). Inhibition of 19 microsomal triglyceride transfer protein: another mechanism for drug-induced steatosis in 20 mice. Hepatology 38, 133-140. 21 22 O'Brien, C.A., Jia, D., Plotkin, L.I., Bellido, T., Powers, C.C., Stewart, S.A., Manolagas, S.C., 23 and Weinstein, R.S. (2004). Glucocorticoids act directly on osteoblasts and osteocytes to 24 induce their apoptosis and reduce bone formation and strength. Endocrinology 145, 25 1835-1841. 26 27 Onoyama, I., Suzuki, A., Matsumoto, A., Tomita, K., Katagiri, H., Oike, Y., Nakayama, K., 28 and Nakayama, K.I. (2011). Fbxw7 regulates lipid metabolism and cell fate decisions in the 29 mouse liver. The Journal of clinical investigation 121, 342-354. 30 31 Shindo, N., Fujisawa, T., Sugimoto, K., Nojima, K., Oze-Fukai, A., Yoshikawa, Y., Wang, X., 32 Yasuda, O., Ikegami, H., and Rakugi, H. (2010). Involvement of microsomal triglyceride 33 transfer protein in nonalcoholic steatohepatitis in novel spontaneous mouse model. Journal 34 of hepatology 52, 903-912. 35 36
34
Simha, V., and Garg, A. (2006). Lipodystrophy: lessons in lipid and energy metabolism. 1 Current opinion in lipidology 17, 162-169. 2 3 Takeda, S., Elefteriou, F., Levasseur, R., Liu, X., Zhao, L., Parker, K.L., Armstrong, D., Ducy, 4 P., and Karsenty, G. (2002). Leptin regulates bone formation via the sympathetic nervous 5 system. Cell 111, 305-317. 6 7 Tatsumi, S., Ishii, K., Amizuka, N., Li, M., Kobayashi, T., Kohno, K., Ito, M., Takeshita, S., 8 and Ikeda, K. (2007). Targeted ablation of osteocytes induces osteoporosis with defective 9 mechanotransduction. Cell metabolism 5, 464-475. 10 11 Visnjic, D., Kalajzic, Z., Rowe, D.W., Katavic, V., Lorenzo, J., and Aguila, H.L. (2004). 12 Hematopoiesis is severely altered in mice with an induced osteoblast deficiency. Blood 103, 13 3258-3264. 14 15 Wronski, T.J., Walsh, C.C., and Ignaszewski, L.A. (1986). Histologic evidence for osteopenia 16 and increased bone turnover in ovariectomized rats. Bone 7, 119-123. 17 18 Yoshikawa, Y., Kode, A., Xu, L., Mosialou, I., Silva, B.C., Ferron, M., Clemens, T.L., 19 Economides, A.N., and Kousteni, S. (2011). Genetic evidence points to an 20 osteocalcin-independent influence of osteoblasts on energy metabolism. Journal of bone and 21 mineral research : the official journal of the American Society for Bone and Mineral 22 Research 26, 2012-2025. 23 24
25
26

35
Figure Legends 1
2
Figure 1. Osteocyte ablation causes reversible lymphopenia and lymphoid 3
organ atrophy 4
(A) Immunofluorescence staining of femoral cortical bone of WT (left) and OL 5
(right) mice. Images of CD44 and DAPI staining were merged. Original 6
magnification x100. (B) Peripheral blood cells were analyzed for surface 7
expression of B and T lymphocyte or myeloid markers (n=6-7). 8
(C, D) Gross appearance (top panels) and hematoxilin and eosin (H&E)-stained 9
sections (middle panels, original magnification x4), and organ cellularity (bottom 10
panels, n=7-9) of WT or OL thymus (C) and spleen (D). 11
(E-H) Representative femoral sections of WT or OL mice at 100 days following 12
DT administration that showed recovery of osteocyte network formation along 13
with osteocyte regeneration (E, original magnification x100). Peripheral blood 14
cell counts (F), thymus (G) and spleen (H) cellularity were also restored (n=4). 15
Data in B-D, F-H are shown as mean values ± SEM. *p<0.05, **p<0.01, 16
***p<0.001. See also Figure S1. 17
18

36
Figure 2. Impaired B lymphopoiesis in OL mice due to depletion of 1
lymphoid-specific stroma in bone marrow 2
(A) WT versus OL mice BM cellularity (n=8-9). 3
(B-E) BM nucleated cells were analyzed for surface expression of CLP (C, n=10) 4
or markers of different stages of B lymphocyte progenitors (B, D, and E, n=3-4). 5
(F, G) Frequency of CFU-pre-B (n=5) and CFU-GM (n=7-8). 6
(H) In B-LTBMC, OL mice BM produced larger floating cells than those from WT 7
BM. Original magnification x 40. The inset shows May-Giemsa-stained cytospin 8
preparations. 9
(I) Percentages of B220+ cells among floating cells in B-LTBMC at the indicated 10
periods after initiation of cultures (n=3-4). 11
(J) FACS analysis of adherent cells in B-LTBMC. Red-gated CD45-stromal cells 12
were greatly reduced in OL mice B-LTBMC (n=4). 13
(K) The number of CFU-fibroblast (CFU-F) in WT and OL mice BM (n=3). 14
Data in A, C-G, I, and K are shown as mean values ± SEM. *p<0.05, **p<0.01. 15
See also Figure S2. 16
17
37
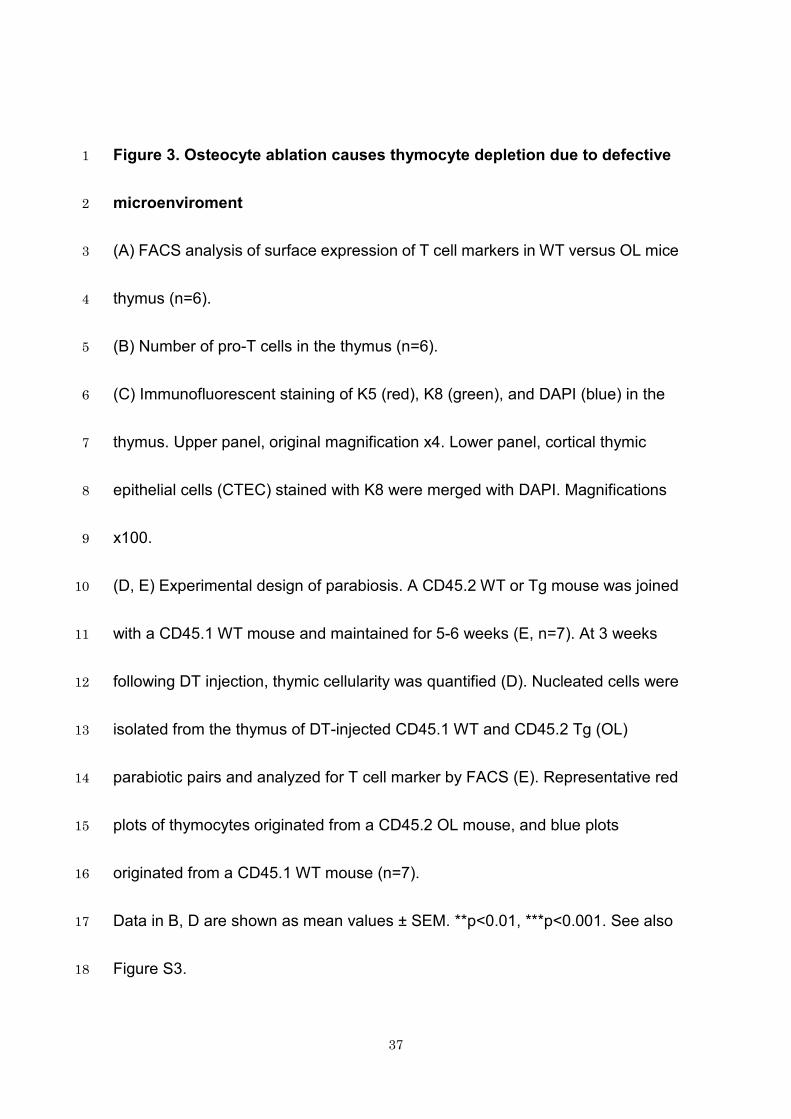
Figure 3. Osteocyte ablation causes thymocyte depletion due to defective 1
microenviroment 2
(A) FACS analysis of surface expression of T cell markers in WT versus OL mice 3
thymus (n=6). 4
(B) Number of pro-T cells in the thymus (n=6). 5
(C) Immunofluorescent staining of K5 (red), K8 (green), and DAPI (blue) in the 6
thymus. Upper panel, original magnification x4. Lower panel, cortical thymic 7
epithelial cells (CTEC) stained with K8 were merged with DAPI. Magnifications 8
x100. 9
(D, E) Experimental design of parabiosis. A CD45.2 WT or Tg mouse was joined 10
with a CD45.1 WT mouse and maintained for 5-6 weeks (E, n=7). At 3 weeks 11
following DT injection, thymic cellularity was quantified (D). Nucleated cells were 12
isolated from the thymus of DT-injected CD45.1 WT and CD45.2 Tg (OL) 13
parabiotic pairs and analyzed for T cell marker by FACS (E). Representative red 14
plots of thymocytes originated from a CD45.2 OL mouse, and blue plots 15
originated from a CD45.1 WT mouse (n=7). 16
Data in B, D are shown as mean values ± SEM. **p<0.01, ***p<0.001. See also 17
Figure S3. 18
38
1
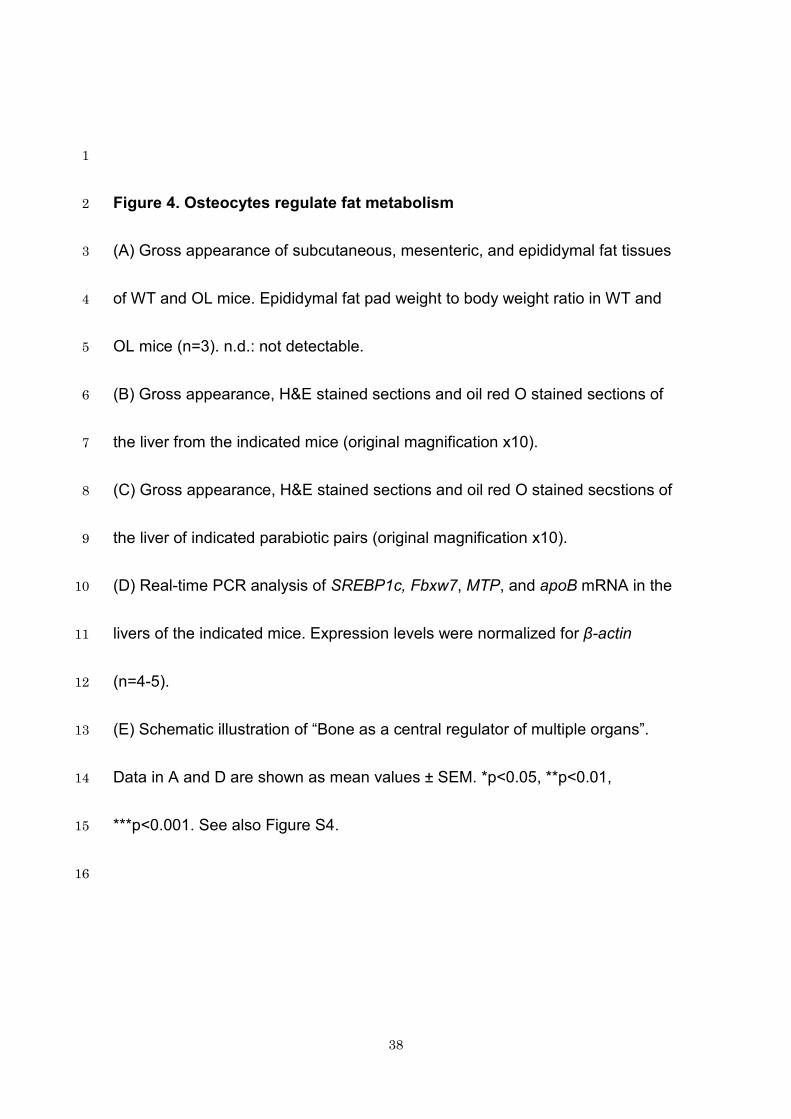
Figure 4. Osteocytes regulate fat metabolism 2
(A) Gross appearance of subcutaneous, mesenteric, and epididymal fat tissues 3
of WT and OL mice. Epididymal fat pad weight to body weight ratio in WT and 4
OL mice (n=3). n.d.: not detectable. 5
(B) Gross appearance, H&E stained sections and oil red O stained sections of 6
the liver from the indicated mice (original magnification x10). 7
(C) Gross appearance, H&E stained sections and oil red O stained secstions of 8
the liver of indicated parabiotic pairs (original magnification x10). 9
(D) Real-time PCR analysis of SREBP1c, Fbxw7, MTP, and apoB mRNA in the 10
livers of the indicated mice. Expression levels were normalized for β-actin 11
(n=4-5). 12
(E) Schematic illustration of “Bone as a central regulator of multiple organs”. 13
Data in A and D are shown as mean values ± SEM. *p<0.05, **p<0.01, 14
***p<0.001. See also Figure S4. 15
16

0
50
100
150
200
250
0
50
100
150
200
250
A WT OL B
C D
Figure 1 | Osteocyte ablation causes reversible lymphopenia and lymphoid organ atrophy.
0
1000
2000
3000
4000
5000
Num
ber o
f blo
od c
ells
/ μl
WBC B220+ B cell
CD3+ T cell
CD11b+ myeloid cell
WT OL
***
***
Thym
us c
ellu
larit
y (x
106 )
0
40
80
120
160
200
WT OL
***
WT OL
total cell number
B220+ B cell
CD3+ T cell
CD11b+ myeloid cell
Sple
en c
ellu
larit
y (x
106 ) WT
OL
***
*** ******
WT OL
WT OLE
0
5000
10000
15000
WBC B220+ B cell
CD3+T cell
CD11b+ myeloid cell
WT OL
Num
ber o
f blo
od c
ells
/ μl
F
0
20
40
60
80
100
120
Thym
us c
ellu
larit
y(x
106 )
WT OL Total cellnumber
B220+ B cell
CD3+ T cell
CD11b+ myeloid cell
WT OL
G Hn.s.
n.s.
n.s.
n.s. n.s.
n.s.
n.s.
n.s.n.s.
Sple
en c
ellu
larit
y (x
106 )
n.s.
(colonies / 2x10⁴ cells)
A B
C D
H
F
Figure 2 | Impaired B lymphopoiesis in OL mice due to depletion of lymphoid specific stroma in bone marrow.
0
5
10
15
20
Colo
nies
/ 1X
106
cells
WT OL
CFU-F
E G
0
5
10
15
20
25
BM c
ellu
larit
y (x
106
/ fem
ur)
WT OL
*
BM CLP cells
0
1000
2000
3000
4000
**
WT OL
BM pro-B cells
0
0.2
0.4
0.6
0.8
1
**
(x106 /femur)
WT OL
BM pre-B cells
0
0.5
1
1.5
2
2.5
*
WT OL0
10
20
30
40
WT OL
CFU-GM
0
5
10
15
20
WT OL
CFU-pre-B
**
WT OL
K
I
WT OL
IgM
B220
55%
5%
5%
34%
89%
6%
3%
3%
WT OL
F4/8
0
J0
20
40
60
80
100
3 4 5 6Weeks
% B
220+
in fl
oatin
g ce
lls
WT OL
6%
88%
4%
1%
18%
43%
25%
14%
VCAM
-1
CD45
n.s.
n.s.
(/femur) (x106 /femur) (colonies / 5x10⁴ cells)
100
101
102
103
104
100 101 102 103 104 100 101 102 103 104
100 101 102 103 104100 101 102 103 104100
101
102
103
104100
101
102
103
104

0
50
100
150
200
K8 /
DAP
IK5
/ K8
A B
C D
Figure 3 | Osteocyte ablation causes thymocyte depletion due to defective microenviroment.
CD 4
WT OL87% (131) 40% (8)
4% (6) 29% (1)
7% (11) 21% (1)
2% (3) 9% (0.4)0
10
20
30
40
50
Thym
us p
ro-T
cel
ls (x
104 )
WT OL
**
WT OL
45.1 WT
45.2 OL
***
Tg / 45.2mouse
CD45.1 mouse
DT injection to each
3weeks
CD 8
CD 4
CD 8
11% (5) 73% (116)
12% (4) 4% (3)
45% (0.2)
21% (0.7)
21% (0.08)
11% (0.06)
11% (5) 80% (10)
6% (0.5) 3% (0.4)
44% (2) 21% (4)
24% (0.7)
10% (0.5)
4-5 weeksafter joint
Parabiont
Thym
us c
ellu
larit
y (x
106 )
E
45.2 WT
45.1 WT
Parabiont
( x 1
06ce
lls/
orga
n)
( x106 cells/ organ)
CD45
.1 m
ouse
OL
mou
seCD45.1 mouse origin OL mouse origin
100 101 102 103 104100 101 102 103 104100
101
102
103
104
100 101 102 103 104 100 101 102 103 104100
101
102
103
104
100
101
102
103
104

VMH destructed OL
parabiont
CD45.1 WT
AWT OL
H&E
stai
nO
il re
d O
stai
n
B
WT OL
VMH destructed WT OL
Figure 4 | Osteocytes regulate fat metabolism.
Bone
Thymus
Brain
LiverPeripheral WAT
D
0
0.5
1
1.5
0
1
2
3
0
1
2
3
4
0
0.5
1
1.5
2Fbxw7SREBP1c
VMH destructed WT
WT OL
C
apoBMTP
Rela
tive
mRN
A ex
pres
sion
0
0.5
1
1.5
2
0
0.5
1
1.5
2
0
0.5
1
1.5
0
0.5
1
1.5
Arc destructed WT
***
****
******
***
** **
VMH destructed OL
Arc destructed OL
BM stromal niche
H&E
stai
nO
il Re
d O
stai
n
VMH destructed WT
parabiont
CD45.1 WT
E
Osteocyte
0
0.5
1
1.5
WT OLEpid
idym
al fa
t pad
mas
s ( %
bod
y w
eigh
t )
n.d.

Ground Tail suspension
0
1
2
3
4
5
B220+ cells (x10
6 / fe
mur)
Ground Tail suspension
*
A B
0
2000
4000
6000
8000
10000
Ground Tail suspension
Num
ber o
f blood
cells / μ
l
WBC B220+ B cell
CD3+ T cell
CD11b+ myeloid cell
C
0
50
100
150
200
Thym
us cellularity (x106)
Ground Tail suspension
D
n.s. (p=0.396) n.s.
n.s.
n.s. n.s. DT
R mRN
A expressio
n
G
0
0.5
1
1.5
0
0.5
1
1.5
DMP-‐1 mRN
A expressio
n
WT OL WT OL E F
Supplemental Figure 1

Figure S1. Osteocyte-Network in Tail Suspension and OL Models, Related
to Figure 1
The 8-week-old WT mice were subjected to skeletal unloading by tail
suspension for 4 weeks. Mice on the ground served as controls. A,
Immunofluorescence staining of unloading femoral cortical bone of ground and
tail suspension mice. Images of CD44 staining were merged with DAPI.
Tail-suspended mice showed disruption of osteocyte network formation as seen
in OL mice. Original magnification, x100. B, BM nucleated cells from unloading
femur were analyzed for surface expression of B cell marker B220 (n=3). C,D,
Peripheral blood cells (C) and thymus cellularity (D) show no systemic alteration
in lymphopoiesis in tail-suspended mice (n=3). E, Histological staining for
visualization of bone interstitial fluid space using FITC. WT and OL mice showed
similar interstitial space surrounding the osteocyte lacunae and canaliculae.
Original magnification, X100. F, Alexa488-conjugated phalloidin, which binds
specifically to actin filament, was used to stain the disruption of osteocyte
network formation in OL mice. Original magnification, X100. G, Quantitative
PCR analysis of DMP-1 and DTR gene expression in indicated organs (n=5). All
data were normalized to β-actin. Data are mean values ± SEM. *p<0.05.

0 1500 3000 4500 6000 7500 9000
HSCs / femur
WT OL
A B
C
OL donor
months aVer transplantaWon
months aVer transplantaWon months aVer transplantaWon months aVer transplantaWon
n.s.
OL WT E
F
0
50
100
150
3 4 5 6
WT
OL
weeks
% of C
D11b
+ cells
8% 71%
19% 2%
20% 24%
9% 50%
VCAM
-‐1
OL
2% 68%
22% 3%
WT
22%
9%
27%
43%
CD45
F4/80
J
3w Myeloid culture
switch
Lymphoid culture
5w
FACS analysis
28.9% 52.6%
17.7% 0.8%
IgM
33.9% 45.1%
20.3% 0.6%
1.42% 81.9%
13.4% 3.3%
1.12% 78.7%
17.5% 2.7%
CD11b
I
B220
37.6% 34.1%
20.4% 21.1%
4.9% 4.2%
37.1% 40.6%
9.6% 8.9%
49.0% 48.5%
22.5% 25.5%
18.9% 17.1%
F4/80
VCAM
-‐1
CD45
G
H
% analysis of fl
oaWn
g cells
BM with ST2 -‐ MC3T3-‐E1 MLO-‐Y4
B220+/IgM-‐ cells B220+/IgM+ cells
D***
***
Supplemental Figure 2
WT donor
OL WT
OL WT

Figure S2. Normal Stromal-Dependent Myelopoiesis in OL Mice, Related to
Figure 2
A, Absolute cell number of HSCs (lineage-/IL-7Rα-/Sca-1+/c-kit+) in WT and OL
mice BM (n=10). B,C, Competitive reconstitution was assessed by transplanting
WT or OL mice bone marrow nucleated cells together with competitor CD45.1
cells into lethally-irradiated CD45.1 mice. Chimerism of total leukocytes (B) and
lymphoid and myeloid cells (C) in peripheral blood was monitored monthly
(n=7-8). Data are mean values ± SEM. D, Co-cultures of BM cells with
osteolineage cell lines. Floating cells were analyzed for B220/IgM expression by
FACS (n=7-8, ***p<0.001). The bars show the cells within the normal
hematopoietic cell gate in Forward/Side scatter dot plot. Others and white bars
may be dead cells and myeloid cells, respectively. Data are mean values ± SEM.
E,F, M-LTBMC derived from WT (left panel) and OL (right panel) mice had
similar appearance (E) and produced similar number of CD11b+ cells (F, n=4-5).
G, FACS analysis of adherent cells in M-LTBMC. Similar numbers of stromal
cells (red gated CD45- cells) were obtained (n=4-5). H,I,J Experimental design
(H). M-LTBMC from WT and OL BM were initiated and maintained for 3 weeks,
and then switched to B-LTBMC conditions. Two weeks after the switch, WT and

OL cultures produced similar numbers of B220+ cells, including those
expressing surface IgM (I, n=3). J, FACS analysis of adherent cells in switch
cultures. Similar numbers of stromal cells (red gated CD45- cells) were obtained
(n=3).
OL WT
K5 / DAP
I K5
CD 8
CD 4
10% (10)
79% (105)
8% (4) 4% (3)
8% (2) 86% (17)
4% (2) 3% (7)
6% (0.5)
87% (5)
4% (1) 2% (2)
9% (7) 81% (106)
6% (5) 4% (3)
WT CD45.2
WT CD45.1
DT injec;on to each
3 weeks 5 -‐ 6 weeks
0
2000
4000
6000
8000
10000
White blood
cells / μ
l 45.1 45.2
WT 45.2
WT 45.1
Parabiont
B
C
(X106 cells/ organ)
A
Supplemental Figure 3

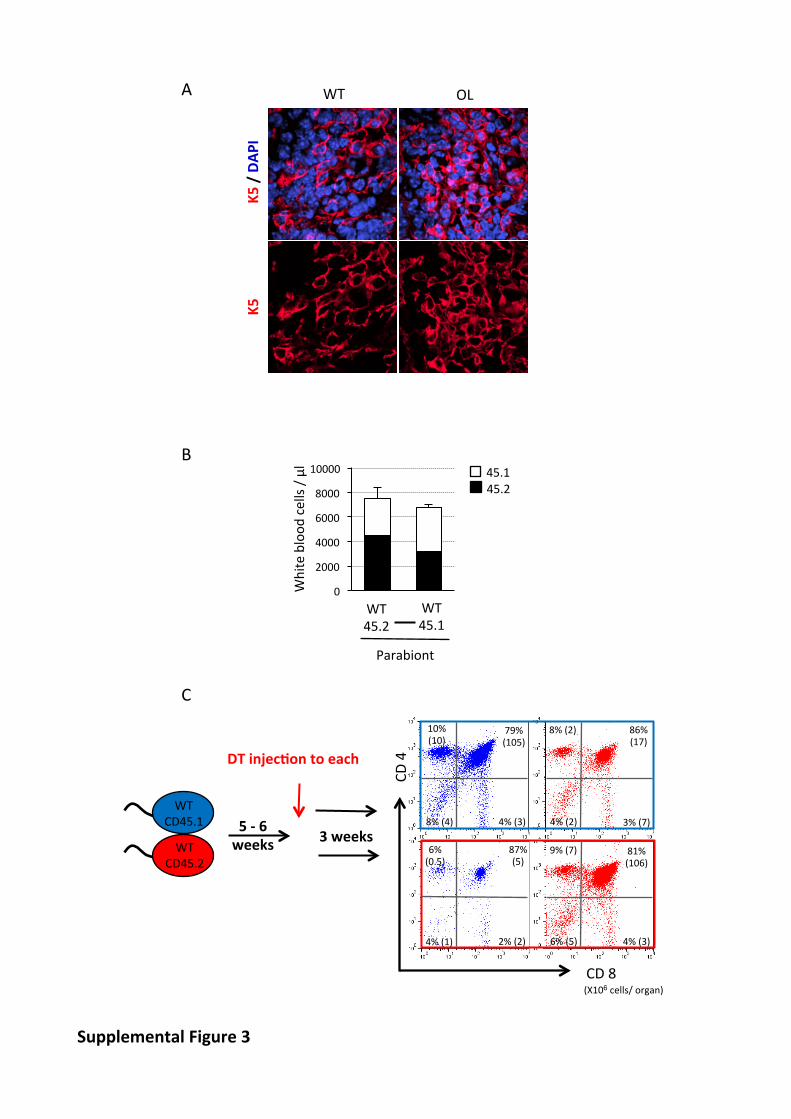
Figure S3. Assessment of Thymic Microenvironment, Related to Figure 3
A, Immunofluorescent staining of K5 (red) and DAPI (blue) in WT and OL mice
thymus. Magnifications x100. B, White blood cell (WBC) counts in peripheral
blood of CD45.2 or CD45.1 mouse of a parabiotic pair 8 weeks after parabiosis.
WBC that originated from CD45.1 (white area) and CD45.2 (black area) shared
a common blood circulation (n=6). Data are mean values ± SEM. C,
Experimental design. CD45.2 WT mouse was joined with CD45.1 WT mouse
and maintained 5-6 weeks. Each mouse of a parabiotic pair was injected with DT
and then after 3 weeks, thymic nucleated cells were isolated and analyzed for T
cell markers by FACS (n=6).

0
50
100
150
0 20 40 60 80 100 120 140
0 3 6 9 12 15
WT
OL
0
100
200
300
400
0
5
10
15
20
0
5
10
15
Weeks a3er DT injec:on
% of b
ody weight
D
A B
0
1000
2000
3000
plasma lep:
n (pg/ml)
**
WT OL 0
0.5
1
1.5
0
0.5
1
1.5
Rela:ve mRN
A expressio
n
Seipin ppar-‐γ
WT OL
Brain
0
1
2
3
0 0.5 1
1.5 2
2.5
0
5
10 Lipin-‐1 AGPAT2 ppar-‐γ
Adipose :ssue
C
Serum insulin (n
g/ml)
Bloo
d glucose (m
g/dl)
osteocalcin ( n
g/ m
l)
*
**
F
P=0.089
0 1000 2000 3000 4000 5000
0 1000 2000 3000 4000 5000
0
10
20
30
** **
* **
VO2 ( m
l/kg/hr )
VCO2 ( m
l/kg/hr )
HEAT
( kcal/kg/hr )
Day Night Day Night Day Night
E
G
0
0.05
0.1
0.15 P=0.458
Food
intake/Bod
y weight
P=0.099 P=0.364
P=0.394 P=0.474 P=0.218
BMEF plasma P=0.266
H WT OL
H&E stain
Oil Re
d O stain
High fat dieted WT OL
0
100
200
300
Thym
us cellularity (x106)
***
J
0
100
200
300
400
cor:costeron
e (ng/ml)
P=0.242
I
0
50
100
0 1 2 3 WT OL
% of b
ody weight
WT OL
Weeks a3er DT injec:on
VMH-‐ablated
VMH-‐ablated
K
0 0.2 0.4 0.6 0.8 1
0 20 40 60 80 100
Plasma triglycerid
e
(mg/dl)
Plasma FFA (m
Eq/l)
n.d.
WT OL WT OL VMH ablated
* *
0
0.5
1
1.5
2
0 1 2 3 4 5 *
RANKL m
RNA expressio
n Bone Marrow Bone L M
WT OL WT OL VMH ablated
P=0.222
0
5
10
15
N.Oc/B.Pm
(mm
-‐ 1)
*
2.4±0.1 2.2±0.1 μm
N
O WT OL
TRAP
stain
WT OL
0
1
2
3
4
fat m
ass ( % bod
y weight )
P=0.129
0
1
2
3
BM 220+/IgM-‐ cells
Aged WT OL
**
0
20
40
60
80
Thym
us cellularuty
**
P (X106)
(X106)
0
100
200
0
500
1000
1500
0 1000 2000 3000 4000 5000
0 100 200 300 400
0 2000 4000 6000 8000 10000
0
50
100
IL-‐12p70 TNF IFN-‐γ MCP-‐1
IL-‐10 IL-‐6 IL-‐1β
(pg/ml) (pg/ml) (pg/ml)
(pg/ml) (pg/ml) (pg/ml)
control WT OL
n.d. n.d. n.d. n.d. 0 0.2 0.4 0.6 0.8 1
(pg/ml)
n.d. n.d.
Q
n.d. n.d. n.d.
0 0.2 0.4 0.6 0.8 1
0 50
100 150 200
0 100 200 300 400 500
0
200
400
0 0.2 0.4 0.6 0.8 1
0
50
100
IL-‐12p70 TNF IFN-‐γ MCP-‐1 (pg/ml) (pg/ml) (pg/ml) (pg/ml)
IL-‐10 IL-‐6 IL-‐1β (pg/ml) (pg/ml) (pg/ml)
n.d. n.d. n.d.
n.d. n.d. n.d.
0 0.2 0.4 0.6 0.8 1
n.d. n.d. n.d. n.d. n.d. n.d. n.d.
n.d. n.d.
R
control WT OL
Supplemental Figure 4
WT OL WT OL WT OL WT OL
WT OL
WT OL
WT OL WT OL
WT OL WT OL WT OL

Figure S4. Fat and Energy Metabolism in OL Mice, Related to Figure 4
A, The rate of body weights of WT or OL mice was measured at indicated time
points after DT injection (n=3). B, Plasma leptin levels in WT and OL mice
(n=3-5). C, Expression of lipodystrophy-related genes, including seipin, lipin1,
and AGPAT2, and lipogenic gene, namely ppar-γ, in WT and OL mice brain or
adipose tissue by real-time PCR (n=5). In this particular experiment,
15-week-old animals were injected with DT and then examined one week later in
order not to lose all fat. D, Measurement of plasma and bone marrow
extracellular fluid osteocalcin in WT and OL mice (n=5-7). E, Blood glucose and
insulin concentrations from WT and OL mice, which were fasted for 12h. F,
Energy-balance data at 2 weeks after DT injection: oxygen consumed (VO2),
carbon dioxide produced (VCO2), and heat generated (n=4). G, Food intake was
measured in WT or OL mice (n=4-6). Data shown were normalized by the body
weight (food intake/body weight). H, Gross appearance of peripheral WAT and
liver. After 11 weeks of high-fat diet starting at 4 weeks of age, WT and Tg mice
were injected with DT. Hematoxylin and eosin (H&E)-stained and oil red
O-stained sections of the liver are shown (original magnification x10). I, Plasma
corticosterone levels in WT and OL mice (n=3). J, Thymus cellularity of

VMH-ablated WT or OL mice (n=3). K, Gross appearance of peripheral WAT
and body weight change in VMH-ablated WT or OL mice (n=4-5). L,
Concentrations of plasma free fatty acid (FFA) and triglyceride (n=4-5). Plasma
samples were obtained from WT, OL, and VMH-ablated WT and OL mice, which
were fasted for 12h. n.d.: not detected. M, RANKL mRNA expression in WT and
OL mice (n=3-4). N, TRAP-stained sections of femoral metaphysis from WT and
OL mice. Original magnification X4 (Left panel). Number of osteoclasts per bone
perimeter (Right panel; N.Oc/B.Pm). O, Representative calcein-labeled sections
of distal femur from WT (Left) and OL (Right) mice. P, Aged (48-54-week-old)
WT and OL mice, models of slow bone remodeling, showed similar effects
compared to 18-week-old OL mice (n=2-3). Q,R, Inflammatory cytokines in
plasma (Q) and bone marrow extracellular fluid (R) in WT and OL mice. Samples
from mice treated with lipopolysaccharide (50μg/mouse) were used as controls.
n.d.: not detected. n=4-5. Data are mean values ± SEM. *p<0.05, **p<0.01,
***p<0.001.

Gene Primer sequence
β-actin forward 5'-CTTCTTTGCAGCTCCTTCGTTG-3'
β-actin reverse 5'-CGACCAGCGCAGCGATATC-3'
DMP-1 forward 5'-GGCTGTCCTGTGCTCTCCCAG-3'
DMP-1 reverse 5'-GGTCACTATTTGCCTGTGCCTC-3'
DTR forward 5'-TCGAGAACTTCGCTGAGG-3'
DTR reverse 5'-CGCCAGTCACCAGTGCCGAG-3'
Srebp1c forward 5'-CATGGATTGCACATTTGAAG-3'
Srebp1c reverse 5'-CCTGTGTCCCCTGTCTCA-3'
Fbxw7 forward 5'-ACACGTTACAGGGACACACTAATAGAGT-3'
Fbxw7 reverse 5'-ACCACATGGATGCCATCAAAC-3'
MTP forward 5'-GTGGAGGAATCCTGATGGTGA-3'
MTP reverse 5'-TGATCTTAGGTGTACTTTTGCCC-3'
apoB forward 5'-CACGTGGGCTCCAGCATT-3'
apoB reverse 5'-TCACCAGTCATTTCTGCCTTTG-3'
Seipin forward 5'-GGCTCCTTCTACTACTCCCTACA-3'
Seipin reverse 5'-CCGATCACGTCCACTCTT-3'
Lipin1 forward 5'-TGG AAA TGC TCT GGC TGT GG-3'
Lipin1 reverse 5'-TGA AGA CTC GCT GTG AAT GG-3'
AGPAT2 forward 5'-TCT CTA CTG CGT GCT CTG CCT-3'
AGPAT2 reverse 5'-AGA GAT GAT GAC ACA GGG ACC-3'
ppar-γ forward 5'-TGACAGGAAAGACAACGGACAA-3'
ppar-γ reverse 5'-ATCTTCTCCCATCATTAAGGAATTCAT-3'
RANKL forward 5’-CCAGCCATTTGCACACCTCA-3’
RANKL reverse 5’-GTACCAAGAGGACAGAGTGACTTT-3’

Table S1. Primers used for PCR
The PCR protocol consisted of one cycle at 95℃ (10 min) followed by 40 cycles
of 95℃ (30 s), 60℃ (1 min), and 72℃ (1 min).