ost and performance report · cost and performance report phytoremediation at naval air station –...
TRANSCRIPT

COST AND
PERFORMANCE
REPORT
Phytoremediation at Naval Air Station – Joint Reserve Base Fort Worth
Fort Worth, TX
November 2005
Prepared by:
EPAEPA U.S. Environmental Protection Agency Office of Superfund Remediation and Technology Innovation (OSRTI)

Phytoremediation at Naval Air Station – Joint Reserve Base Fort Worth
IDENTIFYING INFORMATION
Site Name: Naval Air Station – Joint Reserve Base Fort Worth (formerly known as Carswell Air Force Base)
Location: Fort Worth, TX
TECHNOLOGY APPLICATION
Technology: Phytoremediation Period of operation: 1996 to present (expected demonstration project completion in 2006)
SITE LOGISTICS/CONTACTS
U.S. Environmental Protection Agency (EPA) Contact Steve Rock EPA Project Manager National Risk Management Research Laboratory U.S. Environmental Protection Agency 26 West Martin Luther King Drive Cincinnati, OH 45268 Tel: 513-569-7149 Fax: 513-569-7879 Email: [email protected]
Technical Contact Greg Harvey U.S. Air Force Aeronautical Systems Center/Environmental Management Restoration 1801 10th Street - Area B Wright Patterson Air Force Base, OH 45433 Tel: 937-255-3276 Fax: 937-255-4155 E-mail: [email protected]
BACKGROUND
Waste Management Practice that Contributed to Contamination: Manufacture and assembly of military aircraft
Facility Operations [1,2,4,5,8]: • The U.S. Air Force Plant 4 and adjacent Naval Air Station – Joint Reserve Base (NAS-JRB) Fort
Worth, Texas (formerly known as Carswell Air Force Base) have sustained contamination in an alluvial aquifer through the use of chlorinated solvents in the manufacture and assembly of military aircraft.
• The plant was constructed in 1942 and currently produces F-16 aircraft, radar units, and various aircraft and missile components. Historically, the manufacturing processes at Plant 4 have generated an estimated 5,500 to 6,000 tons of waste per year, including waste solvents, oils, fuels, paint residues, and miscellaneous spent chemicals. Throughout most of the plant’s history, the waste oil, solvents, and fuels were disposed in on-site landfills or burned in fire training exercises.
• Potential contamination was first noted in September 1982. Over time, it is suspected that trichloroethylene (TCE) leaked from the degreasing tanks in the assembly building at Plant 4 and migrated into the underlying aquifer. Dispersion and transport of TCE and its daughter products created a plume of contaminated groundwater.
• Previous use of a pump-and-treat system and steam-enhanced vacuum extraction addressed only a portion of the solvent-based source contamination at the site. Pump-and-treat was used to address a “finger” of the TCE plume that had migrated southeast of the central lobe.
• This report summarizes the phytoremediation demonstration project that began at the site in 1996. Figure 1 shows the location of NAS-JRB Fort Worth, the TCE groundwater plume, and the
U.S. Environmental Protection Agency Office of Superfund Remediation and Technology Innovation (OSRTI) 1 November 2005
Phytoremediation at Naval Air Station – Joint Reserve Base Fort Worth
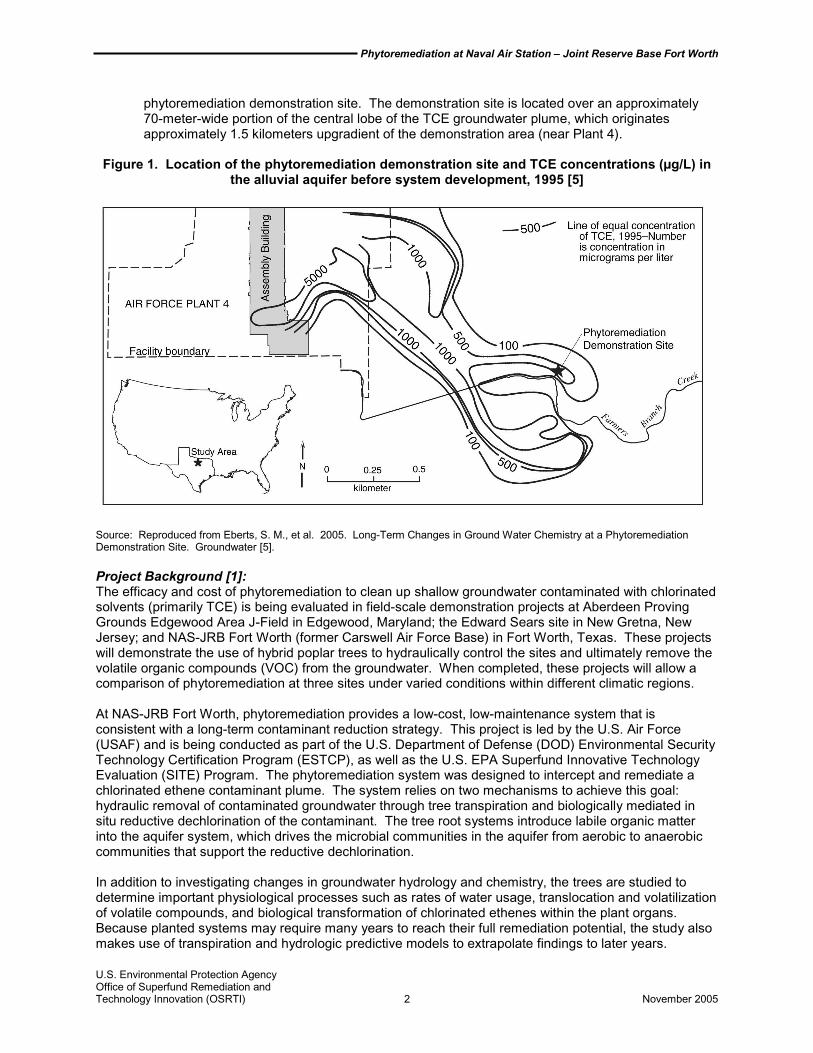
phytoremediation demonstration site. The demonstration site is located over an approximately 70-meter-wide portion of the central lobe of the TCE groundwater plume, which originates approximately 1.5 kilometers upgradient of the demonstration area (near Plant 4).
Figure 1. Location of the phytoremediation demonstration site and TCE concentrations (µg/L) in the alluvial aquifer before system development, 1995 [5]
Source: Reproduced from Eberts, S. M., et al. 2005. Long-Term Changes in Ground Water Chemistry at a Phytoremediation Demonstration Site. Groundwater [5].
Project Background [1]: The efficacy and cost of phytoremediation to clean up shallow groundwater contaminated with chlorinated solvents (primarily TCE) is being evaluated in field-scale demonstration projects at Aberdeen Proving Grounds Edgewood Area J-Field in Edgewood, Maryland; the Edward Sears site in New Gretna, New Jersey; and NAS-JRB Fort Worth (former Carswell Air Force Base) in Fort Worth, Texas. These projects will demonstrate the use of hybrid poplar trees to hydraulically control the sites and ultimately remove the volatile organic compounds (VOC) from the groundwater. When completed, these projects will allow a comparison of phytoremediation at three sites under varied conditions within different climatic regions.
At NAS-JRB Fort Worth, phytoremediation provides a low-cost, low-maintenance system that is consistent with a long-term contaminant reduction strategy. This project is led by the U.S. Air Force (USAF) and is being conducted as part of the U.S. Department of Defense (DOD) Environmental Security Technology Certification Program (ESTCP), as well as the U.S. EPA Superfund Innovative Technology Evaluation (SITE) Program. The phytoremediation system was designed to intercept and remediate a chlorinated ethene contaminant plume. The system relies on two mechanisms to achieve this goal: hydraulic removal of contaminated groundwater through tree transpiration and biologically mediated in situ reductive dechlorination of the contaminant. The tree root systems introduce labile organic matter into the aquifer system, which drives the microbial communities in the aquifer from aerobic to anaerobic communities that support the reductive dechlorination.
In addition to investigating changes in groundwater hydrology and chemistry, the trees are studied to determine important physiological processes such as rates of water usage, translocation and volatilization of volatile compounds, and biological transformation of chlorinated ethenes within the plant organs. Because planted systems may require many years to reach their full remediation potential, the study also makes use of transpiration and hydrologic predictive models to extrapolate findings to later years.
U.S. Environmental Protection Agency Office of Superfund Remediation and Technology Innovation (OSRTI) 2 November 2005
Phytoremediation at Naval Air Station – Joint Reserve Base Fort Worth
The demonstration study began in 1996 and is expected to be completed in 2006. This report presents available data through 2001, which includes the first six growing seasons. The growing season each year was from April through October, and the dormant season was from November through March.
MATRIX IDENTIFICATION
Soil and groundwater
CONTAMINANT CHARACTERIZATION
TCE is the main contaminant of concern at this site. Prior to the phytoremediation study, TCE concentrations in the groundwater approached 1,000 micrograms per liter (µg/L).
MATRIX CHARACTERISTICS AFFECTING TREATMENT COSTS OR PERFORMANCE [1,2,5]
The amount of hydraulic control that can be achieved by phytoremediation is a function of site-specific aquifer conditions. A planted system can be expected to have a greater hydrologic effect on an aquifer at a site that has an initially low volumetric flux of groundwater than at a site where the flux of contaminated groundwater is significantly greater. The volume of water stored in an aquifer will also affect system performance. The table below provides matrix characteristics for the phytoremediation system at this site.
Matrix Characteristic Value/Description Soil classification Clayey sands and gravels Groundwater velocity 0.5 meters per day Groundwater flow direction Southeast Depth to groundwater 2.5 – 4 meters below ground surface Average gradient Greater than 2% Saturated aquifer thickness 0.5 – 1.5 meters Hydraulic conductivity (average) 6 meters per day
SITE HYDROGEOLOGY [1,4,5]
Surface soils at the site consist of 30 to 45 centimeters of silty clay and clayey silt. Groundwater has an estimated velocity of 0.5 meters per day (m/day). The underlying shallow aquifer consists of silty fine sands and hydraulically isolated lenses of coarser material.
PRIMARY TREATMENT TECHNOLOGY
Phytoremediation
SYSTEM DESCRIPTION AND OPERATION [1,2,4,6]
This demonstration investigates the ability of eastern cottonwood (Populus deltoides) trees to remediate shallow TCE-contaminated groundwater in a subhumid climate. The study is determining the ability of the planted system to hydraulically control the migration of contaminated groundwater, as well as biologically enhance the subsurface environment to optimize in situ reductive dechlorination of the chlorinated ethenes.
In April 1996, the USAF planted 660 eastern cottonwoods at two plantations in a 4,000-square-meter area. The trees were planted as a short rotation woody crop employing standard techniques developed by the U.S. Department of Energy (DOE) to grow biomass for energy and fiber. Whips, which are sections of 1-year-old eastern cottonwood stems, were planted at one plantation. Caliper trees, which are more mature eastern cottonwoods with a 2.5- to 3.8-centimeter (cm) trunk diameter, were planted at the other plantation. Each plantation is approximately 15 by 75 meters and was designed so that the long
U.S. Environmental Protection Agency Office of Superfund Remediation and Technology Innovation (OSRTI) 3 November 2005

Phytoremediation at Naval Air Station – Joint Reserve Base Fort Worth
side is generally perpendicular to the direction of the groundwater flow. Figure 2 shows the plantations, monitoring wells, and groundwater flow direction.
Figure 2. Location of cottonwood plantations and monitoring wells at phytoremediation demonstration site, Naval Air Station – Joint Reserve Base Fort Worth, Texas [6]
l 2004. ion-Si ii i i i i ll
Source: Reproduced from U.S. Geologica Survey. Demonstrat te Development and Phytoremediat on Processes Associated w th Trichloroethene n Ground Water, Naval A r Stat on-Jo nt Reserve Base Carswe Field, Fort Worth, Texas. USGS Fact Sheet 2004-3087. August [6].
Eastern cottonwoods were chosen because they are indigenous to the region and have proven their ability to withstand the Texas climate, local pathogens, and other localized variables that may affect tree growth and health. The caliper trees are expected to have higher evapotranspiration rates than the whips because of their larger leaf mass.
Soil preparation for planting included trenching seven rows spaced 2.4 meters apart in each of the plantations to a depth of 1 meter. The whips and caliper trees were placed 1.25 to 2.5 meters apart within the trenched rows. Irrigation lines were also installed in the trenched rows. A handful of fertilizer was applied around each whip and caliper tree. Following planting, fabric mulch and 10 cm of landscape mulch were placed along each row to minimize weed growth.
An extensive monitoring system was put in place to measure small incremental changes in site conditions over time. The monitoring system included the following:
○ Sixty-seven (67) groundwater monitoring wells (wells) installed upgradient, within, downgradient, and surrounding the demonstration site
○ Continuous water level recorders installed at three locations, including one upgradient of the tree plantations and two within the plantations
○ Nine tensiometers installed upgradient or within the tree plantations ○ A weather station installed to collect site-specific weather data ○ A stream gauge installed on a creek adjacent to the site to record stream stages
U.S. Environmental Protection Agency Office of Superfund Remediation and Technology Innovation (OSRTI) 4 November 2005

Phytoremediation at Naval Air Station – Joint Reserve Base Fort Worth
○ Tree collars or tree probes installed periodically during the growing season to measure sapflow in selected trees
A mature cottonwood tree (about 20 years old at the start of the demonstration) and section of the underlying aquifer located proximal to the study area were investigated to provide evidence of transpiration rates and geochemical conditions that eventually may be achieved at the site of the planted trees. Analyses were also conducted to evaluate the primary and secondary objectives of the project and to determine the ability of the trees to perform as a natural pump-and-treat system.
CLEANUP GOALS/OBJECTIVES [1,2,5,8]
Through the first three growing seasons (August 1996 through September 1998), this project was evaluated for its ability to reduce the mass of TCE transported across the downgradient end of the site (mass flux). The primary performance objectives were established: (1) a 30 percent reduction in the mass of TCE in the aquifer transported across the downgradient end of the site during the second growing season, as compared to baseline TCE mass flux; and (2) a 50 percent reduction in the mass of TCE in the aquifer transported across the downgradient end of the site during the third growing season, as compared to baseline TCE mass flux. To evaluate the primary objective, groundwater levels were monitored to evaluate hydraulic control, and samples were collected and analyzed for TCE over the course of the study.
Secondary objectives were addressed to help understand the processes that affect the downgradient migration of TCE in the aquifer, as well as to identify scale-up issues. These secondary objectives are as follows:
○ Analyze the hydrologic effects of tree transpiration on the contaminated aquifer. ○ Analyze contaminant uptake into plant organ systems. ○ Evaluate TCE transformation kinetics in leaf samples of various mature trees in the local area. ○ Evaluate microbial contributions to reductive dechlorination. ○ Analyze tree transpiration rates to determine current and future water usage. ○ Evaluate geochemical indices of subsurface oxidation-reduction processes. ○ Determine tree growth rates and root biomass. ○ Collect data to determine implementation and operation costs for the technology.
Groundwater monitoring for VOCs was continued through the sixth growing season (2001) to evaluate geochemical changes in the TCE plume. Biodegradation rates were correlated to the age of the tree plantations and associated increases in vegetative biomass by evaluating changes in redox conditions and accompanying changes in the in situ reductive dechlorination of TCE. Monitoring of groundwater redox conditions is ongoing.
PERFORMANCE DATA ASSESSMENT [1,2,5,7]
TCE Mass Flux and Hydraulic Control As the trees in both plantations at the demonstration site began to use water from the aquifer, a measurable decrease was noted in the volumetric flux of contaminated groundwater leaving the demonstration site. The maximum reduction in the outflow of contaminated groundwater that could be attributed to the trees was approximately 12 percent of the volumetric flux rate. This 12 percent decrease was observed at the peak of the third growing season. At that time, the reduction in the mass flux of TCE across the downgradient end of the plantations was closer to 11 percent. Table 1 presents changes in volumetric and TCE mass flux through the first four growing seasons. During the first 3 years of the demonstration, the maximum water table fluctuation noted was a decrease by approximately 10 cm at the center of the demonstration site. During the fifth growing season (September 2000), the maximum observed drop in water level was about 29 cm, and the diameter of the water table depression for areas exceeding an 8-cm drop in water level was about 160 meters.
U.S. Environmental Protection Agency Office of Superfund Remediation and Technology Innovation (OSRTI) 5 November 2005
Phytoremediation at Naval Air Station – Joint Reserve Base Fort Worth
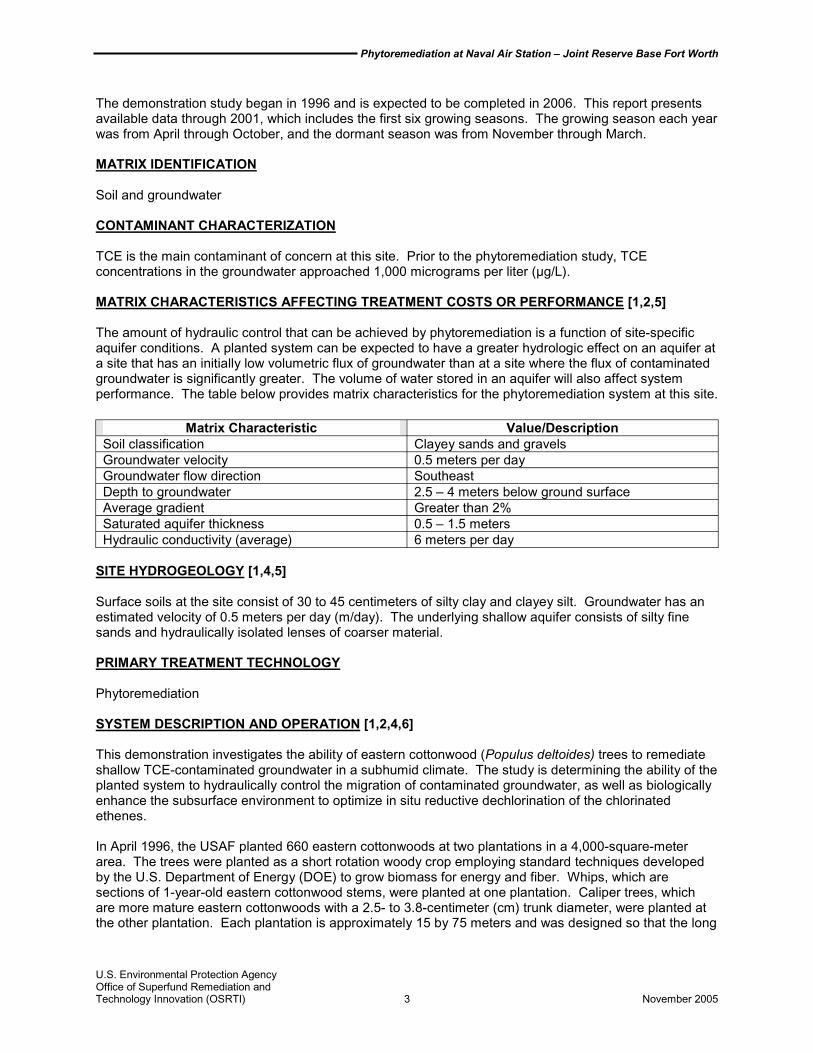
Table 1. Summary of results [2]
Event
Hydraulic Gradient Across
Downgradient End of Planted
Area a
Cross-Sectional Area
Along Downgradient End of Planted
Area b (m2)
Volumetric Flux of
Groundwater Across
Downgradient End of Planted
Area c (m3/d)
Change in Volumetric Flux Across
Downgradient End of Planted
Area Attributed to
Planted Trees (%)
Average TCE Concentration in Wells Along Downgradient End of Planted
Area d (µg/L)
Mass Flux of TCE Across
Downgradient End of Planted
Area (g/d)
Change in Mass Flux of TCE Across
Downgradient End of Planted
Area Attributed to
Planted Trees (%)
Baseline (1996) 0.0159 84 8.0 - 469 3.8 -
Peake 2nd
Season (1997) 0.0154 82 7.6 -5 535 4.1 8
Late e 2nd
Season (1997) 0.0157 83 7.8 -2 - - -
Peak 3rd
Season (1998) 0.0143 82 7.0 -12 483 3.4 -11
Late 3rd Season (1998)
0.0150 83 7.5 -6 473 3.5 -8
Peak 4th
Season (1999) 0.0153 81 7.4 -8 - - -
Source: U.S. Environmental Protection Agency. 2003. Phytoremediation of Groundwater at Air Force Plant 4, Carswell, Texas [2].
Notes: 2 m Square meter 3m /d Cubic meter per day
µg/L Micrograms per liter g/d Grams per day % Percent a Gradient calculated between monitoring wells 522 and 529. b An aquifer width of 70 meters was used for the aquifer cross-sectional area calculations; aquifer thickness was the average of the
saturated thickness in wells 526, 527, and 528 normalized to wells from the surrounding area to account for seasonal water table fluctuations unrelated to the planted trees.
c A horizontal hydraulic conductivity of 6 meters per day was used for the volumetric flux calculations. This is the average of the hydraulic conductivity values determined for the study area.
d TCE concentration is the average in wells 526, 527, and 528. e Peak growing season is end of June or beginning of July. Late growing season is end of September or beginning of October.
Trees are expected to achieve maximum hydraulic control once they are full grown. Because the phytoremediation system would not become fully mature during the demonstration period, MODFLOW, a groundwater model developed by the U.S. Geological Survey (USGS), was used to predict future hydraulic control. The model indicated that once the planted trees have achieved a closed canopy, the reduction in the volumetric flux of contaminated groundwater across the downgradient end of the site will likely be between 20 and 30 percent of the initial amount of water that flowed through the site. The actual amount of water that will be transpired from the aquifer by the trees will be between 50 and 90 percent of the volume of water that initially flowed through the site. The discrepancy between the volumetric outflow of groundwater and the volume of water transpired from the aquifer can be attributed to the predicted increase in groundwater inflow to the site and the release of water stored in the aquifer. No hydraulic control was observed as of the third dormant season (November 1998 to March 1999).
TCE Concentrations in Tree Samples With respect to the fate of the contaminants taken up by the planted trees, TCE and its daughter products were detected in tissue samples of roots, stems, and leaves. Generally, the percentage of planted trees in which the compounds were detected increased over time. Stem tissue generally exhibited the greatest diversity and concentration of chlorinated compounds. The results also showed an increase over time in the percentage of trees containing chlorinated ethenes, as well as an increase in the average concentration. In October 1998, all five whip and five caliper trees sampled contained detectable levels of TCE in the stems, with an average concentration of 32.8 micrograms per kilogram (µg/kg) for whips and
U.S. Environmental Protection Agency Office of Superfund Remediation and Technology Innovation (OSRTI) 6 November 2005

Phytoremediation at Naval Air Station – Joint Reserve Base Fort Worth
24.6 µg/kg for caliper trees. Table 2 summarizes the average TCE and cis-1,2-dichloroethene (DCE) concentrations in whip and caliper tree samples collected during the first 3 years (1996 through 1998). Leaf and stem samples were collected from whips and caliper trees during each sampling event. Root samples were only collected during two events (October 1996 and June 1998). The table also summarizes average TCE and cis-1,2-DCE concentrations for leaf and stem samples taken from the mature cottonwood tree located proximal to the study area. Although the data indicate that the plantations are progressively translocating more contaminants from the subsurface over time, the fate of the contaminants within the plant tissues or volatilized to the air cannot be determined.
Table 2. Summary of tree sample results (µg/kg) [2]
Tree Type Analyte Plant
Tissue October
1996 July 1997
October 1997
June 1998
October 1998
Whips TCE Leaf ND ND 1.6 (2) ND ND Stem 26 (1) ND 10.1 (3) 44 (1) 32.8 (5) Root ND NS NS 140 NS
cis-1,2- Leaf ND NS ND ND ND DCE Stem ND NS 1.9 (3) 14 (1) 13.5 (5)
Root ND NS NS ND NS Calipers TCE Leaf ND ND 10.4 (3) 4.5 (2) ND
Stem ND ND 9.6 (3) 71 (1) 24.6 (5) Root ND NS NS 13 NS
cis-1,2- Leaf ND NS ND ND ND DCE Stem ND NS 1.6 (3) 15.7 (3) 8.9 (4)
Root ND NS NS NS NS Mature TCE Leaf NS ND ND ND ND cottonwood Stem ND ND 6.4 13 2.2
Root NS NS NS NS NS cis-1,2-DCE
Leaf NS NS ND ND ND Stem 1.2 NS 10 ND 2.8 Root NS NS NS NS NS
Source: Adapted from U.S. Environmental Protection Agency. 2003. Phytoremediation of Groundwater at Air Force Plant 4,Carswell, Texas [2]
Notes:
Numbers in parentheses represent number of trees for which the analyte was detected.Five whips and five caliper trees were sampled (except roots).ND – Not detected NS – Not sampled
TCE Transformation Kinetics
The kinetics of TCE transformation were evaluated using leaf samples collected from seven trees (cedar, hackberry, oak, willow, mesquite, cottonwood whip, and cottonwood caliper) growing at or near the demonstration site. Each of the plant species investigated appears to have properties effective in degrading TCE. Specifically, all leaf samples showed dehalogenase activity. Pseudo first-order rate constants were determined for the samples. The average and standard deviation for all seven rate constants is 0.049 ±0.02 per hour. This corresponds to a half life of about 14.1 hours. These kinetics are fast relative to other environmental transport and transformation processes except volatilization of TCE. Therefore, it is unlikely that degradation within the trees will be the rate-limiting step during phytoremediation. These data suggest that use of species native to a proposed site is sufficient, and genetically altered plants designed to enhance metabolism of TCE are not needed.
TCE Concentrations in Groundwater With respect to biologically induced reductive dechlorination, there is evidence that the aquifer beneath the planted trees was beginning to support anaerobic microbial communities capable of TCE
U.S. Environmental Protection Agency Office of Superfund Remediation and Technology Innovation (OSRTI) 7 November 2005

Phytoremediation at Naval Air Station – Joint Reserve Base Fort Worth
biodegradation within 3 years of planting. Specifically, microbial data from soil and groundwater samples indicate that the microbial community beneath the planted trees had begun to move toward an assemblage capable of supporting reductive dechlorination during the demonstration period. In addition, within 3 years of planting, dissolved oxygen (DO) concentrations decreased, and total iron concentrations increased at the southern end of the whip plantation where the water table is closest to land surface. Anaerobic conditions in the aquifer resulted in a reduced environment and some anaerobic bacteria reductive dechlorination processes. Based on 9 wells within the plantations, the ratio of TCE to cis-1,2-DCE also decreased within the first 3 years (December 1996 through September 1998), from 5.88:1 to 2.44:1, while the ratios upgradient and downgradient were 3.11:1 and 3.34:1, respectively, in September 1998. These ratios show subtle changes in the aquifer due to the transformation of TCE to cis-1,2-DCE. A decrease in this ratio suggests that biological anaerobic processes in the aquifer were beginning to biodegrade TCE beneath the plantations.
Data from the aquifer beneath a mature cottonwood tree near the plantations support the conclusion that reductive dechlorination can occur beneath cottonwood trees with established root systems. In September 1998, the ratio of TCE to cis-1,2-DCE beneath the mature tree (0.62:1) was one order of magnitude less than the ratio of TCE to cis-1,2-DCE elsewhere at the site during the demonstration period. The microbial population in the area of the mature cottonwood tree included a vibrant community that supported both hydrogen oxidizing and acetate fermenting methanogens. This active anaerobic population is believed to be responsible for the decrease in TCE concentration and the generation of daughter products beneath the mature cottonwood tree.
Average TCE concentrations decreased across the demonstration site from 532 µg/L (July 1997) to 182 µg/L (July 2001). Upgradient TCE concentrations also decreased, indicating the possibility that natural attenuation was occurring. To determine changes that were attributable to the tree plantations, the ratio of TCE to cis-1,2-DCE was evaluated. The average upgradient TCE to cis-1,2-DCE ratio since 1997 was greater than 4. The ratio for groundwater within the plantations and downgradient generally decreased. However, from January through July 2001, it increased from 2.7 to 4.5 (see following discussion on fluctuations in water table level and its effect on contaminant concentrations). Figure 3 shows the trend in the TCE to cis-1,2-DCE ratio between July 1997 and July 2001.
Figure 3. Average TCE to cis-1,2-DCE ratios in the alluvial aquifer (July 1997 to July 2001) [5]
Source: Reproduced from Eberts, S. M., et al. 2005. Long-Term Changes in Ground Water Chemistry at a Phytoremediation Demonstration Site. Groundwater [5].Note: Numbers in parentheses are the number of wells used to compute the averages
U.S. Environmental Protection Agency Office of Superfund Remediation and Technology Innovation (OSRTI) 8 November 2005
Phytoremediation at Naval Air Station – Joint Reserve Base Fort Worth
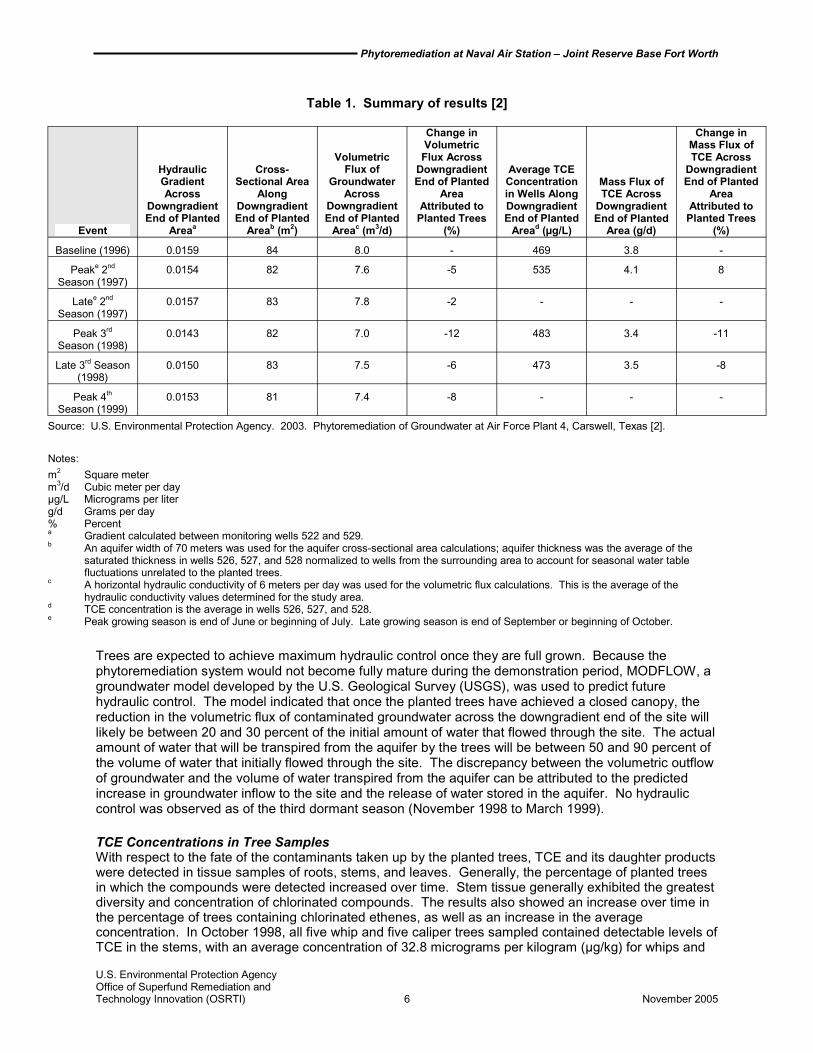
Figure 4 shows the relationship between TCE and cis-1,2-DCE ratios and depth to groundwater. By the end of the fifth growing season (2000), the water table at wells with the lowest ratios was less than 3 meters below ground surface (bgs). These wells also had the highest dissolved organic carbon (DOC) concentrations (1.6 to 1.8 milligrams per liter [mg/L]) and lowest DO concentrations (0.93 to 1.7 mg/L). From January to July 2001, the water table was lower by 0.5 meter. This was the greatest drop in water level between two sampling events. During that period, the TCE to cis-1,2-DCE ratio increased from 2.7 to 4.5 likely because the deeper groundwater flow path was not in contact with the microbially active root zone. Additionally, the increase in TCE to cis-1,2-DCE ratio may have been due to the rapid change in groundwater level that left the microbial population stressed.
Figure 4. TCE to cis-1,2-DCE ratios in the alluvial aquifer and depth to ground water, January and July 2001 [5]
Source: Reproduced from Eberts, S. M., et al. 2005. Long-Term Changes in Ground Water Chemistry at a Phytoremediation Demonstration Site. Groundwater [5].
U.S. Environmental Protection Agency Office of Superfund Remediation and Technology Innovation (OSRTI) 9 November 2005

Phytoremediation at Naval Air Station – Joint Reserve Base Fort Worth
Also in July 2001 (sixth growing season), systematic flowpath changes were observed in the groundwater for the first time. Based on this observation, the BIOCHLOR model was used to estimate biodegradation rates attributable to the trees. Estimated biodegradation rate constants for sequential reductive dechlorination of TCE, cis-1,2-DCE, and vinyl chloride were 0.02/day, 0.04/day, and 0.82/day, respectively. These rates represent a notable increase when compared to baseline conditions in 1996 (0.0002/day for TCE, 0.0001/day for cis-1,2-DCE, and 0.0005/day for vinyl chloride), which suggests that reductive dechlorination continued to occur despite the temporary increase in the TCE to cis-1,2-DCE ratio between January and July 2001.
Transpiration Rates A transpiration study was conducted at the site in 1997 (second growing season), and the average total daily transpiration rates were determined. The rates for whips ranged from 9.1 liters per tree per day in June to 1.6 liters per tree per day in October. For the caliper trees, total daily transpiration rates ranged from 14.7 liters per tree per day in July to 0.91 liters per tree per day in October. The total average daily transpiration rate was estimated at 1,872 liters per day for the caliper-tree plantation and 1,750 liters per day for the whip plantation. After five years, caliper trees transpired nearly four times the water (79 liters per tree per day) as the whip trees (19 liters per tree per day).
Groundwater Chemistry Parameters Groundwater chemistry parameters, such as DO, nitrate, ferrous iron, alkalinity, and sulfide, were also measured to monitor changes in the redox conditions of the aquifer. Table 3 shows the average concentrations of selected water constituents and alkalinity at different areas of the site as of July 2001 (sixth growing season). Figure 5 shows the average DO concentrations over time. Decreases in DO and nitrate concentrations, along with increases in ferrous iron and alkalinity, indicate that reducing conditions were present in the subsurface. Sulfide concentrations were below detection limits or very low across most of the site until January 2000. Since that time, sulfide concentrations have ranged from 0.01 to 0.55 mg/L; however, no site-wide trend has been observed for sulfide.
Table 3. Average concentrations of chemical parameters (as of July 2001) [5]
Dissolved oxygen (mg/L)
Nitrate (mg/L)
Ferrous iron (mg/L)
Alkalinity (mg/L as
bicarbonate) Immediately upgradient of plantations 3.06 3.23 0.05 322 Beneath plantations 1.69 2.10 0.08 377 Downgradient of plantations 1.01 1.22 0.7 386 Beneath mature cottonwood tree 0.69 0.66 0.5 378
Source: Eberts, S. M., et al. 2005. Long-Term Changes in Ground Water Chemistry at a Phytoremediation Demonstration Site.Groundwater [5].mg/L milligrams per liter
U.S. Environmental Protection Agency Office of Superfund Remediation and Technology Innovation (OSRTI) 10 November 2005

Phytoremediation at Naval Air Station – Joint Reserve Base Fort Worth
Figure 5. Average dissolved oxygen (DO) concentrations in the alluvial aquifer (July 1997 to July 2001) [5]
Source: Reproduced from Eberts, S. M., et al. 2005. Long-Term Changes in Ground Water Chemistry at a Phytoremediation Demonstration Site [5].mg/L milligrams per liter
Note: Numbers in parentheses are the number of wells used to compute the averages.
Preliminary field data collected during the fifth dormant season (January 2001) indicate that the trees were having an effect on the geochemistry of the ground water year round. During this season, DO concentrations were above 4.5 mg/L in water from all upgradient wells and at one well between the tree plantations (well 522). At all other on-site wells, including wells located more than 50 meters downgradient of the plantations, DO levels were below 3.5 mg/L. The average DO concentration in water from all wells, excluding the upgradient wells and well 522, was 1.76 mg/L. The DO concentration in several wells located within the plantations was less than 1 mg/L. In addition, field data indicated that ferrous iron and sulfide concentrations were elevated at several locations within and immediately downgradient of the tree plantations. These data add to the evidence that the planted trees at the demonstration site can stimulate microbial activity resulting in the depletion of DO in the aquifer and the creation of local anaerobic conditions conducive to microbial reductive dechlorination.
Tree Parameters A number of tree parameters were studied during the demonstration. In September 1997 (second growing season), root biomass and extent were examined in the whip and caliper-tree plantations. Four trees from each plantation were evaluated for fine root biomass and length and for coarse root biomass. Coarse root mass was significantly greater in the caliper trees, with root diameters in the range of 3 to 10 millimeters (mm), compared to the whips (458 grams per tree in the caliper trees and 240 grams per tree in the whips). Although the coarse root mass in roots with diameters greater than 10 mm also was greater in the caliper trees than the whips, the difference was not statistically significant. In addition, differences in the fine root biomass between the plantations were not statistically significant. Fine root length density in the upper 30 cm of soil was statistically greater in the caliper trees.
Also in the second growing season (September 1997), the roots of both the whips and caliper trees had reached the water table (275 cm for the whips and 225 cm for the caliper trees), and the depth distribution of the roots was comparable. Using the more expensive caliper trees did not appear to impart any substantial benefit with regard to root depth and biomass.
Tree-growth and root-growth data collected from the demonstration site are consistent with observations regarding hydraulic influence of the trees over the contaminated aquifer. Tree height, trunk diameter, and
U.S. Environmental Protection Agency Office of Superfund Remediation and Technology Innovation (OSRTI) 11 November 2005

Phytoremediation at Naval Air Station – Joint Reserve Base Fort Worth
canopy diameter were measured for 52 whips and 51 caliper trees throughout the first three years (December 1996; May, July, and October 1997; and June and September 1998). Overall, trees in both plantations grew well and significantly increased in all physical parameters measured. Table 4 presents results of tree height and trunk diameter monitoring for the measurements taken in December 1996 and September 1998.
Table 4. Tree height and trunk diameter measurements [2]
Parameter
Whips Caliper Trees December
1996 September
1998 December
1996 September
1998 Tree height (meters) 2.27 5.52 3.77 6.64 Trunk diameter (centimeters) 1.41 5.31 3.83 8.12
Source: U.S. Environmental Protection Agency. 2003. Phytoremediation of Groundwater at Air Force Plant 4, Carswell, Texas [2].
The average canopy diameter for the whips was 2.32 meters at the end of the third growing season (September 1998). These trees had been planted approximately 1.25 meters apart and were starting to approach canopy closure. A plantation approaches its maximum transpiration potential once it achieves a closed canopy because a closed canopy limits leaf area. This observation indicates that the trees were transpiring a significant amount of water at that time.
The average canopy diameter for caliper trees was 2.52 meters at the end of the third growing season (September 1998). The caliper trees were planted 2.5 meters apart and although the plantation was not as close to achieving a closed canopy, individual caliper trees transpired just over twice the water that individual whips transpired. As a result, the volume of water that was transpired by trees in the two plantations was similar because there were only half as many caliper trees as whips.
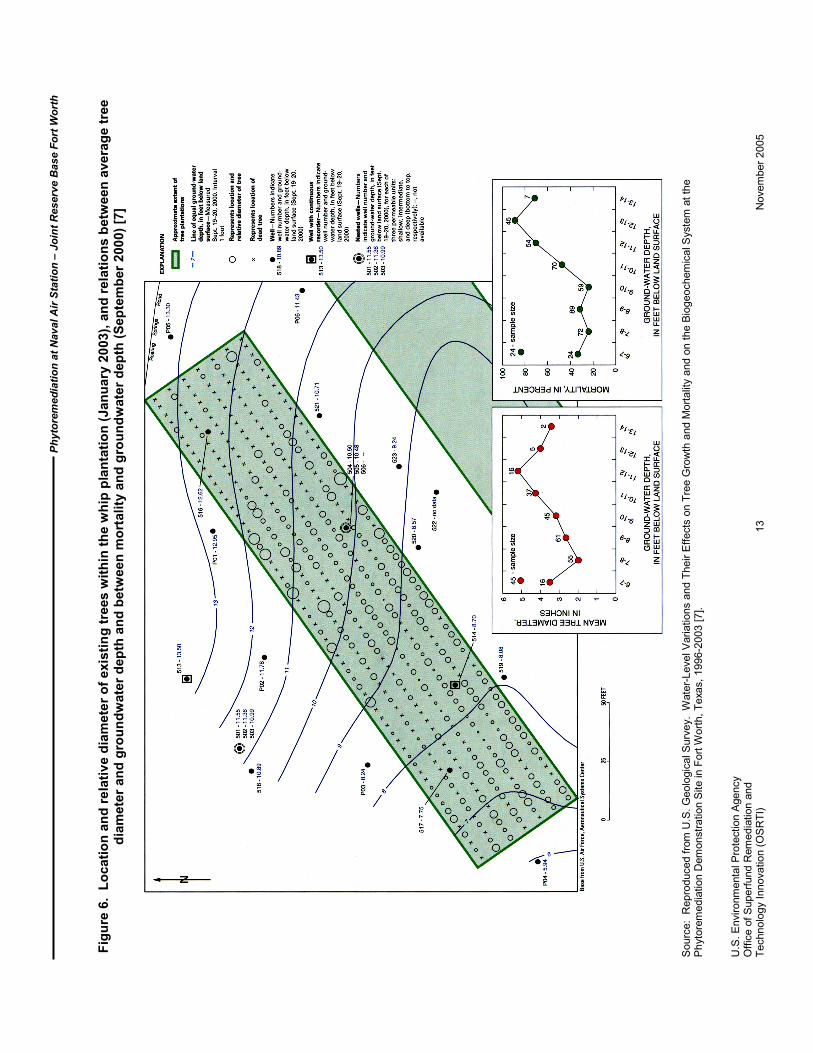
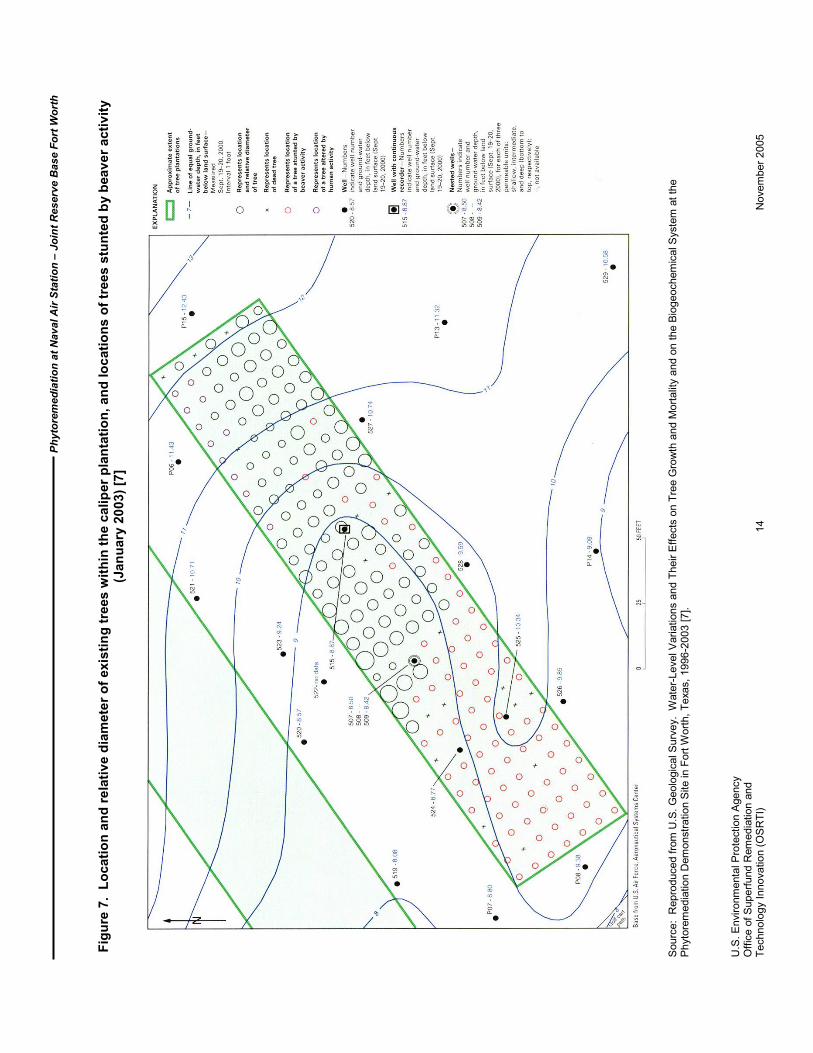
By January 2003 (seventh dormant season), some trees in both plantations had died, been stunted by beaver activity, or been altered by human activity. The groundwater level also affected the growth of trees. Tree mortality rates were relatively constant, near 25 percent where groundwater levels were less than 3 meters (10 feet) bgs but approaching 90 percent where groundwater levels were between 3.5 and 4 meters (12 and 13 feet) bgs. Figures 6 and 7 show groundwater levels, as well as the location and relative diameter of existing trees for both the whip and caliper plantations, respectively. The whips had both a higher mortality rate and a smaller relative diameter than the caliper trees.
U.S. Environmental Protection Agency Office of Superfund Remediation and Technology Innovation (OSRTI) 12 November 2005
Ph
yto
rem
edia
tio
n a
t N
aval
Air
Sta
tio
n –
Jo
int
Res
erve
Bas
e F
ort
Wo
rth
Fig
ure
6.
Lo
cati
on
an
d r
ela
tiv
e d
iam
ete
r o
f ex
isti
ng
tre
es w
ith
in t
he
wh
ip p
lan
tati
on
(Ja
nu
ary
2003
), a
nd
rel
atio
ns
bet
wee
n a
vera
ge
tre
e d
iam
eter
an
d g
rou
nd
wat
er d
epth
an
d b
etw
een
mo
rtal
ity
and
gro
un
dw
ater
dep
th (
Sep
tem
ber
200
0) [
7]
Sou
rce:
R
epro
duce
d fr
om U
.S.
Geo
logi
cal S
urve
y. W
ater
-Lev
el V
aria
tions
and
The
ir E
ffect
s on
Tre
e G
row
th a
nd M
orta
lity
and
on t
he B
ioge
oche
mic
al S
yste
m a
t the
P
hyto
rem
edia
tion
Dem
onst
ratio
n S
ite in
For
t Wor
th, T
exas
, 19
96-2
003
[7].
U.S
. Env
ironm
enta
l Pro
tect
ion
Age
ncy
Off
ice
of S
uper
fund
Rem
edia
tion
and
Tec
hnol
ogy
Inno
vatio
n (O
SR
TI)
13
N
ovem
ber
2005
Ph
yto
rem
edia
tio
n a
t N
aval
Air
Sta
tio
n –
Jo
int
Res
erve
Bas
e F
ort
Wo
rth
Fig
ure
7.
Lo
cati
on
an
d r
ela
tiv
e d
iam
ete
r o
f ex
isti
ng
tre
es w
ith
in t
he
calip
er p
lan
tati
on
, an
d lo
cat
ion
s o
f tr
ees
stu
nte
d b
y b
eav
er
acti
vit
y (J
anu
ary
2003
) [7
]
Sou
rce:
R
epro
duce
d fr
om U
.S.
Geo
logi
cal S
urve
y. W
ater
-Lev
el V
aria
tions
and
The
ir E
ffect
s on
Tre
e G
row
th a
nd M
orta
lity
and
on t
he B
ioge
oche
mic
al S
yste
m a
t the
P
hyto
rem
edia
tion
Dem
onst
ratio
n S
ite in
For
t Wor
th, T
exas
, 19
96-2
003
[7].
U.S
. Env
ironm
enta
l Pro
tect
ion
Age
ncy
Off
ice
of S
uper
fund
Rem
edia
tion
and
Tec
hnol
ogy
Inno
vatio
n (O
SR
TI)
14
N
ovem
ber
2005
Phytoremediation at Naval Air Station – Joint Reserve Base Fort Worth
COST INFORMATION [1,2,3,4]
Preparatory Work Site Characterization: $12,000 Site Design: $10,000 Site Work Monitoring (research level) well installation: $90,000 Development of Plantations – 4,000 square meters (includes landscaping costs): $41,000 Weather Station: $3,100 Survey: $25,000 Purchase of Trees Whips ($0.20 each): $100 Calipers ($18 each): $2,000 Installation of Irrigation System: $10,000 Total Capital Cost: $193,200
Annual O&M Landscaping: $2,000 Groundwater, soil, vegetation, transpiration, climate, soil moisture, and water-level monitoring (research level): $250,000 Total Annual O&M: $252,000
After Treatment Cost: None
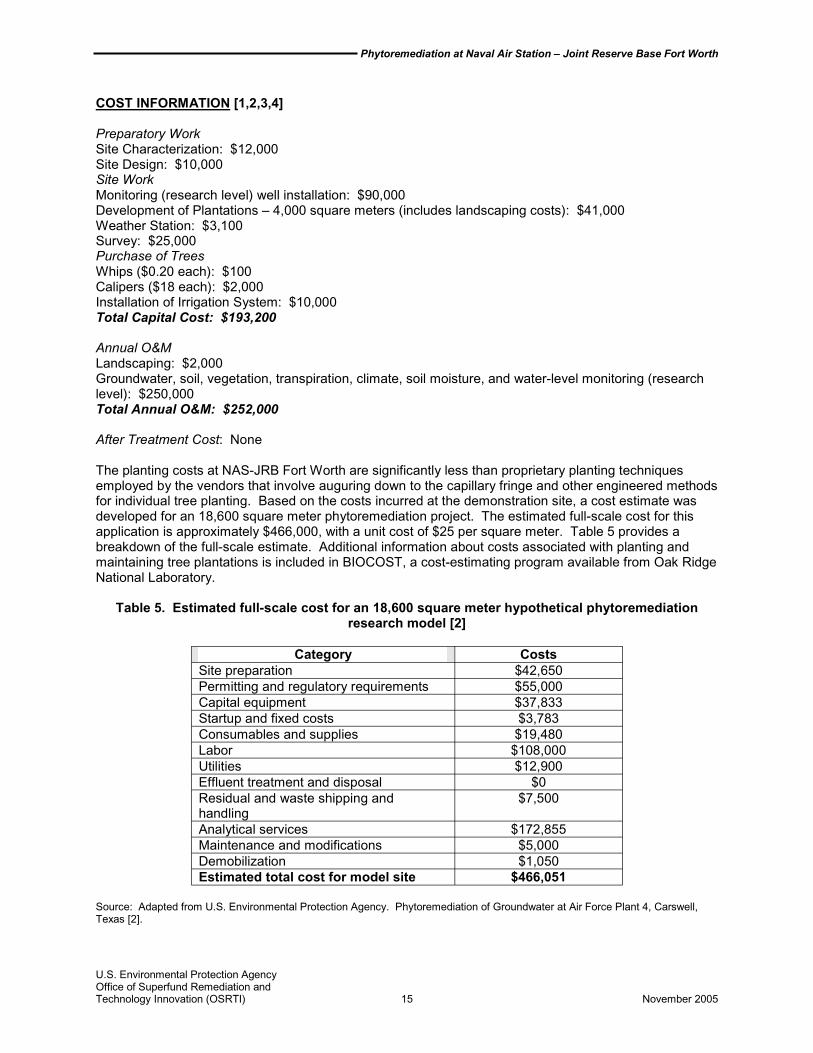
The planting costs at NAS-JRB Fort Worth are significantly less than proprietary planting techniques employed by the vendors that involve auguring down to the capillary fringe and other engineered methods for individual tree planting. Based on the costs incurred at the demonstration site, a cost estimate was developed for an 18,600 square meter phytoremediation project. The estimated full-scale cost for this application is approximately $466,000, with a unit cost of $25 per square meter. Table 5 provides a breakdown of the full-scale estimate. Additional information about costs associated with planting and maintaining tree plantations is included in BIOCOST, a cost-estimating program available from Oak Ridge National Laboratory.
Table 5. Estimated full-scale cost for an 18,600 square meter hypothetical phytoremediation research model [2]
Category Costs Site preparation $42,650 Permitting and regulatory requirements $55,000 Capital equipment $37,833 Startup and fixed costs $3,783 Consumables and supplies $19,480 Labor $108,000 Utilities $12,900 Effluent treatment and disposal $0 Residual and waste shipping and $7,500 handling Analytical services $172,855 Maintenance and modifications $5,000 Demobilization $1,050 Estimated total cost for model site $466,051
Source: Adapted from U.S. Environmental Protection Agency. Phytoremediation of Groundwater at Air Force Plant 4, Carswell, Texas [2].
U.S. Environmental Protection Agency Office of Superfund Remediation and Technology Innovation (OSRTI) 15 November 2005

Phytoremediation at Naval Air Station – Joint Reserve Base Fort Worth
OBSERVATIONS AND LESSONS LEARNED [2,4,5,8]
• During the first 3 years of the demonstration, the maximum observed reduction in the mass flux of TCE across the downgradient end of the demonstration site was 11 percent. This maximum occurred at the peak of the third growing season.
• When designing for hydraulic control during phytoremediation, it is important to keep the remediation goals in mind. In other words, it may not be desirable to achieve full hydraulic control at a site if full control would adversely affect the groundwater-surface water system downgradient of the site. At this site, the receptor is Farmers Branch Creek, which has a flow of less than 3 cubic centimeters per second (cm3/sec) during the summer months (period of peak transpiration). At such a site, it may be desirable to prevent the contaminant plume from discharging into the creek without drying up the creek, particularly since hydraulic control is only one mechanism that contributes to the cleanup of a groundwater plume by phytoremediation. The use of an applicable groundwater flow model is recommended to predict flow movement at similar phytoremediation sites.
• TCE and its daughter products were detected in tissue samples of roots, stems, and leaves. In October 1998 (third growing season), all five whip and five caliper trees sampled contained detectable levels of TCE in the stems, with an average concentration of 32.8 µg/kg for whips and 24.6 µg/kg for the caliper trees.
• With respect to biologically induced reductive dechlorination, there is evidence that the aquifer beneath the planted trees was supporting anaerobic microbial populations capable of biodegrading TCE within 3 years of planting. Microbial data from soil and groundwater samples indicate that the microbial populations beneath the planted trees are capable of supporting reductive dechlorination.
• Average concentrations of TCE decreased across the demonstration site, from 532 µg/L in July 1997 to 182 µg/L in July 2001. To determine changes that were attributable to the tree plantations, the ratio of TCE to cis-1,2-DCE was evaluated; the ratio of the constituents in groundwater within the plantations and downgradient generally decreased until January 2001.
• Preliminary field data collected during the fifth dormant season (January 2001) indicate that the trees were beginning to have an effect on the geochemistry of the groundwater, with DO concentrations above 4.5 mg/L in groundwater from all upgradient wells and one well between the tree plantations (well 522). All other wells at the demonstration site, including wells more than 50 meters downgradient of the plantations, had DO levels below 3.5 mg/L. The average DO concentration in water from all wells, excluding the upgradient wells and well 522, was 1.76 mg/L. The DO concentration in several wells beneath the plantations was less than 1 mg/L.
Additional observations and lessons learned were noted in the ESTCP report: • Trees can serve as a sustainable source of electron donors, supplying DOC to the underlying
aquifer over the long term and thereby supporting in situ processes related to TCE degradation. Trees planted in areas where the depth to groundwater was less than 3 meters were able to deliver enough DOC to the aquifer to (1) lower DO concentrations, (2) create iron-reducing conditions along the plume centerline, (3) create sulfate-reducing or methanogenic conditions in localized areas, and (4) initiate in situ reductive dechlorination of TCE.
• After 6 growing seasons, in situ biodegradation was becoming the dominant process contributing to the reduction in the mass flux of TCE across the site, whereas transpiration directly from the aquifer was the dominant process during the first 3 years of the study.
• The presence of TCE and cis-1,2-DCE in tree cores can be indicators of subsurface contamination. Data imply that for each tree species, higher TCE concentrations in groundwater
U.S. Environmental Protection Agency Office of Superfund Remediation and Technology Innovation (OSRTI) 16 November 2005
Phytoremediation at Naval Air Station – Joint Reserve Base Fort Worth
can produce higher TCE concentrations in tree cores. The comparison of tree cores to same-tree branches (for samples collected in 2001-2002) indicate that TCE concentrations in tree cores were often higher than concentrations found in the small branches.
REFERENCES
1. Eberts, S. M., et al. 2003. Multiple-Process Assessment for a Chlorinated Solvent Plume. Phytoremediation: Transformation and Control of Contaminants. Pages 589-633. September.
2. U.S. Environmental Protection Agency (EPA). 2003. Phytoremediation of Groundwater at Air Force Plant 4, Carswell, Texas. EPA/540/R-03/506. September.
3. North Atlantic Treaty Organization. 2002. Evaluation of Demonstrated and Emerging Technologies for the Treatment of Contaminated Land and Groundwater (Phase III), 2001 Annual Report. Number 250. EPA/542/R-02/001. January.
4. EPA. 2003. Phyto Demonstration Enters 7th Year at Carswell Naval Air Station. Technology News and Trends. September. http://www.cluin.org
5. Eberts, S. M., et al. 2005. Long-Term Changes in Ground Water Chemistry at a Phytoremediation Demonstration Site. Groundwater. Volume 43, No. 2. Pages 178-186. March-April.
6. U.S. Geological Survey (USGS). 2004. Demonstration-Site Development and Phytoremediation Processes Associated with Trichloroethene (TCE) in Ground Water, Naval Air Station-Joint Reserve Base Carswell Field, Fort Worth, Texas. USGS Fact Sheet 2004-3087. August.
7. USGS. 2004. Water-Level Variations and Their Effects on Tree Growth and Mortality and on the Biogeochemical System at the Phytoremediation Demonstration Site in Fort Worth, Texas, 19962003. Scientific Investigations Report 2004-5107.
8. Environmental Security Technology Certification Program. 2005. Air Force Plant 4 Carswell NAS Phytoremediation Cost and Performance Report. Draft.
9. Oak Ridge National Laboratory. 2005. BIOCOST: A tool to estimate energy crops costs on a PC. Accessed on October 7. Online Address: http://bioenergy.ornl.gov/papers/misc/biocost.html
ACKNOWLEDGMENTS
This case study was prepared for the U.S. Environmental Protection Agency's Office of Solid Waste and Emergency Response, Office of Superfund Remediation and Technology Innovation, by Tetra Tech EM Inc. under EPA Contract No. 68-W-02-034.
Financial support for this demonstration study was provided by Department of Defense’s Environmental Security Technology Certification Program (ESTCP).
U.S. Environmental Protection Agency Office of Superfund Remediation and Technology Innovation (OSRTI) 17 November 2005