osseointegration of complex scaffolds
TRANSCRIPT

University of Tennessee, Knoxville University of Tennessee, Knoxville
TRACE: Tennessee Research and Creative TRACE: Tennessee Research and Creative
Exchange Exchange
Doctoral Dissertations Graduate School
5-2020
Osseointegration of Complex Scaffolds Osseointegration of Complex Scaffolds
Rebecca Elaine Rifkin University of Tennessee
Follow this and additional works at: https://trace.tennessee.edu/utk_graddiss
Recommended Citation Recommended Citation Rifkin, Rebecca Elaine, "Osseointegration of Complex Scaffolds. " PhD diss., University of Tennessee, 2020. https://trace.tennessee.edu/utk_graddiss/5824
This Dissertation is brought to you for free and open access by the Graduate School at TRACE: Tennessee Research and Creative Exchange. It has been accepted for inclusion in Doctoral Dissertations by an authorized administrator of TRACE: Tennessee Research and Creative Exchange. For more information, please contact [email protected].

To the Graduate Council:
I am submitting herewith a dissertation written by Rebecca Elaine Rifkin entitled
"Osseointegration of Complex Scaffolds." I have examined the final electronic copy of this
dissertation for form and content and recommend that it be accepted in partial fulfillment of the
requirements for the degree of Doctor of Philosophy, with a major in Comparative and
Experimental Medicine.
David E. Anderson, Major Professor
We have read this dissertation and recommend its acceptance:
Alexandru Biris, Madhu Dhar, David Harper, Pierre-Yves Mulon, H. Steve Adair
Accepted for the Council:
Dixie L. Thompson
Vice Provost and Dean of the Graduate School
(Original signatures are on file with official student records.)

Osseointegration of Complex Scaffolds
A Dissertation Presented for the
Doctor of Philosophy
Degree
The University of Tennessee, Knoxville
Rebecca Elaine Rifkin
May 2020

ii
Copyright © 2020 by Rebecca Elaine Rifkin.
All rights reserved.

iii
DEDICATION
To my mother, father, brother and husband who have believed in me, and pushed me to
keep going even when I was terrified that I wasn’t good enough. To my friends who kept
encouraging me. To my mentors, without whom I’m sure I wouldn’t be able to write a
scientific sentence let alone finish this.

iv
ACKNOWLEDGEMENTS
There are not enough complimentary words I can think, and I need all of them, to
thank David Anderson. Without his support and guidance this work would not have been
possible. Similarly, the support from my committee during the goat surgeries was crucial
in carrying out this research. The support from my lab mates, specifically Austin Bow,
and Remiguisz Grzeskowiak made all the goat work possible. It would be insane not to
mention the unbelievable help from Carolyn Wilson. Additionally the Comparative and
Experimental Medicine program staff, specifically Dr. Stephen Kania and Kim
Rutherford who’s help has been invaluable. Finally, our research technician, Elizabeth
Croy and the countless number of veterinary and undergraduate research assistants who
helped take care of the extensive goat herd.
I would like to thank the Department of Defense via the U.S. Army Medical
Research and Material Command (MRMC) for funding my position as a graduate
research assistant in the CEM program and detailed much of the research. For the
portions of the work that have been published, I would like to thank my co-authors,
editors, reviewers and publishers for their time and patience. I would like to thank the
material design and development team, specifically Bailey Jackson based in the Center
for Integrative Nanotech. The University of Arkansas at Little Rock characterized and
provided the materials utilized in this research. I would like to thank Mohamed A.
Aboulkhair and Dr. Kania’s lab for helping me with the whole genomic sequencing of the
Staphylococcal isolates. I would be remiss if I did not thank G-d, who guided me even
when I almost screwed this whole thing up, advised and watched over me and saw me to
the end of this project.

v
ABSTRACT
Regenerative therapies, or bone substitutes, for long bone fractures are on the verge
of becoming standard practice. Development of a wide variety of synthetic materials has
been undertaken in effort to improve healing of debilitating fractures. An ideal bone
substitutes would mimic natural bone physiology. The form and function of long bones
must first be understood in order to create the ideal regenerative material. From there,
basic fracture healing provides key insights as to where and how fractures may advance
to stages of non-healing. The ideal bone substitute would be both osteo-inductive and
osteo-conductive. An effective material to promote bone healing in large defects has yet
to be developed, and large animal preclinical models are lacking. Few large animal
studies looking at bone regeneration exceed ninety days making long-term
osseointegration of the bone substitute difficult. One of the most studied platforms for
synthetic bone substitutes are nanohydroxyapatite and polyurethane composites due to
their biocompatibility and bioresorbability. The studies detailed here focus on the
biological assessment of a bone substitute that contains polyurethane,
nanohydroxyapatite, and decellularized bone particles. A multitude of in vivo
assessments were carried out to assess the impact of the bone substitute on a novel
preclinical large animal model of long term bone healing. Baseline gait assessment
characteristics were able to be determined for goat models relating to apparently healthy
goats prior to the start of the bone healing model. Positive results were associated with
long term integration of the bone substitute when the material was impregnated with the
growth factor bone morphogenetic protein-2. The most catastrophic complication of any
bone substitute used for long bone fractures, infection was encountered. Phenotypic and
whole genomic characterization of the Staphylococcal associated infections, and
subsequent osteomyelitis, were performed. It was recognized that there was an initial
bone proliferation associated with Staphylococcus aureus associated osteomyelitis cases.
The successful large animal preclinical model may provide an alternative to study bone
substitutes. Conventional fixation methodologies may be removed, after sufficient
healing time, to allow for further investigation into the integration and rehabilitation of
the bone substitute with the native bone.

vi
TABLE OF CONTENTS
Chapter 1. Bone Physiology: Structure, repair, and altered states of healing ............ 1 Abstract ........................................................................................................................... 2
Introduction ..................................................................................................................... 3
Long Bone: Function, Anatomy, Composition, Cellularity ............................................ 3
Function .................................................................................................................. 3
Gross Anatomy (Organ Level)................................................................................ 3
Blood and Nerve Supply ......................................................................................... 4
Microscopic Anatomy (Tissue Level) .................................................................... 5
Composition of Bone .............................................................................................. 5
Fracture Repair................................................................................................................ 8
Stage I- Inflammation ............................................................................................. 8
Stage II- Soft callus formation ................................................................................ 9
Stage III- Hard callus formation ............................................................................. 9
Stage IV- Bone remodeling .................................................................................... 9
Bone Morphogenetic Protein-2 ............................................................................... 9
Abnormal Fracture Healing (Delayed and Non-unions) ............................................... 10
Osteoconductive Scaffolds............................................................................................ 12
Osteomyelitis ................................................................................................................ 14
Conclusion .................................................................................................................... 15
References ..................................................................................................................... 16
Appendices .................................................................................................................... 24
Chapter 2. Use of a pressure-sensing walkway system for biometric assessment of
goats……………………………………………………………………………………...31 Abstract ......................................................................................................................... 32
Introduction ................................................................................................................... 33
Materials and Methods .................................................................................................. 34
Goats ..................................................................................................................... 34
Data Collection ..................................................................................................... 34
Gait Variables ....................................................................................................... 35
Force Variables ..................................................................................................... 36
Statistical Analysis ................................................................................................ 36
Results ........................................................................................................................... 36
Discussion ..................................................................................................................... 38
References ..................................................................................................................... 41
Appendices .................................................................................................................... 46
Chapter 3. Assessment of osseointegration of a novel synthetic bone scaffold in a
tibia segmental defect model .......................................................................................... 54 Abstract ......................................................................................................................... 55
Introduction ................................................................................................................... 56
Materials and Methods .................................................................................................. 58

vii
Scaffold Fabrication .............................................................................................. 58
Study Design ......................................................................................................... 58
Surgical procedure and scaffold implantation in caprine tibias ............................ 58
Lameness evaluation post-operatively .................................................................. 59
Imaging assessment of ostectomy gaps and scaffold integration ......................... 60
High definition thermal imaging ........................................................................... 60
Radiographic assessment ...................................................................................... 60
Dual energy x-ray absorptiometry (DEXA) ......................................................... 60
Computed tomography.......................................................................................... 60
Biomechanical testing ........................................................................................... 60
Microscopic assessment of ostectomy gap and scaffold integration .................... 61
Statistical analysis ................................................................................................. 62
Results ........................................................................................................................... 62
Clinical observations ............................................................................................. 62
Lameness evaluation ............................................................................................. 63
Imaging assessment of ostectomy gap and scaffold osseointegration .................. 63
High definition thermal imaging ........................................................................... 63
Radiographs .......................................................................................................... 63
Bone mineral density (BMD) ................................................................................ 63
Computed tomography.......................................................................................... 64
Biomechanical testing ........................................................................................... 64
Microscopic assessment of ostectomy gap and scaffold integration .................... 64
Discussion ..................................................................................................................... 65
Conclusions ................................................................................................................... 68
References ..................................................................................................................... 69
Appendices .................................................................................................................... 75
Chapter 4. Characterization of post-operative hypertrophic osteomyelitis induced
by Staphylococcus aureus ............................................................................................... 87 Abstract ......................................................................................................................... 88
Introduction ................................................................................................................... 89
Materials and Methods .................................................................................................. 90
Case Population .................................................................................................... 90
Bacterial Isolates and Culture Methods ................................................................ 91
Isolation and Phenotypic Identification of Staphylococcus aureus ...................... 91
Genomic analysis .................................................................................................. 92
Statistical analysis ................................................................................................. 92
Results ........................................................................................................................... 92
Radiographic Analysis .......................................................................................... 92
Histomorphometric Analysis ................................................................................ 93
Genomic Analysis ................................................................................................. 93
Discussion ..................................................................................................................... 93
References ..................................................................................................................... 95
Appendices .................................................................................................................... 99

viii
Chapter 5. Conclusions and future research .............................................................. 105 Conclusions ................................................................................................................. 106
Future Research .......................................................................................................... 106
References ................................................................................................................... 108
VITA…………………………………………………………………………………...111

ix
LIST OF TABLES
Table 1-1. Major cytokines, growth factors, non-collagenous proteins and their proposed
roles. .......................................................................................................................... 28
Table 2-1. Working definitions used for gait variables. ................................................... 48
Table 2-2. Descriptive statistics for the stance gait parameters. ....................................... 49
Table 2-3. Descriptive statistics for the stride gait parameters. ........................................ 50
Table 2-4.Student’s t-test evaluating day 1 versus day 3. ................................................. 51
Table 3-1. Radiographic scoring for assessment of ostectomy gap filling. ...................... 77
Table 3-2. Final group break down showing the number of defects in each group that
healed (formed a bridging callus) versus those showing insufficient healing (lack of
bridging callus). ........................................................................................................ 78
Table 3-3. Group x Month interactions for bone mineral density as measured by DEXA
(P=0.057). ................................................................................................................. 81
Table 3-4. Group x Time point interactions for average osteoclast count per mm of bone
surface. ...................................................................................................................... 86
Table 4-1. Radiographic scoring for assessment of ostectomy gap filling. .................... 100
Table 4-2. Descriptive data of each strain of osteomyelitis subjected to whole genomic
sequencing............................................................................................................... 101
Table 4-3. Bioinformatic data from S. aureus isolates subjected to whole genomic
sequencing............................................................................................................... 104

x
LIST OF FIGURES
Figure 1-1. Endochondral ossification and long bone blood supply. ............................... 25
Figure 1-2. Anatomy of a long bone. ................................................................................ 26
Figure 1-3. Haversian systems. ......................................................................................... 27
Figure 1-4. Commitment of a mesenchymal stem cell to an osteocyte with important
proteins. ..................................................................................................................... 29
Figure 1-5. An accelerated overview of the four stages of bone healing (inflammation,
soft callus formation, hard callus formation, remodeling) as seen in a mouse model
of long bone fracture healing. ................................................................................... 30
Figure 2-1. Examples of halter-lead training and sample gait analysis. ........................... 47
Figure 2-2. Box plots for Maximum Force (%BW), Maximum Force (Kg), and Maximum
Peak Pressure (KPa). ................................................................................................. 52
Figure 2-3. Box plots for Impulse (%BW*sec) and Impulse (Kg*sec). ........................... 53
Figure 3-1. Multi-layered nHA-PU-DBP based scaffolds implanted into 2.5 cm segmental
defects in the goat tibia. ............................................................................................ 76
Figure 3-2. Radiographs were acquired monthly. ............................................................. 79
Figure 3-3. DEXA Imaging and Analysis. ........................................................................ 80
Figure 3-4. Computed tomography (CT). ......................................................................... 82
Figure 3-5. Von Kossa (percent mineralization) staining. ................................................ 83
Figure 3-6. Goldner’s Trichrome (percent osteoid) staining. ........................................... 84
Figure 3-7. The average osteoclast count per mm of bone surface. ................................. 85
Figure 4-1. Radiographic ostectomy gap filling of an S. aureus goat and a case
comparsion. ............................................................................................................. 102
Figure 4-2. Tetracycline labelling of an S. aureus goat and a case comparsion. ............ 103

xi
ABBREVIATIONS
BMP. ........................................................................................ bone morphogenetic protein
BMD………… .................................................................................... bone mineral density
BW.. .................................................................................................................. body weight
cm………… ......................................................................................................... centimeter
CT………… ..................................................................................... computed tomography
DBP………… .......................................................................... decellularized bone particles
FGF. ................................................................................................ fibroblast growth factor
IGF... ............................................................................................ insulin-like growth factor
IL…. ..................................................................................................................... interluekin
ISO………… ................................................ international organization for standardization
g………….................................................................................................................... grams
HU………… ................................................................................................ hounsfield units
Kgs. kilograms
kPa. kilopascals
kgf………… ................................................................................................ kilograms force
MLTS. ........................................................................................ multilocus sequence typing
MMSCRAMM………..……………….. .......... microbial surface components recognizing
adhesive matrix molecules
nHA. ....................................................................................................... nanohydroxyapatite
OR………… ......................................................................................................... odds ratio
PDGF. .................................................................................... platelet derived growth factor
PU... ................................................................................................................. polyurethane
rh………… ........................................................................................... recombinant human
S. aureus. ........................................................................................... Staphylococcus aureus
sec... .......................................................................................................................... seconds
ST... sequence type
std………… ............................................................................................. standard deviation
VLS. .................................................................................................... visual lameness score
TNF- IX . ................................................................................. tumor necrosis factor- alpha
TBF-B. ............................................................................... transforming growth factor beta
TRAP………… ................................................................ tartate resistant acid phosphatase

1
CHAPTER 1. BONE PHYSIOLOGY: STRUCTURE, REPAIR, AND ALTERED STATES OF
HEALING

2
Abstract
The purpose of this review is to understand the need for bone substitutes in
clinical applications of long bone fractures. Knowledge of long bone anatomy is the basic
first essential step towards understanding the form and function of long bones. From
there, basic fracture healing can be understood so as to understand where and how
fractures may advance to stages of non-healing. This gives rise to understanding when
bone substitutes may be used and what are the most common substitutes available.
Finally, a devastating complication of long bone fractures and the use of bone substitutes
is infection. The use of bone substitutes, fracture healing, delayed fracture healing and
infection are vast subjects and far from fully understood. The presented article is a
knowledge update with more specific information given to fracture healing regarding
growth factors, bone substitutes regarding polyurethane-nanohydroxyapatite based
platforms, and infection with specific interest of Staphylococcus aureus.

3
Introduction
Long bone fractures in a healthy adult are the result of major trauma, or high
energy injury [1]. In military personnel, extremity injuries, and associated fractures, are
the most common body region injured during combat [2, 3]. The tibia is the most
commonly fractured long bone [2, 3]. In civilian population this it typically the result of
falls, sporting, or motor vehicle accidents [1]. In military personnel, tibial injuries
associated with combat are typically the result of gunshots, explosion, and improves
explosive devices [2, 3].
The use of regenerative therapies for human musculoskeletal defect injuries is on
the verge of becoming standard practice. [4] Traditionally, catastrophic fractures have
required the use of bone substitutes (grafting) when a decision has been made to salvage
a limb [5, 6]. The gold standard for bone grafting materials has been the autograft (bone
taken from the patient’s own body) or the allograft (cadaveric bone from a bone bank) [7,
8]. The procedure is not without complication. Approximately 30-60% of grafting
procedures result in one or more complications, ranging from infection to incomplete
integration, to donor site pain [9]. In humans, the incidence of non-union fractures is
approximately 5-10% [10]. The consensus for the definition of delayed healing or
fracture non-union is inconsistent and subjective [11]. Musculoskeletal injuries have been
reported to now compromise approximately 50% of all combat wounds and are becoming
an orthopedic burden of disease highlighting the need for Food and Drug Administration
approval of new regenerative therapies to lower the incidence of these costly fractures
[12-14].
This first section serves to understand typical long bone conduct as the gold
standard for return to function after long bone fracture. The normal function, anatomy,
and composition of long bones is reviewed first because to ensure bone substitutes
perform suitably they must mimic the intrinsic nature of long bones. Normal fracture
healing is then reviewed to understand gaps in which abnormal fracture healing may
occur and the use bone substitutes are then needed. Abnormal fracture healing is
reviewed to understand how bone substitutes have been used and when they are used in
times that fracture healing has gone wrong. This is followed by available bone grafting
materials both natural and synthetic. Finally, a short section is provided on the main
complication of bone grafting, infection.
Long Bone: Function, Anatomy, Composition, Cellularity
Function Bone serves primarily as the body’s structural support, locomotion system, and
adapts in response to alterations of mechanical environment [15, 16]. It provides
maintenance for mineral homeostasis (primarily calcium and phosphorous), acid-base
balance, and supports an environment for hematopoietic cell development and bone
marrow production [15].
Gross Anatomy (Organ Level)
Regardless of mammalian species, long bones form by endochondral ossification,
a process by which bones evolve from cartilaginous prototypes that are permeated by
4
vessels and undergo mineralization [Fig 1-1; 17, 18]1. Therefore, long bones are divided
anatomically starting with a hollow tube, also known as the diaphysis (primary center of
ossification), which flares at either end into the cone shaped metaphyses followed by
growth plates and ending in rounded epiphyses (secondary center of ossification) [15,
17]. The cylindrical diaphysis is formed by a covering of compact bone [15, 19]. The
internal architecture of the diaphysis holds the medullary cavity [19]. Cortical bone is
thick in the middle of the diaphysis and flares towards each metaphysis [19]. The cone
shaped metaphysis at either end is again surrounded by compact bone, although thinner,
while the internal structure is inhabited by cancellous (spongy) bone [19]. Both trabecular
and cortical (compact) bone are composed of lamellae. Cortical lamellae, or Haversian
systems, are cylindrical in shape and form a branching network [15]. Trabecular lamellae,
or packets, are semilunar in shape and form a three- dimensional lattice of plates and rods
with varying density [15, 19]. Metaphysis’ are responsible for transferring load into the
bone cortex [17]. The growth plates are regions of bone elongation just beyond the
metaphysis [17]. Finally, the epiphysis refers to the ends of long bone and have an
internal structure similar to the metaphysis [17]. The outer layer of the epiphysis is
thinner compact bone except where these ends articulate with adjoining bones, at which
point they are covered in hyaline cartilage [Fig 1-2; 19, 20].
Long bones are covered by a double layered membrane (periosteum) except at the
hyaline cartilage ends and where it is pierced by interesting ligaments and tendons [17,
19]. The outer layer is fibrous, while the inner layer is cellular and retains bone- forming
capacity beyond maturity that is reactivated during fracture healing [17, 18]. The
medullary cavity, within the diaphysis, is filled with either predominately red
(hematopoietic) or yellow (fat) marrow depending on the stage of life with red marrow
being more dominate in younger age groups while yellow is more customary in older age
groups [17]. Finally, a conceptual endosteal layer exists at the bone medullary cavity
interface to explain functional modifications seen during adaptation events [Fig 1-2; 17].
Blood and Nerve Supply
The skeletal system itself receives an indulgent blood supply, estimating 5-10% of
the overall cardiac output [19]. Arterial blood enteral through the largest nutrient artery
via the diaphyseal cortex to divide into proximal and distal intramedullary branches
which eventually branch into arterioles to permeate the Haversian or Volkmann’s canals
[17, 19]. Cortical bone receives up to one-third of its blood supply to its outer surface
from the periosteal arteries. Venous drainage is accomplished by veins that follow
accompanying arteries [Fig 1-1; 19]. There is no lymphatic system present within bone
[19]. Both sensory and motor nerves are found within bone [19]. Periosteal nerves are
sensory and contain pain receptors for tearing and tension [17].
1 All figures and tables for this chapter are presented in the appendix.

5
Microscopic Anatomy (Tissue Level)
Long bones can be divided into four categories: woven bone, lamellar bone,
cortical bone or trabecular bone. Woven, or immature bone, is seen in areas of rapid
growth or states of high bone turn over [15, 19]. It is characterized by a collagen fibers
that are laid down in a random pattern with an immense number or bone progenitor cells
[17]. Lamellar bone is present on both cortical and trabecular bone. It is mature bone with
systematic collagen fibers [19].
Lamellar bone, within the cortex or just beneath the articular cartilage, is arranged
into Harversian systems (osteons) [17]. The boundary of each Haversian system is a
cement line [19]. The lamellae are aligned into concentric cylinders that run lengthwise
and hold nerves and vessels [20]. Volkmann’s canals are horizontal canals connecting the
Haversian systems to each other [21]. Between osteons, the lamellae are referred to as
interstitial lamellae [17]. Circumferential lamellae exist when layers are oriented parallel
to the circumference of the bone [17]. Cortical bone is almost non-porous (porosity of 5-
10%) and extremely dense [22]. Within this dense system, small holes (lacuna) exist
within the matrix that have been made during formation, or remodeling [22]. This system
and density give cortical bone both strength and restricted flexibility [Fig 1-3, 22, 23].
In contrast, lamellae within the trabecular bone are arranged in parallel [17].
Anastomosing plates or rods orient themselves to reflect adaptation to mechanical
stresses experienced by bone itself [17]. It is exceedingly porous (75-95%) with pores
being interconnected and filled either marrow [22].
Composition of Bone
Long bones are composed of 20 to 40% organic bone matrix, 50 to 70% mineral,
5 to 10% water, and <3% lipids. Cells involved in the structural integrity of bone are
osteoblasts, osteocytes, and osteoclasts [15, 17].
Organic bone matrix can be broken down into collagenous or non-collagenous
proteins, proteoglycans, and lipids [17]. Up to 90% of the bone collagen is Type I
collagen [22, 24]. Other collagen proteins (i.e. Types II or IX collagens) may be found in
trace amounts as organization components or in pathologic conditions [15, 24].Type I
collagen is a triple helical molecule composed of three amino acid chains which have
extensive cross- linkages, both among themselves and between adjacent molecules [19,
22]. While it has been well described, recombinant forms of type I collagen are gaining
popularity as platforms for bone regeneration [25]. Deposition of Type I collagen
molecules occurs in rows with perforations between adjacent molecules in the horizontal
direction of 35 to 40 nm [17, 22]. Rows are staggered so that molecules overlap and are
offset by a stance of 64 to 70 nm [17, 22]. Collagen molecules are connected through
immature enzymatic cross-linkages [22]. This packaging and enzymatic cross-linking
provides the strength and insolubility to bone [17]. The collagen fibers arranged in
parallel make up lamellae and are arranged either concentrically or parallel depending on
if they are in cortical or trabecular bone [17].
Non-collagenous proteins are numerous with a wide range of functions from
cytokines to enzymes to adhesion molecules [17, 19]. Important non-collagenous proteins
and their proposed roles are summarized in Table 1-1 [26, 27]. Proteoglycans and lipids
are the final important components of bone. While the role of proteoglycans remains
unclear, it is thought to potentially attract water. [17, 19]. This allows resistance to

6
compression due it’s composition of hyaluronic acid, chondroitin and dermatan sulfates,
heparin sulfate and heparin, and keratin suflate aggregated to a protein core [17, 19].
While lipids in bone may aid in promoting calcification by binding calcium to cell
membranes [17]. Water may be freely mobile, bound to the surface in the mineral phase,
or bound as a hydroxyl component of other molecules in bone [22]. An inverse
relationship exists between the water content of bone and its mechanical properties with a
lower water content significantly increasing bone stiffness while a higher water content
reduces it [22]. Bound water is associated with bone strength and mobile water is
correlated with the modulus of elasticity and the porosity of bone [22].
Bone mineral exists in a crystal form composed mainly of hydroxyapatite [19,
22]. The mineral crystal orientation giving bone anisotropic properties while providing
significant hardness, stiffness and strength [17, 19]. The main minerals contributing to
the hydroxyapatite crystal are calcium and phosphorous [22]. Other major minerals
including calcium and phosphorous are carbonate, magnesium, sodium, manganese, zinc,
copper and fluoride to make up 65% of bone by weight [17]. Osteoid, or unmineralized
organic matrix, is originally laid down in woven bone and must undergo mineralization to
become lamellar bone [17, 19, 22]. The process of mineralization may differ based on if
bone is going from unwoven to lamellar bone (maturation) or if bone is going from
lamellar bone to lamellar bone (remodeling) [17, 19]. With remodeling, mineralization
may occur at nucleation sites within the collagen itself because specific proteins such as
osteonectin or bone sialoprotein may act as a nidus or the mineralization process to occur
[17, 19].
Alternatively, when bone undergoes maturation mineralization it is thought to
occur through extracellular matrix vesicles in an orderly process [17, 19, 22]. An
overview is one in which osteoid is produced, matures, and mineral is exchanged for
water in the hole zones of collagen molecules to not disrupt spatial organization [17, 19].
The exact mechanism by which mineral comes to be concentrated within extracellular
matrix vesicles is poorly understood with physiologic fluids perhaps becoming
supersaturated with mineral, crystal inhibitors present, genetic control, hormonal control
and Vitamin D all playing roles [17,19]. Once vesicles (cytoplasmic blebs) are formed
from bone cells in woven bone and minerals are concentrated, they precipitate in the form
of amorphous crystals with the vesicles thought to contain specific enzymes and
phospholipids to bone mineralization [17]. After precipitation, a specified mass is
reached and the amorphous crystals becomes crystalline hydroxyapatite and are deposited
within the hole zones of collagen molecules [17, 19] Surfaces of collagen fibers must be
mineralized as well and in order for the process of mineralization to continue, inhibitors
of mineralization must be destroyed [17]. After this occurs, woven bone is no longer
present and the new lamellar bone can undergo further remodeling to finish becoming
mature bone.
Bone cells that affect structural integrity of bone are osteoblasts, osteocytes and
osteoclasts [17]. Osteoprogenitor cells exist as undifferentiated mesenchymal cells that
have the properties of stem cells in that they have the ability to differentiate in order to
give rise to and maintain new bone cells (osteoblasts) which synthesize new bone matrix
(osteoid) on bone surfaces [15, 17, 19]. They arise from self- renewing pluripotent stem
cells in various tissues and commitment to the osteoblast lineage requires the canonical
Runx2/Wnt/B-catenin pathway and associated proteins [15, 28]. In bone, these
7
committed yet undifferentiated mesenchymal stem cells are present on the endosteum,
Haversian and Volkamann’s canals, as well as the inner layer of the periosteum as bone-
lining cells [19].
Osteoblasts arise from osteoprogenitor cells and their shape is dependent on their
amount of activity [15, 17 19]. Inactive, or quiescent, osteoblasts resemble discs and are
thought to form the endosteum [15, 17]. Active osteoblasts are plump with extensive
organelles as they are responsible for bone matrix (osteoid) synthesis and secretion,
mainly Type I collagen and glycosoaminoglycans [15, 17, 19]. Interaction occurs
between osteoblasts and mature bone cells (osteocytes) in the regulation of calcium
homeostasis and mineralization of bone [17, 19, 29]. Osteoblasts respond with osteocytes
to mechanical stress to mediate changes in bone shape and size [15, 17, 19]. Osteoblasts
then differentiate into primary bone cells (osteocytes) depending on a variety of growth
factors and transcription factors. For our purposes, it is assumed that molecular and
cellular signaling proceeds in a normal fashion. Fig.1-4 provides a brief overview for
commitment of a multipotent mesenchymal stem cell to a mature osteocyte with growth
factors and signaling outlined in Table 1-1 [30]. For simplicity, osteoblasts secrete
osteoid or new mineralized bone, a key marker when evaluating bone formation.
Osteocytes lie within lacunae within mineralized bone and represent terminally
differentiated osteoblasts [15]. They function within syncytial networks to support bone
structure and metabolism [15]. They make contact with other osteocytes or osteoblasts by
the use of long cytoplasmic processes (filopodia) that lie within the canaliculi in
mineralized bone [15, 17]. Osteocytes themselves retain limited capacity to form new
bone, and only under extreme stress seem to play a limited role in bone resorption [15,
17, 31].
Osteoclasts arise from hematopoietic stem cells of the granulocyte-monocyte
origin [15, 17]. They are multinucleated, and are the only cells known to be capable of
resorbing bone. Osteoclasts are able to bind to bone matrix via integrin receptors present
in the osteoclast membrane [15]. Once bound, they are able to resorb bone. Briefly, the
mineral present in bone is dissolved by secretion of hydrogen ions [17]. Next, the
collagen present in bone matrix is cleaved into polypeptide fragments [17. This action
creates a concavity in the bone called Howships lacuna [17].
Bone remodeling occurs in four sequential phases; activation, resorption, reversal,
and formation [15]. It is the process by which bone maintains strength and mineral
homeostasis [15]. It occurs by three mechanisms; apposition and resorption at the
endosteal surface, apposition and resorption at the periosteal surface, and activation,
resorption and formation at the Haversian system [19]. Remodeling is first activated by
an interaction between osteoclasts and osteoblasts through a “coupling” mechanism that
is poorly understood [19]. Resorption is carried out by osteoclasts in the form of a
“cutting cone” [19]. The defect then becomes filled with fibrovascular tissue [19]. The
outer edge of where resorption ends and bone formation begins is known as the “cement”
or “reversal” line [19]. Finally, bone formation is carried out by osteoblasts. This
remodeling process may provide the key insights into specific cytokines or cell signaling
that allow the process of fracture repair to be more closely understood. Attention will be
paid to bone morphogenetic protein-2 later on as it is a prominent cytokine upregulated
during fracture repair [32].
8
Fracture Repair
In this section, the normal fracture repair sequence is reviewed as the gold
standard for a bone healing. Fractures are the most common traumatic injuries and
approximately 10% of them do not heal properly in humans [33]. Fractures themselves
are the result of structural failure of bone [34]. They are the result of loading factors on
bone itself and the intrinsic nature of bone [34]. The magnitude, rate and direction of load
influence the likelihood of fracture because bone is viscoelastic, constantly under strain,
and allows stress reduction to occur in a time-dependent manner [34]. Cortical bone has
different mechanical properties dependent on the direction it is loaded in (anisotropy)
[34]. Bone is strong but brittle due to its composition as described above and various in
amounts of cancellous versus cortical bone dependent on the area of bone allowing bone
to fracture differently dependent on the area that force is directed [34].
Fracture healing is regulated by the nature of the fracture itself, the stability of its
fixation, and biological processes [33]. One of the most widely examined treatments for
enhancing fracture healing is bone morphogenetic proteins [33]. In order to enhance the
use of bone morphogenetic proteins, conditions for fracture healing must be optimized
[33]. The sequential four-stage model is reviewed to describe the fundamental events that
occur over a timeline of fracture healing [35]. There are often significant overlaps
between the stages [35]. This will provide the ideal timeline for which bone substitutes,
often loaded with bone morphogenetic proteins, should aim to mimic natural bone in
terms of repair followed by integration or degradation of the substitute itself.
Fractures may heal as a result of direct (primary) or indirect healing (secondary)
[36]. Direct fracture healing is the result of correct anatomical reduction of the fracture
ends, without any gap formation, and a stable fixation [36]. In the tibia, and other
associated long bones, the most common form of fractures healing is indirect [36].
Indirect healing involves both endochondral and intramembranous bone healing, but does
not require perfect anatomical reduction or rigid stable conditions [36]. A four-stage
model to describe the basic events that occur during indirect fracture healing has been
developed from histological observations of healing fractures [35]. The stages consist of
inflammation, soft callus formation, hard callus formation, and remodeling [35]. An
accelerated overview is provided by Fig 1-5 with a mouse model of fracture healing that
occurs in 1 month [33].
Stage I- Inflammation
Immediately following a fracture, an acute inflammatory response begins and
peaks within the first 24 hours [36]. Inflammation typically subsides by 7 days [36].
Initially there is disruption to soft tissue integrity, disruption to normal vascular function,
and a hematoma is generated [35, 36]. The hematoma coagulates in, and around, the
fracture ends and within the medulla to form the initial template for a fracture callus [36].
There is a secretion of numerous proinflammatory cytokines. The main inflammatory
cytokines have previously been described in Table 1. Mesenchymal stem cells associated
with bone formation and repair originate from the periosteum, bone marrow, circulation,
and surrounding soft tissues play an initial role in this early stage of fracture healing [35,
36]. Finally, once the initial clot has formed, reorganization into granular tissue begins
with phagocytic cells clearing degenerated cells and debris [35].

9
Stage II- Soft callus formation
Soft callus formation begins concurrently with the end stage of the immediate
inflammatory phase [35]. It provides the cartilaginous template for hard callus formation.
It forms as a result of the endochondral ossification process for bone healing [35]. Cells
responsible for forming this semi-rigid, principally avascular, soft callus are chondrocytes
and fibroblasts [35]. Cartilaginous regions grow and merge, forming a central
fibrocartilaginous plug that splints the fracture [35]. Chondrocytes then undergo
hypertrophy and mineralization before undergoing apoptosis. Exact growth factors that
stimulate fibroblast and chondrocyte proliferation are numerous. For an up to date list,
the reader is referred to a current article by Schindeler et al [35]. In response to the
various factors, chondrocytes generate large amounts of extracellular matrix protein,
mainly types II or X [35]. Vascularization of the soft callus is stimulated by numerous
pro-angiogenic growth factors some of which are briefly mentioned in Table 1-1.
Stage III- Hard callus formation
This stage of bone repair is characterized by high levels of osteoblast activity.
Vasculature plays a critical role in terms of increased oxygen tension being necessary for
osteoblast differentiation. The formation of mineralized bone matrix occurs and arises
directly from the peripheral callus in areas of stability [35]. Revascularization occurs
along with removal of the soft callus [35]. This new initial woven bone is irregular,
containing both proteinaceous and mineralized extraceullar matrix [35]. Mechanical
stability, and the replacement of calcified cartilage by woven bone marks the end of hard
callus formation with bone remodeling beginning to take place concurrently [36].
Stage IV- Bone remodeling
The initial step in bone remodeling involves converting irregular woven bone into
lamellar bone and restoring the original cortical structure [35]. Osteoclasts become the
key cell type as they become polarized to adhere to, and resorb, mineralized bone in areas
that are irregular [35]. These irregular areas are known as “Howship’s lacuna” [35]. Once
resorption is complete, osteoblasts lay down new bone on the irregular surface [35].
Molecular signaling is again complex and beyond this limited discussion.
Bone Morphogenetic Protein-2
Clearly there are numerous cytokines and growth factors responsible for initiation
of fracture repair. The aim of this review is to highlight the bone morphogenetic proteins
as they are known for osteoinductive capacity during fracture repair [37]. Bone
morphogenetic proteins are members of the transforming growth factor beta superfamily
with activity that was first identified in the 1960s [38, 37]. They are the most extensively
reviewed candidates for fracture repair and are available in synthetic forms either derived
from Chinese hamster ovary cells or E. coli [33, 37). Although there are numerous bone
morphogenetic proteins, the most studied and FDA tested are BMP-2 and BMP-7 [33].
BMP-2 itself is an endogenous mediator of fracture repair [39]. It is necessary for
fracture repair and in mice lacking BMP-2 spontaneous fractures do not resolve with time
[39]. Unfortunately, Large amounts of BMP-2 are difficult to produce and extremely
costly [40]. There is increasing evidence of deleterious side effects of associated with off-
label use of BMP-2 products despite its ability to elicit an outstanding pro-osteogenic

10
effect [41]. This may associated with the large initial release of the protein from various
BMP-2 containing products [42, 43]. While the majority of recombinant human BMP-2
(rhBMP-2) is traditionally derived from Chinese hamster ovary cells, E. coli derived
rhBMP-2 has been shown to show compatible fusion rates [40, 44-46]. E. coli derived
rhBMP-2 is more cost effective and has shown potential as a growth factor capable of
elution from scaffolds with a pore size of 100-300 um [44]. In typical fractures, BMP-2 is
upregulated for up to 4 weeks supporting the idea that an alternative strategy is to have a
sustained release of BMP-2 allowing for enhanced osteogenic differentiation while
potentially mitigating side effects [32, 42, 47, 48]. Currently recombinant human BMP-2
and -7 are available under various regulatory conditions; however, testing is still under
way as it is still unknown how to use these potent proteins safely and effectively [33].
Newer studies have explored other various BMPs and their effects on fracture repair with
particular attention to BMP-4 and 6 with promising results [50, 51].
These stages of fracture repair are not separate from one and another [35]. For
example, cartilage mineralization, vascular invasion and woven bone formation occur
concurrently with the replacement of the peripheral callus with lamellar bone [35]. It is
important to remember that fracture repair is highly regulated and influenced by
numerous factors such as cellular, molecular and genetic factors [35]. Further information
regarding overlap of molecular signaling, interactions and phases is beyond the scope of
this review and the reader is referred to other articles [35, 36].
Abnormal Fracture Healing (Delayed and Non-unions)
When a fracture is unable to heal or heals in a manner slower than expected it
may be classified as a non-union or delayed union [52]. In human patients, the average
risk of nonunion per fracture is near 2% with up to a 10% incidence in elderly patients or
clavicular and tibial fractures [53]. The incidence of non-union is highly dependent on
injury, host factors, and is site dependent [54]. Consensus for the definitions of delayed
and non-unions currently do not exist, are inconsistent and subjective [55]. In 2007,
Giannoudis et al came up with the diamond concept [56]. This concept required 4 key
elements that every fracture must have to heal. They are the presence of osteogenic cells,
growth factors, mechanical stability with the requirement of tissue vascularity, and a
stable osteoconductive scaffold [55, 56].
With a delayed union, the fracture goes through the normal stages of healing
clinically, but the radiographic appearance of fracture healing is delayed [52]. One
definition may be “a fracture in which healing has not occurred in the expected time and
the outcome remains uncertain” [55]. Factors that may induce a delayed fracture include
a reduced blood supply, or infection at the fracture site [52]. These factors may be more
prevalent in fractures where the skin surface has been disrupted and the bone is exposed
to the environment (open) versus a fracture where the skin is intact (closed) [52].
Additionally, if the repair of the fracture has been too rigid, callus formation will be
inhibited and a gap of greater than 1 mm will delay union in human patients [52].
A non-union occurs if the fracture has failed to progress to the stage of a bridging
callus by 6 months [52]. However, the United States Food and Drug Administration
defines non-union as a fracture that must be at least 9 months old and has not shown
signs of progressive healing for 3 consecutive months [55]. Alternative definitions
include a timeline of 6-8 months, or twice the time in which a fracture should heal [55].

11
Some authors feel that specifying a time for every fracture is not helpful [55]. One
definition for a non-union, as described by one author, could be a symptomatic fracture
with no potential to heal without intervention [55]. In humans, general factors on the
patient side include age, corticosteroid therapy, and systemic disease, but these are
uncommon in animals [54].
Non-unions may be classified into two broad categories based on the Weber and
Czech classification system [55]. They may be either hypertrophic or atrophic
(Harwood). With hypertrophic non-unions, the fracture site is typically hyper-vascular
with potential for biological activity [55]. This is a fracture that typically can be resolved
with improved mechanics [55]. Under atrophic conditions, the opposite is true, and the
site is hypo-vascular and incapable of biological activity. These fractures require
additional therapies as changing the mechanical environment alone will not solve the
fractures inability to heal [55].
The first requirement for fracture healing is the presence of osteogenic cells [56].
Lack of these cells may arise from fractures that are open to the environment or those that
have undergone extensive surgical exposures [55]. Additionally, systemic biology of the
patient may affect the availability of osteogenic cells [55]. Finally, infection is
detrimental to these cells leading both to injury and reduced ability of local tissue to
support cellular healing [55].
The second key element leading to non-union is a lack of signaling molecules, or
growth factors. These molecules may be more important in the initial stages of fracture
healing as they are very active at the fracture hematoma site [55]. These growth factors
are secreted from numerous cells as reviewed in Table 1-1. With open fractures or
procedures that lead to a disturbance in the healing process during any time of fracture
healing, the environment for callus formation becomes disrupted, predisposing healing
towards a non-unions [55]. These signaling molecules are most detrimentally affected by
a loss of vascularity and perfusion [55].
Fracture site stability is the third key element that will profoundly alter the ability
of a fracture to heal. This may be the result of fracture treatments that result in either
excessive motion (i.e. a conservative fracture managed in a conservatively) or excessive
stability (i.e. a fracture that has not been adequately reduced allowing for too large a
fracture gap to persist, and there is a loss of normal mechanical stimulus) [55]. Fractures
that have excessive motion are more likely to result in hypertrophic non-unions. Atrophic
non-unions are more likely to be associated with excessive stability due to the loss of
mechanical stimulus that results in secondary bone healing if a fracture gap is too large
for primary bone healing [55]. According to Perren’s strain theory, fractures with
excessive motion do not progress beyond the early stages of soft tissue healing while
those with excessive stability do not progress through the stages of secondary bone
healing [55]. Further information regarding the types of fracture repair and various
stabilizing methodologies are biomechanical in nature and beyond the scope of this
review.
The second part of the third key element is fracture site vascularity. If vascularity
is decreased then there will be fewer cells available for repair, signaling and production
of substrates [55]. This may lead to potential bone necrosis further reduction in the
potential for healing and enhancing the local environment for infection [55]. Vascularity
may be disrupted due to high energy fractures, open injuries, or when there is stripping
12
and disruption of the local soft tissue supply and periosteum [55]. Finally, open surgical
fixation may further disrupt blood supply necessitating the need for respect to fracture
biology and evaluation of any potential enhancements that would preserve vascularity
[55].
Finally, the osteoconductive scaffold is the final part of fracture healing. If bony
apposition is achieved the necrotic bone present within the fracture will act as the
osteoconductive scaffold for osteogenic cells [55]. This element of fracture healing deals
with the micro-architecture of the fracture environment as it relates to cellular migration
and adhesion [55]. In order to stimulate new bone to bridge a gap, osteogenic cells must
be able to communicate across some type of scaffolding environment that is conducive to
cellular communication that promotes bone growth [55].
Treatment of a delayed or non-union fracture should be focused around restoring
the 4 key elements of fracture healing. While mechanical stability and tissue vascularity,
and osteogenic cells are beyond the scope of this review, we aim to evaluate potential
alternatives for osteoconductive scaffolds and growth factors that may be used when this
element of fracture healing is in jeopardy and cannot be fixed by means of traditional
therapies that are reviewed next.
Osteoconductive Scaffolds
Osteoconductive scaffolds may take many forms as the sole goal of the scaffold is
to provide osteogenic cells the ability to communicate with each other to promote bone
growth. The scaffold may be a bone graft material, a ceramic material, a synthetic
material, or a combination of the above. Ideally the combination should promote a bone
healing response by providing osteogenic, osteoconductive, or osteoinductive activity to a
local site [57]. Osteogenic may be defined as a material that contains living cells capable
of differentiation into bone, while an osteoinductive material provides a biologic stimulus
that induces local or transplanted cells to enter a pathway of differentiation leading to
mature osteoblasts [57]. Looking more closely at osteoconductive materials, these
promote bone apposition to its surface, functioning in part as a receptive scaffold to
facilitate enhanced bone formation [57].
The typical gold standard for bone grafting has traditionally been autografting [7,
57]. This has been followed by allografting and then xenografting. Autografting possess
all the properties required for grafting while retaining complete histocompatibility as it is
a graft taken from the patient (or donor) themselves [7]. It is osteoinductivece,
osteoconductive, and osteogenic [7]. The supply of autogenous graft material however is
self-limiting and does not come without cost [7]. Donor site morbidity can lead to major
or minor complications and have been reported at rates of up to almost 21% [7].
Allografting is taking a piece of bone from a cadaver or donor rather than from the
patient themselves. It is available in either cancellous, cortical, or demineralized bone
matrix forms [7]. It is typically osteoconductive, while demineralized bone matrix may
processed in a way to retain osteoinductive properties [7]. If the graft is cortical, then it
may retain some structural support properties in addition to being osteoconductive [7].
Allografts are at a disadvantage in that they do not retain osteogenic properties; however,
they are available large quantities and not associated with donor site morbidity or
increased surgical operative time [7]. The large disadvantage of allografts is the potential
for transmission of viruses and other infective agents and the potential for an immune

13
response from the recipient necessitating a match with the donor [7]. Xenografts are are
based on natural hydroxyapatite and deorganified bone that is obtained from a species
other than the host species [58]. They are strictly osteoconductive [58]. The concern is
again for a risk of a host-immune response [58].
Beyond more traditional grafts are the use of substitute materials. Some of the
first bone graft materials used are known as bioceramics [7, 58]. Bioceramics are neither
osteoinductive nor osteogenic [7]. They work by creating a scaffold to promote
osteosynthesis [58]. Bioceramics vary in terms of rate of re-absorption and mechanical
properties depending on which ceramic is used [7]. These rates vary widely from as fast
as four weeks to as long as 18 months [7]. Based on this, researchers have been
attempting to optimize the characteristics of bioceramics by creating composites of
various bone graft substitues [7]. There are four main types of bioceramics, calcium
sulphate, calcium phosphate, triacalcium phosphate, and coralline hydroxyapatite [7].
They come in multiple forms and combinations each seeking to provide the optimal
osteoconduction, osteoinduction, and osteointegration that most closely resembles the
autografts [58].
A second class of substitute materials are the polymer-based substitutes. While
natural polymers exist, they are rarely used alone [59]. Natural polymers include
collagen, alginate, agarose, chitosan, fibrin, and hylaronan [59]. The benefit of synthetic
polymers is that they can range from nondegradadable to fully biodegradable and offer
more flexibility and processability into different shapes and sizes [59]. Similar to
bioceramics, they can be found in different forms and manufactured in a variety of ways
[59]. While ceramic materials resemble components of bone, they are brittle, do not
match mechanical properties of bone and are unsuitable for growth of soft tissues that
enhance different cellular receptors [60]. The most common synthetic polymers are
aliphatic polyesters such as polycaprolactone, polactic acid and its copolymers such as
polylactide-co-glycolide, and polyglycolic acid [60]. Additional commonly used
polymers for bone tissue engineering include poly(vinyl alcohol), poly(propylene
fumarate) and polyurethane [61]. Functional groups or side chains can be incorporated
into synthetic polymers thus allowing them to be bioactivated in regards to bone tissue
[60].
Due to polymers tending to be too flexible and ceramics tending to be too brittle,
recently, composite materials have been made of polymers reinforced with ceramic fillers
[60]. The goal is to create a reinforced porous scaffold with enhanced bioactivity and
controlled resorption rate [60]. One of the most researched polymer composites is a
nanohydroxyapatite/polyurethane composite (nHA/PU) [62, 63]. While there has been
extensive research into the exact ratio of nHA to PU it has been shown to have excellent
cytocompatibility regardless of hydrothermal preparation methods [63-66]. Additionally,
it has been shown to have the capability of eluting rhBMP-2 in a rat model [67]. It has
shown promising degradation and integration capabilities into long bones in small animal
models [68]. Alternatively, this combination is suitable to the addition of other
regenerative materials such as bioactive glass [69]. Currently, there is a lack of large
animal studies, and commercialization methods that prevent this promising composite
material from moving forward.

14
Osteomyelitis
One of the most devastating and common reasons for either non-union or failure
of an osteoconductive scaffold is infection. Bone infection is termed osteomyelitis [70].
Osteomyelitis is an inflammatory bone disease caused by an infecting microorganism
[70]. The end result is progressive bone loss and destruction accounting for significant
morbidity and expense [70-73]. Opportunistic Gram-positive staphylococci, specifically
Staphylococcus aureus (SA) are responsible for up to 75% of clinical osteomyelitis cases
[72].
Staphylococcus aureus (SA) is a gram positive bacteria that is both a commensal
and a pathogen[75]. It is the most common pathogen in osteomyelitis (OM) [72, 74]. OM
is most commonly classified using the Waldvogel classification system [75]. One branch
of this system is contiguous-focus OM (infection from trauma or surgery with direct
implantation of organisms) which provides key insights into the how SA is able to infect
bone as healthy bone is resistant to infection [76]. SA has evolved to overcome this
resistance and infect bone in three key ways. The first is through genes that encode
microbial surface component recognizing adhesive matrix molecules (MSCAMMs) that
allow it to attach to bone cells (osteoblasts) [77]. The second is through biofilm formation
that provide a safe haven from both the immune system and antimicrobials [72]. Finally,
the last is the ability of SA to invade osteoblasts themselves, and survive in an altered
metabolic state [78, 79].
Currently, very little is known about how the SA-osteoblast relationship results in
bone formation. It may be that infected osteoblasts release inflammatory cytokines within
the first few days of infection, similar to osteoblasts after the first few days of an injury
[80]. Thus, infected osteoblasts may play a role in the initial inflammatory phases of bone
production prior to shifting activity to osteoclastic bone resorption and overall bone loss
[72]. Additionally, it may be that the exact strain of infectious SA plays an important
role. It has been shown that SA strains lacking genes that encode certain MSCRAMMs
are less likely to cause OM infections in animal models [81, 82]. A key development in
attempting to elucidate the SA-osteoblast relationship has been ability to determine
difference in strains of bacteria, and the presence of these genes, has been the use of
multilocus sequencing [83, 83]. One relatively novel sequence type (ST) of SA is ST 398,
which we have shown it to be putatively capable of producing a large amount of bone
formation. Additionally, this sequence type has a proven track record of being a one-
health problem, representing a newer sequence type from previous studies investigating
any potential SA-osteoblast relationships that result in bone formation [85-88].
Investigation of the sequence specific SA-osteoblast relationship may start with
physiologic evidence of bone formation. Evidence of such formation may be the result of
osteoblast inflammation which has been well studied with in both in-vitro and in-vivo
models of SA infection [89-94]. Osteoblast inflammation in-vitro may be characterized as
osteoblast invasion by SA and resultant cell death (apoptosis), a release of inflammatory
markers (cytokines), and a production of bone formation markers (type I collagen,
osteopontin, osteocalcin) [89-93]. This inflammation may be ST dependent with ST 398
capable of producing more periosteal new bone as compared to known laboratory strains.
These in-vitro studies would then be definitively confirmed in a known animal model of
infection providing the necessary link for definitive phenotypic evidence that the amount
of bone formation is sequence dependent [95]. Genetic comparisons of sequence types

15
may additionally elucidate how this little studied ST 398 is capable of physiologically
altering the SA-osteoblast relationship towards bone formation.
Next, altering the ability of SA to attach to osteoblasts may provide the necessary
evidence to elucidate the mechanism of the SA-osteoblast relationship in the production
of bone formation. The MSCRAMMs are protein surface adhesins that provide the ability
to attach to osteoblasts [96]. The synthesis of these surface adhesins is activated by global
regulatory loci such as sarA and cna, while environmental signals are generated to
activate agr [97]. sarA has been implicated in SA’s ability to form biofilms, while agr
has been implicated in SA’s virulence through production of hemolysins [97]. This leaves
cna which produces collagen binding protein (Cna) to become attached to osteoblasts,
and internalized to potentially alter osteoblast activity [97]. It becomes particularly
important in terms of direct inoculation (trauma or surgery) as osteoblasts are being
primed for bone repair and set to produce type I collagen [73]. Therefore how SA OM
results in new bone formation may be tied to the function of cna during direct
inoculation. This has been a remotely investigated phenomenon in terms of bone
formation. At present SA OM has been primarily identified as bone losing disease [70,
72]. Therefore, current treatment and prevention efforts do not consider the potential
overall impact of bone formation as a therapeutic advantage in areas devoid of bone
formation or as a potential target for treatment to limit its formation (reduce virulence) in
areas where it has become excessive.
Conclusion
In summary, a bone substitute should be osteconductive thereby mitigating the
loss of cell signaling that occurs with non-unions and returning fractures to proper
fracture healing and restoring bone back to its proper anatomical and functional form. If
they are capable of either eluting an antimicrobial or altering osteoblast activity towards
resisting infection, they are of added benefit as this is the primary and most devastating
complication. BMP-2 remains the most investigated growth factor with the most potential
towards accelerating fracture healing that may be eluted from osteoconductive scaffolds.
Investigation is still necessary for finding the most effective dose and delivery of this
potent growth factor. Nanohydroxyapetite and polyurethane composites are some of the
most studied bone regenerative scaffold composites which need FDA approval for
commercial manufacturing and large animal testing prior to becoming clinically usable
bone substitutes. The end goal for any bone substitute should always be to return long
bones to their normal functional anatomy.

16
References

17
1. Court-Brown, C. M., Rimmer, S., Prakash, U., & McQueen, M. M. (1998). The
epidemiology of open long bone fractures. Injury, 29(7), 529-534.
2. Belmont Jr, P. J., McCriskin, B. J., Hsiao, M. S., Burks, R., Nelson, K. J., &
Schoenfeld, A. J. (2013). The nature and incidence of musculoskeletal combat
wounds in Iraq and Afghanistan (2005–2009). Journal of orthopaedic trauma,
27(5), e107-e113.
3. Belmont, P. J., Schoenfeld, A. J., & Goodman, G. (2010). Epidemiology of
combat wounds in Operation Iraqi Freedom and Operation Enduring Freedom:
orthopaedic burden of disease. J Surg Orthop Adv, 19(1), 2-7.
4. Smith, B. D., & Grande, D. A. (2015). The current state of scaffolds for
musculoskeletal regenerative applications. Nature Reviews Rheumatology, 11(4),
213.
5. Finkemeier, C. G. (2002). Bone-grafting and bone-graft substitutes. JBJS, 84(3),
454-464.
6. Baldwin, P., Li, D. J., Auston, D. A., Mir, H. S., Yoon, R. S., & Koval, K. J.
(2019). Autograft, allograft, and bone graft substitutes: clinical evidence and
indications for use in the setting of orthopaedic trauma surgery. Journal of
orthopaedic trauma, 33(4), 203-213.
7. Fillingham, Y., & Jacobs, J. (2016). Bone grafts and their substitutes. The bone &
joint journal, 98(1_Supple_A), 6-9.
8. Fernandez de Grado, G., Keller, L., Idoux-Gillet, Y., Wagner, Q., Musset, A. M.,
Benkirane-Jessel, N., ... & Offner, D. (2018). Bone substitutes: a review of their
characteristics, clinical use, and perspectives for large bone defects management.
Journal of tissue engineering, 9, 2041731418776819.
9. Reichert, J. C., Saifzadeh, S., Wullschleger, M. E., Epari, D. R., Schütz, M. A.,
Duda, G. N., ... & Hutmacher, D. W. (2009). The challenge of establishing
preclinical models for segmental bone defect research. Biomaterials, 30(12),
2149-2163.
10. Zura, R., Xiong, Z., Einhorn, T., Watson, J. T., Ostrum, R. F., Prayson, M. J., ...
& Steen, R. G. (2016). Epidemiology of fracture nonunion in 18 human bones.
JAMA surgery, 151(11), e162775-e162775.
11. Harwood, P. J., Newman, J. B., & Michael, A. L. (2010). (ii) An update on
fracture healing and non-union. Orthopaedics and Trauma, 24(1), 9-23.
12. Belmont, P. J., Schoenfeld, A. J., & Goodman, G. (2010). Epidemiology of
combat wounds in Operation Iraqi Freedom and Operation Enduring Freedom:
orthopaedic burden of disease. J Surg Orthop Adv, 19(1), 2-7.
13. Court-Brown, C. M., Rimmer, S., Prakash, U., & McQueen, M. M. (1998). The
epidemiology of open long bone fractures. Injury, 29(7), 529-534.
14. Nandra, R., Grover, L., & Porter, K. (2016). Fracture non-union epidemiology
and treatment. Trauma, 18(1), 3-11.
15. Clarke, B. (2008). Normal bone anatomy and physiology. Clinical journal of the
American Society of Nephrology, 3(Supplement 3), S131-S139.

18
16. Mittag, U., Kriechbaumer, A., Bartsch, M., & Rittweger, J. (2015). Form follows
function: a computational simulation exercise on bone shape forming and
conservation. Journal of musculoskeletal & neuronal interactions, 15(2), 215.
17. Zachary, J. F., & McGavin, M. D. (2013). Pathologic Basis of Veterinary
Disease-Book. Elsevier Health Sciences.
18. Gasser J.A., Kneissel M. (2017) Bone Physiology and Biology. In: Smith S.,
Varela A., Samadfam R. (eds) Bone Toxicology. Molecular and Integrative
Toxicology. Springer, Cham
19. Safadi, F. F., & Khurana, J. S. (2009). Bone Structure and Function. In Diagnostic
Imaging of Musculoskeletal Diseases (pp. 1-13). Humana Press.
20. Jee, W., & Weiss, L. (1983). Histology: Cell and tissue biology. Histology Cell
and Tissue Biology, 5(9), 200-255.
21. Dyce, K. M., Sack, W. O., & Wensing, C. J. G. (2009). Textbook of veterinary
anatomy-E-Book. Elsevier Health Sciences.
22. Wang, X., Nyman, J. S., Dong, X., Leng, H., & Reyes, M. (2010). Fundamental
biomechanics in bone tissue engineering. Synthesis Lectures on Tissue
Engineering, 2(1), 1-225.
23. Elgazzar, A. H. (2017). Basic Sciences of Bone and Joint Diseases. In Orthopedic
Nuclear Medicine (pp. 1-36). Springer, Cham.
24. Henriksen, K., & Karsdal, M. A. (2016). Type I collagen. In Biochemistry of
collagens, laminins and elastin (pp. 1-11). Academic Press.
25. Ramírez-Rodríguez, G. B., Delgado-López, J. M., Iafisco, M., Montesi, M.,
Sandri, M., Sprio, S., & Tampieri, A. (2016). Biomimetic mineralization of
recombinant collagen type I derived protein to obtain hybrid matrices for bone
regeneration. Journal of structural biology, 196(2), 138-146.
26. Canalis, E., McCarthy, T. L., & Centrella, M. (1991). Growth factors and
cytokines in bone cell metabolism. Annual review of medicine, 42(1), 17-24.
27. Young, M. F. (2003). Bone matrix proteins: their function, regulation, and
relationship to osteoporosis. Osteoporosis international, 14(3), 35-42.
28. Majidinia, M., Sadeghpour, A., & Yousefi, B. (2018). The roles of signaling
pathways in bone repair and regeneration. Journal of cellular physiology, 233(4),
2937-2948.
29. Dallas, S. L., & Bonewald, L. F. (2010). Dynamics of the transition from
osteoblast to osteocyte. Annals of the New York Academy of Sciences, 1192, 437.
30. McCawley, L. J., & Matrisian, L. M. (2001). Matrix metalloproteinases: they're
not just for matrix anymore!. Current opinion in cell biology, 13(5), 534-540.
31. Suswillo, R. F., Javaheri, B., Rawlinson, S. C., Dowthwaite, G. P., Lanyon, L. E.,
& Pitsillides, A. A. (2017). Strain uses gap junctions to reverse stimulation of
osteoblast proliferation by osteocytes. Cell biochemistry and function, 35(1), 56-
65.
32. Groeneveld, E. H., & Burger, E. H. (2000). Bone morphogenetic proteins in
human bone regeneration. European journal of endocrinology, 142(1), 9-21.
33. Einhorn, T. A., & Gerstenfeld, L. C. (2015). Fracture healing: mechanisms and
interventions. Nature Reviews Rheumatology, 11(1), 45.
19
34. Nyary, T., & Scammell, B. E. (2018). Principles of bone and joint injuries and
their healing. Surgery (Oxford), 36(1), 7-14.
35. Schindeler, A., McDonald, M. M., Bokko, P., & Little, D. G. (2008, October).
Bone remodeling during fracture repair: The cellular picture. In Seminars in cell
& developmental biology (Vol. 19, No. 5, pp. 459-466). Academic Press.
36. Marsell, R., & Einhorn, T. A. (2011). The biology of fracture healing. Injury,
42(6), 551-555.
37. Chen, D. I., Zhao, M., & Mundy, G. R. (2004). Bone morphogenetic proteins.
Growth factors, 22(4), 233-241.
38. Urist, M. R. (1965). Bone: formation by autoinduction. Science, 150(3698), 893-
899.
39. Tsuji, K., Bandyopadhyay, A., Harfe, B. D., Cox, K., Kakar, S., Gerstenfeld, L.,
... & Rosen, V. (2006). BMP2 activity, although dispensable for bone formation,
is required for the initiation of fracture healing. Nature genetics, 38(12), 1424.
40. Chung, C. H., Kim, Y. K., Lee, J. S., Jung, U. W., Pang, E. K., & Choi, S. H.
(2015). Rapid bone regeneration by Escherichia coli-derived recombinant human
bone morphogenetic protein-2 loaded on a hydroxyapatite carrier in the rabbit
calvarial defect model. Biomaterials research, 19(1), 17.
41. Quinlan, E., Thompson, E. M., Matsiko, A., O'Brien, F. J., & López-Noriega, A.
(2015). Long-term controlled delivery of rhBMP-2 from collagen–hydroxyapatite
scaffolds for superior bone tissue regeneration. Journal of controlled release, 207,
112-119.
42. Poldervaart, M. T., Wang, H., van der Stok, J., Weinans, H., Leeuwenburgh, S.
C., Öner, F. C., ... & Alblas, J. (2013). Sustained release of BMP-2 in bioprinted
alginate for osteogenicity in mice and rats. PloS one, 8(8), e72610.
43. Jansen, J. A., Vehof, J. W. M., Ruhe, P. Q., Kroeze-Deutman, H., Kuboki, Y.,
Takita, H., ... & Mikos, A. G. (2005). Growth factor-loaded scaffolds for bone
engineering. Journal of Controlled Release, 101(1-3), 127-136.
44. Lee, J. H., Ryu, M. Y., Baek, H. R., Lee, K. M., Seo, J. H., Lee, H. K., & Ryu, H.
S. (2013). Effects of porous beta-tricalcium phosphate-based ceramics used as an
E. coli-derived rhBMP-2 carrier for bone regeneration. Journal of Materials
Science: Materials in Medicine, 24(9), 2117-2127.
45. Bessho, K., Konishi, Y., Kaihara, S., Fujimura, K., Okubo, Y., & Iizuka, T.
(2000). Bone induction by Escherichia coli-derived recombinant human bone
morphogenetic protein-2 compared with Chinese hamster ovary cell-derived
recombinant human bone morphogenetic protein-2. British Journal of Oral and
Maxillofacial Surgery, 38(6), 645-649.
46. Geiger, M., Li, R. H., & Friess, W. (2003). Collagen sponges for bone
regeneration with rhBMP-2. Advanced drug delivery reviews, 55(12), 1613-1629.
47. Yamamoto, M., Takahashi, Y., & Tabata, Y. (2003). Controlled release by
biodegradable hydrogels enhances the ectopic bone formation of bone
morphogenetic protein. Biomaterials, 24(24), 4375-4383.

20
48. Cho, T. J., Gerstenfeld, L. C., & Einhorn, T. A. (2002). Differential temporal
expression of members of the transforming growth factor β superfamily during
murine fracture healing. Journal of Bone and Mineral Research, 17(3), 513-520.
49. Jane Jr, J. A., Dunford, B. A., Kron, A., Pittman, D. D., Sasaki, T., Li, J. Z., ... &
Kallmes, D. F. (2002). Ectopic osteogenesis using adenoviral bone morphogenetic
protein (BMP)-4 and BMP-6 gene transfer. Molecular Therapy, 6(4), 464-470.
50. Bandyopadhyay, A., Tsuji, K., Cox, K., Harfe, B. D., Rosen, V., & Tabin, C. J.
(2006). Genetic analysis of the roles of BMP2, BMP4, and BMP7 in limb
patterning and skeletogenesis. PLoS genetics, 2(12), e216.
51. Kugimiya, F., Kawaguchi, H., Kamekura, S., Chikuda, H., Ohba, S., Yano, F., ...
& Nakamura, K. (2005). Involvement of endogenous bone morphogenetic protein
(BMP) 2 and BMP6 in bone formation. Journal of Biological Chemistry, 280(42),
35704-35712.
52. Nyary, T., & Scammell, B. E. (2018). Principles of bone and joint injuries and
their healing. Surgery (Oxford), 36(1), 7-14.
53. Ding, Z. C., Lin, Y. K., Gan, Y. K., & Tang, T. T. (2018). Molecular pathogenesis
of fracture nonunion. Journal of orthopaedic translation, 14, 45-56.
54. DeCamp, C. E. (2015). Brinker, Piermattei and Flo's handbook of small animal
orthopedics and fracture repair. Elsevier Health Sciences.
55. Harwood, P. J., Newman, J. B., & Michael, A. L. (2010). (ii) An update on
fracture healing and non-union. Orthopaedics and Trauma, 24(1), 9-23.
56. Giannoudis, P. V., Einhorn, T. A., & Marsh, D. (2007). Fracture healing: the
diamond concept. Injury, 38, S3-S6.
57. Bauer, T. W., & Muschler, G. F. (2000). Bone graft materials: an overview of the
basic science. Clinical Orthopaedics and Related Research®, 371, 10-27.
58. Popescu, E., Forna, D. A., Earar, K., & Forna, N. C. (2017). Bone Substitutes
Used in Guided Bone Regeneration Technique. Materiale plastice, 54(2), 390.
59. Fernandez de Grado, G., Keller, L., Idoux-Gillet, Y., Wagner, Q., Musset, A. M.,
Benkirane-Jessel, N., ... & Offner, D. (2018). Bone substitutes: a review of their
characteristics, clinical use, and perspectives for large bone defects management.
Journal of tissue engineering, 9, 2041731418776819.
60. . Gloria, A., De Santis, R., & Ambrosio, L. (2010). Polymer-based composite
scaffolds for tissue engineering. Journal of Applied Biomaterials and
Biomechanics, 8(2), 57-67.
61. Shi, R., Chen, D., Liu, Q., Wu, Y., Xu, X., Zhang, L., & Tian, W. (2009). Recent
advances in synthetic bioelastomers. International journal of molecular sciences,
10(10), 4223-4256.olds for tissue engineering. Journal of Applied Biomaterials
and Biomechanics, 8(2), 57-67.
62. Sultan, M. (2018). Hydroxyapatite/polyurethane composites as promising
biomaterials. Chemical Papers, 72(10), 2375-2395

21
63. Popescu, L. M., Piticescu, R. M., Antonelli, A., Rusti, C. F., Carboni, E., Sfara,
C., ... & Buruiana, T. (2013). Recent advances in synthesis, characterization of
hydroxyapatite/polyurethane composites and study of their biocompatible
properties. Journal of Materials Science: Materials in Medicine, 24(11), 2491-
2503.
64. Popescu LM, Rusti CF, Piticescu RM, Valero T, Kintzios S, Buruiana T.
Synthesis and characterization of acid polyurethane hydroxyapatite composites
for biomedical applications. J Compos Mater. 2012;.
doi:10.1177/0021998312443396.
65. Popescu LM, Piticescu RM, Rusti CF, Maly M, Danani A, Kintzios S, Valero
Grinan MT. Preparation and characterization of new hybrid nanostructured thin
films for biosensors design. Mater Lett. 2011;65:2032–5.
doi:10.1016/j.matlet.2011.04.028.
66. Negroiu G, Piticescu RM, Chitanu GC, Mihailescu IN, Zdrentu L, Miroiu M.
Biocompatibility evaluation of a novel hydroxyapatite- polymer coating for
medical implants (in vitro tests). J Mater Sci Mater Med. 2008;19:1537–44.
doi:10.1007/s10856-007- 3300-6.
67. Dumas, J. E., Prieto, E. M., Zienkiewicz, K. J., Guda, T., Wenke, J. C., Bible, J.,
... & Guelcher, S. A. (2013). Balancing the rates of new bone formation and
polymer degradation enhances healing of weight-bearing allograft/polyurethane
composites in rabbit femoral defects. Tissue Engineering Part A, 20(1-2), 115-
129.
68. Dong, Z., Li, Y., & Zou, Q. (2009). Degradation and biocompatibility of porous
nano-hydroxyapatite/polyurethane composite scaffold for bone tissue engineering.
Applied Surface Science, 255(12), 6087-6091
69. .Ryszkowska, J. L., Auguścik, M., Sheikh, A., & Boccaccini, A. R. (2010).
Biodegradable polyurethane composite scaffolds containing Bioglass® for bone
tissue engineering. Composites Science and Technology, 70(13), 1894-1908.
70. Kavanagh, N., Ryan, E. J., Widaa, A., Sexton, G., Fennell, J., O'Rourke, S., ... &
Kerrigan, S. W. (2018). Staphylococcal osteomyelitis: disease progression,
treatment challenges, and future directions. Clinical microbiology reviews, 31(2),
e00084-17.
71. Jin, T., liang Zhu, Y., Li, J., Shi, J., qing He, X., Ding, J., & qing Xu, Y. (2013).
Staphylococcal protein A, Panton-Valentine leukocidin and coagulase aggravate
the bone loss and bone destruction in osteomyelitis. Cellular Physiology and
Biochemistry, 32(2), 322-333.
72. Claro, T., Widaa, A., O'Seaghdha, M., Miajlovic, H., Foster, T. J., O'Brien, F. J.,
& Kerrigan, S. W. (2011). Staphylococcus aureus protein A binds to osteoblasts
and triggers signals that weaken bone in osteomyelitis. PloS one, 6(4), e18748.
73. Calhoun, J., Manring, M. M. & Shirtliff, M. Osteomyelitis of the Long Bones.
Semin. Plast. Surg. 23, 059–072 (2009).
74. Springer, B., Orendi, U., Much, P., Höger, G., Ruppitsch, W., Krziwanek, K., ...
& Mittermayer, H. (2009). Methicillin-resistant Staphylococcus aureus: a new
zoonotic agent?. Wiener klinische Wochenschrift, 121(3-4), 86-90.

22
75. Pan, A., Battisti, A., Zoncada, A., Bernieri, F., Boldini, M., Franco, A., ... &
Monaci, M. (2009). Community-acquired methicillin-resistant Staphylococcus
aureus ST398 infection, Italy. Emerging infectious diseases, 15(5), 845.
76. Feßler, A., Scott, C., Kadlec, K., Ehricht, R., Monecke, S., & Schwarz, S. (2010).
Characterization of methicillin-resistant Staphylococcus aureus ST398 from cases
of bovine mastitis. Journal of Antimicrobial Chemotherapy, 65(4), 619-625.
77. Wright, J. A., & Nair, S. P. (2010). Interaction of staphylococci with bone.
International journal of medical microbiology, 300(2-3), 193-204.
78. Floras, A., Lawn, K., Slavic, D., Golding, G. R., Mulvey, M. R., & Weese, J. S.
(2010). Sequence type 398 meticillin-resistant Staphylococcus aureus infection
and colonisation in dogs.
79. Tucker, K. A., Reilly, S. S., Leslie, C. S., & Hudson, M. C. (2000). Intracellular
Staphylococcus aureus induces apoptosis in mouse osteoblasts. FEMS
microbiology letters, 186(2), 151-156
80. Abouelkhair, M. A., Rifkin, R. E., Grzeskowiak, R. M., Biris, A. S., Anderson, D.
E., Bemis, D. A., & Kania, S. A. (2018). Complete Genome Sequences of Four
Staphylococcus aureus Sequence Type 398 Isolates from Four Goats with
Osteomyelitis. Microbiol Resour Announc, 7(12), e01174-18
81. Cheon, I. S., Woo, S. S., Kang, S. S., Im, J., Yun, C. H., Chung, D. K., ... & Han,
S. H. (2008). Peptidoglycan-mediated IL-8 expression in human alveolar type II
epithelial cells requires lipid raft formation and MAPK activation. Molecular
immunology, 45(6), 1665-1673.
82. Kim, J., Yang, J., Park, O. J., Kang, S. S., Kim, W. S., Kurokawa, K., ... & Han,
S. H. (2013). Lipoproteins are an important bacterial component responsible for
bone destruction through the induction of osteoclast differentiation and activation.
Journal of Bone and Mineral Research, 28(11), 2381-2391.
83. Alexander, E. H., & Hudson, M. (2001). Factors influencing the internalization of
Staphylococcus aureus and impacts on the course of infections in humans.
Applied microbiology and biotechnology, 56(3-4), 361-366.
84. Sinha, B., & Fraunholz, M. (2010). Staphylococcus aureus host cell invasion and
post-invasion events. International Journal of Medical Microbiology, 300(2-3),
170-175.
85. Bow, A. J., Newby, S., Rifkin, R., Jackson, B., Matavosian, A., Griffin, C., ... &
Morello, R. (2019). Evaluation of a polyurethane platform for delivery of
nanohydroxyapatite and decellularized bone particles in a porous three-
dimensional scaffold. ACS Applied Bio Materials.
86. Bankevich, A., Nurk, S., Antipov, D., Gurevich, A. A., Dvorkin, M., Kulikov, A.
S., … Pevzner, P. A. (2012). SPAdes: A New Genome Assembly Algorithm and
Its Applications to Single-Cell Sequencing. Journal of Computational Biology,
19(5), 455–477. https://doi.org/10.1089/cmb.2012.0021
87. Seemann, T. (2014). Prokka: rapid prokaryotic genome annotation.
Bioinformatics (Oxford, England), 30(14), 2068–2069.
https://doi.org/10.1093/bioinformatics/btu153

23
88. Jain, C., Rodriguez-R, L. M., Phillippy, A. M., Konstantinidis, K. T., & Aluru, S.
(2018). High throughput ANI analysis of 90K prokaryotic genomes reveals clear
species boundaries. Nature Communications, 9(1), 5114.
https://doi.org/10.1038/s41467-018-07641-9
89. Contreras-Moreira, B., & Vinuesa, P. (2013). GET_HOMOLOGUES, a Versatile
Software Package for Scalable and Robust Microbial Pangenome Analysis.
Applied and Environmental Microbiology, 79(24), 7696–7701.
https://doi.org/10.1128/AEM.02411-13
90. Kanehisa, M., Furumichi, M., Tanabe, M., Sato, Y., & Morishima, K. (2017).
KEGG: new perspectives on genomes, pathways, diseases and drugs. Nucleic
Acids Research, 45(D1), D353–D361. https://doi.org/10.1093/nar/gkw1092
91. Tatusov, R. L., Galperin, M. Y., Natale, D. A., & Koonin, E. V. (2000). The COG
database: a tool for genome-scale analysis of protein functions and evolution.
Nucleic Acids Research, 28(1), 33–36.
92. Finn, R. D., Bateman, A., Clements, J., Coggill, P., Eberhardt, R. Y., Eddy, S. R.,
… Punta, M. (2014). Pfam: the protein families database. Nucleic Acids Research,
42(D1), D222–D230. https://doi.org/10.1093/nar/gkt1223
93. Liu, B., Zheng, D., Jin, Q., Chen, L., & Yang, J. (2019). VFDB 2019: a
comparative pathogenomic platform with an interactive web interface. Nucleic
Acids Research, 47(D1), D687–D692. https://doi.org/10.1093/nar/gky1080
94. Yoon, S. H., Park, Y.-K., & Kim, J. F. (2015). PAIDB v2.0: exploration and
analysis of pathogenicity and resistance islands. Nucleic Acids Research,
43(Database issue), D624–D630. https://doi.org/10.1093/nar/gku985
95. Abouelkhair, M. A., Bemis, D. A., Giannone, R. J., Frank, L. A., & Kania, S. A.
(2018). Characterization of a leukocidin identified in Staphylococcus
pseudintermedius. PloS one, 13(9), e0204450.
96. Strobel, M., Pförtner, H., Tuchscherr, L., Völker, U., Schmidt, F., Kramko, N., ...
& Niemann, S. (2016). Post-invasion events after infection with Staphylococcus
aureus are strongly dependent on both the host cell type and the infecting S.
aureus strain. Clinical Microbiology and Infection, 22(9), 799-809.
97. Chen, W., Zhang, Y., Yeo, W. S., Bae, T., & Ji, Q. (2017). Rapid and efficient
genome editing in Staphylococcus aureus by using an engineered CRISPR/Cas9
system. Journal of the American Chemical Society, 139(10), 3790-3795.

24
Appendices

25
Figure 1-1. Endochondral ossification and long bone blood supply.
Image curtesy of Gasser J.A., Kneissel M. (2017) Bone Physiology and Biology. In:
Smith S., Varela A., Samadfam R. (eds) Bone Toxicology. Molecular and Integrative
Toxicology. Springer, Cham

26
Figure 1-2. Anatomy of a long bone.
Image curtesy of Jee, W., & Weiss, L. (1983). Histology: Cell and tissue biology.
Histology Cell and Tissue Biology, 5(9), 200-255.
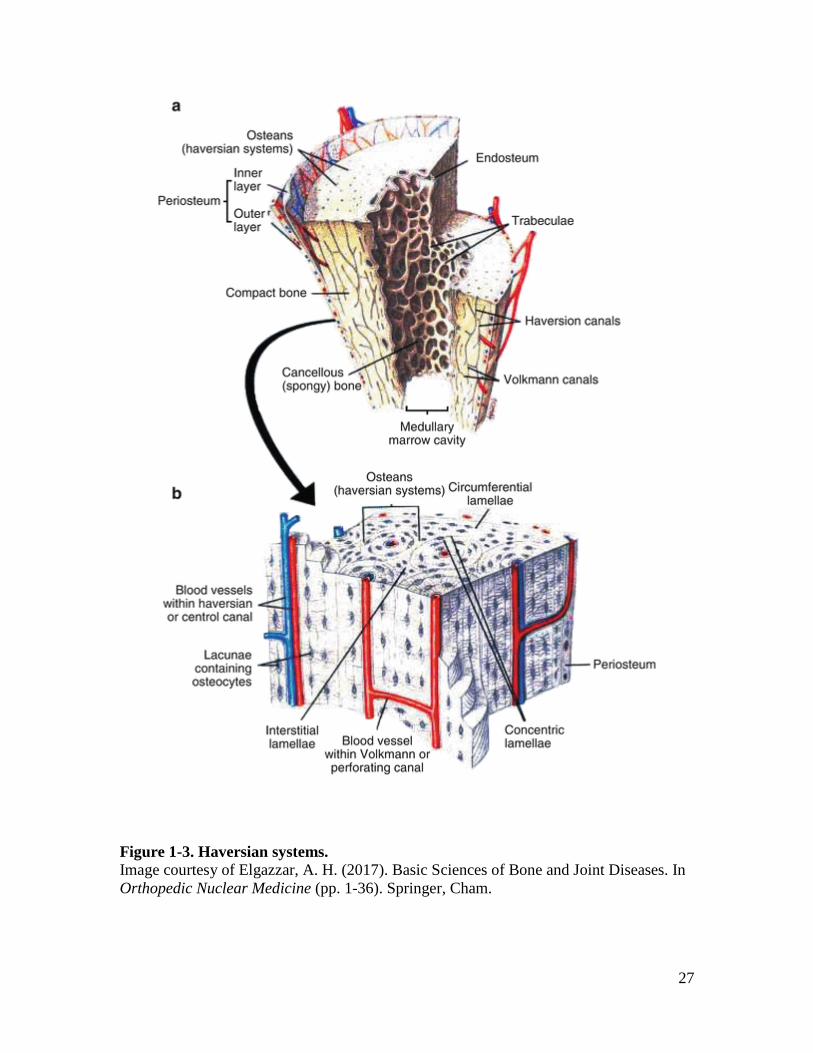
27
Figure 1-3. Haversian systems.
Image courtesy of Elgazzar, A. H. (2017). Basic Sciences of Bone and Joint Diseases. In
Orthopedic Nuclear Medicine (pp. 1-36). Springer, Cham.
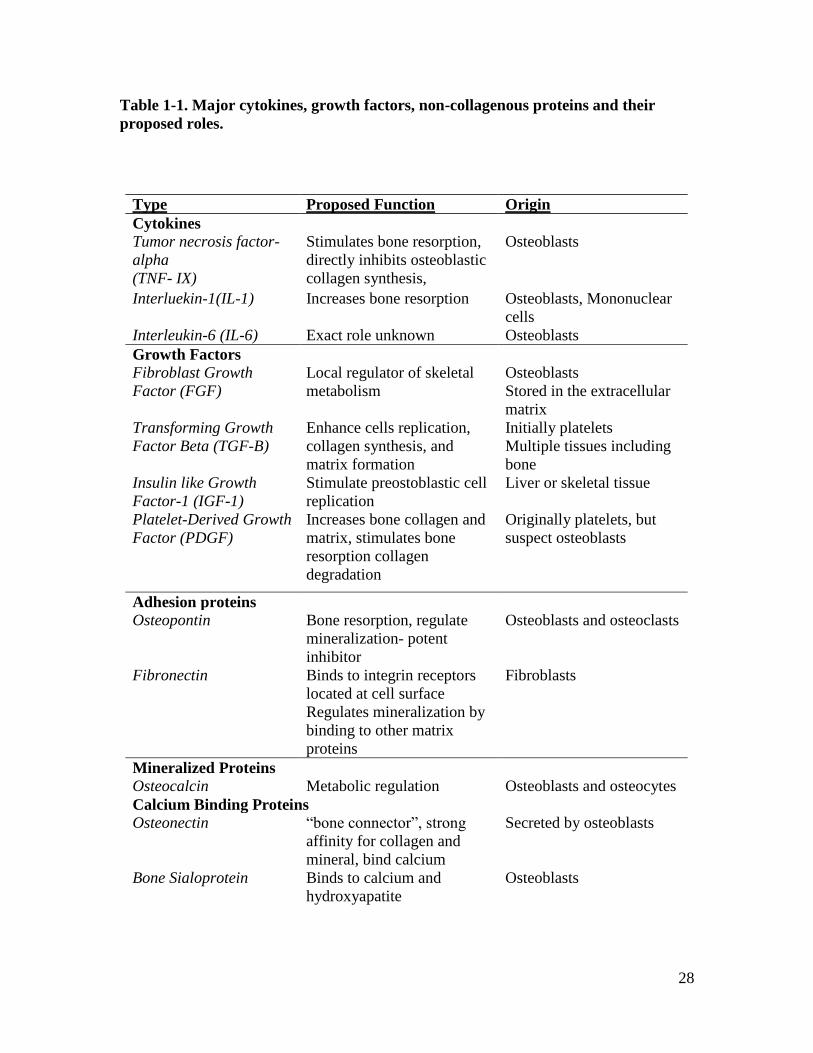
28
Table 1-1. Major cytokines, growth factors, non-collagenous proteins and their
proposed roles.
Type Proposed Function Origin
Cytokines
Tumor necrosis factor-
alpha
(TNF- IX)
Stimulates bone resorption,
directly inhibits osteoblastic
collagen synthesis,
Osteoblasts
Interluekin-1(IL-1) Increases bone resorption Osteoblasts, Mononuclear
cells
Interleukin-6 (IL-6) Exact role unknown Osteoblasts
Growth Factors Fibroblast Growth
Factor (FGF)
Local regulator of skeletal
metabolism
Osteoblasts
Stored in the extracellular
matrix
Transforming Growth
Factor Beta (TGF-B)
Enhance cells replication,
collagen synthesis, and
matrix formation
Initially platelets
Multiple tissues including
bone
Insulin like Growth
Factor-1 (IGF-1)
Stimulate preostoblastic cell
replication
Liver or skeletal tissue
Platelet-Derived Growth
Factor (PDGF)
Increases bone collagen and
matrix, stimulates bone
resorption collagen
degradation
Originally platelets, but
suspect osteoblasts
Adhesion proteins
Osteopontin Bone resorption, regulate
mineralization- potent
inhibitor
Osteoblasts and osteoclasts
Fibronectin Binds to integrin receptors
located at cell surface
Regulates mineralization by
binding to other matrix
proteins
Fibroblasts
Mineralized Proteins
Osteocalcin Metabolic regulation Osteoblasts and osteocytes
Calcium Binding Proteins
Osteonectin “bone connector”, strong
affinity for collagen and
mineral, bind calcium
Secreted by osteoblasts
Bone Sialoprotein
Binds to calcium and
hydroxyapatite
Osteoblasts

29
Figure 1-4. Commitment of a mesenchymal stem cell to an osteocyte with important
proteins.
Commitment starts with the Runx2/Wnt/B-catenin pathway. The major protein in bone is
collagen I (col I) with other non-collagenous proteins outlined in Table 1. Image
modified and courtesy of McCawley, L. J., & Matrisian, L. M. (2001). Matrix
metalloproteinases: they're not just for matrix anymore!. Current opinion in cell biology,
13(5), 534-540.

30
Figure 1-5. An accelerated overview of the four stages of bone healing
(inflammation, soft callus formation, hard callus formation, remodeling) as seen in a
mouse model of long bone fracture healing.
Image courtesy of Einhorn, T. A., & Gerstenfeld, L. C. (2015). Fracture healing:
mechanisms and interventions. Nature Reviews Rheumatology, 11(1), 45

31
CHAPTER 2. USE OF A PRESSURE-SENSING WALKWAY SYSTEM FOR BIOMETRIC
ASSESSMENT OF GOATS

32
A version of this chapter was originally published by Rebecca E. Rifkin:
Rifkin, R. E., Grzeskowiak, R. M., Mulon, P. Y., Adair, H. S., Biris, A. S., Dhar,
M., & Anderson, D. E. (2019). Use of a pressure-sensing walkway system for biometric
assessment of gait characteristics in goats. PloS one, 14(10).
This article was published by PlosOne publications in the journal PlosOne in
2019. It has been reprinted with permission from Rifkin, R.E., Grzeskowiak, R.M.,
Mulon, P.Y., Adair, H.S., Biris, A.S., Dhar, M., & Anderson. D.E. Use of a pressure-
sensing walkway system for biometric assessment of gait characteristics in goats. Plos
one, 14 (10): doi:10.1371/journal.pone.0223771. Copyright 2019 PlosOne. Biometric gait
assessment, statistical analysis, and all study design was performed at the University of
Tennessee in Knoxville. As such this chapter will address all conclusions drawn from the
data.
Abstract
The purpose of this study was to quantitatively assess gait characteristics and
weight-bearing forces during ambulation in goats free of lameness using a pressure-
sensing walkway as a biometric tool for stride, gait, and force analysis. Forty-six non-
lame adult goats ranging in age from 5 to 6 years, mixed-breeds, and with a mean body
weight of 52 ± 7.1 kgs were used. Goats were trained to walk over a pressure-sensing
walkway. Data for analysis was collected on 2 different days, 3 days apart. On each day,
2 to 5 walking passes, in the same direction, were captured for each goat. Data from 2
valid passes meeting the criteria for consistent walking gait on each day were averaged
then used for analysis. Analysis was performed, including the day-effect, for stride, gait,
and force characteristics. Of the 46 goats enrolled in the study, complete data sets were
achieved in 33 (72%) goats. Gait biometrics were similar among the assessment days;
therefore, all data was pooled for the purpose of characterizing data for individual limb
and biometric parameter comparisons at the individual goat level. Statistical analysis
revealed that no difference within the paired limbs, and that there were significant
differences between the front limbs and hind limbs. Maximum force and maximum peak
pressure were significantly greater for the front limbs as compared with the hind limbs (p
< 0.001). Based on the results, gait and force characteristics can be consistently measured
in goats using a pressure-sensing walkway during a consistent walking gait. Goats apply
greater force to the forelimbs during the weight-bearing phase of stride as compared with
the hind limbs. The use of objective assessment tools is expected to improve the ability of
researchers and clinicians to monitor changes in weight bearing and gait and will
contribute to improved animal welfare.

33
Introduction
Goats are often chosen as a model for orthopedic research [1-4]. Advantages in
the use of goats in research include ease of handling, ease of training, size, weight, and
ambulatory characteristics relevant to translational research in humans [3, 4]. More
detailed information concerning gait in goats is needed, especially when translation of
data to implants and materials for use in people are needed, as goats have suitable
metabolic and bone remodeling rates for translation to people [4]. Currently, subjective
visual assessment of gait (Visual Lameness Score; VLS) is the standard of care in
practice to assess lameness [5-12]. It is limited to use of a visual analog scoring, or
numeric rating, with the gait of each animal being assigned a score [7]. There appears to
be no validated standards for objective gait analysis in goats. Limitations associated with
subjective gait analysis are numerous and include inter-observer variability, lack of a
validated standard scoring system, and limitations associated with analysis of categorical
data [8-12]. In other livestock species, such as cattle and horses, subjective visual
assessment is shifting to objective assessment [13-16].
Objective lameness assessment currently relies on sensor technology, such as
pressure sensing systems, force plates, accelerometers, and kinematic studies with 3D
motion capture technology [16]. Devices used to monitor lameness are important tools
that need to be precise and accurate [17]. Studies have shown that certain kinetic
measurements may differ based on the device that is implemented, or even the method by
which it is calibrated [18]. Weight bearing provides an important tool for assessing the
functional use of the limbs. Most studies using objective gait assessment are aimed at
gaining information related to lameness [14]. Lameness assessment research often is
focused on the detection of severely lame animals, with less precision given to mild
lameness [14]. Even minor dairy species, such as Mediterranean buffalo, are beginning to
be looked at objectively for lameness, but problems arise with sensors that short, as
continuous strides may be missed with a limited algorithm [19].
Difficulties associated with objective lameness technology become particularly
relevant in orthopedic research, when new material or devices may rely on lameness
assessment as an outcome parameter in terms of animal welfare [3, 4]. Many studies rely
on subjective lameness scoring systems, only mention monitoring lameness post-
operatively, and/or rarely report findings of lameness in study conclusions [20-22]. While
several studies exist describing objective lameness outcomes in relation to orthopedic
research, few are done from a basis of described normal variables available for that
specific species [23, 24].
Advantages to pressure-sensing systems with walkways are that they are time
efficient, can evaluate multiple sequential steps, and have the ability to evaluate the
contralateral limbs within the same walking pass and in the same trial [18]. Although
originally used in biped gait analysis, pressure-sensing mats have been used to study gait
in multiple species, such as horses, cattle, turkeys, sheep, pigs, dogs, and cats [17, 18, 23-
30]. However, few studies validate these measurements or describe normal biometric
variables [17, 31]. In one study, normal intact Santa Ines sheep were evaluated using a
pressure-sensitive walkway and a 3-camera kinematic system, which allowed for normal
parameters to be described for varying age groups [31]. Literature describing pressure
sensitive platforms for use in the biometric assessment of lameness has been described,
but is lacking for goats initially free of lameness [32, 34]. Sheep and goats are important

34
models for orthopedic research and share many similarities [4]. Some aspects of gait
analysis in sheep require more comprehensive assessment tools because of their flight
zone and flocking behavior. These limitations can be addressed with training [4].
The purpose of this study was to quantitatively assess biometric variables of gait
and associated forces during ambulation in goats free of lameness. We hypothesized that
goats could be trained to walk across a pressure-sensing walkway to allow consistent
recording of data for variables of stride, gait, and force. The objectives were to describe
the characteristics associated with stride and weight-bearing force in goats free of
lameness, thereby providing a baseline for future studies using a pressure-sensing mat
investigating lameness. This information will not only benefit the veterinary community
in providing a baseline for goats free of lameness, which may be applied to herd health
lameness monitoring programs, but will provide a valuable set of gait parameters for
goats as a reference in the design and conduction of orthopedic research where lameness
is induced or is a concern.
Materials and Methods
Goats
All study procedures were approved by the University of Tennessee Animal Care
and Use Committee (protocol number 2383). Forty-six mixed breed goats between five
and six years old and weighing 52 ± 7.1 kgs (range 40-69 kgs) were purchased from a
licensed, commercial vendor. Goats were a mixed breed population, including Boer,
Spanish, Nubian, Saanen, Oberhasli, and hybrid goats. Goats were judged to be free of
lameness based on a visual lameness score of 0 (normal movement) out of 4 [2]. Hooves
and feet were inspected, and hooves were trimmed to ensure all goats had normal and
consistent conditioned feet. Goats were housed in groups of five to six in small pens (15
ft2 per animal) (National Research Council. Guide for the care and use of laboratory
animals; National Academies Press, 2010). Flooring included a layer of wood shavings
(2.5 to 5-cm thick) laid on top of rubber mats placed on top of a concrete floor in a
conditioned housing facility for the duration of the study. They were fed a total mixed
ration, provided access to hay as an environmental enrichment, and given access to
automatic waterers to meet nutritional and metabolic requirements. Goats were weighed
at study entry and exit to monitor nutrition and health.
Data Collection
After confirming that all goats entering the study were free of lameness (VLS
score of 0), gait parameters were objectively assessed by evaluating measurements
obtained from an automated, real-time pressure sensing system (Walkway Pressure
Mapping System, Tekscan Inc, South Boston, MA). The sensor matrix was 87.1 cm long
by 36.9 cm wide and had a sensor density of 1.4 sensors/cm2. The mat was calibrated and
equilibrated according to the manufacturer’s instructions. Triggering was enabled so that
recordings would start at the first contact, or a raw sum force of 200 kPa, and end at total
of 400 recorded frames at a rate of 15 frames per second. An alleyway was assembled in
order to create a fixed walkway for the goats. The pressure mat was placed in the
midpoint of the alleyway and covered with a soft, rubber overlay to create a consistent

35
visual and tactile flooring with good footing for the testing area (Fig 2-1).2 The width of
the alleyway was made such that goats could move freely in a straight line, would be
discouraged from turning around, and that each goat’s footfalls would strike the sensitive
area of the mat. Prior to initiation of the trial, goats were individually weighed using a
digital scale. Goats were then fitted with a halter and led at a walking pace across the
pressure-sensing mat, with an investigator sitting to the right of the mat adjacent to the
constructed alleyway. The halter and lead were useful to encourage goats to pass through
the walkway without stopping. During the study, no tension or pressure was applied to
the halter to ensure that no changes in head movement or gait occurred.
Biometric assessment of gait was collected from the 2 best-fit recording in one
direction, on each of 2 separate days (day 0 and 3). Each goat was walked across the mat
up to 5 times (5 passes) until at least 2 valid walking passes were obtained. A pass was
considered valid if the goat maintained a progressive walking gait, had a VLS of 0 during
the pass, walked calmly through the alleyway without stopping or resisting walking
forward, walked over the walkway without distraction, and if all four limbs had contact
with the pressure sensing surface of the walkway. The data from the first two valid passes
on each day were recorded and averaged for each goat, allowing for one set of data to be
analyzed for each day.
Data was discarded during the data acquisition phase of the study if any goat
hesitated, changed their gait or pace, or reacted to surroundings in a way that altered their
gait. Acceptable behavior was limited to a subjectively assessed lameness score of 0, and
walking in a forward manner without distraction from the investigator or hesitation from
the halter and lead. Each pass was recorded with a digital video camera to record
extremity strike and gait as the goat walked over the pressure sensor mat, and data from
the mat sensor were transmitted to the system’s computer software (Microsoft LifeCam
Cinema, Microsoft Corporation, Redmond, WA). The frame rate of the video camera was
adjusted to 15 frames per second to match the pressure-sensing mat. Once data was
transmitted to the software it was then exported to Microsoft Excel, backed up, and stored
within an external hard-drive (Microsoft Excel for Windows 10, Seagate Portable 1TB
External Hard Drive USB 3.0, USA). Due to significant range in the mixed breeds of the
goats (Boer, Spanish, Nubian, Saanen, Oberhasli, and true mixes) and various limb
lengths, it was necessary to average two valid passes to obtain consecutive footfalls,
allowing for a complete data set for one valid run per day. Data sets were included in
statistical analysis if they were complete for all variables.
Gait Variables
Gait variables included the number of stance (or footfalls), gait time-front (sec),
gait distance-front (cm), gait velocity-front (cm/sec), and cycles per minute. Stance and
stride variables measured included stance time (sec), swing time (sec), stride time (sec),
stride length (cm), stride velocity (cm/sec; Table 2-1). With goats that had long swing
times, stride times, and/or stride lengths, multiple passes were required to obtain one
2 All figures and tables for this chapter are presented in the appendix.

36
valid run; therefore, the first two valid passes that allowed a complete data set were used
in the analysis.
Force Variables
Measurements of force variables included maximum force (Kg), maximum force
normalized to body weight (%BW), impulse (Kg*sec), impulse normalized to body
weight (%BW*sec), and maximum peak pressure (KPa). Maximum force (Kg) was the
maximum force recorded during the stance phase of each extremity. Maximum force
(%BW) was defined during the stance phase of the given extremity (normalized to the
animal’s body weight). When there were multiple stances within the same pass, the
maximum force values for that extremity were averaged. Impulse (Kg*sec) was the
average of all foot strikes for the given extremity. Impulse (%BW*sec) was the average
impulse of all foot strikes for a given extremity and normalized to body weight. Finally,
maximum peak pressure (kPa) was defined as the peak force per unit area for a given
extremity. To our knowledge, this device has not been validated for mixed breed goats
with a significant range of weights; we present descriptive data for this population.
Statistical Analysis
Descriptive statistics for each parameter were generated, including the mean,
standard deviation, and minimum and maximum values (IBM SPSS 25, Armonk, NY).
Each gait parameter was analyzed with a Shapiro Wilk test to evaluate for normality of
distribution (p-value > 0.05). An appropriate parametric student t-test or nonparametric
Wilcoxon rank sum was performed for each variable between days to evaluate for
repeatability between days. A one-way ANOVA followed by Tukey’s post-hoc test was
performed to compare gait parameters between limbs. For variables that were not
normally distributed, a one-way Kruskal-Wallis test followed by a pairwise comparison
between limbs with a Dunn-Bonferroni correction to compare gait parameters was
performed. A sample size estimate to detect the effect of time and extremity with 80%
power was performed. For all statistical tests, a p-value of < 0.05 was considered
significant.
Results
Out of 46 goats, 33 (72%) met the inclusion criterion for analysis. Goats readily
walked through the alleyway and across the pressure-sensing mat system without
difficulty. Thirteen goats were removed from statistical analysis because of having
incomplete data sets (lack of 2 valid passes within a maximum of 5 attempts). Due to the
range in stance time (sec), swing time (sec), stride time (sec), and stride length (cm), it
was necessary to average two valid passes to obtain consecutive footfalls for a complete
data set for each test day. After the repeatability assessment, data was then pooled.
Pooled data for stance-stride variables were tabulated (Tables 2-2 and 2-3). Descriptive
statistics for gait variables are reported as the means ± standard deviation and range
(minimum, maximum) for 33 goats having complete datasets. The mean number of
stances was 9.03±1.81 (6.00, 14.00). The gait-time front (sec) was 1.73±0.72 (0.51, 4.10),
the gait distance-front (cm) was 132.38±13.92 (96.90, 153.00), and the gait velocity-front
(cm/sec) was 92.64±36.30 (34.40, 279.60). The mean gait cycle time (sec) for 33 goats

37
was 1.00±0.25 (0.44, 2.00), while the mean cycles/minute was 64.67±15.62 (30.00,
139.00).
Data that were normally distributed included maximum force (%BW), maximum
force (Kg), stride length (cm), and maximum peak force (KPa; p > 0.05). Of those
parameters, maximum force (%BW), maximum force (Kg), and maximum peak force
(KPa) were significantly different among the limbs (p < 0.001).There was no significant
difference in stride length (cm) among the limbs (p > 0.05). As the gait parameters
maximum force (%BW), maximum force (Kg), and maximum peak force (KPa) may be
most associated with future orthopedic or animal welfare studies, they were selected for
the sample size estimate analysis to detect the effect of time and extremity. Based on
these variables, only 12 animals were needed to detect the effect of time and extremity.
When evaluating day 1 versus day 3, there were no significant differences for the
variables maximum force (%BW), maximum force (Kg), impulse (%BW *sec), impulse
(Kg*sec), or maximum peak pressure (KPa; p > 0.05) for any of the extremities. There
was a day-effect for the variables stance time, stride time, stride length, and stride
velocity. For the variable stance time (sec), there was a significant decrease in time for
the majority of goats (n = 21, left front; n = 23, right front; n = 23, right hind) on day 3 as
compared to day 1 (p < 0.05). For the variable stride time (sec), there was a significant
decrease in time for the majority of goats (n = 19) on day 3 as compared to day 1 for the
right hind limb (p < 0.05). For the variable stride length (cm) there was a significant
difference for the left front and right front means with the left front being greater on day
3 versus day 1 and the right front mean being greater on day 3 versus day 1 (Table 2-3; p
< 0.05). For the variable stride velocity (cm/sec) there was a significant difference for all
extremities on day 1 versus day 3, with the means for the left front being greater on day
3, the means for the left hind being greater on day 3, the right front means being greater
on day 3, and the right hind means being greater on day 3 (p < 0.05; Table 2-4). The
mean stride length (cm) was greater on day 3 as compared with day 1 for the left front
limb and right front limb (p < 0.05). The left hind and right hind limb means are reported
with * as they were not significantly different between days. The mean stride velocity
(cm/sec) was greater on day 3 as compared to day 1 for all extremities (p < 0.05).
Within paired limbs, there were no significant differences between the means of
the left front and right front limbs, nor the left hind and right hind limbs, respectively (p >
0.05). Significant differences were found for maximum force (Kg) between the limbs.
There was a significant difference between the left front and hind limbs with the left front
mean being greater than the left hind and right hind limb (p < 0.001). There was a
significant difference between the right front limb and the hind limbs with the right front
limb being greater than the left hind and right hind limb (p < 0.001; Fig 2-2B).
Significant differences were found for maximum force (normalized to %BW; p < 0.001)
between the limbs. There was a significant difference between the left front and left hind
and the hind limbs with the left front mean being greater than the left hind and right hind
limb (p < 0.001). There was a significant difference between the right front and the hind
limbs’ weight, the right front mean being greater than the left hind and right hind limb (p
< 0.001; Fig 2-2A). A significant difference was found between the limbs for maximum
peak pressure (kPa). The left front limb was significantly greater than the left hind and
right hind limb (p<0.001). The right front limb was greater than the left hind and right
hind limb (p < 0.001; Fig 2-2C).
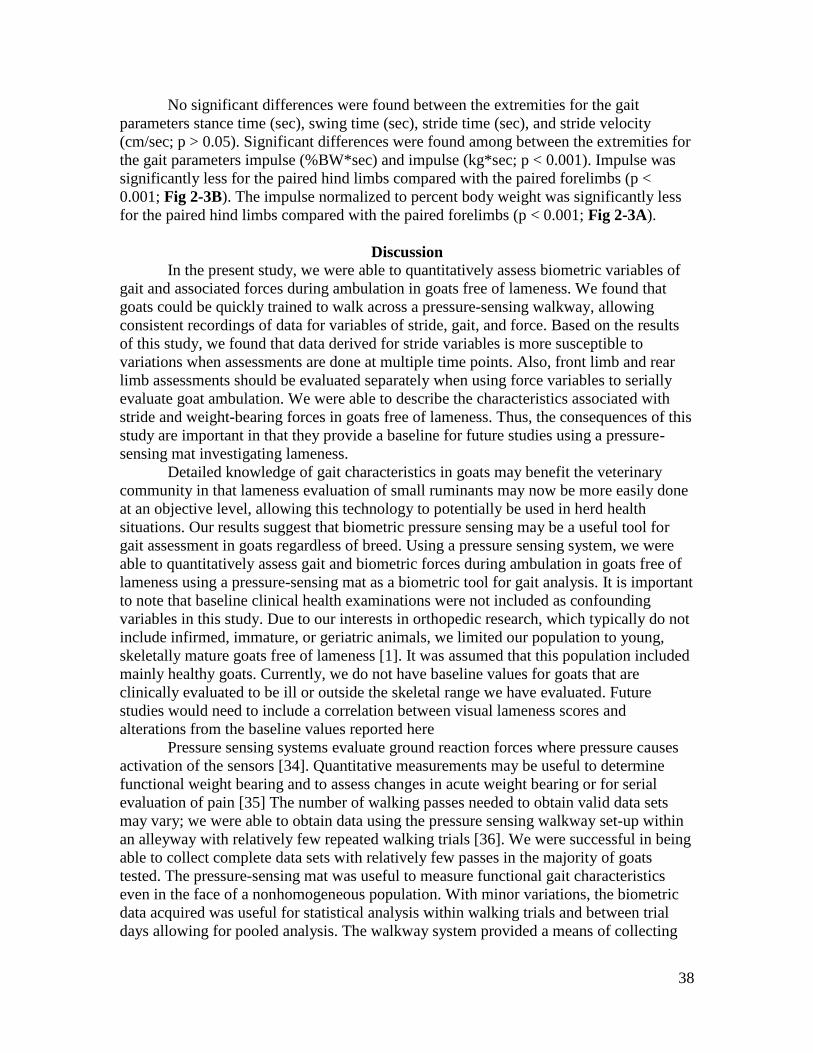
38
No significant differences were found between the extremities for the gait
parameters stance time (sec), swing time (sec), stride time (sec), and stride velocity
(cm/sec; p > 0.05). Significant differences were found among between the extremities for
the gait parameters impulse (%BW*sec) and impulse (kg*sec; p < 0.001). Impulse was
significantly less for the paired hind limbs compared with the paired forelimbs (p <
0.001; Fig 2-3B). The impulse normalized to percent body weight was significantly less
for the paired hind limbs compared with the paired forelimbs (p < 0.001; Fig 2-3A).
Discussion
In the present study, we were able to quantitatively assess biometric variables of
gait and associated forces during ambulation in goats free of lameness. We found that
goats could be quickly trained to walk across a pressure-sensing walkway, allowing
consistent recordings of data for variables of stride, gait, and force. Based on the results
of this study, we found that data derived for stride variables is more susceptible to
variations when assessments are done at multiple time points. Also, front limb and rear
limb assessments should be evaluated separately when using force variables to serially
evaluate goat ambulation. We were able to describe the characteristics associated with
stride and weight-bearing forces in goats free of lameness. Thus, the consequences of this
study are important in that they provide a baseline for future studies using a pressure-
sensing mat investigating lameness.
Detailed knowledge of gait characteristics in goats may benefit the veterinary
community in that lameness evaluation of small ruminants may now be more easily done
at an objective level, allowing this technology to potentially be used in herd health
situations. Our results suggest that biometric pressure sensing may be a useful tool for
gait assessment in goats regardless of breed. Using a pressure sensing system, we were
able to quantitatively assess gait and biometric forces during ambulation in goats free of
lameness using a pressure-sensing mat as a biometric tool for gait analysis. It is important
to note that baseline clinical health examinations were not included as confounding
variables in this study. Due to our interests in orthopedic research, which typically do not
include infirmed, immature, or geriatric animals, we limited our population to young,
skeletally mature goats free of lameness [1]. It was assumed that this population included
mainly healthy goats. Currently, we do not have baseline values for goats that are
clinically evaluated to be ill or outside the skeletal range we have evaluated. Future
studies would need to include a correlation between visual lameness scores and
alterations from the baseline values reported here
Pressure sensing systems evaluate ground reaction forces where pressure causes
activation of the sensors [34]. Quantitative measurements may be useful to determine
functional weight bearing and to assess changes in acute weight bearing or for serial
evaluation of pain [35] The number of walking passes needed to obtain valid data sets
may vary; we were able to obtain data using the pressure sensing walkway set-up within
an alleyway with relatively few repeated walking trials [36]. We were successful in being
able to collect complete data sets with relatively few passes in the majority of goats
tested. The pressure-sensing mat was useful to measure functional gait characteristics
even in the face of a nonhomogeneous population. With minor variations, the biometric
data acquired was useful for statistical analysis within walking trials and between trial
days allowing for pooled analysis. The walkway system provided a means of collecting
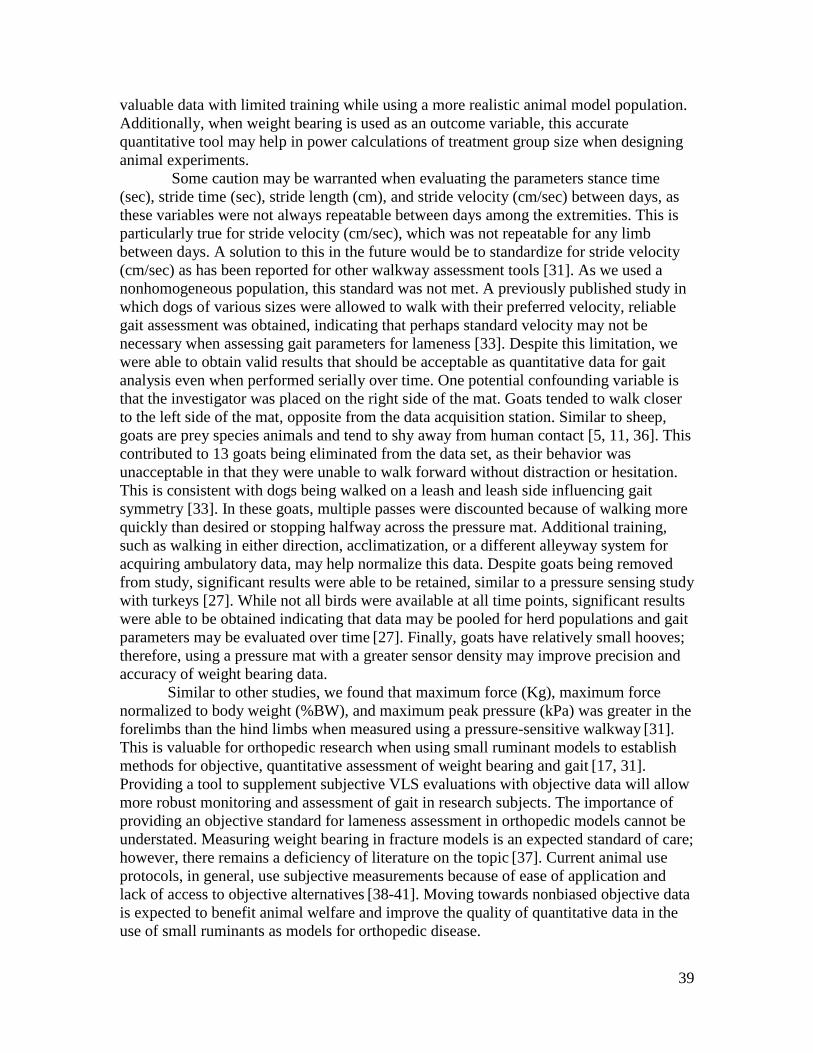
39
valuable data with limited training while using a more realistic animal model population.
Additionally, when weight bearing is used as an outcome variable, this accurate
quantitative tool may help in power calculations of treatment group size when designing
animal experiments.
Some caution may be warranted when evaluating the parameters stance time
(sec), stride time (sec), stride length (cm), and stride velocity (cm/sec) between days, as
these variables were not always repeatable between days among the extremities. This is
particularly true for stride velocity (cm/sec), which was not repeatable for any limb
between days. A solution to this in the future would be to standardize for stride velocity
(cm/sec) as has been reported for other walkway assessment tools [31]. As we used a
nonhomogeneous population, this standard was not met. A previously published study in
which dogs of various sizes were allowed to walk with their preferred velocity, reliable
gait assessment was obtained, indicating that perhaps standard velocity may not be
necessary when assessing gait parameters for lameness [33]. Despite this limitation, we
were able to obtain valid results that should be acceptable as quantitative data for gait
analysis even when performed serially over time. One potential confounding variable is
that the investigator was placed on the right side of the mat. Goats tended to walk closer
to the left side of the mat, opposite from the data acquisition station. Similar to sheep,
goats are prey species animals and tend to shy away from human contact [5, 11, 36]. This
contributed to 13 goats being eliminated from the data set, as their behavior was
unacceptable in that they were unable to walk forward without distraction or hesitation.
This is consistent with dogs being walked on a leash and leash side influencing gait
symmetry [33]. In these goats, multiple passes were discounted because of walking more
quickly than desired or stopping halfway across the pressure mat. Additional training,
such as walking in either direction, acclimatization, or a different alleyway system for
acquiring ambulatory data, may help normalize this data. Despite goats being removed
from study, significant results were able to be retained, similar to a pressure sensing study
with turkeys [27]. While not all birds were available at all time points, significant results
were able to be obtained indicating that data may be pooled for herd populations and gait
parameters may be evaluated over time [27]. Finally, goats have relatively small hooves;
therefore, using a pressure mat with a greater sensor density may improve precision and
accuracy of weight bearing data.
Similar to other studies, we found that maximum force (Kg), maximum force
normalized to body weight (%BW), and maximum peak pressure (kPa) was greater in the
forelimbs than the hind limbs when measured using a pressure-sensitive walkway [31].
This is valuable for orthopedic research when using small ruminant models to establish
methods for objective, quantitative assessment of weight bearing and gait [17, 31].
Providing a tool to supplement subjective VLS evaluations with objective data will allow
more robust monitoring and assessment of gait in research subjects. The importance of
providing an objective standard for lameness assessment in orthopedic models cannot be
understated. Measuring weight bearing in fracture models is an expected standard of care;
however, there remains a deficiency of literature on the topic [37]. Current animal use
protocols, in general, use subjective measurements because of ease of application and
lack of access to objective alternatives [38-41]. Moving towards nonbiased objective data
is expected to benefit animal welfare and improve the quality of quantitative data in the
use of small ruminants as models for orthopedic disease.

40
No validated visual or objective lameness assessment system exists for goats.
Categorical assessment tools are subject to bias interpretation and must be analyzed using
statistical tests for categorical data, making them less sensitive at identifying differences
[5-12]. Difficulties with subjective data include inter-observer differences, limitations of
categorical data, and lack of a standard scoring system for the species. Inter-observer
differences have long been noted in lameness research in horses [41]. Objective
assessment tools offer the possibility of validating subjective tools for use in research,
which is currently limiting [41]. Analysis of categorical data, such as VLS scores, are
challenging even after transformation to proportional (categorical) data and can yield
spurious results [41]. Categorical data, therefore, requires different methods for analysis
that may be less sensitive than objective, continuous data obtained with tools, such as
pressure mat sensing systems [42]. Variability in subjective scoring systems, comparing
lameness scores across any type of research model of lameness, becomes inherently
problematic at a time where there is a call for large animal models to become more
standardized [43, 44]. Other alternatives include the use of accelerometers to measure
activity and define 3D gait characteristics, such as height of excursion of the limb/foot.
These technologies are less adaptable to real-time analysis and assessment [37].
In the present study, we quantitatively assessed gait and biometric forces during
ambulation in goats subjectively free of lameness using a pressure-sensing mat as a
biometric tool for gait analysis. The pressure-sensing mat is an objective tool, free of
inter-observer differences, and easy-to use. In an era where scientific procedures
involving the use of animals is at an all-time low, the importance of providing stress free,
accurate results when doing potentially painful procedures cannot be overstated [45]

41
References

42
1. Harvey EJ, Giannoudis PV, Martineau PA, Lansdowne JL, Dimitriou R, Moriarty
TF, et al. Preclinical animal models in trauma research. J Orthop Trauma.
2011;25(8):488-493. doi: 10.1097/BOT.0b013e3182251421.
2. Reichert JC, Saifzadeh S, Wullschleger ME, Epari DR, Schütz MA, Duda GN, et
al. The challenge of establishing preclinical models for segmental bone defect
research. Biomaterials. 2009;30(12):2149-2163. doi:
10.1016/j.biomaterials.2008.12.050.
3. Pearce AI, Richards RG, Milz S, Schneider E, Pearce SG. Animal models for
implant biomaterial research in bone: a review. Eur Cell Mater. 2007;13(1):1-10.
4. Fulton LK, Clarke MS, Farris Jr HE. The goat as a model for biomedical research
and teaching. Ilar J. 1994;1;36(2):21-29.
5. Muri K, Stubsjøen SM, Valle PS. Development and testing of an on-farm welfare
assessment protocol for dairy goats. Anim Welfare. 2013;22(3):385-400.
6. Browning Jr R, Leite-Browning ML, Byars Jr M. Reproductive and health traits
among Boer, Kiko, and Spanish meat goat does under humid, subtropical pasture
conditions of the southeastern United States. J Anim Sci. 2011;89(3):648-660.
doi: 10.2527/jas.2010-2930.
7. Deeming LE, Beausoleil NJ, Stafford KJ, Webster JR, Zobel G. The development
of a reliable 5-point gait scoring system for use in dairy goats. J Dairy Sci.
2018;101(5):4491-4497. doi: 10.3168/jds.2017-13950.
8. Gigliuto C, De Gregori M, Malafoglia V, Raffaeli W, Compagnone C, Visai L, et
al. Pain assessment in animal models: do we need further studies?. J Pain Res.
2014;7:227-236. doi: 10.2147/JPR.S59161.
9. Hill NP, Murphy PE, Nelson AJ, Mouttotou N, Green LE, Morgan KL. Lameness
and foot lesions in adult British dairy goats. Vet Rec. 1997;141(16):412-416.
10. Olechnowicz J, Jaśkowski JM. Lameness in small ruminants. Med Weter.
2011;67(11):715-719.
11. Vieira A, Oliveira MD, Nunes T, Stilwell G. Making the case for developing
alternative lameness scoring systems for dairy goats. Appl Anim Behav Sci.
2015;171:94-100.
12. Anzuino K, Bell NJ, Bazeley KJ, Nicol CJ. Assessment of welfare on 24
commercial UK dairy goat farms based on direct observations. Vet Rec.
2010;167(20):774-780. doi: 10.1136/vr.c5892.
13. Flower FC, Sanderson DJ, Weary DM. Hoof pathologies influence kinematic
measures of dairy cow gait. J Dairy Sci. 2005;88(9):3166-3173. doi:
10.3168/jds.S0022-0302(05)73000-9.
14. Flower FC, Weary DM. Gait assessment in dairy cattle. Animal. 2009;3(1):87-95.
15. Keegan KG, Kramer J, Yonezawa Y, Maki H, Pai PF, Dent EV, et al. Assessment
of repeatability of a wireless, inertial sensor–based lameness evaluation system
for horses. Am J Vet Res. 2011;72(9):1156-1163. doi: 10.2460/ajvr.72.9.1156.

43
16. Van Nuffel A, Zwertvaegher I, Van Weyenberg S, Pastell M, Thorup V, Bahr C,
et al. Lameness Detection in Dairy Cows: Part 2. Use of Sensors to Automatically
Register Changes in Locomotion or Behavior. Animals. 2015;5(3):861-885. doi:
10.3390/ani5030388.
17. Kim J, Breur GJ. Temporospatial and kinetic characteristics of sheep walking on a
pressure sensing walkway. Can J Vet Res. 2008;72(1):50-55.
18. Oosterlinck M, Pille F, Sonneveld DC, Oomen AM, Gasthuys F, Back W.
Contribution of dynamic calibration to the measurement accuracy of a pressure
plate system throughout the stance phase in sound horses. Vet J. 2012;193(2):471-
474. doi: 10.1016/j.tvjl.2012.01.029.
19. D'Andrea L, Guccione J, Alsaaod M, Deiss R, Di Loria A, Steiner A, et al.
Validation of a pedometer algorithm as a tool for evaluation of locomotor
behaviour in dairy Mediterranean buffalo. J Dairy Res. 2017;84(4):391-394. doi:
10.1017/S0022029917000668.
20. Black LL, Gaynor J, Gahring D, Adams C, Aron D, Harman S, et al. Effect of
adipose-derived mesenchymal stem and regenerative cells on lameness in dogs
with chronic osteoarthritis of the coxofemoral joints: a randomized, double-
blinded, multicenter controlled trial. Vet Ther. 2007;8(4):272-284.
21. Hill RJ, Mason HM, Yeip G, Merchant SS, Olsen AL, Stott RD, et al. The
Influence of Oblique Angle Forced Exercise in Surgically Destabilized Stifle
Joints Is Synergistic with Bone, but Antagonistic with Cartilage in an Ovine
Model of Osteoarthritis. Arthritis. 2017;2017:7481619. doi:
10.1155/2017/7481619.
22. Easley J, Puttlitz CM, Seim 3rd H, Ramo N, Abjornson C, Cammisa Jr FP, et al.
Biomechanical and histologic assessment of a novel screw retention technology in
an ovine lumbar fusion model. Spine J. 2018;18(12):2302-2315. doi:
10.1016/j.spinee.2018.07.021.
23. Meijer E, Bertholle CP, Oosterlinck M, van der Staay FJ, Back W, van Nes A.
Pressure mat analysis of the longitudinal development of pig locomotion in
growing pigs after weaning. BMC Vet Res. 2014;10(1):37. doi: 10.1186/1746-
6148-10-37.
24. Meijer E, Oosterlinck M, van Nes A, Back W, van der Staay FJ. Pressure mat
analysis of naturally occurring lameness in young pigs after weaning. BMC Vet
Res. 2014 Dec;10(1):193. doi: 10.1186/s12917-014-0193-8.
25. Zammit GV, Menz HB, Munteanu SE. Reliability of the TekScan MatScan®
system for the measurement of plantar forces and pressures during barefoot level
walking in healthy adults. J Foot Ankle Res. 2010;3(1):11. doi: 10.1186/1757-
1146-3-11.
26. Wheeler CA, White BJ, Anderson DE, Amrine DE, Larson RL. Assessment of
biometric tools for quantitative gait analysis in Holstein calves. Am J Vet Res.
2013;74(11):1443-1449. doi: 10.2460/ajvr.74.11.1443.

44
27. Kremer JA, Robison CI, Karcher DM. Growth Dependent Changes in Pressure
Sensing Walkway Data for Turkeys. Front Vet Sci. 2018;5:241. doi:
10.3389/fvets.2018.00241.
28. Kim J, Kazmierczak KA, Breur GJ. Comparison of temporospatial and kinetic
variables of walking in small and large dogs on a pressure-sensing walkway. Am
J Vet Res. 2011;72(9):1171-1177. doi: 10.2460/ajvr.72.9.1171.
29. Light VA, Steiss JE, Montgomery RD, Rumph PF, Wright JC. Temporal-spatial
gait analysis by use of a portable walkway system in healthy Labrador Retrievers
at a walk. Am J Vet Res. 2010;71(9):997-1002. doi: 10.2460/ajvr.71.9.997.
30. Verdugo MR, Rahal SC, Agostinho FS, Govoni VM, Mamprim MJ, Monteiro
FO. Kinetic and temporospatial parameters in male and female cats walking over
a pressure sensing walkway. BMC Vet Res. 2013;9(1):129. doi: 10.1186/1746-
6148-9-129.
31. Agostinho FS, Rahal SC, Araújo FA, Conceição RT, Hussni CA, El-Warrak AO,
et al. Gait analysis in clinically healthy sheep from three different age groups
using a pressure-sensitive walkway. BMC Vet Res. 2012;8(1):87. doi:
10.1186/1746-6148-8-87.
32. Lequang T, Maitre P, Roger T, Viguier E. Is a pressure walkway system able to
highlight a lameness in dog?. In6th World Congress of Biomechanics (WCB
2010). August 1-6, 2010 Singapore 2010 (pp. 190-193). Springer, Berlin,
Heidelberg.
33. Fahie M, Cortez J, Ledesma M, Su Y. Pressure mat analysis of walk and trot gait
characteristics in 66 normal small, medium, large and giant breed dogs. Front Vet
Sci. 2018;5:256. doi: 10.3389/fvets.2018.00256.
34. Whittle MS. Gait analysis: an introduction. Edinburgh: Elsevier; 2007. pp. 47-
193.
35. Martini L, Lorenzini RN, Cinotti S, Fini M, Giavaresi G, Giardino R. Evaluation
of pain and stress levels of animals used in experimental research. J Surg Res.
2000;88(2):114-119. doi: 10.1006/jsre.1999.5789.
36. Agostinho FS, Rahal SC, Geraldo B, Justolin PL, Teixeira CR, Lins FL, et al.
Influence of calibration protocols for a pressure-sensing walkway on kinetic and
temporospatial parameters. Vet Comp Orthop Traumatol. 2015;28(1):25-29. doi:
10.3415/VCOT-14-05-0081.
37. Aranzulla PJ, Muckle DS, Cunningham JL. A portable monitoring system for
measuring weight-bearing during tibial fracture healing. Med Eng Phys.
1998;20(7):543-548.
38. Fitzpatrick J, Scott M, Nolan A. Assessment of pain and welfare in sheep. Small
Ruminant Res. 2006;62:55-61. doi: 10.1016/j.smallrumres.2005.07.028.
39. Stasiak KL, Maul DO, French E, Hellyer PW, Vandewoude S. Species-specific
assessment of pain in laboratory animals. Contemp Top Lab Anim Sci.
2003;42(4):13-20.

45
40. Martini L, Fini M, Giavaresi G, Giardino R. Sheep model in orthopedic research:
a literature review. Compar Med. 2001;51(4):292-299.
41. Keegan KG, Dent EV, Wilson DA, Janicek J, Kramer J, Lacarrubba A, et al.
Repeatability of subjective evaluation of lameness in horses. Equine Vet J.
2010;42(2):92-97. doi: 10.2746/042516409X479568.
42. Barendregt JJ, Veerman JL. Categorical versus continuous risk factors and the
calculation of potential impact fractions. J Epidemiol Community Health.
2010;64(3):209-212. doi: 10.1136/jech.2009.090274.
43. Jaeger TF. Categorical data analysis: Away from ANOVAs (transformation or
not) and towards logit mixed models. J Mem Lang. 2008;59(4):434-446. doi:
10.1016/j.jml.2007.11.007.
44. Sah RL, Ratcliffe A. Translational models for musculoskeletal tissue engineering
and regenerative medicine. Tissue Eng Part B Rev. 2010;16(1):1-3. doi:
10.1089/ten.TEB.2009.0726.
45. Annual Statistics of Scientific Procedures on Living Animals Great Britain 2017:
Presented to Parliament pursuant to section 21(7) and 21A(1) of the Animals
(Scientific Procedures) Act 1986. National Statistics. 2018. Available from:
https://assets.publishing.service.gov.uk/government/uploads/system/uploads/attac
hment_data/file/724611/annual-statistics-scientific-procedures-living-animals-
2017.pdf

46
Appendices

47
Figure 2-1. Examples of halter-lead training and sample gait analysis.
(A) Pressure-sensing walkway placed in an alleyway system with soft mats and loose
halter and lead for training. (B) Example of gait analysis with goat walking across
pressure- sensing matrix placed in the alleyway system in the lower left-hand corner. The
video recording with strike boxes is present in the upper left-hand corner, the stride stable
is visible on the right, and the gait table is visible in the lower middle.

48
Table 2-1. Working definitions used for gait variables.
Gait Variable Definition
Number of stances The total number of stances (footfalls) taken by the animal.
Gait time-front (sec) The time of first contact of the given front extremity stance
to the time of first contact of the last given extremity stance
as registered on the sensor.
Gait distance-front (cm),
or length unit,
The gait distance measured along the line of progression,
from posterior of the given front extremity stance to
posterior of the last given extremity front stance.
Gait velocity-front
(cm/sec)
The gait distance divided by the gait time.
Gait cycle time (sec) Began with the first contact time of the given front
extremity fall to be valid on the sensor. Time was
measured to the first contact of the next instance of that
given extremity striking the sensor.
Cycles per minute The number of complete gait cycles per minute, or gait
cycle time divided by sixty.
Stand-Stride Variable Definition
Stance Time (sec) The weight-bearing period, was defined as the time from
first contact to last contact of a given extremity in seconds.
Swing Time (sec), The non-weight bearing period, was defined as the elapsed
time between the last contact of a preceding and the first
contact of the next of two consecutive footfalls of a given
extremity. When there were no consecutive footfalls, no
data was recorded.
Stride Time (sec) The elapsed time between the first contacts of two
consecutive footfalls of a given extremity. If there were no
consecutive footfalls, no data was recorded. If there were
multiple strides within the same pass, times were averaged.
Stride Length (cm) The distance measured parallel to the line of progression
between the posterior heel points of two consecutive
footfalls of a given extremity. When there were multiple
strides, the lengths were averaged.
Stride Velocity (cm/sec) The stride length divided by the stride time for the given
extremity. When there were multiple strides, the velocities
were averaged.

49
Table 2-2. Descriptive statistics for the stance gait parameters.
Results are displayed as mean ± standard deviation (SD) followed by a range (minimum, maximum).
Extremity
(N=33)
Stance
Time (sec)
Swing
Time (sec)
Stride
Time (sec)
Stride Length
(cm)
Stride Velocity
(cm/sec)
Limb Mean ± SD
(min., max.)
Mean ± SD
(min.,max.)
Mean ± SD
(min.,max.)
Mean ± SD
(min., max.)
Mean ± SD
(min., max.)
Left Front 0.68±0.23
(0.20, 1.23)
0.37±0.14
(0.17, 0.98)
1.00±0.26
(0.30, 2.05)
81.95±14.60
(45.50, 111.40)
90.13±40.63
(34.40, 334.30)
Left
Hind
0.67±0.25
(0.28, 1.49)
0.36±0.17
(0.09, 1.19)
1.03±0.30
(0.43, 1.87)
77.23±20.51
(18.70, 122.40)
85.20±41.93
(15.70, 294.50)
Right
Front
0.66±0.23
(0.25, 1.48)
0.37±0.12
(0.21, 0.85)
1.02±0.28
(0.48, 1.90)
83.82±14.41
(57.80, 119.00)
92.30±35.25
(35.20, 247.90)
Right
Hind
0.68±0.27
(0.28, 1.81)
0.35±0.12
(0.13, 0.82)
1.00±0.24
(0.50, 1.61)
78.17±17.86
(32.90, 114.80)
84.96±33.17
(24.70, 218.90)

50
Table 2-3. Descriptive statistics for the stride gait parameters.
Results are displayed as mean ± standard deviation (SD) followed by a range (minimum, maximum).
Extremity
(N=33)
Maximum
Force
(%BW)
Maximum
Force (Kg)
Impulse
(%BW*sec)
Impulse
(kg*sec)
Maximum Peak
Pressure (KPa)
Limb Mean ± SD
(min., max.)
Mean ± SD
(min., max.)
Mean ± SD
(min., max.)
Mean ± SD
(min., max.)
Mean ± SD
(min., max.)
Left Front 46.89±10.92
(24.80, 71.70)
24.38±5.22
(10.18, 35.86)
22.97±8.82
(9.20, 57.90)
12.23±5.09
(3.75, 28.94)
109.44±25.28
(42.00, 212.00)
Left
Hind
34.61±7.58
(17.70, 50.50)
18.01±4.56
(7.26, 28.29)
16.30±7.02
(5.80, 39.00)
8.64±4.25
(2.39, 20.53)
92.55±20.49
(37.00, 144.00)
Right
Front
47.21±9.10
(27.50, 65.10)
24.49±4.68
(11.88, 35.14)
22.89±8.14
(7.30, 47.70)
11.87±4.57
(3.66, 27.71)
107.97±23.05
(49.00, 176.00)
Right
Hind
35.98±8.77
(20.50, 54.40)
18.89±4.76
(8.39, 34.77)
16.92±6.23
(6.6, 35.70)
9.07±3.84
(2.73, 18.57)
92.89±22.53
(39.00, 157.00)

51
Table 2-4.Student’s t-test evaluating day 1 versus day 3.
Extremity
(N=33) LF RF
LH
RH
Runs
Day
1 Day 3
Mean
+/- SD Day 1 Day 3
Mean
+/- SD Day 1 Day 3
Mean
+/- SD Day 1 Day 3
Mean +/-
SD
Stride
Length
(cm) 78.07 85.83 7.76 +/- 78.82 88.81 9.99 +/- 75.97 78.48
2.51 +/-
* 74.58 81.75 7.17 +/-*
Stride
Velocity
(cm/sec) 79.91 100.35 20.44+/- 81.34 103.25 21.91 +/- 75.79 94.62
18.83
+/- 74.72 95.21 20.48 +/-
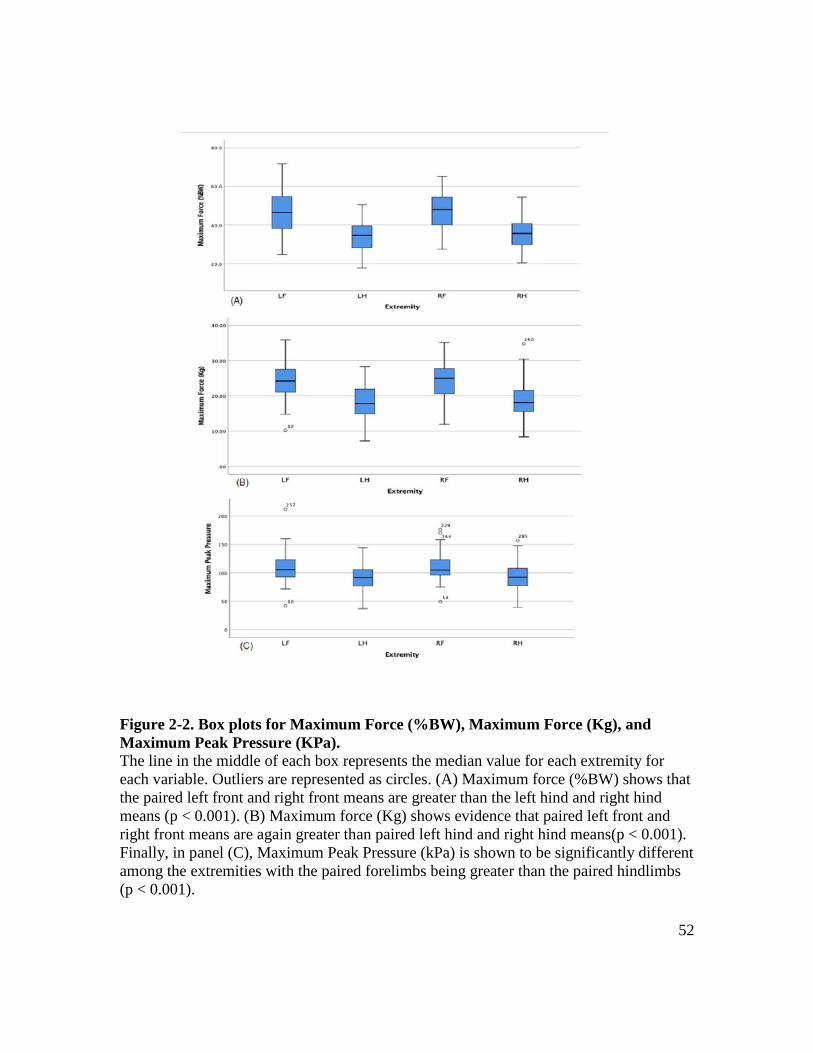
52
Figure 2-2. Box plots for Maximum Force (%BW), Maximum Force (Kg), and
Maximum Peak Pressure (KPa).
The line in the middle of each box represents the median value for each extremity for
each variable. Outliers are represented as circles. (A) Maximum force (%BW) shows that
the paired left front and right front means are greater than the left hind and right hind
means (p < 0.001). (B) Maximum force (Kg) shows evidence that paired left front and
right front means are again greater than paired left hind and right hind means(p < 0.001).
Finally, in panel (C), Maximum Peak Pressure (kPa) is shown to be significantly different
among the extremities with the paired forelimbs being greater than the paired hindlimbs
(p < 0.001).
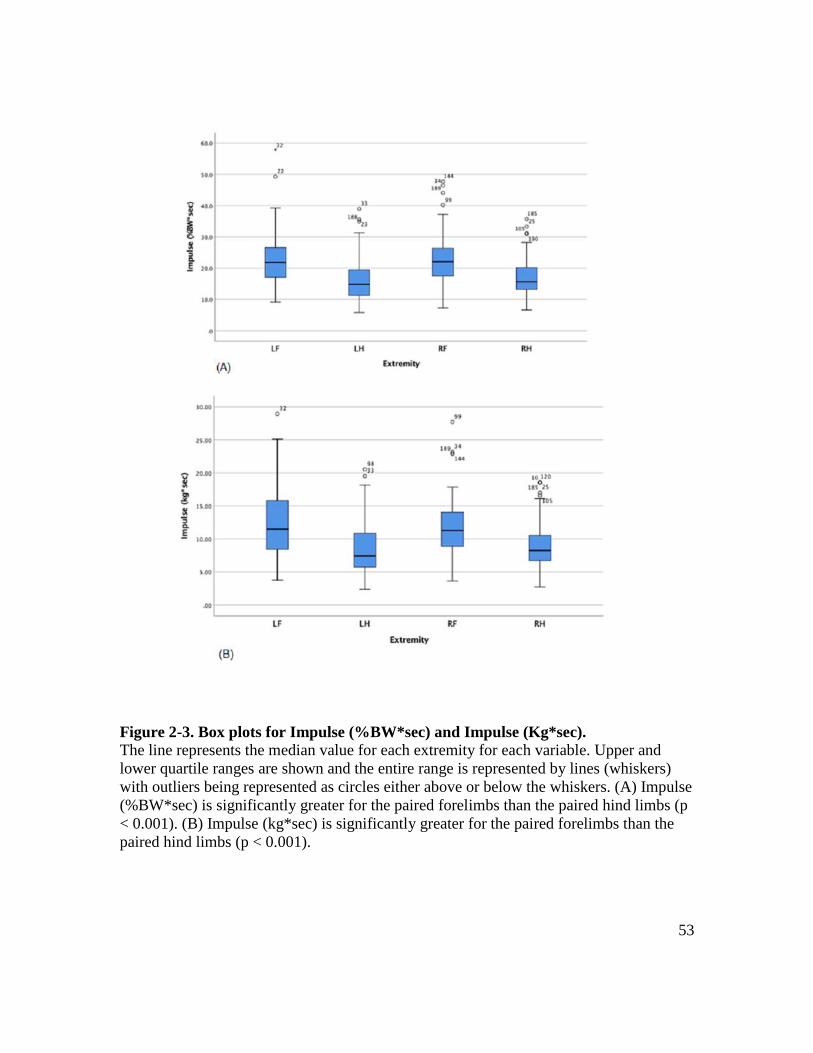
53
Figure 2-3. Box plots for Impulse (%BW*sec) and Impulse (Kg*sec).
The line represents the median value for each extremity for each variable. Upper and
lower quartile ranges are shown and the entire range is represented by lines (whiskers)
with outliers being represented as circles either above or below the whiskers. (A) Impulse
(%BW*sec) is significantly greater for the paired forelimbs than the paired hind limbs (p
< 0.001). (B) Impulse (kg*sec) is significantly greater for the paired forelimbs than the
paired hind limbs (p < 0.001).

54
CHAPTER 3. ASSESSMENT OF OSSEOINTEGRATION OF A NOVEL SYNTHETIC BONE
SCAFFOLD IN A TIBIA SEGMENTAL DEFECT MODEL
55
Abstract
Treatment of debilitating long bone fractures have yet to find a suitable synthetic
scaffold replacement to the gold standard bone autograft. In this study, the long term
ability of a multi-layered polyurethane-nanohydroxyapatite-decellularized
(nHA/PU/DBP) bone particle scaffold to repair long bone ostectomy defects is
investigated in a large animal model. Data presented is in a clinically relevant large
animal bone healing model over a 12 month period of time. Based on radiographic,
computed tomographic, and load-to-failure analysis, all treatment groups healed over
time. Dual energy x-ray absorptiometry showed greater bone mineral density for goats
treated with scaffold and scaffold plus bone morphogenetic protein-2 (BMP-2) groups.
Histomorphometric analysis showed greater osteoid formation for scaffold and BMP-2
goats, while mineralization and osteoclast numbers were consistent with bone remodeling
over time. Low morbidity and mortality associated with the preclinical large animal
model presented here show the potential for this model to become standardized for
ostectomy gap healing. The use of a nHA/PU/DBP scaffold with the addition of BMP-2
showed potential for treatment of patients with severe long bone defects.

56
Introduction
The use of regenerative therapies for human musculoskeletal defect injuries is on
the verge of becoming standard practice. [1] Traditionally, catastrophic fractures have
required the use of bone grafts when a decision has been made to salvage a limb [2, 3].
The gold standard for bone grafting materials has been the autograft (bone taken from the
patient’s own body) or the allograft (cadaveric bone from a bone bank) [4, 5]. The
procedure is not without complication. Approximately 30-60% of grafting procedures
result in one or more complications, ranging from infection to incomplete integration and
donor site pain [6]. In humans, the incidence of non-union fractures is approximately 5-
10% [7]. The consensus for the definition of delayed healing or fracture non-union is
inconsistent and subjective [8]. Musculoskeletal injuries have been reported to
compromise approximately 50% of all combat wounds and are becoming an orthopedic
burden of disease highlighting the need for approval of new regenerative therapies that
will lower the incidence of these costly injuries [9-11].
Development of a wide variety of synthetic materials has been undertaken in an
effort to improve healing of debilitating factures [4]. An ideal regenerative material
would be both osteo-inductive (provide a biologic stimulus for cells to differentiate into
mature osteoblasts) and osteo-conductive (promote bone apposition or function as a
receptive scaffold to enhance bone formation) [4]. Bio-ceramics such as calcium
sulphate, tricalcium phosphate and hydroxyapatite are early products developed for use as
synthetic grafting materials with extensive history of safety data [4, 5]. The combination
of decellularized bone particles in combined with nano-hydroxyapatite impregnated
polymer has been shown to be cyto-compatible and causes a substantial increase in
osteoblast proliferation in vitro [12]. To date, an effective material to promote bone
healing in large defects has yet to be constructed and in- vivo studies, especially in large
animal preclinical models are lacking [6, 13].
Few studies have looked at bone regeneration and healing in animal study models
exceeding ninety days [14]. Even fewer studies have used large animals, which are more
translatable to humans [15-17]. The reasons for lack of large animal studies vary with the
most common being expense [18]. The ability to generate validated data to meet Food
and Drug Administration and International Organization for Standardization [ISO] 10993
for new medical devices, such as a bone regenerative material or scaffold, require a
relevant preclinical segmental bone defect in a large animal model to ensure the safety
and efficacy of the material [6, 19]. When selecting a large animal model, the cost to
acquire the animal, the care for the animal, the availability of the animal, society’s
acceptance of the animal model, the animal’s tolerance to captivity and the ease of
housing must all be considered [13, 14, 20]. In light of these hurdles, goats are an ideal
animal for the study of bone regeneration. Furthermore, the sequence of cellular events
during osseointegration of grafting material has been shown to be similar in goats and
humans [6, 14]. Historically in the evaluation of a new biomaterial, tibial fracture gap
sizes have been made with a length of 2.0-2.5 times that of the shaft diameter, and are
typically 20 to30 mm in length [6, 18, 19]. These segmental bone defects have been
stabilized during the study period with a variety of acceptable fixation methods, ranging

57
from external fixator pins, bone plating, and intramedullary nailing, each with its own
unique set of complications [6].
Recently, a 3D bio-scaffold composed of polyurethane(PU)-nano-
hydroxyapatite(nHA) manufactured with 80% PU/nHA interspersed with decellularized
bone particles exhibited promising new bone formation in vitro and in rat models [12,
21]. The combination of nHA/PU has been explored in-vitro and in small animal models
[22, 23]. Selection of hydrophilic polyurethane as a candidate for scaffold fabrication
offers suitable characteristics including biocompatibility, mechanical flexibility, and its
bioresorbability [24-26]. Nano-hydroxyapatite has been combined with a variety of
synthetic polymers to better mimic the mineral component and the microstructure of
natural bone [27]. The ideal for the nHA/PU composite is to serve as a 3D substrate for
cell attachment and migration, and in our lab we have demonstrated that the addition of
decellularized bone particles further stimulates this integration with native tissue [21, 27].
Hypothetically, the addition of a growth factor such as recombinant human bone
morphogenetic protein-2 (rhBMP2) classically produced by E. coli or by hamster oocyte
cell cultures, to the 3D scaffold could further stimulate bone formation. Bone
morphogenetic protein-2 is a growth factor in the transforming growth factor beta
superfamily with activity that was first identified in the 1960s [28, 29]. It is known for its
osteoinductive capacity [29]. Large amounts of BMP-2 are difficult to produce and
extremely costly [30]. Also, there is increasing evidence of deleterious side effects of
associated with off-label use of hamster oocyte derived rhBMP-2 products despite its
ability to elicit a consistent osteogenic effect [31]. Exaggerated bone response may be
associated with the large initial release of the protein from various BMP-2 carrier devices
[32, 33]. While the majority of recombinant human BMP-2 (rhBMP-2) is traditionally
derived from Chinese hamster ovary cells, E. coli derived rhBMP-2 has been shown to
show compatible fusion rates [30, 34-36]. E. coli derived rhBMP-2 is more cost effective
and has shown potential as a growth factor capable of elution from scaffolds with a pore
size of 100-300 um [34]. In typical fractures, BMP-2 is upregulated for up to 4 weeks
following injury, supporting the idea that an alternative strategy is to have a sustained
release of physiologically appropriate BMP-2 allowing for enhanced osteogenic
differentiation while mitigating untoward side effects [32, 37-39].
The aim of this project was to evaluate the long-term effect (up to twelve months)
of a 3D synthetic bone regeneration scaffold, with and without the addition of E. coli
derived rhBMP-2, implanted into a large segmental bone defect to assess the inherent and
enhanced capability to promote bone formation [21]. For this purpose, we used a 2.5cm
mid-diaphyseal tibia segmental osteotomy gap previously developed in our laboratory. In
this model, we create and stabilize the defect using a custom designed and manufactured
4.0-mm locking plate construct. We hypothesized that the scaffold would promote bone
formation without adverse effects, effectively deliver BMP2, and integrated and degraded
over time. Our objectives were to assess the fracture model and the effect of the scaffold
on the goats’ biometrics, bone healing, and scaffold degradation over a period of up to 1
year.

58
Materials and Methods
Scaffold Fabrication
Multi-layered scaffolds were fabricated as previously described (Fig 3-1a) [12,
21].3 Cylindrical scaffolds were manufactured to serve as a transmedullary implant
(spanning the gap from proximal to distal medullary canals). As such they were
manufactured to a length of 2.5 cm and a diameter of 8 mm to provide a secure fit into
the intramedullary cavity of both the distal and proximal segments of the cut tibia.
Scaffolds were sterilized using ethylene oxide prior to surgery.
Study Design
All experimental procedures and protocols were approved by the appropriate
animal care and use committees (University of Tennessee IACUC 2383). Eighty-three
mixed breed goats [2 to 6 years old, average weight 52.49±0.25 kgs (35-78 kgs)] were
purchased from a USDA licensed vendor. Goats were group housed in pens with free
access to grass hay, water, trace minerals and fed a daily total mixed ration [40]. Animals
were acclimatized for a minimum of 10 days before surgery. The study design consisted
of three groups: Control group: goats had the segmental defect without any treatment of
the defect; Scaffold group goats had the native scaffold inserted in the gap; BMP-2
impregnanted scaffold group goats had an rhBMP-2 impregnated scaffold inserted into
the gap. In BMP-2 animals (scaffold + rhBMP-2), 1.5 mg of lyophyilized E. coli derived
rhBMP-2 (BioVision, Milpitas, CA., USA) was impregnated into the scaffold for a
minimum of 30 minutes prior to implantation Dosage of BMP2 was extrapolotaed from
previous studies and clinical use products. Each group of goats were used to study
regeneration and scaffold efficacy for 3, 6, 9, and 12 months. Each group at each time
point included 8 goats (3 groups x 4 time points x 8 goats = 96 goats in total) with up to 2
replacement goats per group per time point (n=24).
Surgical procedure and scaffold implantation in caprine tibias
Goats were withheld from feed for 24 hours, and water for 12 hours prior to
surgery. Each goat was sedated with xylazine (0.05 mg/kg IV) and induced into general
anesthesia using midazolam (0.25 mg/kg) and ketamine (5 mg/kg). Goats were then
intubated and placed into dorsal recumbency under general anesthesia and maintained
using isoflurane gas vaporized in 100% oxygen. Balanced anesthesia was carried out
using monitoring parameters (heart rate, respiratory rate, temperature, response to
stimulus) and isotonic fluids were provided at 10 ml/kg/hr. The right hind limb was
suspended, clipped, and aseptically prepared for surgery. An approximately 20-cm linear
incision was made over the medial aspect of the tibia. The periosteum was incised and
reflected from the surface of the tibia. A custom designed, 8-hole, 4.0-mm thick, locking
3 All figures and tables for this chapter are presented in the appendix.

59
plate was applied to the cranial medial aspect of the tibia. This custom designed locking
plate (Veterinary Orthopedic Implants, St. Augustine, Fl., USA) had each of the locking
screw holes placed at the ends of the plate (4 at each end) so as to ensure the section of
the plate spanning the defect was solid and would prevent bending failure. Four 4.0-mm
diameter locking bone screws were placed into each of the proximal and distal segments
of the tibia spanning the region of the segmental ostectomy (Fig 3-1b). A 2.5-cm length
full thickness segment was cut using an osteotomy saw and the bone segment removed
from the tibia. The scaffold material was trimmed, using surgical scissors and/or a #10
scalpel blade, to the appropriate length for the ostectomy (Fig 3-1c and d). The
ostectomy gap was left unfilled in the Control group goats, was filled with scaffold
material in the Scaffold group goats, or filled with an rhBMP-2 impregnated scaffold in
the BMP-2 group goats. The subcutaneous tissues were closed with 2-0 polydiaxanone in
a continuous pattern. The skin was closed using 0 polypropylene in a continuous pattern.
A Robert-Jones splint bandage (Tarsal Real Leg Quick Splint, Large, Jorgensen
Laboratories, Loveland, Co., USA) was placed on the limb to protect the surgery site
during recovery and for 60 days after surgery. The goats received flunixin meglumine (1
mg/kg IV; non-steroidal anti-inflammatory twice daily) for pain control for the first three
days after surgery and received Ceftiofur sodium (2.2 mg/kg IV) for three days for
antibiotic prophylaxis. Additional pain control was provided via a fentanyl transdermal
patch (72 mcg/kg/hr) which was placed on the dorsal lateral thorax 18 hours prior to
surgery and continued for 3 days post-operatively. When needed based on attitude,
activity and lameness, additional analgesic were given (meloxicam 1 mg/kg orally one
daily and/or fentanyl transdermal patches 75 mcg/kg/hr) as needed. The goats had free
access to food and water post-operatively, and were monitored for morbidity daily. Splint
bandages were changed daily for the first 5 days, then every other day for two weeks,
then weekly for two months. Splint bandages were removed at two months. Goats were
housed in individual pens for the first 7 days post-operatively, then group housed in pens
thereafter. Based on treatment group assignments, goats were euthanized at 3, 6, 9, or 12
months post-operatively by intravenous overdose of a barbiturate (pentobarbital 1
cc/10lbs).
Lameness evaluation post-operatively Gait parameters, specifically right hind maximum force as a percent of body
weight, were quantitatively assessed using a real-time pressure sensing system (Walkway
Pressure Mapping System, Tekscan Inc, South Boston, MA). The sensory matrix was
87.1 cm long by 36.9 cm wide and had a sensor density of 1.4 sensors/cm2. The mat was
calibrated and equilibrated according to the manufacturer’s instructions. Triggering was
enabled so that recordings would start at the first contact, or a raw sum force of 200 kPa
and end at a total of 400 recorded frames at a rate of 15 frames per second. An alleyway
was assembled to create a fixed walkway for the goats. The width of the alleyway was
made such that the goats could move freely in a straight line, would be discouraged from
turning around, and that each goat’s foot falls would strike the sensitive area of the mat.
Right hind maximum force as a percent of body weight data was collected prior to the
creation of the ostectomy gap, then at day 7 post-operatively and at monthly intervals
until end points.

60
Imaging assessment of ostectomy gaps and scaffold integration
High definition thermal imaging
High definition thermal images were acquired post-operatively at days 2, 4, 6, 8,
10, 12, 14, 21, 28, 35, 42, 39, 56, and then monthly until end points (Fluke Thermal
Imaging, MSC Corporation, USA). The camera was held one meter away from the goat
after the bandage had been removed and the limb had been allowed to acclimate to room
temperature when a bandage was still in place. The thermal reading nearest to the
ostectomy gap on the lateral aspect or craniocaudal aspect of the images were kept to the
nearest Farenheight degree.
Radiographic assessment Radiographs were performed immediately post-operatively and then monthly until
end points (NEXT Equine DR, Sound, Carlsbad, CA., USA). Radiographs were scored
by a board certified radiologist to assess ostectomy gap filling Table 3-1. For statistical
analysis, a score of 5 was equal to that of a healed fracture (ostectomy gap completely
filled with new bone and/or bridging callus present on all cortices).
Dual energy x-ray absorptiometry (DEXA)
A dual energy x-ray absorptiometry (DEXA) was performed immediately post-
operatively then monthly until end points (Hologic QDR 4500, Horizon DXA Systems,
Marlborough, MA., USA). Briefly, the goat was sedated (xylazine 0.05 mg/kg IV) and
placed in sternal recumbency, the hind limbs were extended, and the right hind limb was
scanned using the lumbar spine settings. A region of interest (ROI) was drawn over the
osteotomy gap and bone mineral content (g) and bone mineral density (BMD; g/cm2)
were calculated.
Computed tomography
After humane euthanasia, the locking plate was removed from the right tibia. The
goat was placed in dorsal recumbency and a computed tomography (CT) scan performed
(Philips brilliance-40, Philips International B.V., Amsterdam, Netherlands). Transverse
images were reconstructed in 2 mm slice thickness using high definition resolution, and
sagittal and dorsal multiplanar (MPR) images were generated. ROI’s were drawn over
either new bone, or density of the graft and calculated in Hounsfield units (HU).
Biomechanical testing
Once CT imaging was complete, the tibia were harvested, isolated, and prepared
for a 4-point bending test. Testing was carried out using an Instron 5965
electromechanical universal testing system coupling with a 5 kN maximum actuator
(Instron 5965, Norwood, MA., USA). Testing was done in a single load-to-failure
fashion. The tibia and load points were optimally positioned such that the ostectomy site
was at midpoint between both the inner and outer arms. Tibias were mounted on the
holding grip with span set at 170 mm while the loading points were set at a span of 70
mm. The testing was performed at a rate of 60 mm/min until the specimen failed. The
mode of failure was recorded as bone fracture. The testing parameters were specified to

61
maximum load, expressed in kilograms of force (kgf), and it was defined as the
maximum load applied by the actuator to the specimen during the test right before
specimen failure. The displacement of the actuator was measured as a relative distance
(mm) of the actuator to its’ original location at the start of the test. Tissue specimens
lacking sufficient integrity to be mounted and tested were considered to have a value of
“0” for the purpose of statistical analysis.
Microscopic assessment of ostectomy gap and scaffold integration
After 4-point bending tests were completed, tibia segments were trimmed and
placed in 95% ethanol. Using an automated tissue processor (ASP300S, Leica, Germany)
tissues were dehydrated in a series of ethanol solutions of increasing concentration (70%,
80%, 95% x2, 100% x3) over a period of several days at ambient temperature and a
programmed auto-cycle of pressure, vacuum, and gentle agitation. Specimens were next
transferred to three separate exchanges of 100% Methyl Salicylate (Sigma-Aldrich, St.
Louis, MO) over the course of 48-72 hours, manually cycled between gentle agitation
(modified stir bar setup) and vacuum at -15-20 in Hg (Fisherbrand, Vacuum Chamber),
and observed for complete dehydration. Specimens were transferred to 100% xylenes
(Sigma-Aldrich, Histological Grade, St. Louis, MO) for a quick rinse before being placed
back onto the automated tissue processor (ASP300S, Leica, Germany) for three changes
of 100% xylenes to complete the tissue clearing and prepared for methyl methacrylate
resin infiltration. Specimens were then manually managed through three separate and
fresh in-house prepared Infiltration Solution (IS I, IS II, IS III) exchanges of methyl
methacrylate (Sigma-Aldrich, St. Louis, MO) and dibutyl phthalate (Sigma-Aldrich, St.
Louis, MO), under ambient temperature over the course of 1.5 - 2 weeks, and with a
manually cycled switch between gentle agitation (modified stir bar setup) and vacuum @
-15-20 in Hg (Fisherbrand, Vacuum Chamber).
After a satisfied period of resin infiltration, specimens were transferred to
prelabelled polypropylene containers and pre-polymerized base molds, where a fourth
and in-house prepared final resin solution was then added along with a benzoyl peroxide
based catalyst (Perkadox-16, AKZO Nobel Chemicals, Chicago, IL) to initiate a
polymerization reaction to cure each specimen into a bubble free, clear, hardened, methyl
methacrylate (MMA) block over a period of approximately 5-8 days. Each specimen
block was then trimmed using a wet bandsaw (MarMed Bone Wet Band Saw) so that
resulting microtomed sections would fit onto pre-cleaned 50mm x 75mm glass
microscope slides (Fisherbrand). Specimen blocks were shaped for microtomy and
sections cut at five microns using a motorized SM2500 sledge microtome (Leica,
Germany) and d-profile (sledge) tungsten-carbide knives (Delaware Diamond Knives).
Each section cut was mounted to an individual 50mm x 75mm precleaned glass
microscope slide (Fisherbrand) that was coated with an in-house gelatin based solution
recipe (Haupt’s Solution) and covered with a plastic protective strip.
Prior to staining, slide-sections from each specimen were sorted for VonKossa,
Goldner’s Trichrome, Tartrate Resistant Acid Phosphatase (TRAP) staining, and
fluorescence microscopy. The VonKossa stain was a silver stain that bound silver ions to
the presence of calcium in boney tissue (undemineralized bone). It was developed
chemically and visualized as a "jet-black" color identifying native/mature bone. The

62
process of osteoid, newly formed dense collagen, transitioning into mineralized bone was
visualized as a black "peppering" throughout the greyish-blue osteoid layer on the surface
of native/mature undemineralized bone. Goldner’s Trichrome staining and modified
general bone and cartilage stain similar to Masson’s Trichrome staining, was used for a
contrast between bone soft tissue morphology and the identification of dense
collagen/osteoid (red) as compared to mineralized bone (green). Finally, Tartrate
Resistant Acid Phosphatase (TRAP) staining (kit #387A, Sigma-Aldrich, St. Louis, MO)
was employed to demonstrate the active presence of osteoclastic activity with actively
resorbing osteoclasts being identified in red against a hematoxylin counterstained boney
matrix. Prior to staining, all sections were deplasticized in a similar fashion that
traditional paraffin sections would be deparaffinized so that all tissue components can be
uninhibited during staining molecule interactions.
To quantitatively assess the percentage of mineralization (VonKossa), osteoid
formation (Goldner's Trichrome), or osteoclast number (TRAP staining) images from
each slide were grossly acquired and digitized using a Panasonic HC-V770 (8M,
3264x2448, aspect ratio 4:3, extra optical zoom 20x)then processed in ImageJ (Rasband,
W.S., Image J, U.S. National Institutes of Health, Bethesda Maryland, USA,
https://imagej.nih.gov/ij/, 1997-2018.). For percentage mineralization, images were made
binary such that mineralized bone was the parameter quantitatively assessed. For osteoid
formation, images were made binary such that osteoid was the quantitatively assessed
parameter. Finally, for the osteoclast number, osteoclasts per mm of bone surface were
counted [41]. Unstained sections were evaluated by fluorescence microscopy with an
excitation filter and two stop filters allowing radiation with a wavelength between 490
and 520 nm that permitted the identification and morphometric analysis of the
mineralizing surface of bone.
Statistical analysis
Statistical analyses were performed using separate mixed-model repeated-
measures analysis of variance within the GLIMMIX procedures of SAS to determine
whether each outcome variable differed significantly by treatment group over time, with
goat considered a random effect (SAS v 9.4, Cary, NC). Multiple comparison
adjustments were made using Tukey’s post-hoc comparisons to assess the effects of
group, time point, and group x time point interaction. For categorical variables, ordinal
multinomial logistical regression doing a cumulative logit was performed by monthly
analysis to determine if there were differences between treatments. Significance was set
at P<0.05. Least square means are reported ± standard error.
Results
Clinical observations
Goats were removed from study and replaced when necessary based on infection.
Morbidity experienced with this model included osteomyelitis (n=13), plate bending
(n=2), wound dehiscence (n=1), broken screws (n=2), anesthetic death (n=2), and sudden
death of unrelated causes (n=2). A total of 83 goats (79%) were available for inclusion
into statistical analysis (Table 3-2).

63
Lameness evaluation
When evaluating maximum force as a percent of body weight for the right hind
operated limb, there was no difference between groups. There was an effect of time in
that goats were able to bear more weight through the operated limb (fracture healed and
goats become “sound”) over time. The increase in pressure (kilograms force as a percent
of body weight) exerted in the operated limb over time (19.16±1.26%BW) at 7 days post-
operatively) returned to baseline values pre-operatively (34.98±1.23%BW) showed an
increased comfort during ambulation regardless of treatment group.
Imaging assessment of ostectomy gap and scaffold osseointegration
High definition thermal imaging
The surface temperature at the site of surgery and scaffold implantation
(ostectomy site on lateral or craniocaudal images) was not different between treatment
groups regardless of time point. There was an effect of time in that surface temperature
decreased (from 98 degrees Farenheit to 83 degrees Farenheit) over time, or that surgical
site inflammation decreased and no additional inflammation was noted from fracture
healing regardless of group. Alternatively, as the scaffold group and scaffold+BMP-2
was not different from the control group, the addition of the biomaterial caused no
additional detectable inflammation.
Radiographs
Radiographs for each goat were reviewed by a board certified radiologist (HS)
blinded to the study groups assignments and scored for each month of study. The
radiographic score of ostectomy gap filling was compared between groups and over time.
A complete bridging callus was eventually formed in 73% of control goats, 66% Scaffold
goats, and 79% of BMP-2 goats. Across all groups, there was a significant effect of time
in that scores increased (ostectomy gaps healed) over time for all groups (P<0.05). There
was no effect of treatment group on the ordinal probabilities for ostectomy gap filling at
months 1-6, and months 10-12 (P>0.05). At month 7, there was an effect of treatment
group on the ordinal probabilities for ostectomy gap filling (P<0.05). There were reduced
odds in the Control group compared to the Scaffold group for lower ordered ostectomy
gap filling scores (OR=0.159, CI 95%, 0.04-0.69), meaning that the Control goats
showed greater gap filling scores (more healing) compared to Scaffold goats and BMP-2
goats. At month 8, there were reduced odds in the Control group compared to the
Scaffold group for lower ordered ostectomy gap filling scores (OR=0.133, CI 95%, 0.03-
0.60), and again at month 9 (OR=0.10, CI 95%, 0.02-0.49). Numerically, the odds ratio
was 0.45 comparing BMP-2 goats to Scaffold goats for lower ordered ostectomy gap
filling scores; however, the confidence interval ranged up to 1.67 and therefore was not
statistically significant.
Bone mineral density (BMD)
Bone mineral density within the ostectomy gap was calculated for each goat at
monthly intervals. Across all groups, there was a significant effect of time in that BMD
within the ostectomy gap increased (ostectomy gaps healed) over time for all groups (Fig

64
3-3A; P<0.05). On average, BMD within the ostectomy gap was greater in Scaffold goats
(0.93g/cm2 ±0.05) and BMP-2 goats (0.97g/cm2±0.05) as compared to Control goats
(0.85g/cm2 ±0.05). A difference between groups over time approached significance
showing that the BMD within the ostectomy gap was changing at a rate dependent on
group (Table 3, P=0.057; Fig 3-3B). On average, the overall rate of change for BMD
within the ostectomy gap showed similarities to a quadratic rate for bone healing.
Computed tomography
When evaluating new bone density over time, there was a significant effect of
time (P<0.05) with 3 month time-point goats, regardless of group, having less new bone
density (1126.04HU ±47.71; P<0.05) than any other time-point [(6)-1331.27HU± 47.26,
(9)-1262.97HU ± 72.83, (12)-1358.43HU ±44.06]. There was no significant difference
between groups. When evaluating the density of the material, only Scaffold goats and
BMP-2 goats were evaluated. On average, the density of the material was less (increased
osseo-integration) in BMP-2 goats (612.17HU ±50.44) as compared to Scaffold goats
(854.61HU ± 47.45; P<0.05, Fig 3-4). On average, both Scaffold goats and BMP-2 goats
at twelve months had less density of the material, or more osseo-integration (550.66HU ±
66.76), than all other time points [(3)-823.26HU ± 66.76, (6)-774.97HU ±75.63, (9)-
784.66HU ± 67.45; P<0.05].
Biomechanical testing
4-point bending load-to-failure testing was performed in nineteen of twenty-six
(73%) Control goats, nineteen of twenty-nine (66%) Scaffold goats, and twenty-two of
twenty-eight (79%) BMP-2 goats (Table 3-2). Tissue specimens lacking sufficient
integrity to be mounted and tested were considered to have a value of “0” for the purpose
of statistical analysis. Across groups, there was a significant effect of time (P<0.05).
There was no difference between adjacent time points; however, consistent differences
between the means for every 6 months of time in load-to-failure was apparent with load
increasing over time in all groups [(3)-57.53kgf±36.32c, (6)-118.05kgf±28.49bc, (9)-
192.56kgf±26.10ab, and (12)-207.62kgf±23.87a]. There were no statically significant
differences in load-to-failure between groups when bridging callus was achieved and
mechanical testing was possible. On average, Control goats failed at 142.10kgf ± 25.19,
Scaffold goats failed at 141.62kgf ± 26.94, and Scaffold+BMP-2 goats failed at
148.09kgf ± 23.28.
Microscopic assessment of ostectomy gap and scaffold integration
Undecalcified bone segments slides were successfully processed for histology
slides for analysis using stains for Von Kossa (n=78), Goldner’s Trichrome (n=79), and
TRAP (n=69) staining evaluation. Additionally when available, slides for fluorescence
microscopy were evaluated.
Histomorphometry assessment of Von Kossa staining (percent area mineralized in
the ostectomy gap), there was no significant difference between group, time point, and
group by time point interaction (P>0.05). On average, the percent mineralization for
Control goats was 41±1.92%, for Scaffold goats was 43±1.84%, and for BMP-2 goats
was 45±1.88. On average, the percent mineralization was 40±2.20% at 3 months,

65
44±2.20% at 6 months, 44±2.14% at 9 months and 45±2.14% at twelve months (Fig 3-5).
While no significant difference was apparent over time, the average percent
mineralization over time appeared to follow a bone remodeling curve in that
mineralization initially increased (new bone was laid down), decreased as the ostectomy
gap remodeled and then proceeded to increase again. This was regardless of group.
Histomorphometry assessment of Goldner’s Trichrome staining found that the
percent osteoid formation was significantly different between groups and across time
points; however, there was no group by time point interaction (P<0.05). On average,
Scaffold goats and BMP-2 goats had greater percent osteoid formation (6.96±0.46% and
6.97±0.46%) as compared to Control goats (3.67±0.48%). On average, the osteoid
percentage of area in the ostectomy gap decreased over time, with a slight increase at 9
months then final decrease at 12 months regardless of group [(3-6.79±0.55%a, (6)-
5.67±0.55ab, (9)-6.36±0.53%a, (12)-4.63±0.54b ; Fig 3-6]. This significant difference over
time supports an active ostectomy remodeling gap regardless of group that mimics the
percent mineralization in an equal and opposite direction in that new bone (osteoid) is
initially laid down, mineralized, and then remodeled and decreases over time.
Osteoclast count per mm of bone surface found a significant difference between
group, time point, and a group by time point interaction existed (P<.05). The average
osteoclast count decreased over time for Scaffold goats and BMP-2 goats, while the
average osteoclast count remained static for Control goats (Fig 3-7, Table 3-4).
Assesment of fluorescent microscopy (percent bone formation) revealed that there
was no significant difference between group, time point, and group by time point
interaction (P>0.05). Oxytetracycline is an antibiotic that complexes with metal ions such
as calcium and becomes incorporated into bone enabling it to be used as a marker of bone
formation. It can be detected for months post-injection as bone turn-over can take years.
This may explain why there was no difference over time. Goats in the study were double
labeled (once prior to surgery and again prior to euthanasia) in the hopes of being able to
detect a bone formation rate. Due to healing of most of the gaps by 3 months, this
detection was no longer possible. The average percent bone formation for Control goats
was 0.12%±0.10, for Scaffold goats was 0.46%±0.10, and for BMP-2 goats was
0.38%±0.10.
Discussion
The use of a long-term bone-healing model to evaluate scaffolds that resembles
closely the normal fracture healing process is of great interest for bone regeneration.
Long-term bone regeneration studies are lacking, especially for the study of synthetic
biomimetic materials [6]. A cost effective large animal preclinical model is of the utmost
importance for meeting FDA and ISO 10993 standards are critical [6]. An efficacious
model may speed development of medical devices for bone tissue engineering reducing
the rates of non-unions, need for amputation, or costly secondary revision surgeries.
A significant outcome for this study was that 80% of the goats survived to their
expected time point. The most significant short-term complication was osteomyelitis
within one-month post-operatively. The second most common complication was
associated with orthopedic complications related to the locking plate itself (9%). The

66
most common complication was bending of the locking plate, or screw pull out. These
complications have been noted previously in large animal segmental defect models [19].
In contrast to an earlier ovine study that noted a lower stiffness of a limited contact
locking compression plate as compared to a dynamic compression plate, our study was
able to successfully use a custom made 8-hole locking plate for up to 12 months [19].
One significant difference is that our custom- made 8-hole plate did not have screw holes
in the middle of the plate which was centered on the gap created by the segmental defect.
Anchorage into the main fragments proximal and distal to the ostectomy gap are
important and our plate design allowed for screws to be placed farther from the
ostectomy gap in a buttress fashion [42, 43]. This in combination with the application of
the use of padded splint bandage for 60 days may account for fewer orthopedic
complications seen in this study. Additionally, as we aimed to study bone healing and
osseointegration of the implant, our control defects were allowed to heal and therefore a
non-union was not ensured [19].
Serial imaging was performed with radiographs and dual energy x-ray
absorptiometry (DEXA). While conventional radiographs have long been the standard for
assessment of fracture healing, they have limited use for evaluation of biomaterials and
fracture healing[44]. The use of DEXA has long been a means of assessing osteoportic
bone and used in animal models [45, 46]. We successfully used DEXA as a means of
studying osseointegration. While, radiographically, it appeared that scaffold goats had
lower healing scores, by use of DEXA, there was greater bone mineral density within the
ostectomy gap, which may be attributable to the presence of the decellularized bone
particles in the scaffold and guided bone formation with less pronounced woven bone
during the regenerative phase. Computed tomography bone density appeared to follow a
standard bone-remodeling curve, regardless of treatment group, showing an initial
increase in bone density after 3 months with a minor drop after 6 months and increase
again to 12 months. Computed tomography has been shown to be a parameter for
macroscopic assessment of osseo-integration, and BMP-2 goats appeared to have greater
osseo-integration as compared to Scaffold goats [47].
One salient observation was the percentage of group two (scaffold) goats that
made it to a bridging callus and biomechanical testing. Of the twenty-six goats in group
two, nineteen were able to form a sufficient bridging callus regardless of time point.
While not statistically different with regard to load-to-failure, more BMP-2 goats were
able to form a bridging callus as opposed to group two goats. Once a bridging callus was
formed, the load-to-failure was equivocal among groups. It previously has been
recognized that polyurethanes used in orthopedic biomaterials have been chosen for some
of their mechanical and degradation properties [48, 49]. This synthetic polymer has been
previously combined with nanohydroxyapatite allowing the biomaterial to bind to living
bone tissue providing osteo-conductivity and biocompatibility [48, 49]. To these author’s
knowledge, few studies have studied this polymer biomaterial combination in a large
animal model beyond a relatively short time period, or against a bone healing model, to
further investigate its potential osseo-integrative properties [50].
Of chief importance was this study’s ability to provide long-term follow up with a
negative control group that served as a bone-healing model for comparison. On
67
microscopic evaluation, group one (control) goats showed a mean percent area of
mineralization that increased in a manner that would be expected for bone formation [51].
Bone healing should progress from soft callus formation, to hard callus formation, and
then proceed to bone remodeling [51]. During the remodeling process, irregular woven
bone is converted to lamellar bone and the original cortical structure is returned [51]. The
greatest disadvantage of this model was the stress shielding that occurred due to the
locking plate placed in a buttress fashion. This stress shielding resulted in the cis cortex,
or that closest to the plate often becoming thinned [6, 19]. As expected, there was an
initial increase in mineralization, followed by a decrease as bone was remodeled, coupled
with a second period of increase as bone was returned to its original structure [51]. In line
with this concept, percent osteoid formation was opposite to that of mineralization such
that there was initially a large amount of immature bone that was initially great and then
fell accordingly as bone, or the fracture, remodeled and healed. Scaffold goats and BMP-
2 goats had greater percent osteoid formation as compared to Control goats [52]. Finally,
it appeared as though there was little osteoclastic activity associated with group one goats
once the bridging callus was formed with the average osteoclast count being less than one
per mm of bone surface. This may be due to the observation that most group one goats
had formed a bridging callus based on radiographic scores by sixty days, and remodeling
was based on stress biomechanics rather than true bone remodeling [6, 42]. This would
leave osteoclastic activity limited to degredation of the biomaterial thus explaining why
there was an increased osteoclast count in the group two and group three goats that
decreased to that of the group one goats over time.
Overall results demonstrate that scaffold + rhBMP-2 treatment resulted in more
goats reaching a bridging callus that was able to withstand load-to-failure testing.
Treatment with rhBMP-2 also resulted in scaffolds that were better integrated based on
macroscopic assessment. Based on microscopic assessment, rhBMP2 treatment resulted
in goats that were equivocal to the bone healing model control at 12 months in terms of
percent area mineralization and osteoclastic resorption. These results highlight the ability
of our scaffold to deliver growth factors. While rhBMP2 continues to be a growth factor
of controversy, as of this moment, for large bone defects, there are few alternatives [53-
57]. Of note, bone formation was not present in muscle or any other ectopic locations as
all goats underwent full post-mortem examination. This highlights the capability of the
scaffold to serve as an eluting device for growth factors though further kinetic studies are
necessary to define the optimal dose and elution rates.
Future studies to improve this model would be to remove the locking plate once
the bridging callus is present. One disadvantage of this model was the stress shielding
that occurred due to the locking plate placed in a buttress fashion. This stress shielding
resulted in the cis-cortex, or that closest to the plate often becoming thinned [6, 42].
Earlier removal of the plate may overcome the limitation of the thinning of the cis cortex
and may improve radiographic scoring over time. Previous studies have shown that some
iterations of this scaffold have the ability to deliver mesenchymal stem cells [57]. We
now have the basis to show that our material scaffold elutes growth factors, and with the
addition of growth factors shows superior osseo-integragraion compared to the material
alone. Speculatively, in areas of potential non-union the addition of mesenchymal stem

68
cells could enhance the bone tissue regeneration using our material as a delivery
platform. Finally, after the first sixty days, goats were free to return to group housing and
required minimal maintenance beyond housing requirements. This allowed for a long-
term efficacious model that may bridge the need to provide a large animal preclinical
model that is both cost effective and repeatable [6].
Conclusions
Overall the results presented here demonstrate the effectiveness of a multi-
layered-nanohydroxyapatite-polyurethane-decellularized bone particle based scaffold in
the treatment of long bone segmental defects which is enhanced when used as a delivery
device for rhBMP2. The results of this study have shown a successful, repeatable large
animal preclinical model of segmental defect long bone healing that provides a bone-
healing model for comparison of osseo-integration of synthetic based materials.
Evaluation of our multi-layered material showed superior integration at 3, 6, 9, and 12
months with the addition of rhBMP2 as compared to the material alone. Strengths of this
study include validation of the importance of a non-treatment control and the long-term
evaluation of twelve months.

69
References

70
1. Smith, B. D., & Grande, D. A. (2015). The current state of scaffolds for
musculoskeletal regenerative applications. Nature Reviews Rheumatology, 11(4),
213.
2. Finkemeier, C. G. (2002). Bone-grafting and bone-graft substitutes. JBJS, 84(3),
454-464.
3. Baldwin, P., Li, D. J., Auston, D. A., Mir, H. S., Yoon, R. S., & Koval, K. J.
(2019). Autograft, allograft, and bone graft substitutes: clinical evidence and
indications for use in the setting of orthopaedic trauma surgery. Journal of
orthopaedic trauma, 33(4), 203-213.
4. Fillingham, Y., & Jacobs, J. (2016). Bone grafts and their substitutes. The bone &
joint journal, 98(1_Supple_A), 6-9.
5. Fernandez de Grado, G., Keller, L., Idoux-Gillet, Y., Wagner, Q., Musset, A. M.,
Benkirane-Jessel, N., ... & Offner, D. (2018). Bone substitutes: a review of their
characteristics, clinical use, and perspectives for large bone defects management.
Journal of tissue engineering, 9, 2041731418776819.
6. Reichert, J. C., Saifzadeh, S., Wullschleger, M. E., Epari, D. R., Schütz, M. A.,
Duda, G. N., ... & Hutmacher, D. W. (2009). The challenge of establishing
preclinical models for segmental bone defect research. Biomaterials, 30(12),
2149-2163.
7. Zura, R., Xiong, Z., Einhorn, T., Watson, J. T., Ostrum, R. F., Prayson, M. J., ...
& Steen, R. G. (2016). Epidemiology of fracture nonunion in 18 human bones.
JAMA surgery, 151(11), e162775-e162775.
8. Harwood, P. J., Newman, J. B., & Michael, A. L. (2010). (ii) An update on
fracture healing and non-union. Orthopaedics and Trauma, 24(1), 9-23.
9. Belmont, P. J., Schoenfeld, A. J., & Goodman, G. (2010). Epidemiology of
combat wounds in Operation Iraqi Freedom and Operation Enduring Freedom:
orthopaedic burden of disease. J Surg Orthop Adv, 19(1), 2-7.
10. Court-Brown, C. M., Rimmer, S., Prakash, U., & McQueen, M. M. (1998). The
epidemiology of open long bone fractures. Injury, 29(7), 529-534.
11. Nandra, R., Grover, L., & Porter, K. (2016). Fracture non-union epidemiology
and treatment. Trauma, 18(1), 3-11.
12. Jackson, B. K., Bow, A. J., Kannarpady, G., Biris, A. S., Anderson, D. E., Dhar,
M., & Bourdo, S. E. (2018). Polyurethane/nano-hydroxyapatite composite films
as osteogenic platforms. Journal of Biomaterials Science, Polymer Edition,
29(12), 1426-1443.
13. Black, C. R., Goriainov, V., Gibbs, D., Kanczler, J., Tare, R. S., & Oreffo, R. O.
(2015). Bone tissue engineering. Current molecular biology reports, 1(3), 132-
140.
14. Pearce, A. I., Richards, R. G., Milz, S., Schneider, E., & Pearce, S. G. (2007).
Animal models for implant biomaterial research in bone: a review. Eur Cell
Mater, 13(1), 1-10.

71
15. McGonigle, P., & Ruggeri, B. (2014). Animal models of human disease:
challenges in enabling translation. Biochemical pharmacology, 87(1), 162-171.
16. Van der Worp, H. B., Howells, D. W., Sena, E. S., Porritt, M. J., Rewell, S.,
O'Collins, V., & Macleod, M. R. (2010). Can animal models of disease reliably
inform human studies?. PLoS medicine, 7(3), e1000245.
17. Hackam, D. G., & Redelmeier, D. A. (2006). Translation of research evidence
from animals to humans. Jama, 296(14), 1727-1732.
18. Woodruff, M. A., Lange, C., Reichert, J., Berner, A., Chen, F., Fratzl, P., ... &
Hutmacher, D. W. (2012). Bone tissue engineering: from bench to bedside.
Materials Today, 15(10), 430-435.
19. Reichert, J. C., Epari, D. R., Wullschleger, M. E., Saifzadeh, S., Steck, R., Lienau,
J., ... & Hutmacher, D. W. (2010). Establishment of a preclinical ovine model for
tibial segmental bone defect repair by applying bone tissue engineering strategies.
Tissue Engineering Part B: Reviews, 16(1), 93-104.
20. Schimandle, J. H., & Boden, S. D. (1994). Spine update. The use of animal
models to study spinal fusion. Spine, 19(17), 1998-2006.
21. Bow, A., Newby, S., Rifkin, R., Jackson, B. K., Matavosian, A., Griffin, C., ... &
Morello, R. (2019). Evaluation of a polyurethane platform for delivery of
nanohydroxyapatite and decellularized bone particles in a porous three-
dimensional scaffold. ACS Applied Bio Materials, 2(5), 1815-1829.
22. Meskinfam, M., Bertoldi, S., Albanese, N., Cerri, A., Tanzi, M. C., Imani, R., ...
& Fare, S. (2018). Polyurethane foam/nano hydroxyapatite composite as a
suitable scaffold for bone tissue regeneration. Materials Science and Engineering:
C, 82, 130-140.
23. Tetteh, G., Khan, A. S., Delaine-Smith, R. M., Reilly, G. C., & Rehman, I. U.
(2014). Electrospun polyurethane/hydroxyapatite bioactive Scaffolds for bone
tissue engineering: The role of solvent and hydroxyapatite particles. journal of the
mechanical behavior of biomedical materials, 39, 95-110.
24. Janik, H., & Marzec, M. (2015). A review: Fabrication of porous polyurethane
scaffolds. Materials Science and Engineering: C, 48, 586-591.
25. Gibas, I., & Janik, H. (2009). Medical polyurethanes with different hard segments
content obtained from polycaprolactone diol, aliphatic diisocyanates and
butanediol. Polish Journal of Applied Chemistry, 53(1), 9-14.
26. Chen, Q., Liang, S., & Thouas, G. A. (2013). Elastomeric biomaterials for tissue
engineering. Progress in polymer science, 38(3-4), 584-671.
27. Wei, G., & Ma, P. X. (2004). Structure and properties of nano-
hydroxyapatite/polymer composite scaffolds for bone tissue engineering.
Biomaterials, 25(19), 4749-4757.
28. Urist, M. R. (1965). Bone: formation by autoinduction. Science, 150(3698), 893-
899.

72
29. Chen, D. I., Zhao, M., & Mundy, G. R. (2004). Bone morphogenetic proteins.
Growth factors, 22(4), 233-241.
30. Chung, C. H., Kim, Y. K., Lee, J. S., Jung, U. W., Pang, E. K., & Choi, S. H.
(2015). Rapid bone regeneration by Escherichia coli-derived recombinant human
bone morphogenetic protein-2 loaded on a hydroxyapatite carrier in the rabbit
calvarial defect model. Biomaterials research, 19(1), 17.
31. Quinlan, E., Thompson, E. M., Matsiko, A., O'Brien, F. J., & López-Noriega, A.
(2015). Long-term controlled delivery of rhBMP-2 from collagen–hydroxyapatite
scaffolds for superior bone tissue regeneration. Journal of controlled release, 207,
112-119.
32. Poldervaart, M. T., Wang, H., van der Stok, J., Weinans, H., Leeuwenburgh, S.
C., Öner, F. C., ... & Alblas, J. (2013). Sustained release of BMP-2 in bioprinted
alginate for osteogenicity in mice and rats. PloS one, 8(8), e72610.
33. Jansen, J. A., Vehof, J. W. M., Ruhe, P. Q., Kroeze-Deutman, H., Kuboki, Y.,
Takita, H., ... & Mikos, A. G. (2005). Growth factor-loaded scaffolds for bone
engineering. Journal of Controlled Release, 101(1-3), 127-136.
34. Lee, J. H., Ryu, M. Y., Baek, H. R., Lee, K. M., Seo, J. H., Lee, H. K., & Ryu, H.
S. (2013). Effects of porous beta-tricalcium phosphate-based ceramics used as an
E. coli-derived rhBMP-2 carrier for bone regeneration. Journal of Materials
Science: Materials in Medicine, 24(9), 2117-2127.
35. Bessho, K., Konishi, Y., Kaihara, S., Fujimura, K., Okubo, Y., & Iizuka, T.
(2000). Bone induction by Escherichia coli-derived recombinant human bone
morphogenetic protein-2 compared with Chinese hamster ovary cell-derived
recombinant human bone morphogenetic protein-2. British Journal of Oral and
Maxillofacial Surgery, 38(6), 645-649.
36. Geiger, M., Li, R. H., & Friess, W. (2003). Collagen sponges for bone
regeneration with rhBMP-2. Advanced drug delivery reviews, 55(12), 1613-1629.
37. Groeneveld, E. H., & Burger, E. H. (2000). Bone morphogenetic proteins in
human bone regeneration. European journal of endocrinology, 142(1), 9-21.
38. Yamamoto, M., Takahashi, Y., & Tabata, Y. (2003). Controlled release by
biodegradable hydrogels enhances the ectopic bone formation of bone
morphogenetic protein. Biomaterials, 24(24), 4375-4383.
39. Cho, T. J., Gerstenfeld, L. C., & Einhorn, T. A. (2002). Differential temporal
expression of members of the transforming growth factor β superfamily during
murine fracture healing. Journal of Bone and Mineral Research, 17(3), 513-520.
40. National Research Council. (2010). Guide for the care and use of laboratory
animals. National Academies Press.
41. Ruiz, P., Martin-Millan, M., Gonzalez-Martin, M. C., Almeida, M., González-
Macias, J., & Ros, M. A. (2016). CathepsinKCre mediated deletion of βcatenin
results in dramatic loss of bone mass by targeting both osteoclasts and
osteoblastic cells. Scientific reports, 6, 36201.

73
42. Niemeyer, P., & Sudkamp, N. P. (2006). Principles and clinical application of the
locking compression plate (LCP). Acta Chir Orthop Traumatol Cech, 73(4), 221-
228.
43. Mueller, C. A., Eingartner, C., Schreitmueller, E., Rupp, S., Goldhahn, J.,
Schuler, F., ... & Suedkamp, N. P. (2005). Primary stability of various forms of
osteosynthesis in the treatment of fractures of the proximal tibia. The Journal of
bone and joint surgery. British volume, 87(3), 426-432.
44. Blokhuis, T. J., De Bruine, J. H. D., Bramer, J. A. M., Den Boer, F. C., Bakker, F.
C., Patka, P., ... & Manoliu, R. A. (2001). The reliability of plain radiography in
experimental fracture healing. Skeletal radiology, 30(3), 151-156.
45. Egermann, M., Goldhahn, J., & Schneider, E. (2005). Animal models for fracture
treatment in osteoporosis. Osteoporosis international, 16(2), S129-S138.
46. Mosheiff, R., Klein, B. Y., Leichter, I., Chaimsky, G., Nyska, A., Peyser, A., &
Segal, D. (1992). Use of dual-energy x-ray absorptiometry (DEXA) to follow
mineral content changes in small ceramic implants in rats. Biomaterials, 13(7),
462-466.
47. Assad, M., Likibi, F., Jarzem, P., Leroux, M. A., Coillard, C., & Rivard, C. H.
(2004). Porous nitinol vs. titanium intervertebral fusion implants: computer
tomography, radiological and histological study of osseointegration capacity.
Materialwissenschaft und Werkstofftechnik: Entwicklung, Fertigung, Prüfung,
Eigenschaften und Anwendungen technischer Werkstoffe, 35(4), 219-223.
48. Dong, Z., Li, Y., & Zou, Q. (2009). Degradation and biocompatibility of porous
nano-hydroxyapatite/polyurethane composite scaffold for bone tissue engineering.
Applied Surface Science, 255(12), 6087-6091.
49. Barone, D. J., Raquez, J. M., & Dubois, P. (2011). Bone‐guided regeneration:
from inert biomaterials to bioactive polymer (nano) composites. Polymers for
Advanced Technologies, 22(5), 463-475.
50. Gogolewski, S., Gorna, K., & Turner, A. S. (2006). Regeneration of bicortical
defects in the iliac crest of estrogen‐deficient sheep, using new biodegradable
polyurethane bone graft substitutes. Journal of Biomedical Materials Research
Part A: An Official Journal of The Society for Biomaterials, The Japanese Society
for Biomaterials, and The Australian Society for Biomaterials and the Korean
Society for Biomaterials, 77(4), 802-810.
51. Schindeler, A., McDonald, M. M., Bokko, P., & Little, D. G. (2008, October).
Bone remodeling during fracture repair: The cellular picture. In Seminars in cell
& developmental biology (Vol. 19, No. 5, pp. 459-466). Academic Press.
52. Gruber, H. E. (1992). Adaptations of Goldner's Masson trichrome stain for the
study of undecalcified plastic embedded bone. Biotechnic & histochemistry,
67(1), 30-34.
74
53. Cook, S. D., Salkeld, S. L., Brinker, M. R., Wolfe, M. W., & Rueger, D. C.
(1998). Use of an osteoinductive biomaterial (rhOP-1) in healing large segmental
bone defects. Journal of orthopaedic trauma, 12(6), 407-412.
54. Conway, J. D., Shabtai, L., Bauernschub, A., & Specht, S. C. (2014). BMP-7
versus BMP-2 for the treatment of long bone nonunion. Orthopedics, 37(12),
e1049-e1057.
55. Tseng, S. S., Lee, M. A., & Reddi, A. H. (2008). Nonunions and the potential of
stem cells in fracture-healing. JBJS, 90, 92-98.
56. Geiger, F., Bertram, H., Berger, I., Lorenz, H., Wall, O., Eckhardt, C., ... &
Richter, W. (2005). Vascular endothelial growth factor gene‐activated matrix
(VEGF165‐GAM) enhances osteogenesis and angiogenesis in large segmental
bone defects. Journal of Bone and Mineral Research, 20(11), 2028-2035.
57. Salmasi, S., Nayyer, L., Seifalian, A. M., & Blunn, G. W. (2016). Suppl-3, M8:
Nanohydroxyapatite Effect on the Degradation, Osteoconduction and Mechanical
Properties of Polymeric Bone Tissue Engineered Scaffolds. The open
orthopaedics journal, 10, 900.

75
Appendices

76
Figure 3-1. Multi-layered nHA-PU-DBP based scaffolds implanted into 2.5 cm
segmental defects in the goat tibia.
A) Representation of the PU-nHA film and adding decellularized bone particles in a
layer-by-layer method. B) A custom made 8-hole locking plate was placed in a buttress
fashion and 2.5 cm full thickness segment of the tibia was removed with an osteotomy
saw. C) In scaffold or scaffold+BMP2 treatment groups, the scaffold was trimmed to the
appropriate length such that it fit snugly into the proximal and distal segments. D) The
remaining screws were placed and tightened.
C D B

77
Table 3-1. Radiographic scoring for assessment of ostectomy gap filling.
Views were taken monthly, assessed, and scored.
Ostectomy Gap Filling Score
No interval change compared to immediate post-
operative radiographs
0
New bone filling <25% of ostectomy gap 1
New bone filling 26-50% of ostectomy gap 2
New bone filling 51-75% of ostectomy gap 3
New bone filling >75% of ostectomy gap but not
completely healed
4
Ostectomy gap completely filled and/or bridging
callus present on all cortices
5

78
Table 3-2. Final group break down showing the number of defects in each group
that healed (formed a bridging callus) versus those showing insufficient healing
(lack of bridging callus).
Time
Point
Group No. of Bridging
Callus/Complete
Healing
No.
Insufficient
Healing
Totals
3
Months
Control
Scaffold
Sc+BMP-2
3
2
4
9
4
5
3
12
7
7
7
21
6
Months
Control
Scaffold
Sc+BMP-2
4
6
4
14
2
1
2
5
6
7
6
19
9
Months
Control
Scaffold
Sc+BMP-2
7
4
6
17
*
4
1
5
7
8
7
22
12
Months
Control
Scaffold
Sc+BMP-2
5
7
8
20
1
*
*
1
6
7
8
21

79
Figure 3-2. Radiographs were acquired monthly.
This figure represents radiographs from significant time points in bone healing and group
progression. Radiographic scores increased over time for all groups (P<0.05). Group one
(control; 5.47±0.24) and group three (scaffold+ E.Coli rhBMP-2; 5.17±0.24) goats had
significantly higher scores as compared to group two (scaffold) treated goats (4.6±0.24; P<0.05)
Group
Immed.
Post-Op.
3 Months
6 Months
9 Months
12 Months
Control
Scaffold
Scaffold
+BMP-2
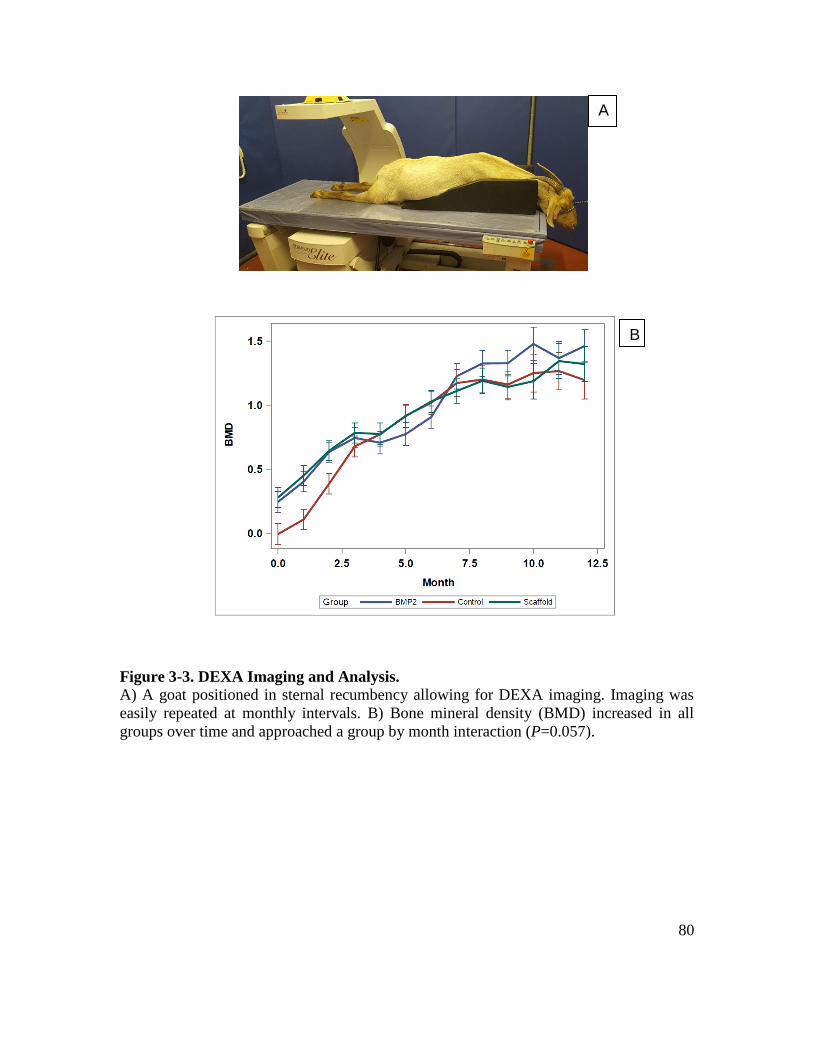
80
Figure 3-3. DEXA Imaging and Analysis.
A) A goat positioned in sternal recumbency allowing for DEXA imaging. Imaging was
easily repeated at monthly intervals. B) Bone mineral density (BMD) increased in all
groups over time and approached a group by month interaction (P=0.057).
A
B

81
Table 3-3. Group x Month interactions for bone mineral density as measured by
DEXA (P=0.057).
Month Group Mean ± SE
1 Control
Scaffold
0.107±0.080b
0.450±0.078a
Scaffold+BMP-2 0.403±0.078a
2 Control
Scaffold
0.387±0.387b
0.645±0.645a
Scaffold+ BMP-2 0.635±0.635a
3 Control
Scaffold
0.678±0.080a
0.784±0.077a
Scaffold+BMP-2 0.745±0.078a
4 Control
Scaffold
0.773±0.090a
0.776±0.086a
Scaffold+BMP-2 0.707±0.087a
5 Control
Scaffold
0.978±0.090a
0.915±0.086a
Scaffold+BMP-2 0.775±0.088a
6 Control
Scaffold
1.020±0.090a
1.030±0.086a
Scaffold+BMP-2 0.908±0.087a
7 Control
Scaffold
1.173±0.105a
1.112±0.010a
Scaffold+BMP-2 1.228±0.010a
8 Control
Scaffold
1.201±0.105a
1.120±0.010a
Scaffold+BMP-2 1.327±0.010a
9 Control
Scaffold
1.162±0.105a
1.143±0.010a
Scaffold+BMP-2 1.329±0.010a
10 Control
Scaffold
1.251±0.147a
1.188 0.138b
Scaffold+BMP-2 1.480±0.130ab
11 Control
Scaffold
1.267 0.147a
1.345 0.137a
Scaffold+BMP-2 1.368 0.130a
12 Control
Scaffold
1.197 0.147a
1.323±0.137a
Scaffold+BMP-2 1.461 0.130a

82
Figure 3-4. Computed tomography (CT).
Performed after humane euthanasia at each time end point once the locking plate had been removed. 3D reconstructed anterior
posterior and medial to lateral projections are provided at each time end point. A region of interest was drawn over the scaffold
material (with or without BMP-2) and density was calculated in Hounsfield units. On average the density of the scaffold was
less in group BMP-2 goats (612.17HU ±50.44) as compared to Scaffold goats (854.61HU ± 47.45) proving better osseo-
integration of the material with the addition of BMP-2.
Group 3 Months 6 Months 9 Months 12 Months
3D AP Medial AP Medial AP Medial AP Medial
Scaffold
Scaffold
+BMP-2

83
Figure 3-5. Von Kossa (percent mineralization) staining.
A) There was no significant difference in the percent mineralization between groups. B) Although there was no significant
difference in percent mineralization over time, the amount of mineralization appears to follow a bone remodeling curve in that
it initially increases as the ostectomy gap is filled with new bone that is then remodeled. C) Von Kossa stained samples where
black represents mineralized bone. In Scaffold and BMP-2 goats, the scaffold took staining indicating the presence of
mineralized bone. Scale bar, 1000 μm.
A
B C

84
Figure 3-6. Goldner’s Trichrome (percent osteoid) staining.
There was a significant difference in the percent mineralization between groups (P<0.05) in that on average Scaffold and BMP-
2 goats had greater percent osteoid formation (6.96±0.46% and 6.97±0.46%) as compared to Control goats (3.67±0.48%) B)
There was a significant difference in osteoid staining over time, in that the osteoid percentage of area in the ostectomy gap
decreased over time, with a slight increase at 9 months then final decrease at 12 months regardless of group [(3-6.79±0.55%a,
(6)-5.67±0.55ab, (9)-6.36±0.53%a, (12)-4.63±0.54b]. C) Goldner’s Trichrome stained samples where green represents
mineralized bone and light pink represents osteoid. Scale bar, 1000 μm.
A
B
C

85
Figure 3-7. The average osteoclast count per mm of bone surface.
There was a group by month interaction in that the average osteoclast count decreased
over time for Scaffold and BMP-2 goats, while the average osteoclast count remained
static for Control goats (P<0.05).

86
Table 3-4. Group x Time point interactions for average osteoclast count per mm of
bone surface.
Month Group Mean ± SE
3 Control
Scaffold
0.104±0.800a
8.094±0.800a
Scaffold+ BMP-2 5.156±0.800a
6 Control
Scaffold
0.104±0.800a
2.946±0.740b
Scaffold+ BMP-2 5.547±0..979a
9 Control
Scaffold
0.104±0.800a
2.991±0.740b
Scaffold+ BMP-2 1.172±0.979b
12 Control
Scaffold
0.104±0.800a
0.563±0.875c
Scaffold+ BMP-2 0.417±0.799b

87
CHAPTER 4. CHARACTERIZATION OF POST-OPERATIVE HYPERTROPHIC
OSTEOMYELITIS INDUCED BY STAPHYLOCOCCUS AUREUS

88
Abstract
This study used phenotypic tests and whole genome sequencing to characterize a
collection of Staphylococcus aureus isolates from goats with clinical evidence of
osteomyelitis following tibial ostectomy. S. aureus positive goats with clinical evidence
of osteomyelitis were evaluated based on radiographic and histomorphometric analysis
for phenotypic evidence of proliferative bone production. Isolates were identified using
biochemical analysis combined with MLST of S. aureus in whole genome sequence-
based contigs. All isolates were noted to be ST 398 and S. aureus infected goats were
noted to have proliferative bone reaction. Further investigation into potential unique
virulence factors of ST 398 and its relationship with osteoblast physiology is warranted.
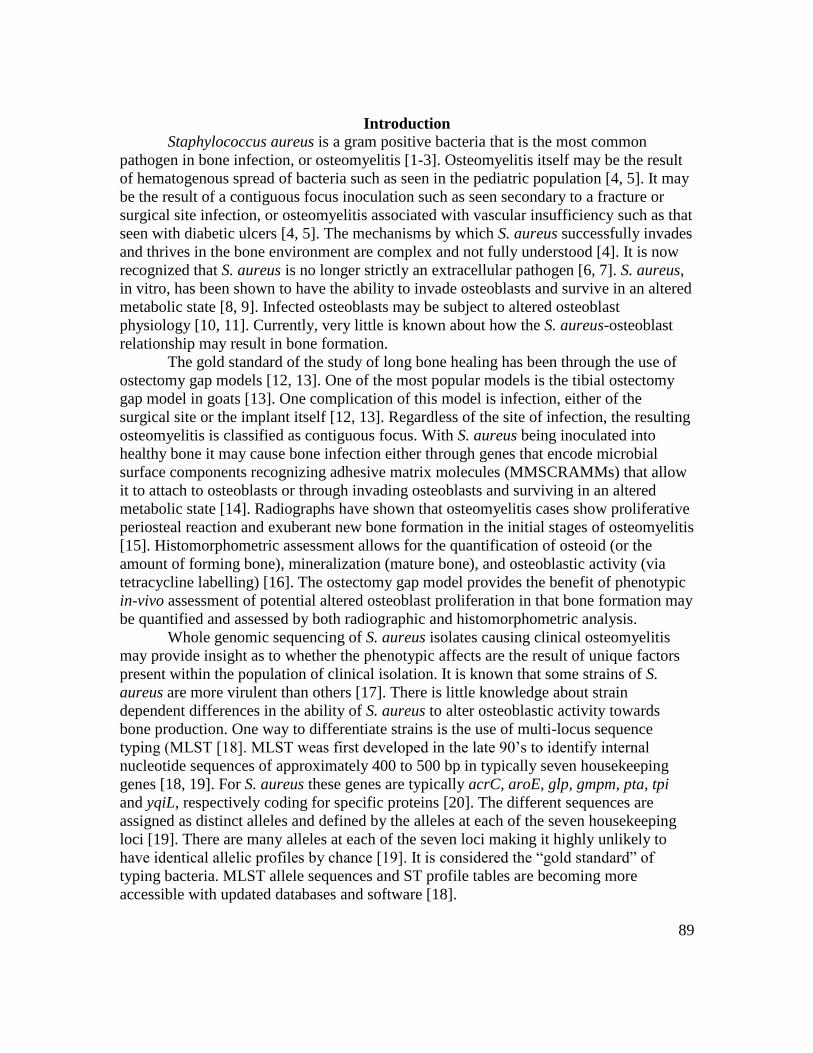
89
Introduction
Staphylococcus aureus is a gram positive bacteria that is the most common
pathogen in bone infection, or osteomyelitis [1-3]. Osteomyelitis itself may be the result
of hematogenous spread of bacteria such as seen in the pediatric population [4, 5]. It may
be the result of a contiguous focus inoculation such as seen secondary to a fracture or
surgical site infection, or osteomyelitis associated with vascular insufficiency such as that
seen with diabetic ulcers [4, 5]. The mechanisms by which S. aureus successfully invades
and thrives in the bone environment are complex and not fully understood [4]. It is now
recognized that S. aureus is no longer strictly an extracellular pathogen [6, 7]. S. aureus,
in vitro, has been shown to have the ability to invade osteoblasts and survive in an altered
metabolic state [8, 9]. Infected osteoblasts may be subject to altered osteoblast
physiology [10, 11]. Currently, very little is known about how the S. aureus-osteoblast
relationship may result in bone formation.
The gold standard of the study of long bone healing has been through the use of
ostectomy gap models [12, 13]. One of the most popular models is the tibial ostectomy
gap model in goats [13]. One complication of this model is infection, either of the
surgical site or the implant itself [12, 13]. Regardless of the site of infection, the resulting
osteomyelitis is classified as contiguous focus. With S. aureus being inoculated into
healthy bone it may cause bone infection either through genes that encode microbial
surface components recognizing adhesive matrix molecules (MMSCRAMMs) that allow
it to attach to osteoblasts or through invading osteoblasts and surviving in an altered
metabolic state [14]. Radiographs have shown that osteomyelitis cases show proliferative
periosteal reaction and exuberant new bone formation in the initial stages of osteomyelitis
[15]. Histomorphometric assessment allows for the quantification of osteoid (or the
amount of forming bone), mineralization (mature bone), and osteoblastic activity (via
tetracycline labelling) [16]. The ostectomy gap model provides the benefit of phenotypic
in-vivo assessment of potential altered osteoblast proliferation in that bone formation may
be quantified and assessed by both radiographic and histomorphometric analysis.
Whole genomic sequencing of S. aureus isolates causing clinical osteomyelitis
may provide insight as to whether the phenotypic affects are the result of unique factors
present within the population of clinical isolation. It is known that some strains of S.
aureus are more virulent than others [17]. There is little knowledge about strain
dependent differences in the ability of S. aureus to alter osteoblastic activity towards
bone production. One way to differentiate strains is the use of multi-locus sequence
typing (MLST [18]. MLST weas first developed in the late 90’s to identify internal
nucleotide sequences of approximately 400 to 500 bp in typically seven housekeeping
genes [18, 19]. For S. aureus these genes are typically acrC, aroE, glp, gmpm, pta, tpi
and yqiL, respectively coding for specific proteins [20]. The different sequences are
assigned as distinct alleles and defined by the alleles at each of the seven housekeeping
loci [19]. There are many alleles at each of the seven loci making it highly unlikely to
have identical allelic profiles by chance [19]. It is considered the “gold standard” of
typing bacteria. MLST allele sequences and ST profile tables are becoming more
accessible with updated databases and software [18].
90
While MLST has typically been used to classify strains of S. aureus in community
acquired cases of methicillin resistant staphylococcus aureus, it can also be used to
classifty isolates in an understandable and comparable global context [18]. Work has yet
to be done that defines MLST of strains S. aureus as they relate to potential proliferative
bone formation cases of osteomyelitis. The aims of this study was to investigate whether
clinical cases of osteomyelitis from goats with a tibial ostectomy gap showed phenotypic
evidence of proliferative osteoblastic bone production and if the S. aureus isolated from
these cases were unique in terms of multilocus sequence typing.
Materials and Methods
Case Population
All experimental procedures and protocols were approved by the animal care and
use committee (University of Tennessee IACUC 2383). From a larger study of 105 goats
(Chapter III) that had undergone a 2.5 cm tibial ostectomy that was repaired with a
4.0mm locking plate, a total of thirteen goats developed clinical evidence of osteomyelitis
(dehiscence and/or infection of the surgical site with initial proliferative bone formation)
and were pre-emptively available for inclusion. Of these thirteen, eleven cultured S.
aureus based on biochemical identification.
Radiographs were performed immediately post-operatively and then monthly until
end points (NEXT Equine DR, Sound, Carlsbad, CA., USA). Radiographs were scored
by a board certified radiologist to assess ostectomy gap filling and the presence of
hypermineralization (excessive periosteal reaction; Table 4-1).4
Upon diagnosis of osteomyelitis, goats were subjected to humane euthanasia.
Tibia segments were trimmed and placed in 95% ethanol. Using an automated tissue
processor (ASP300S, Leica, Germany) tissues were dehydrated in a series of ethanol
solutions of increasing concentration (70%, 80%, 95% x2, 100% x3) over a period of
several days at ambient temperature and a programmed auto-cycle of pressure, vacuum,
and gentle agitation. Specimens were next transferred to three separate exchanges of
100% Methyl Salicylate (Sigma-Aldrich, St. Louis, MO) over the course of 48-72 hours,
manually cycled between gentle agitation (modified stir bar setup) and vacuum at -15-20
in Hg (Fisherbrand, Vacuum Chamber), and observed for complete dehydration.
Specimens were transferred to 100% xylenes (Sigma-Aldrich, Histological Grade, St.
Louis, MO) for a quick rinse before being placed back onto the automated tissue
processor (ASP300S, Leica, Germany) for three changes of 100% xylenes to complete
the tissue clearing and prepared for methyl methacrylate resin infiltration. Specimens
were then manually managed through three separate and fresh in-house prepared
Infiltration Solution (IS I, IS II, IS III) exchanges of methyl methacrylate (Sigma-
Aldrich, St. Louis, MO) and dibutyl phthalate (Sigma-Aldrich, St. Louis, MO), under
ambient temperature over the course of 1.5 - 2 weeks, and with a manually cycled switch
4 All figures and tables for this chapter are presented in the appendix.

91
between gentle agitation (modified stir bar setup) and vacuum @ -15-20 in Hg
(Fisherbrand, Vacuum Chamber).
After a satisfied period of resin infiltration, specimens were transferred to
prelabelled polypropylene containers and pre-polymerized base molds, where a fourth
and in-house prepared final resin solution was then added along with a benzoyl peroxide
based catalyst (Perkadox-16, AKZO Nobel Chemicals, Chicago, IL) to initiate a
polymerization reaction to cure each specimen into a bubble free, clear, hardened, methyl
methacrylate (MMA) block over a period of approximately 5-8 days. Each specimen
block was then trimmed using a wet bandsaw (MarMed Bone Wet Band Saw) so that
resulting microtomed sections would fit onto pre-cleaned 50mm x 75mm glass
microscope slides (Fisherbrand). Specimen blocks were shaped for microtomy and
sections cut at five microns using a motorized SM2500 sledge microtome (Leica,
Germany) and d-profile (sledge) tungsten-carbide knives (Delaware Diamond Knives).
Each section cut was mounted to an individual 50mm x 75mm precleaned glass
microscope slide (Fisherbrand) that was coated with an in-house gelatin based solution
recipe (Haupt’s Solution) and covered with a plastic protective strip. Prior to staining,
slide-sections from each specimen were sorted for fluorescence microscopy, VonKossa
staining or Goldner’s Trichrome staining. Prior to staining, all sections were deplasticized
in a similar fashion that traditional paraffin sections would be deparaffinized so that all
tissue components can be uninhibited during staining molecule interactions.
To quantitatively assess the percentage of mineralization (VonKossa), osteoid
formation (Goldner's Trichrome), gross images from each slide were grossly acquired
and digitized using a Panasonic HC-V770 (picture size 8M, 3264x2448, aspect ratio 4:3,
extra optical zoom 20x) and processed in ImageJ (Rasband, W.S., Image J, U.S. National
Institutes of Health, Bethesda Maryland, USA, https://imagej.nih.gov/ij/, 1997-2018.).
For percentage mineralization, images were made binary such that mineralized bone was
the parameter quantitatively assessed. For osteoid formation, images were made binary
such that osteoid was the quantitatively assessed parameter. Unstained sections were
evaluated by fluorescence microscopy with an excitation filter and two stop filters
allowing radiation with a wavelength between 490 and 520 nm that permitted the
identification and morphometric analysis of the mineralizing surface of bone.
Bacterial Isolates and Culture Methods
All experimental procedures and protocols were approved by the animal care and
use committee (University of Tennessee IACUC 2383). From October 2017 to December
2018 a total of 12 nonduplicate bacterial isolates were collected from tibial ostectomy
sites from 10 goats in a project unrelated to this study. All strains were collected
aseptically, transferred into Amies gel without charcoal (BBL CultureSwab Plus 220116,
USA) and directly plated.
Isolation and Phenotypic Identification of Staphylococcus aureus
Each isolated bacterial sample from Amies media was initial evaluated on
Columbia blood (5% sheep blood) agar (Reme, R01217, USA) and CNA
(colistin/naladixic acid with 5% sheep blood) agar (Remel, R01322, USA), incubated at
35 degrees Celcius in 5% CO2. Additionally samples were evaluated on MacConkey II

92
(Remel, R01552, USA) and thioglycollate broth (Remel, R453452, USA), incubated at
35 degrees Celsius in ambient room temperature for 24 hours.
Tube coagulase (rabbit plasma), phenol red broth with trehalose, phenol red broth
with lactose, and Vogues Proskaur (VP) broth were performed on all beta-hemolytic
gram positive cocci. All biochemical were incubated at 35 degrees Celsius in ambient
room temperature and read at 14 hours with the exception of VP which was read at 48
hours. For S. aureus, all biochemical had a positive reaction. Susceptibility testing was
performed on 18-24 hours isolates via disc diffusion (Remel discs, USA).
Genomic analysis
Of the 11 goats that cultured S. aureus, one was unavailable for whole genome
sequencing. In two goats, two unique strains of S. aureus were cultured and each strain
was sequenced separately. This left a total of 12 strains of S. aureus available for whole
genomic analysis from 10 goats with clinical evidence of osteomyelitis.
A single bacterial colony of each strain, grown on blood agar plates, was
inoculated into 5 mL of sterile Trypticase soy broth (TSB) and incubated overnight at 37
C with shaking at 225 rpm using an Excella E24 incubator shaker (New Brunswick
Scientific, USA). DNA was extracted using the MasterPure DNA purification kit
(Epicentre, USA) according to the manufacturer’s instructions.
Sequencing libraries were constructed using the Nextera DNA sample prep kit
(Illumina, Inc., USA) according to the manufacturer’s instructions for all strains. Initially
four sequences were sequenced using a MiSeq platform (Illumina, Inc) with a single-end
read length of 150 bp at the University of Tennessee Genomics Core facility, the results
of which were published (Abouelkhair, 2018). Following this, the remaining sequences
were sequenced using a HiSeq platform with paired-end read length of 150 bp at
Novogene (Sacramento, CA, USA). All sequences were trimmed with Trimmomatic
v.039, assembled using SPAdes (v3.14.0) and annotated using the Kbase version of
Prokka (v1.12). For MLST the data base at the University of Oxford
(https://pubmlst.org/saureus) for whole-genome multilocus sequence typing was used.
Statistical analysis
The case matching population was not large enough to make statistical
comparisons therefore results are limited to descriptive terms only and reported as means
± standard deviation (STD). Raw descriptive data of each strain of osteomyelitis is
provided in Table 4-2.
Results
Radiographic Analysis
One goat was removed from analysis due to an incomplete data set (lack of whole
genomic sequencing data). This left 10 goats available for radiographic analysis. In
regards to ostectomy gap filling, eight of the ten (80%) S. aureus goats had an ostectomy
gap healing score of less than 2 (or new bone filling of less than 25% of the ostectomy
gap). Only two out of ten (20%) showed a healing score of greater than 2. If the influence
of the biomaterial was removed, and only goats with a negative control gap were
evaluated, five out of seven (71%) of goats showed healing scores of less than 2, while
93
two out of 7 (29%) showed healing scores greater than 2. When compared back to the
general population of goats as a whole, if the influence of the biomaterial was removed,
S. aureus goats were able to show comparable scores to their uninfected counterparts
(Chapter III). Based on descriptive radiographic analysis, S. aureus goats showed prolific,
irregular, and palisading periosteal reactions (Fig 4-1).
Histomorphometric Analysis
A total of 5 goats had complete data sets available for histomorphometic analysis
with case matched controls. For Goldner’s Trichrome staining, or percent osteoid
formation, S. aureus goats showed a percent osteoid formation of 12.94% ± 2.35. In
terms of percent mineralization, or VonKossa staining, S. aureus goats showed
mineralization of 49.46% ± 16.37. Finally, when evaluating the percent fluorescence or
the amount of osteoblastic activity, S. aureus goats showed osteoblastic activity of 2.52%
± 3.18. When compared to back to the greater population, this appears to be an increase
in osteoid formation, mineralization, and osteoblastic activity (Fig 4-2).
Genomic Analysis
The number of contigs, G=C content values, and the total lengths of the draft
genome sequences for the clinical isolates of S. aureus are listed in Table 4-3. For HiSeq
reads, a subset of the whole genomic sequence was taken such that there was 40x
coverage of the genome. Additionally the number of predicted coding sequences as
estimated by KBase are provided. All isolates were identified as sequence type (ST) 398
based on multi-locus sequence typing.
Discussion
We discovered that goats, from an unrelated orthopedic study, infected with S.
aureus ST 398 were prone to develop a substantial amount of bone formation associated
with osteomyelitis. It was observed that ST 398 is putatively capable of causing bone
formation. Up until this point, it has been thought that proliferative amount of bone has
been due to contiguous-focus osteomyelitis due to the fact that the resulting cases of
spontaneous osteomyelitis occurred after surgery (direct trauma). Contiguous focus
osteomyelitis may provide a key insight into how S. aureus able to infect healthy bone
[21]. The exact mechanism that resulted in the exuberant bone formation after SA
infection with this ST remains to be determined.
One way to further investigate the potential impact of these clinical isolates is
further bioinformatics analysis. S. aureus clinical strains could be compared back to
known S. aureus inducting strains of osteomyelitis and non-osteomyelitis inducing
strains. This would allow functional annotation comparisons and comparisons between
virulence databases. Assemblies could be subjected to whole genome alignment to detect
any difference between the clinical isolates [22]. Alternatively, functional annotation and
virulence databases could be compared on a variety of platforms [23-27]. One phenotypic
assessment that maybe due to virulence factors or unknown proteins maybe made in that
proliferative bone formation, or hypermineralization was associated with surgical site
infection. If no surgical site infection was present, the bone tended follow the more

94
typical appearance of osteolytic or bone loss associated with osteomyelitis if cases those
cases were allow to progress beyond one month of observation [1].
Previous studies have investigated bone formation as a radiographic parameter of
osteomyelitis [15]. There results proved that bone formation is a constant and early
feature of osteomyelitis, and has the strongest association to microbiological results [15].
However, these studies have not attempted to classify whether the amount of bone
formation is sequence-dependent [15]. While not statistically significant, if the effect of
the biomaterial was removed the S. aureus goats showed equivocal healing to case
matched controls. The effect of the biomaterial in the presence of infection is not known.
Currently work is being done with the biomaterial as both an antibiotic eluting device and
bone regeneration scaffold which may have altered the results of ostectomy gap healing
[20]. The bone formation seen radiographically was confirmed with histomorphometry.
Tetracycline labelling binds reforming bone [16]. While not significant, the amount of
remodeling bone was greater in S. aureus goats as compared to controls. Further wok
investigating whether this is a direct cause and an effect is needed. It is not known
whether the proliferative bone reaction as the result of the immune system attempt to deal
with the suspected internalized S. aureus or whether this was a direct effect of the S.
aureus- osteoblast relationship.
Major evolutionary changes in the ST 398 lineage have occurred over time [29].
The first being a widening infection spectra of these bacteria to humans livening in
animal-free environments, and second an increase in its intrinsic virulence capacity [30,
31]. One important study has shown that methicillin sensitive S. aureus ST 398 is easily
transmissible among humans [30]. Additionally, its genome is well adapted to the human
host [30]. Unfortunately, this study only compared ST 398 strains found in humans to
livestock associated methicillin resistant strains of S. aureus ST 398 [30]. There remains
a gap in knowledge as to how S. aureus ST 398 relates to known contiguous-focus
inducing OM strains of SA, and whether increased bone formation is the result of unique
factors (ex; genes, pathogenecity islands, virulence factors).

95
References

96
1. Tong, S. Y., Davis, J. S., Eichenberger, E., Holland, T. L., & Fowler, V. G.
(2015). Staphylococcus aureus infections: epidemiology, pathophysiology,
clinical manifestations, and management. Clinical microbiology reviews, 28(3),
603-661.
2. Kavanagh, N., Ryan, E. J., Widaa, A., Sexton, G., Fennell, J., O'Rourke, S., ... &
Kerrigan, S. W. (2018). Staphylococcal osteomyelitis: disease progression,
treatment challenges, and future directions. Clinical microbiology reviews, 31(2),
e00084-17.
3. Sheehy, S. H., Atkins, B. A., Bejon, P., Byren, I., Wyllie, D., Athanasou, N. A., ...
& McNally, M. A. (2010). The microbiology of chronic osteomyelitis: prevalence
of resistance to common empirical anti-microbial regimens. Journal of Infection,
60(5), 338-343.
4. Muthukrishnan, G., Masters, E. A., Daiss, J. L., & Schwarz, E. M. (2019).
Mechanisms of Immune Evasion and Bone Tissue Colonization That Make
Staphylococcus aureus the Primary Pathogen in Osteomyelitis. Current
osteoporosis reports, 17(6), 395-404.
5. Waldvogel, F. A., Medoff, G., & Swartz, M. N. (1970). Osteomyelitis: a review
of clinical features, therapeutic considerations and unusual aspects. New England
Journal of Medicine, 282(5), 260-266.
6. Tucker, K. A., Reilly, S. S., Leslie, C. S., & Hudson, M. C. (2000). Intracellular
Staphylococcus aureus induces apoptosis in mouse osteoblasts. FEMS
microbiology letters, 186(2), 151-156
7. Hudson, M. C., Ramp, W. K., Nicholson, N. C., Williams, A. S., & Nousiainen,
M. T. (1995). Internalization ofStaphylococcus aureusby cultured osteoblasts.
Microbial pathogenesis, 19(6), 409-419.
8. Shi, S., & Zhang, X. (2012). Interaction of Staphylococcus aureus with
osteoblasts. Experimental and therapeutic medicine, 3(3), 367-370.
9. Proctor, R. A., Von Eiff, C., Kahl, B. C., Becker, K., McNamara, P., Herrmann,
M., & Peters, G. (2006). Small colony variants: a pathogenic form of bacteria that
facilitates persistent and recurrent infections. Nature Reviews Microbiology, 4(4),
295.
10. Wright, J. A., & Nair, S. P. (2010). Interaction of staphylococci with bone.
International journal of medical microbiology, 300(2-3), 193-204.
11. Loi, F., Córdova, L. A., Pajarinen, J., Lin, T. H., Yao, Z., & Goodman, S. B.
(2016). Inflammation, fracture and bone repair. Bone, 86, 119-130.
12. Reichert, J. C., Saifzadeh, S., Wullschleger, M. E., Epari, D. R., Schütz, M. A.,
Duda, G. N., ... & Hutmacher, D. W. (2009). The challenge of establishing
preclinical models for segmental bone defect research. Biomaterials, 30(12),
2149-2163.

97
13. Reichert, J. C., Epari, D. R., Wullschleger, M. E., Saifzadeh, S., Steck, R., Lienau,
J., ... & Hutmacher, D. W. (2010). Establishment of a preclinical ovine model for
tibial segmental bone defect repair by applying bone tissue engineering strategies.
Tissue Engineering Part B: Reviews, 16(1), 93-104.
14. Smeltzer, M. S. (2000). Characterization of staphylococcal adhesins for adherence
to host tissues. In Handbook of Bacterial Adhesion (pp. 411-444). Humana Press,
Totowa, NJ.
15. Kraft, C. N., Schlegel, U., Pfluger, D., Eijer, H., Textor, J., Hansis, M., & Arens,
S. (2001). Radiological signs of osteitis around extramedullary metal implants.
Archives of orthopaedic and trauma surgery, 121(6), 338-342.
16. Compston, J., Skingle, L., & Dempster, D. W. (2018). Bone histomorphometry.
In Vitamin D (pp. 959-973). Academic Press.
17. Feil, E. J., Cooper, J. E., Grundmann, H., Robinson, D. A., Enright, M. C.,
Berendt, T., ... & Moore, C. E. (2003). How clonal is Staphylococcus aureus?.
Journal of bacteriology, 185(11), 3307-3316.
18. Larsen, M. V., Cosentino, S., Rasmussen, S., Friis, C., Hasman, H., Marvig, R. L.,
... & Lund, O. (2012). Multilocus sequence typing of total-genome-sequenced
bacteria. Journal of clinical microbiology, 50(4), 1355-1361.
19. Enright, M. C., Day, N. P., Davies, C. E., Peacock, S. J., & Spratt, B. G. (2000).
Multilocus sequence typing for characterization of methicillin-resistant and
methicillin-susceptible clones ofStaphylococcus aureus. Journal of clinical
microbiology, 38(3), 1008-1015.
20. Kuhn, G., Francioli, P., & Blanc, D. S. (2006). Evidence for clonal evolution
among highly polymorphic genes in methicillin-resistant Staphylococcus aureus.
Journal of bacteriology, 188(1), 169-178.
21. Lew, D. P., & Waldvogel, F. A. (1997). Osteomyelitis. New England Journal of
Medicine, 336(14), 999-1007.
22. Chen, I.-M. A., Chu, K., Palaniappan, K., Pillay, M., Ratner, A., Huang, J., …
Kyrpides, N. C. (2019). IMG/M v.5.0: an integrated data management and
comparative analysis system for microbial genomes and microbiomes. Nucleic
Acids Research, 47(D1), D666–D677. https://doi.org/10.1093/nar/gky901
23. Kanehisa, M., Furumichi, M., Tanabe, M., Sato, Y., & Morishima, K. (2017).
KEGG: new perspectives on genomes, pathways, diseases and drugs. Nucleic
Acids Research, 45(D1), D353–D361. https://doi.org/10.1093/nar/gkw1092
24. Tatusov, R. L., Galperin, M. Y., Natale, D. A., & Koonin, E. V. (2000). The COG
database: a tool for genome-scale analysis of protein functions and evolution.
Nucleic Acids Research, 28(1), 33–36.
25. Finn, R. D., Bateman, A., Clements, J., Coggill, P., Eberhardt, R. Y., Eddy, S. R.,
… Punta, M. (2014). Pfam: the protein families database. Nucleic Acids Research,
42(D1), D222–D230. https://doi.org/10.1093/nar/gkt1223
98
26. Liu, B., Zheng, D., Jin, Q., Chen, L., & Yang, J. (2019). VFDB 2019: a
comparative pathogenomic platform with an interactive web interface. Nucleic
Acids Research, 47(D1), D687–D692. https://doi.org/10.1093/nar/gky1080
27. Yoon, S. H., Park, Y.-K., & Kim, J. F. (2015). PAIDB v2.0: exploration and
analysis of pathogenicity and resistance islands. Nucleic Acids Research,
43(Database issue), D624–D630.
28. Beenken, KE, Alghazali, K., Campbell MJ, Rifkin, RE, Hecht, S., Ramire…
“Evaluation of a polyurethane-based bone regenartion scaffold for local antibiotic
delivery to prevent Staphyloccocus aureus infection in a contaminated segmental
bone defect.” Bone Showcase, 2020. University of Arkansas at Little Rock.
29. Busche, T., Hillion, M., Van Loi, V., Berg, D., Walther, B., Semmler, T., ... &
Holmes, M. A. (2018). Comparative Secretome Analyses of Human and Zoonotic
Staphylococcus aureus Isolates CC8, CC22, and CC398. Molecular & Cellular
Proteomics, 17(12), 2412-2433. Fischer, B., Vaudaux, P., Magnin, M., El
Mestikawy, Y., Vasey, H., Lew, D. P., & Proctor, R. A. (1996). Novel animal
model for studying the molecular mechanisms of bacterial adhesion to bone‐
implanted metallic devices: Role of fibronectin in Staphylococcus aureus
adhesion. Journal of orthopaedic research, 14(6), 914-920.
30. Senneville, E., Brière, M., Neut, C., Messad, N., Lina, G., Richard, J. L., ... &
French Study Group on the Diabetic Foot. (2014). First report of the
predominance of clonal complex 398 S taphylococcus aureus strains in
osteomyelitis complicating diabetic foot ulcers: a national F rench study. Clinical
Microbiology and Infection, 20(4), O274-O277.

99
Appendices

100
Table 4-1. Radiographic scoring for assessment of ostectomy gap filling.
Ostectomy Gap Filling Score
No interval change compared to immediate post-
operative radiographs
0
New bone filling <25% of ostectomy gap 1
New bone filling 26-50% of ostectomy gap 2
New bone filling 51-75% of ostectomy gap 3
New bone filling >75% of ostectomy gap but not
completely healed
4
Ostectomy gap completely filled and/or bridging
callus present on all cortices
5

101
Table 4-2. Descriptive data of each strain of osteomyelitis subjected to whole
genomic sequencing.
MLS typing was done with the data base from the University of Oxford
Strain MLST Biomaterial Surgical Site
Infection
Hypermineralization
MI 18-33 398 Yes Yes Yes
MI 18-34 398 No Yes Yes
MI 18-935
398 No Yes Yes
MI 18-1974 398 No Yes Yes
MI 18-4421 398 Yes No No
MI 18-3926a 398 Yes No No
MI 18-3225 398 No No No
MI 18-2814a 398 No Yes Yes
MI 18-2814b 398 No Yes Yes
MI 18-3857 398 Yes No No
MI 18-2759 398 No Yes Yes
MI 18-3926b 398 Yes No No

102
Figure 4-1. Radiographic ostectomy gap filling of an S. aureus goat and a case
comparsion.
S. aureus goats consistently showed prolific, irregular and palisading periosteal reactions.
S. aurues
1 Month
S. aureus
1 Month
Case Comparison
1 Month
Case Comparison
1 Month

103
Figure 4-2. Tetracycline labelling of an S. aureus goat and a case comparsion.
The amount of fluorsence (% area) was greater in S. aureus goats as compared to case
matched controls.
S. aureus Case Comparison

104
Table 4-3. Bioinformatic data from S. aureus isolates subjected to whole genomic sequencing.
Strain MI18_
935
MI18_
1974
MI18
_33
MI1
8_34
S1 S2 S3 S4 S5 S6 S7 S8
# of contigs 56 54 60 54 38 41 36 50 43 43 26 38
Genome
Length
(bp)
2,819,
698
2,819,
900
2,819
,224
2,81
9,89
0
2,823
,232
2,785,
957
2,759,
738
2,744,
959
2,772,
319
2,771,
634
2,739,
302
2,786
,630
G=C
content (%)
32.9 32.9 32.9 32.9 32.9 32.9 32.9 32.9 32.9 32.8 32.8 32.8
# of
predicted
coding
sequences
2629 2632 2629 2627 2639 2641 2559 2531 2577 2580 2532 2588

105
CHAPTER 5. CONCLUSIONS AND FUTURE RESEARCH

106
Conclusions
The above work comprised in these chapters represents research conducted to
evaluate the long-term effect of a three dimensional synthetic bone regeneration scaffold,
with and without the addition of BMP-2. The scaffold was implanted into a large
segmental bone defect to assess the inherent and enhanced capability to promote bone
formation. Additionally, when complications of osteomyelitis arose, clinical cases were
compared to their case matched controls and bacteria subjected to biochemical
identification and whole genomic sequencing.
Few large animal preclinical models extend beyond a ninety day time period,
have the capacity to look at bone regeneration, and are translatable to humans [1-4].
Challenges associated with long-term preclinical large animal models include the ability
to assess animal comfort, an animal’s tolerance to captivity, availability of the animal,
society’s acceptance of the animal model, and the animal’s tolerance to captivity and the
ease of housing [5-7]. Goats are often chosen for orthopedic research due to their ability
to meet all of these needs [8-11].
Currently subjective visual assessment of gait is the standard of care in practice to
assess lameness, and there appears to be no validated standards for objective gait analysis
in goats [12-19]. The results of chapter II allowed for an objective baseline to be made.
Quantitative gait assessment of biometric forces during ambulation in goats free of
lameness using a pressure-sensing mat allowed for objective measurements of the
animal’s comfort during the long-term study.
While a wide variety of synthetic materials have been researched in effort to
improve healing of debilitating fractures, no synthetic material has yet to be better than
the gold standard autograft [20]. A 3D biomaterial from our lab has undergone extensive
in-vitro and small animal in-vivo assessments. A tibial segmental defect model in the
goat was chosen for the large animal preclinical model as discussed in chapter III. The
results of the study demonstrated the effectiveness of the material when combined with
the growth factor BMP-2. Additionally, the “negative” control gap turned into a positive
control as controls goats showed ostectomy gap healing. This provided a bone-healing
model for cmparison of osseo-integration of the synthetic based material.
Finally, bone infection is a complication of any orthopedic procedure [21, 22]. In
our population of S. aureus goats, all strains were identified as sequence type 398 based
on multilocus sequence typing after whole genomic sequencing. The phenotypic change
of proliferative bone was found prompting potential for further investigation as to how S.
aureus ST 398 may result in increased bone formation associated with osteomyelitis.
Future Research
The need for large animal preclinical models and evaluation of their most
common complication, osteomyelitis, is complex. To expand the large animal preclinical
model, work needs to be done for rehabilitation not only of the bone but of the whole
limb in order to assess full return of function. The preclinical model presented here
provides the advantage of potentially being able to remove the locking plate once the
bone has healed to further assess osseo-integration.
107
Finally, the proliferative amount of bone associated with early osteomyelitis has
been of particular interest to me. It remains to be seen whether this is associated with
strain specific differences of S.aureus, and if it is truly an effect of S. aureus on
osteoblast physiology. The results of such work may identify preventive and therapeutic
targets for S. aureus prior to its devastating consequences of bone loss osteomyelitis.

108
References
109
1. Pearce, A. I., Richards, R. G., Milz, S., Schneider, E., & Pearce, S. G. (2007).
Animal models for implant biomaterial research in bone: a review. Eur Cell
Mater, 13(1), 1-10.
2. McGonigle, P., & Ruggeri, B. (2014). Animal models of human disease:
challenges in enabling translation. Biochemical pharmacology, 87(1), 162-171.
3. Van der Worp, H. B., Howells, D. W., Sena, E. S., Porritt, M. J., Rewell, S.,
O'Collins, V., & Macleod, M. R. (2010). Can animal models of disease reliably
inform human studies?. PLoS medicine, 7(3), e1000245.
4. Hackam, D. G., & Redelmeier, D. A. (2006). Translation of research evidence
from animals to humans. Jama, 296(14), 1727-1732
5. Flower FC, Sanderson DJ, Weary DM. Hoof pathologies influence kinematic
measures of dairy cow gait. J Dairy Sci. 2005;88(9):3166-3173. doi:
10.3168/jds.S0022-0302(05)73000-9.
6. Flower FC, Weary DM. Gait assessment in dairy cattle. Animal. 2009;3(1):87-95.
7. Black LL, Gaynor J, Gahring D, Adams C, Aron D, Harman S, et al. Effect of
adipose-derived mesenchymal stem and regenerative cells on lameness in dogs
with chronic osteoarthritis of the coxofemoral joints: a randomized, double-
blinded, multicenter controlled trial. Vet Ther. 2007;8(4):272-284.
8. Harvey EJ, Giannoudis PV, Martineau PA, Lansdowne JL, Dimitriou R, Moriarty
TF, et al. Preclinical animal models in trauma research. J Orthop Trauma.
2011;25(8):488-493. doi: 10.1097/BOT.0b013e3182251421.
9. Reichert JC, Saifzadeh S, Wullschleger ME, Epari DR, Schütz MA, Duda GN, et
al. The challenge of establishing preclinical models for segmental bone defect
research. Biomaterials. 2009;30(12):2149-2163. doi:
10.1016/j.biomaterials.2008.12.050.
10. Pearce AI, Richards RG, Milz S, Schneider E, Pearce SG. Animal models for
implant biomaterial research in bone: a review. Eur Cell Mater. 2007;13(1):1-10.
11. Fulton LK, Clarke MS, Farris Jr HE. The goat as a model for biomedical research
and teaching. Ilar J. 1994;1;36(2):21-29.
12. Muri K, Stubsjøen SM, Valle PS. Development and testing of an on-farm welfare
assessment protocol for dairy goats. Anim Welfare. 2013;22(3):385-400.
13. Browning Jr R, Leite-Browning ML, Byars Jr M. Reproductive and health traits
among Boer, Kiko, and Spanish meat goat does under humid, subtropical pasture
conditions of the southeastern United States. J Anim Sci. 2011;89(3):648-660.
doi: 10.2527/jas.2010-2930.
14. Deeming LE, Beausoleil NJ, Stafford KJ, Webster JR, Zobel G. The development
of a reliable 5-point gait scoring system for use in dairy goats. J Dairy Sci.
2018;101(5):4491-4497. doi: 10.3168/jds.2017-13950.
15. Gigliuto C, De Gregori M, Malafoglia V, Raffaeli W, Compagnone C, Visai L, et
al. Pain assessment in animal models: do we need further studies?. J Pain Res.
2014;7:227-236. doi: 10.2147/JPR.S59161.
110
16. Hill NP, Murphy PE, Nelson AJ, Mouttotou N, Green LE, Morgan KL. Lameness
and foot lesions in adult British dairy goats. Vet Rec. 1997;141(16):412-416.
17. Olechnowicz J, Jaśkowski JM. Lameness in small ruminants. Med Weter.
2011;67(11):715-719.
18. Vieira A, Oliveira MD, Nunes T, Stilwell G. Making the case for developing
alternative lameness scoring systems for dairy goats. Appl Anim Behav Sci.
2015;171:94-100.
19. Anzuino K, Bell NJ, Bazeley KJ, Nicol CJ. Assessment of welfare on 24
commercial UK dairy goat farms based on direct observations. Vet Rec.
2010;167(20):774-780. doi: 10.1136/vr.c5892.
20. Fillingham, Y., & Jacobs, J. (2016). Bone grafts and their substitutes. The bone &
joint journal, 98(1_Supple_A), 6-9.
21. Muthukrishnan, G., Masters, E. A., Daiss, J. L., & Schwarz, E. M. (2019).
Mechanisms of Immune Evasion and Bone Tissue Colonization That Make
Staphylococcus aureus the Primary Pathogen in Osteomyelitis. Current
osteoporosis reports, 17(6), 395-404.
22. Waldvogel, F. A., Medoff, G., & Swartz, M. N. (1970). Osteomyelitis: a review
of clinical features, therapeutic considerations and unusual aspects. New England
Journal of Medicine, 282(5), 260-266.
111
VITA
Rebecca Elaine Rifkin, born in February 1988, received her doctorate in
veterinary medicine in May of 2013. She then completed a rotating internship at Pioneer
Equine Hospital followed by a second internship at California Equine Orthopedics. She
was in private practice as a racetrack veterinary at Zimmer Equine Sports Medicine prior
to coming to the University of Tennessee, Knoxville. She was accepted into the
comparative and experimental graduate program in 2016 and began to pursue her PhD
under the mentorship of David Anderson. Her studies focused on in-vivo assessments of
a large animal preclinical model associated with a biomaterial in an ostectomy gap
model. She has written and submitted her dissertation for review for a planned graduation
for the spring of 2020.
During her time in graduate school, Rebecca has published a manuscript as a first
author. This publication constitutes chapter II in this work. In addition to publication, she
has presented a collection of poster and oral presentations at symposia and conferences
hosted by the CEM department at UTK, and the American College of Veterinary
Surgeons (ACVS).