osk holdings bhd 27 annual general meeting · osk holdings bhd 27th annual general meeting...
TRANSCRIPT

OSK Holdings Bhd
27th Annual
General MeetingFinancial Results & Position
Year ended
31 December 2016
19 April 2017

2
Disclaimer• This presentation/document (“presentation”) has been prepared by OSK Holdings
Berhad and its subsidiaries (“OSK Group”). All information contained in this presentation
is published for reference only. Expressions of opinion, forecasts or intentions contained
herein are subject to change without notice and should not be taken as advice or
obligations of the OSK Group. The information in this presentation may differ or be
contrary to the opinions or recommendations expressed by other business areas of the
OSK Group as a result of using different assumptions and criteria.
• The information contained herein is obtained in good faith from sources believed to be
reliable. This document does not purport to contain all of the information that may be
required to evaluate and should not be relied on in connection with any potential
transaction. Neither the OSK Group nor any of its affiliates makes any representation or
warranty, express or implied, as to the accuracy or completeness of the information
contained in this presentation and any liability therefore (including in respect of direct,
indirect or consequential loss or damage) is expressly disclaimed.
• All rights are hereby reserved. The contents of this presentation are confidential and
accordingly may not be reproduced or copied to any unauthorized persons or
incorporated into another document or other materials without the prior written consent
of the OSK Group.

3
Table of Contents
Page no.
• Financial Performance Highlights
• Financial Position Highlights
• Dividends declared/proposed
4
10
13

Financial Performance Highlights
Divider Title (Arial Bold, 36pt)
Option 2 of Divider Slide.
You may use this or any one
of the following title slides at
your discretion.
Please remove this text box
when using the template.

5
Financial Performance Highlights
RM million 2016 2015
2015
(excluding
negative
goodwill)
ChangeChange
(%)
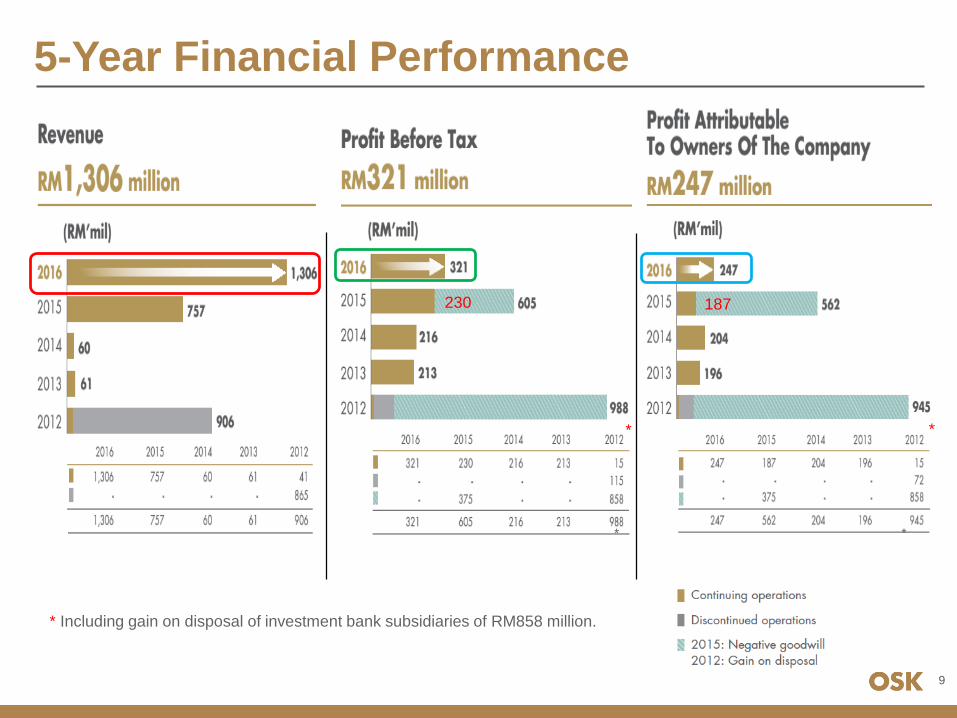
Revenue 1,306 757 757 549 73
Profit Before Tax 321 *605 230 91 40
Share of Profits 149 122 122 27 22
Profit After Tax (PAT) 252 *570 195 57 29
Profit After Tax & Non-
controlling interests247 *562 187 60 32
Earnings per share (sen) 17.86 *49.81 16.52 1.34 8
* Included one-off gains on negative goodwill of RM375.3 million.

6
2016 Financial Performance Highlights
• Revenue increased to RM1,306m by 1.7 times compared to FY2015. The
improvement was mainly contributed by the subsidiary companies, OSK
Property Holdings Berhad (“OSKP”) & PJ Development Holdings Berhad
(“PJD”) acquired in August 2015. (FY2016 represents consolidation of full 12
months results versus 5 months results consolidation in FY2015).
• PAT increased to RM252m from RM195m in FY2015. Note that negative
goodwill recognized in FY2015 of RM375m comprise RM363m from the
acquisition of OSKP & PJD and RM12m from subscription of rights issue in
RHB.

7
Segments Revenue
RM825m
63%
RM14m
1%
RM121m
9%
RM298m
23%
RM44m 4%
RM4m 0%
RM536m
71%RM13m 2%
RM54m
7%
RM114m
15%
RM39m 5%
RM1m
0%
PropertyDevelopment& Investment
Construction
Hospitality
Industries
CapitalFinancing
InvestmentHoldings
2016 2015
RM1,306m RM757m

8
Segments Profit Before Tax
9
5-Year Financial Performance
* Including gain on disposal of investment bank subsidiaries of RM858 million.
* *
* *
230 187

Financial Position Highlights
Divider Title (Arial Bold, 36pt)
Option 2 of Divider Slide.
You may use this or any one
of the following title slides at
your discretion.
Please remove this text box
when using the template.
11
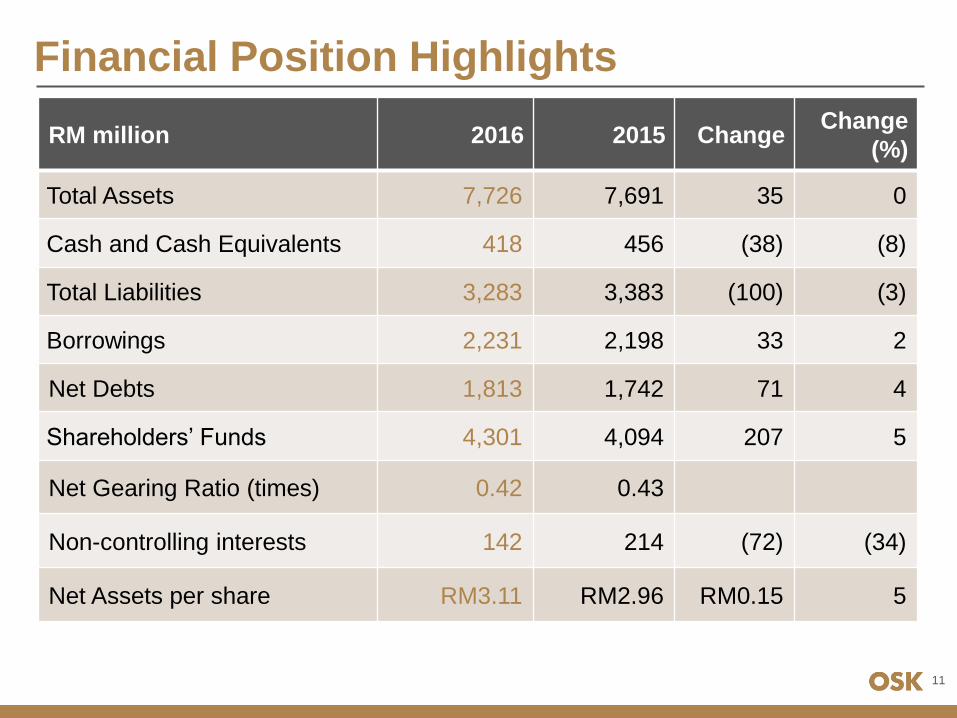
Financial Position Highlights
RM million 2016 2015 ChangeChange
(%)
Total Assets 7,726 7,691 35 0
Cash and Cash Equivalents 418 456 (38) (8)
Total Liabilities 3,283 3,383 (100) (3)
Borrowings 2,231 2,198 33 2
Net Debts 1,813 1,742 71 4
Shareholders’ Funds 4,301 4,094 207 5
Net Gearing Ratio (times) 0.42 0.43
Non-controlling interests 142 214 (72) (34)
Net Assets per share RM3.11 RM2.96 RM0.15 5

12
RM'mil % Segment % RM'mil
3,407 45% Property 44% 3,352
108 1% Construction 2% 109
224 3% Industries 3% 233
501 7% Hospitality 7% 540
3,338 44%
Financial Services &
Investment Holding 44% 3,346
RM'mil % Segment % RM'mil
1,278 41% Property 43% 1,374
130 4% Construction 4% 129
42 1% Industries 1% 39
262 9% Hospitality 8% 273
1,408 45%
Financial Services &
Investment Holding 44% 1,412
Segment Liabilities2016 2015
Segment Assets2016 2015
45%1%
3%
7%
44%
2016
44%
7%
3%
2% 44%
2015
41%4%
1%
9%
45%
2016
44%
8%
1% 4%
43%
2015
Segments Assets and Liabilities

Dividends declared/proposed
Divider Title (Arial Bold, 36pt)
Option 2 of Divider Slide.
You may use this or any one
of the following title slides at
your discretion.
Please remove this text box
when using the template.

14
Dividends declared/proposed
Single-tier dividends 2016 2015 2016 2015
Dividend per share Total amount
Sen RM’000
Dividend declared/proposed:
Interim 2.5 2.5 34,620 34,620
Final *5.0 2.5 *69,240 34,620
Special - 15.0 - 142,644
7.5 20.0 103,860 211,884
* Subject to Shareholders’ approval.
Entitlement date : 25 April 2017
Payment date : 11 May 2017

Thank You