osisko gold royalties - 2016 q2 results
TRANSCRIPT

2016 Q2 Results
AUGUST 4, 2016

Certain statements contained in this presentation are "forward-looking statements“ with the meaning of applicable Canadian and U.S. securities laws. Allstatements in this presentation, other than statements of historical fact, that address future events, developments or performance that Osisko Gold Royalties Ltd(the “Corporation”) expects to occur, including managements’ expectations regarding the Corporation’s growth, results of operations, estimated future revenues,requirements for additional capital, future demand for and prices of commodities, business prospects and opportunities are forward-looking statements. Forward-looking statements are statements that are not historical facts and are generally, but not always, identified by the words "expects", "plans", "anticipates","believes", "intends", "estimates", "projects", "potential", "scheduled" and similar expressions or variations (Including negative variations), or that events orconditions "will", "would", "may", "could" or "should" occur including, without limitation, the performance of the assets of the Corporation, the realization of theanticipated benefits deriving from the Virginia acquisition and its portfolio of investments, production forecasts for properties in which the Corporation holds aroyalty. Although the Corporation believes the expectations expressed in such forward-looking statements are based on reasonable assumptions, suchstatements involve known and unknown risks, uncertainties and other factors, most of which are beyond the control of the Corporation, and are not guarantees offuture performance and actual results may accordingly differ materially from those in forward-looking statements. Factors that could cause the actual results todiffer materially from those in forward-looking statements include, without limitation: fluctuations in the prices of the commodities that drive royalties held by theCorporation; fluctuations in the value of the Canadian dollar relative to the U.S. dollar; risks related to the operators of the properties in which the Corporationholds a royalty; development, permitting, infrastructure, operating or technical difficulties on any of the properties in which the Corporation holds a royalty or otherinterest; rate and timing of production differences from resource estimates or production forecasts by operators of properties in which the Corporation holds aroyalty or other interest; risks and hazards associated with the business of exploring, development and mining on any of the properties in which the Corporationholds a royalty or other interest, including, but not limited to unusual or unexpected geological and metallurgical conditions, slope failures or cave-ins, floodingand other natural disasters or civil unrest; regulatory changes by national and local government, including corporate law, permitting and licensing regimes andtaxation policies; regulations and political or economic developments in any of the countries where properties in which the Corporation holds a royalty or otherinterest are located or through which they are held); continued availability of capital and financing and general economic, market or business conditions; businessopportunities that become available to, or are pursued by the Corporation; the impossibility to acquire royalties and to fund precious metal streams; otheruninsured risks. The forward-looking statements contained in this presentation are based upon assumptions management believes to be reasonable, including,without limitation: the ongoing operation of the properties in which the Corporation holds a royalty or other interest by the owners or operators of such propertiesin a manner consistent with past practice; the accuracy of public statements and disclosures made by the owners or operators of such underlying properties; nomaterial adverse change in the market price of the commodities that underlie the asset portfolio; no adverse development in respect of any significant property inwhich the Corporation holds a royalty, stream or other interest; the accuracy of publicly disclosed expectations for the development of underlying properties thatare not yet in production; and the absence of any other factors that could cause actions, events or results to differ from those anticipated, estimated or intended.For additional information on risks, uncertainties and assumptions, please refer to the Corporation’s most recent Annual Information Form filed on SEDAR atwww.sedar.com and with the U.S. Securities Commission at www.sec.gov. The Corporation cautions that the foregoing list of risk and uncertainties is notexhaustive. Investors and others should carefully consider the above factors as well as the uncertainties they represent and the risk they entail. The Corporationbelieves that the assumptions reflected in those forward-looking statements are reasonable, but no assurance can be given that these expectations will prove tobe correct and such forward-looking statements included in this press release should not be unduly relied upon. These statements speak only as of the date ofthis press release. The Corporation undertakes no obligation to publicly update or revise any forward-looking statements, whether as a result of new information,future events or otherwise, other than as required by applicable law.
Forward Looking Statements
2

Osisko is subject to the reporting requirements of the applicable Canadian securities laws, and as a result reports its mineral reserves according to Canadianstandards. Canadian reporting requirements for disclosure of mineral properties are governed by NI 43-101. The definitions of NI 43-101 are adopted from thosegiven by the Canadian Institute of Mining, Metallurgy and Petroleum (“CIM”). U.S. reporting requirements are governed by the Commission’s Industry Guide 7(“Guide 7”). This presentation includes estimates of mineral reserves and mineral resources reported in accordance with NI 43-101. These reporting standardshave similar goals in terms of conveying an appropriate level of confidence in the disclosures being reported, but embody different approaches and definitions.For example, under Guide 7, mineralization may not be classified as a “reserve” unless the determination has been made that the mineralization could beeconomically and legally produced or extracted at the time the reserve determination is made. Consequently, the definitions of “Proven Mineral Reserves” and“Probable Mineral Reserves” under CIM standards differ in certain respects from the standards of the Commission. Osisko also reports estimates of “mineralresources” in accordance with NI 43-101. While the terms “Mineral Resource,” “Measured Mineral Resource,” “Indicated Mineral Resource” and “Inferred MineralResource” are recognized by NI 43-101, they are not defined terms under standards of the Commission and, generally, U.S. companies are not permitted toreport estimates of mineral resources of any category in documents filed with the Commission. As such, certain information contained in this presentationconcerning descriptions of mineralization and estimates of mineral reserves and mineral resources under Canadian standards is not comparable to similarinformation made public by United States companies subject to the reporting and disclosure requirements of the Commission. Readers are cautioned not toassume that all or any part of Measured Mineral Resources or Indicated Mineral Resources will ever be converted into Mineral Reserves. Readers are alsocautioned not to assume that all or any part of an Inferred Mineral Resource exists, or is economically or legally mineable. Further, an “Inferred Mineral Resource”has a great amount of uncertainty as to its existence and as to its economic and legal feasibility, and a reader cannot assume that all or any part of an InferredMineral Resource will ever be upgraded to a higher category. Under Canadian rules, estimates of Inferred Mineral Resources may not form the basis of feasibilityor other economic studies.
Cautionary Note to U.S. Investors Regarding the Use of Mineral Reserveand Mineral Resource Estimates
2

Accomplishments in First Two Years of Business
RAISED TOTAL OF ~ $500M IN CAPITAL
SECURED $200M IN AVAILABLE CREDIT
SUCCESSFULLY ESTABLISHED ROYALTY INCUBATOR MODEL
GREW INVESTMENT PORTFOLIO TO TOTAL VALUE OF $171.8 MILLION1, REPRESENTING A $66.9 MILLION UNREALIZED GAIN2 AT JUNE 30, 2016
DEPLOYED ~$212M OF CAPITAL INTO INVESTMENTS
GREW ROYALTY PORTFOLIO TO A TOTAL OF 52 ROYALTIES + 3 ROYALTY OPTIONS
TOTAL OF $26.6M IN DIVIDENDS DECLARED
1. Fair value of marketable securities in associates and other as at June 30, 2016, excluding Labrador Iron Ore Royalty Corporation2. Non-IFRS measure representing the difference between the fair value of marketable securities less acquisition cost 4

Q2 2016 Performance
NET CASH FLOW FROM OPERATING ACTIVITIES (C$ M)
$6.5
$15.0
Q2 2015 Q2 2016
$10.2
$15.8
Q2 2015 Q2 2016
REVENUES (C$ M)
133% Increase
54% Increase
5
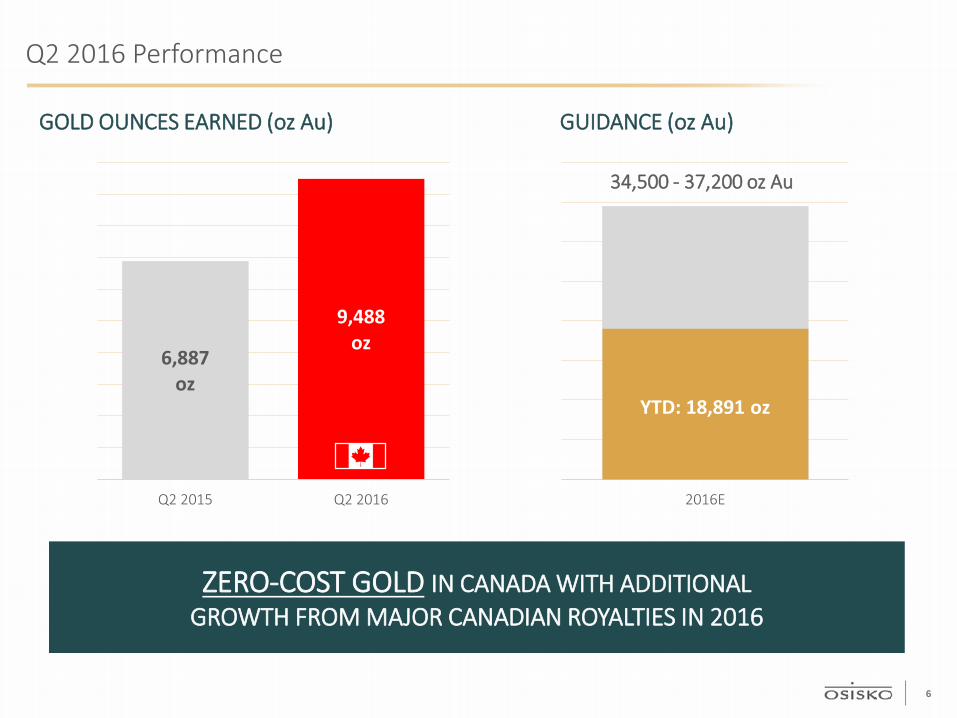
6,887oz
9,488 oz
Q2 2015 Q2 2016
Q2 2016 Performance
GOLD OUNCES EARNED (oz Au)
ZERO-COST GOLD IN CANADA WITH ADDITIONALGROWTH FROM MAJOR CANADIAN ROYALTIES IN 2016
GUIDANCE (oz Au)
34,500 - 37,200 oz Au
2016E
YTD: 18,891 oz
6

$1,379 $1,369
$1,498
$1,467$1,485 $1,491
$1,636 $1,631
$1,200
$1,250
$1,300
$1,350
$1,400
$1,450
$1,500
$1,550
$1,600
$1,650
Q3 2014 Q4 2014 Q1 2015 Q2 2015 Q3 2015 Q4 2015 Q1 2016 Q2 2016
Strong Gold Market with Upward Momentum
Osisko Quarterly Realized Gold Price (C$/oz)
Best gold prices in CAD since 2014
Max London PM Fixing in CAD:$1,877/oz on Sep. 6 2011
7

Significant Value in Investment Portfolio
Value of Investment Portfolio1 (C$ M)
Unrealized gain2 of approximately $67 million at quarter end
1. Fair value of marketable securities in associates and other as at June 30, 2016, excluding Labrador Iron Ore Royalty Corporation2. Non-IFRS measure representing the difference between the fair value of marketable securities less acquisition cost
104.2
171.8
Cost Base Market Value at June 30, 2016
104.9
8

Acquiring Royalties at Discounted Valuations
Net Cost of Royalty Purchase at June 30, 2016 (C$ M)
Purchased a 1.5% NSR in February 2016 Purchased a 1% NSR in April 2016
$25.0
$15.4 1
$9.6
Cost to purchaseroyalty
Unrealized gain onequity investment
Net cost of royalty
$10.0
$14.8 1
($4.8)
Cost to purchaseroyalty
Unrealized gain onequity investment
Net cost of royalty
1. Non-IFRS measure representing the difference between the fair value of marketable securities less acquisition cost 9
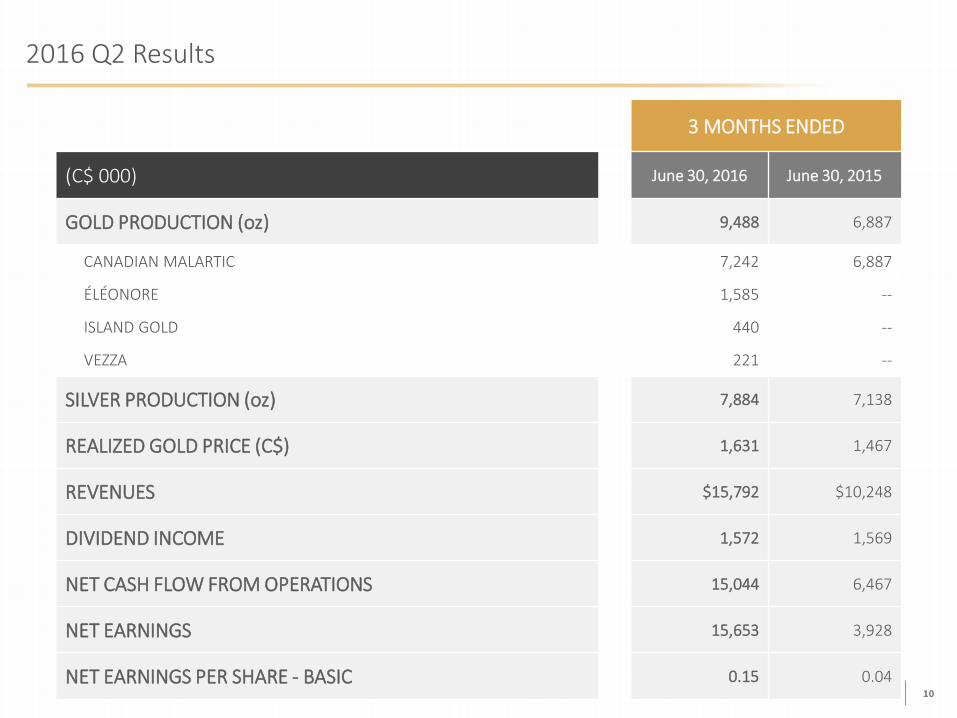
2016 Q2 Results
3 MONTHS ENDED
(C$ 000) June 30, 2016 June 30, 2015
GOLD PRODUCTION (oz) 9,488 6,887
CANADIAN MALARTIC 7,242 6,887
ÉLÉONORE 1,585 --
ISLAND GOLD 440 --
VEZZA 221 --
SILVER PRODUCTION (oz) 7,884 7,138
REALIZED GOLD PRICE (C$) 1,631 1,467
REVENUES $15,792 $10,248
DIVIDEND INCOME 1,572 1,569
NET CASH FLOW FROM OPERATIONS 15,044 6,467
NET EARNINGS 15,653 3,928
NET EARNINGS PER SHARE - BASIC 0.15 0.0410

(C$ millions) June 30, 2016
CASH & CASH EQUIVALENTS $424.5
CONVERTIBLE DEBT $45.3
TOTAL ASSETS $1,354.8
EQUITY $1,162.2
Financial Position
~$625MIN CASH & AVAILABLE CREDIT
STRONG CASH POSITION
Well positioned to fund growth
STRONG FINANCIAL PARTNERS
11

ASSET UPDATES
ÉLÉONORE2.0-3.5% NSR
ISLAND GOLD1.7%-2.55% NSR
VEZZA5% NSR – 40% NPI
CANADIAN MALARTIC5% NSR
IRON ORE COMPANY OF CANADA (LIF)0.7% PASS-THROUGH SALES ROYALTY
12

OPERATORS: Agnico Eagle / Yamana Gold
LOCATION: Malartic, Québec
RESERVES: Current reserves of 7.72 M oz Au1
ROYALTY:
5% NSR royalty $0.40/tonne on milled ore from
outside the current property area for life of mill starting in June 2021
2015 PRODUCTION: 572.0 k oz
Q2 2016 PRODUCTION: 145.0 K oz
GUIDANCE: 2016: 560 to 580 k oz 2017: 590 to 600 k oz 2018: 610 k oz
OSISKO ATTRIBUTABLE GOLD OUNCES:
2016: 28.0 to 29.0 k oz 2017: 29.5 to 30.0 k oz 2018: 30.5 k oz
1. See Appendix A for full disclosure on Reserves & Resources.
Canadian MalarticProduction Outlook
(k oz Au)
560-580 k oz
2016E
Osisko Gold Royalties Attributable Royalty
Ounces (k oz Au)
28.0-29.0 k oz
2016E
Key Producing Assets | CANADIAN MALARTIC – 5% NSR
THE LARGEST GOLD MINE IN
CANADA
YTD: 292.2 K oz YTD: 14.4 K oz
13
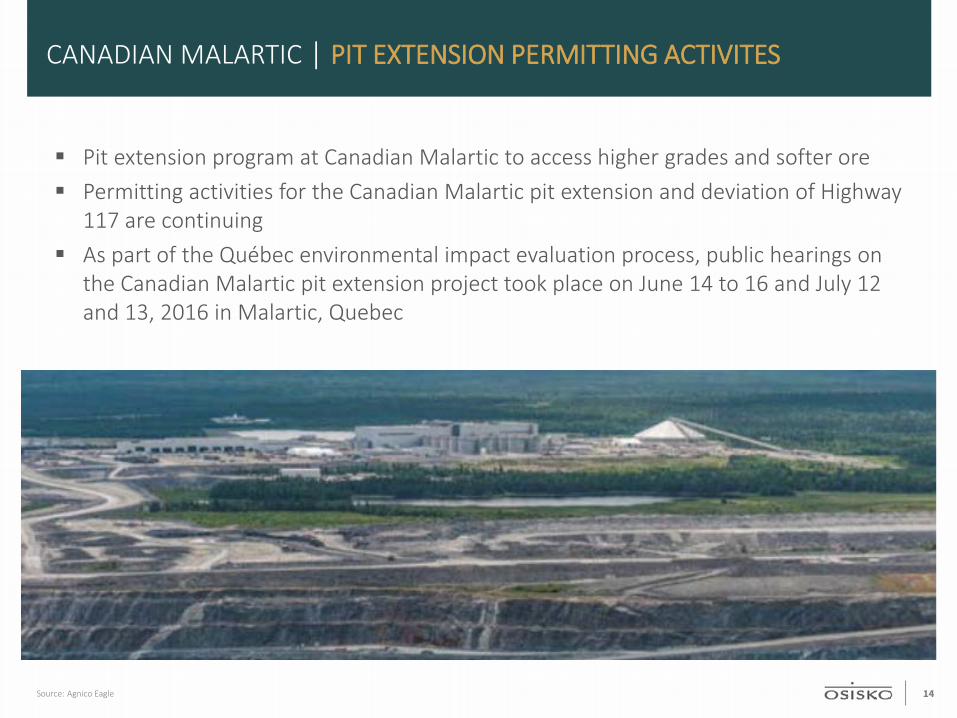
CANADIAN MALARTIC | PIT EXTENSION PERMITTING ACTIVITES
Source: Agnico Eagle
Pit extension program at Canadian Malartic to access higher grades and softer ore Permitting activities for the Canadian Malartic pit extension and deviation of Highway
117 are continuing As part of the Québec environmental impact evaluation process, public hearings on
the Canadian Malartic pit extension project took place on June 14 to 16 and July 12 and 13, 2016 in Malartic, Quebec
14
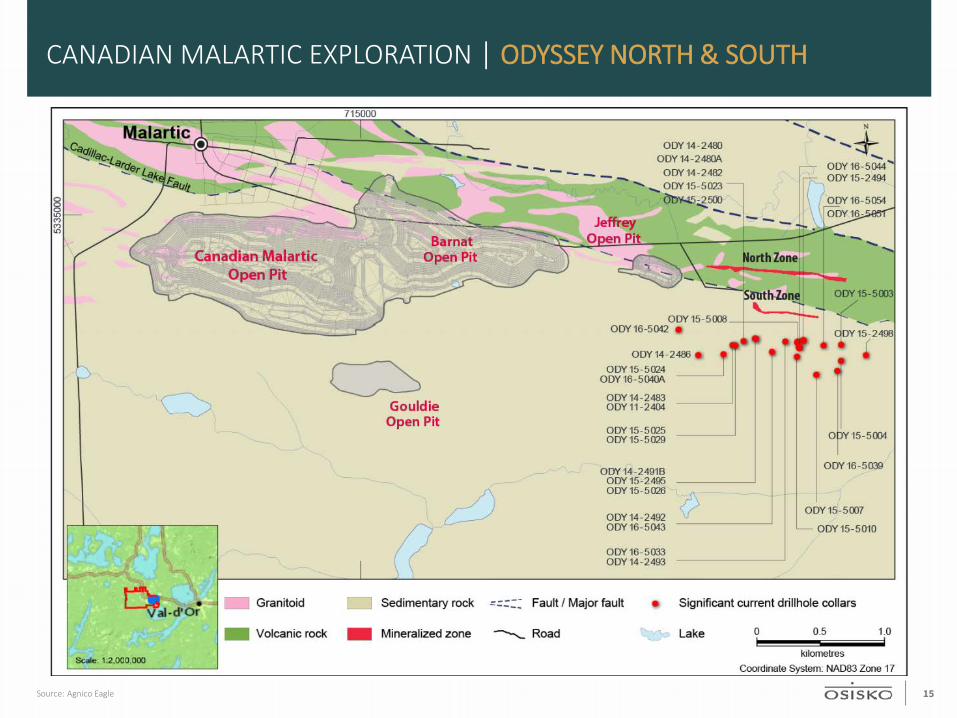
CANADIAN MALARTIC EXPLORATION | ODYSSEY NORTH & SOUTH
Source: Agnico Eagle 15

CANADIAN MALARTIC EXPLORATION | ODYSSEY NORTH & SOUTH
57 holes (53,417 metres) completed Showing similarities to the Goldex mine deposit in terms of grade and potential
amenability to underground bulk mining Odyssey North has been traced from a depth of 600 to 1,300 metres below surface
along a strike length of approximately 1.5 kilometres Odyssey South currently has a strike length of 0.5 kilometres, and has been located
between approximately 200 and 550 metres below surface Additional drilling totalling $5.5 million (35,000 metres) has been added to the original
budget of $8.0 million (60,000 metres) for a total of $13.5 million for 2016 An initial inferred mineral resource estimate for the Odyssey zones is expected as of
year-end 2016.
OSISKO HOLDS A 5% NSR ROYALTY ON THE ODYSSEY SOUTH ZONE AND A 3% NSR ROYALTY ON THE ODYSSEY NORTH ZONE
Expanding Canada’s largest gold mine
16

1. See Appendix A for full disclosure on Reserves & Resources.
ÉléonoreProduction Outlook
(k oz Au)
250-280
2016E
Osisko Gold Royalties Attributable Royalty
Ounces (k oz Au)
5.5-6.2
2016E
OPERATOR: Goldcorp (100%)
LOCATION: James Bay, Québec
RESERVES: Current reserves of 5.35 M oz Au1
ROYALTY:
2.0% NSR royalty on the first 3 M ozof Au production
0.25% increase for every additional 1M oz of production thereafter, to a maximum of 3.50%
Adjustment of +10% if Au is higher than US$500/oz
2015 PRODUCTION: 268.1 k oz
Q2 2016 PRODUCTION: 74.0 k oz
2016 GUIDANCE: 250-280 k oz
2016 OSISKO ATTRIBUTABLE GOLD OUNCES:
5.5 to 6.2 k oz
Key Producing Assets | ÉLÉONORE – 2.0 to 3.5% NSR
FIRST OUNCES RECEIVED IN
DECEMBER 2015
YTD:140.7 K OZ YTD: 3.7 K OZ
17

Operating since 2007 Recently announced an updated PEA
on Deep resources at the Island Gold Mine
2015 production: 55,040 oz Au 142,000m Phase 2 drilling campaign
underway
9.8% equity position in LIF
Investment in LIF provides exposure to Iron Ore Canada (“IOC”)
– 7.0% top-line royalty
– 15% equity interest in IOC
– $0.10/t commission on all iron ore sales by IOC
Equivalent to 0.7% pass-through sales royalty
Operating since 1954
IRON ORE COMPANY OF CANADA (LIF)
0.7% PASS-THROUGH SALES ROYALTY
ISLAND GOLD 1.7%-2.55%
NSR
Producing Royalties
Operated by Ressources Nottaway inc. (private company)
The property is located 25km from Matagami, Québec
Custom milling at IAMGOLD’s Westwood (Doyon) facility
VEZZA5% NSR40% NPI
18

NEW GROWTH UPDATES
ODYSSEY3% - 5% NSR
UPPER BEAVER KIRKLAND LAKE CAMP
2% NSR
CARIBOO1.5% NSR
MARBAN0.425% NSR
LAMAQUE1.7% NSR
PANDORA2% NSR
WINDFALL0.5% NSR
HERMOSA SULFIDES1% NSR
HORNE 51% NSR
19

New Growth Updates
Island Gold (Richmont) Produced 45,206 ounces in H1 2016 Phase 2 drilling program launched for up to 142,000m of drilling
Windfall (Osisko Mining) Initial 55,000m drilling campaign extended by an additional 50,000m
Marban (Osisko Mining) Updated resource estimate during Q2:
In-pit M&I resource of 1.48 million ounces of gold (37 M tonnes at an undiluted grade of 1.24 g/t Au), with in-pit inferred resource adding 0.13 million ounces of gold (3.6 M tonnes at an undiluted grade of 1.15 g/t Au)
Horne 5 (Falco Resources) PEA completed during Q2: $667 million NPV and 16% IRR at US$1,250/oz Au Falco to move forward towards completing feasibility study
Hermosa (Arizona Mining) Major drilling campaign under way to test the limits of the Taylor Deposit 125,000m planned for 2016 Results from first two holes:
HDS-338 Intervals: 101.5 feet (30.9 meters) at 18% Zn/Pb, 6.13 oz Ag, 0.19% Cu, including 61.5 feet (18.7 meters)at 29% Zn/Pb, 9.32 oz Ag, 0.28% Cu
HDS-339 Intervals: 108 feet (32.9 meters) at 31% Zn/Pb, 5.51 oz Ag, 0.15% Cu, including 57 feet (17.4 meters) at 45% Zn/Pb, 8.82 oz Ag, 0.17% Cu 20

APPENDIX
Appendix A – Reserves & Resources

Appendix A – Reserves and Resources
1. Agnico Eagle and Yamana public disclosure – as at December 31, 20152. See Goldcorp press release dated February 25, 2016, titled Goldcorp Reports Fourth Quarter 2015 Results; Provides Updated Reserves and Resources Estimates and 2016 Guidance3. See Richmont press release dated February 9, 2016, titled Richmont Increases Mineral Reserves by 187% and Island Gold Mine Increases Mineral Reserves by 206%, With a 29% Increase in Reserve Grade
CANADIAN MALARTIC1
RESERVES*
CATEGORY AU GRADE (G/T) AU (M OZ) TONNES (MT)
Proven 0.97 1.72 54.9
Probable 1.12 6.00 166.6
Total Proven & Probable 1.08 7.72 221.5
*Cut-off grade: 0.345-0.351 g/t | Gold Price: $1,150/oz Au
GLOBAL RESOURCES (EXCLUDING RESERVES)*
CATEGORY AU GRADE (G/T) AU (M OZ) TONNES (MT)
Measured 1.32 0.15 3.5
Indicated 1.55 1.10 22.2
Total Meas. & Ind. 1.51 1.25 25.7
Inferred 1.47 0.43 9.0*Cut-off grade: 0.34-0.40 g/t and 1.0 g/t below open pit | Gold Price: $1,150/oz Au | exchange rate of CAN$1.24 = US$1.00
ÉLÉONORE2
RESERVES*
CATEGORY AU GRADE (G/T) AU (M OZ) TONNES (MT)
Total Proven & Probable 5.87 5.35 28.32
GLOBAL RESOURCES (EXCLUDING RESERVES)
CATEGORY AU GRADE (G/T) AU (M OZ) TONNES (MT)
Total Meas. & Ind. 5.49 0.81 4.58
Inferred 7.11 2.28 9.97
ISLAND GOLD3
RESERVES - ABOVE 400M*
CATEGORY AU GRADE (G/T) AU (K OZ) TONNES (KT)
Proven 7,00 21,80 97.0
Probable 6.88 54.90 248.0
Total Proven & Probable 6.91 76.70 345.0
GLOBAL RESOURCES (EXCLUDING RESERVES) – ABOVE 400M*
CATEGORY AU GRADE (G/T) AU (K OZ) TONNES (KT)
Measured 5.80 1.35 7.5
Indicated 6.96 52.7 235.5
Total Meas. & Ind. 6.92 54.1 243.0
Inferred 7.44 98.7 412.5
*Based on a gold price of US$1,300/oz and an exchange rate of CAN$1.2037 = US$1.00.
RESERVES – BELOW 400M*
CATEGORY AU GRADE (G/T) AU (K OZ) TONNES (KT)
Proven 7.72 66.1 266.5
Probable 8.66 418.9 1,504.0
Total Proven & Probable 8.52 485.0 1,770,5
GLOBAL RESOURCES (EXCLUDING RESERVES) – BELOW 400M*
CATEGORY AU GRADE (G/T) AU (K OZ) TONNES (KT)
Indicated 5.20 17.65 105.5
Inferred 8.67 669.35 2,402.5
*Based on a gold price of US$1,300/oz and an exchange rate of CAN$1.2037 = US$1.00.
22