orsea capstone 2021
TRANSCRIPT

ORSEA Capstone 2021
Tracy Crews – Marine Education Manager, Oregon Sea GrantCait Goodwin – Special Projects Coordinator, Oregon Sea Grant &
Communications Coordinator, Oregon Coast STEM Hub

2021 Cohort Members• Bandon School District• Lincoln County School District• North Bend School District• Port Orford School District• Siuslaw School District• Siuslaw Watershed Council• Oregon Dept of Fish & Wildlife• Oregon State University• South Slough Reserve
Image: Deploying/retrieving a video lander. ODFW Information Reports 2019-20, p. 41

ORSEA brings together educators and marine researchers around ocean issues, career-connected learning, and effective science communication practices.
Funded by Oregon Sea Grant, the Oregon Coast STEM Hub and the National Science Foundation through OSU's Regional Class Research Vessel Project.

AGENDA
Welcome & OverviewRCRV Presentation
Project Presentations (7 Teams)Upcoming Opportunities

How We Got
Here
Application
Pilot Existing Lessons
Kickoff Event
Teams Meet &
PlanPilot New Lessons
Capstone Event
Lessons Published
Online
You Are Here

Regional Class Research Vessel Project

Datapresence: Technology that enables remote data interactions

RCRV Outreach & Education Goals
Design and build interactive exhibits for public audiences of all ages at Oregon State University’s Hatfield Marine Science Center.
Develop curricula, videos and other resources for educators and students that show how scientific observations made at sea are the crux of understanding, discovering, tracking and predicting natural and human-impacted processes.
Provide trainings on effective outreach and engagement for researchers including datapresence and outreach tools, as well as best practices for effectively communicating science to a variety of audiences.

Need: Increase Data Literacy through scaffolded learning across grade levels
Strategy: Provide professional development for teachers that increases their efficacy around data literacy and allows them to develop lessons and curriculum which teach students about data and the data process

Need: Make data relatable, relevant and contextualized for students
Strategy: Create “data biographies” to address who, what, where, why, and how

❑Co-create integrated math and science curriculum anchoring phenomena that builds scientific and data literacy, and provides career-connected learning.
❑ Provide opportunities for researchers to improve their science communication skills.
❑ Establish a sustainable network of Oregon educators and marine science researchers.
ORSEA Project Goals

ORSEA 2020-21 Cohort
INTRODUCING:
Team Cetacean
Team Hypoxia
Team Plastic Fantastic
Team Rockfish
Team Sea Lion
Team Sharkbait
Team Wetlands
Seven scientists and 14 middle and high school teachers participated in this year’s ORSEA Cohort.
ßThey formed seven teams.
Members of each team worked together to create a 5E lesson focused on an anchoring phenomenon related to the researcher team member's science. Teachers tested activities in the classroom, lessons were adjusted as needed, and then finalized.

TEAMS PRESENT
Posters on ORSEA Website:https://oregoncoaststem.oregonstate.edu/orsea/orsea-2020-2021-cohort

TEACHER BIO: Jessica Bailey:
This is my 12th year as an elementary teacher in Oregon. I have degrees in teaching & learning, and political science. I currently teach 6th grade (multiple subjects) in Lincoln City. I LOVE to teach science and math!
Because of ORSEA:We were able to share a research project and the knowledge gained from it with educators to help them incorporate it into a teaching curriculum so students can gain a better understanding of how scientific research is done and how it can be utilized in real world management. Students were able to receive a presentation on the research project. The research project work can be found at:A video lander study of a nearshore rocky reef
We created learning experiences for our students (and others in thefuture) that are memorable, valuable, and useful. We hope to helpthem love math and science and use it towards becoming stewards oftheir world.
Anchoring PhenomenonThis middle school unit combines a study of Oregon’s amazing rockfishpopulation with an introduction to statistics, and is guided by the essentialquestion: How many rockfish can we catch and continue to be able to fish forthem over the long haul to have a sustainable fishery? Many of our studentshave experienced the anchoring phenomenon of going fishing, possibly evento a rocky reef or ocean fishing such as a jetty or on a boat. We invite themto dig deeper, learning about the life cycles and habitats of rockfish, andanalyzing sets of data gathered by fisheries scientists to determine if thepopulations are healthy. As mathematicians, students learn about measuresof center and ways to organize, plot, and graph data. As scientists, studentsare tasked with developing (engineering) a system to monitor the humanimpacts on this rocky reef ecosystem. Students learn about ODFW’smonitoring systems, and how fisheries scientists use engineering and mathto protect the fishery populations while balancing the human impact ofcommercial and recreational fishing
Teeming with FishSustainable Fisheries
Acknowledgments: This project is based upon work supported by Oregon Sea Grant and the Oregon Coast STEM Hub, as well as the National Science Foundation Regional Class Research Vessels under Cooperative Agreement No. 1333564 Award: OCE-1748726. Any opinions, findings and conclusions or recommendations expressed in this material are those of the author(s) and do not necessarily reflect the views of the National Science Foundation.
This marine research matters because …People love to go fishing and to catch fish. People need foodand jobs and the fishing industry provides both. Making surethat fisheries are managed to be sustainable is criticallyimportant. So learning about fish biology, where they live,and how to figure out how many are out there is what isneeded. This lesson gets students thinking about those things.
Learning Plan EQ: How many rockfish can we catch and continue to be able to fish for them over the long haul to have a
sustainable fishery?ENGAGE:
● “How do you fish?” Bringing equity & student voice to the classroom
● Video lander footage & quickwrite
EXPLORE: “All About Rockfish”● Species research & jigsaw
EXPLAIN: “Statistics”● Key vocabulary ● Rockfish study presentation (guest visit
with Greg Krutzikowsky)● Measures of Center● Graphing Data
ELABORATE: ● Career Connections● Town Hall
EVALUATE: “Monitor & Protect”● Students suggest a management plan
to monitor & protect a marine ecosystem
RESEARCHER BIO: Greg KrutzikowskyI’ve worked as an educator, scientist, and fishery manager. I earned aBachelor’s degree in Marine Biology at Occidental College. I workedat the Catalina Island Marine Institute, the Oceanic Society, and thePacific Whale Foundation before returning to school to pursue aMasters Degree at Oregon State University. My Masters work onbowhead whales in the arctic used satellite monitored radio tags totrack their movements and dive behavior. Since graduating I haveworked as a marine mammal observer, a fisheries research biologist,the director of a Large Whale Entanglement Response Program. Icurrently work at the Oregon Dept. of Fish and Wildlife MarineResources Program. In my current position I work in marine science,fishery management, ocean policy, and public outreach.
Classrooms:Heidi teaches 6th grade Science and Math with a self-contained class of 15 students at Driftwood School in Port Orford, Oregon.Jessica teaches a self-contained class of 24 at an AVID elementary in Lincoln City, where she worked in fully distance learning, hybrid, and in-person models of instruction this year.
TEACHER BIO:Heidi Wacker:
I’ve taught middle school math and science for 5 years and recently started teaching a self- contained 6th grade class. 5 years teaching biology at the community college level, and 5 years teaching environmental education for nature centers and non-profits.

TEACHER BIOS:
Erica Street - BA, MA
Erica teaches Biology, Chemistry, and Yoga at North Bend High School. She received her BA in Biology from Wells College and her MA in Math and Science Education from the University of California at Berkeley. This will be her 25th year of teaching.
Carisa Ketchen-BS, MSSE
Carisa teaches Biology, Chemistry, Anatomy, Marine Science, and AVID at Toledo Jr/Sr High School. She received her BS in Natural Science and Earth and Space systems form Lewis-Clark State College and a Masters in Science Education from Montana State University. This will be her 11th year of teaching.
Photo by Saanvi Vavilala on Unsplash
OUR ORSEA PARTNERSHIP:We all gained an appreciation for the challenges of studying vulnerable marine populations, and helping students engage with these issues in a scaffolded way. Students will gain a practical understanding of the challenges facing wildlife biologists. Together our ORSEA partnerships create meaningful, collaborative, and ongoing relationships that interconnect current research, meet education standards, and provide opportunities our students wouldn’t have otherwise.
ANCHORING PHENOMENON:Are Belugas still out of balance? Scientists from Oregon State University are researching a specific population of these whales that reside in Cook Inlet Alaska, using epigenetic techniques to find out if their current population and age structure is viable and sustainable. Students will learn about beluga ecology, how scientists analyze populations, and epigenetics, and will apply their new knowledge as they create an action plan for beluga stewardship.
Belugas Out of BalanceAre there enough individuals of reproductive age in the Cook Inlet beluga population to
promote recovery without human intervention?
Acknowledgments: This project is based upon work supported by Oregon Sea Grant and the Oregon Coast STEM Hub, as well as the National Science Foundation Regional Class Research Vessels under Cooperative Agreement No. 1333564 Award: OCE-1748726. Any opinions, findings and conclusions or recommendations expressed in this material are those of the author(s) and do not necessarily reflect the views of the National Science Foundation.
THIS MARINE RESEARCH MATTERS:Not all beluga populations are endangered. Scientists need an accurate picture of how the population structure is changing so that they can make informed decisions about management and stewardship. In the past, analyzing teeth from dead whales was the only way to assess age and approximate the age structure of the population. Epigenetic analysis is a game-changer because it allows age data to be collected before death.
LEARNING PLAN COMPONENTS:
ENGAGE: Introduce students to the anchoring phenomena that provides background information on the decline of the specific belugas that live in Cook Inlet Alaska.
Beluga Introductory Video
EXPLORE: Students will complete the following three activities for interactive background information:
Beluga Virtual Tour
Power of the Pyramids
Explore the Epigenome
EXPLAIN: Students will describe species at risk, the issues that cause them and determine/predict trends for the population at risk. An introduction of how researchers use epigenetics to determine age, gender, and genetic history to model and predict the future of this species.
Epigenetic Clocks
ELABORATE: Students will apply their understanding of population pyramids and attempt to use it to analyze the structure of the Cook Inlet beluga population using the ages determined by the Oregon State researchers using epigenetic clock data.
Beluga Population Pyramids
EVALUATE: Students will create an action plan that acknowledges the issues of this population, researches what practices are currently in place, how to potentially improve these practices, and what else can be done to ensure the survival and long-term success of the Cook Inlet beluga whale population.
Action Plan
RESEARCHER BIO:
Kaimyn O’Neill, BS
Kaimyn discovered her passion for genetics through her previous college coursework, and is now pursuing a career in marine conservation genetics!SHe is currently developing an epigenetic clock for Hector’s dolphins and Māui dolphins for her master’s thesis research with OSU and is using the same methods as the beluga epigenetic research.
CLASSROOM: This unit is designed for high school students in 9th-12th grades. Functional for in person or virtual classrooms.
Science Standards:HS-LS2-1 (AST 1.4): Use mathematical and/or computational representations to support explanations of factors that affect carrying capacity of ecosystems at different scales.
HS-LS2-2 (AST 1.1): Plan and conduct an investigation that uses mathematical representations to support explanations about factors affecting biodiversity and populations in ecosystems of different scales. Science & Engineering Practices: Use mathematical representations of phenomena or design solutions to support and revise explanations.
Disciplinary Core Ideas: LS2.A: Interdependent Relationships in Ecosystems Ecosystems have carrying capacities, which are limits to the numbers of organisms and populations they can support. These limits result from such factors as the availability of living and nonliving resources and from such challenges such as predation, competition, and disease.
Crosscutting Concepts: Scale, Proportion, and Quantity The significance of a phenomenon is dependent on the scale, proportion, and quantity at which it occurs.
Math Standards:HD.MP4 Model with mathematics.HS.MP.2 Reason abstractly and quantitatively.

Sara Pursel - Biology teacher at Taft 7-12 in Lincoln City, OR with 14 years experience.
Mitch Lampson - Mathteacher at Toledo Jr/Sr HS in Toledo, OR
Because of ORSEA the teachers and researcher collaborated and
designed a lesson centering around the important work being
done by OOI.
9th grade students gained an understanding of how the
instruments and data help inform and solve mysteries and applied
their knowledge to different challenges.
Seafloor Graveyard What is causing episodes of dead animals on the seafloor?
Acknowledgments: This project is based upon work supported by Oregon Sea Grant and the Oregon Coast STEM Hub, as well as the National Science Foundation Regional Class Research Vessels under Cooperative Agreement No. 1333564 Award: OCE-1748726. Any opinions, findings and conclusions or recommendations expressed in this material are those of the author(s) and do not necessarily reflect the views of the National Science Foundation.
ENGAGE: See what happens to
the animals on the seafloor when a
hypoxia event occurs.
EXPLORE: Become an expert in
the type of equipment used to collect oceanic
data and the OOI project.
EXPLAIN: Dive into how the OOI
data connects to ecosystems.
ELABORATE: Work through
scenarios and use Desmos to visualize the
data with graphs. Extend learning by using the OOI data
explorer.
EVALUATE: Create a presentation or poster to showcase
learning.
Jonathan Fram - Asso.Professor Senior Research: College of Earth, Ocean, and Atmospheric Sciences at Oregon State University. OOI Endurance Array Project Manager.
When researchers in Oregon began to see mass graveyards of animals dead on the seafloor, they had a mystery on their hands. Access to data
was limited and the Ocean Observatories Initiative has helped researches better understand the causes and impacts of hypoxia events.
This marine research matters because data allows patterns to be discovered and connections to made. Information is key to understanding
cause and effect of phenomena that occur on the planet.
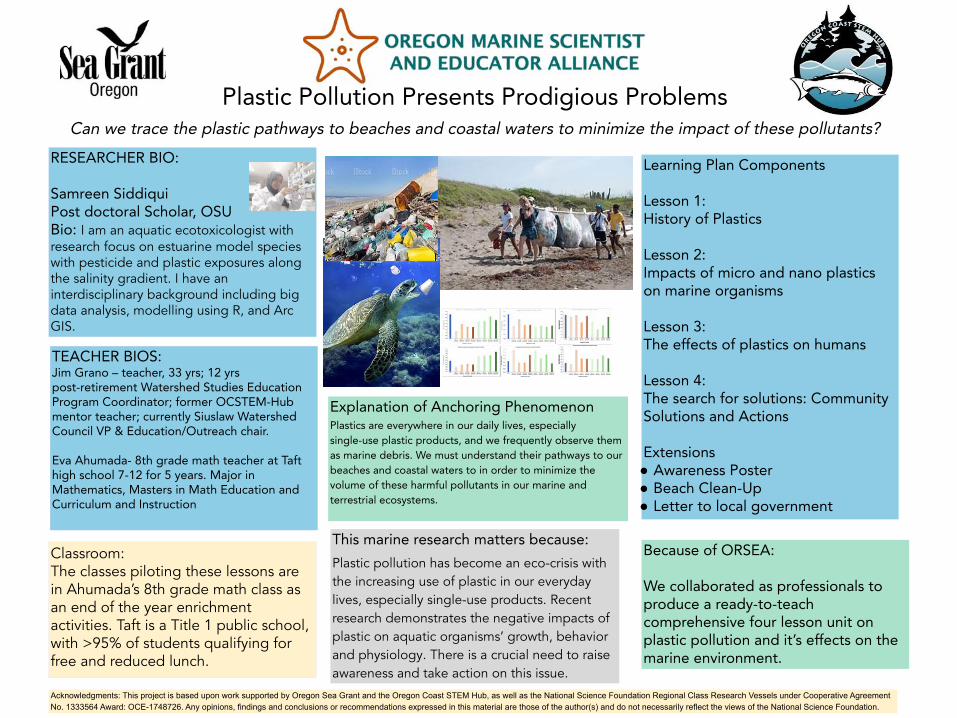
TEACHER BIOS:Jim Grano – teacher, 33 yrs; 12 yrs post-retirement Watershed Studies Education Program Coordinator; former OCSTEM-Hub mentor teacher; currently Siuslaw Watershed Council VP & Education/Outreach chair.
Eva Ahumada- 8th grade math teacher at Taft high school 7-12 for 5 years. Major in Mathematics, Masters in Math Education and Curriculum and Instruction
Because of ORSEA:
We collaborated as professionals to produce a ready-to-teach comprehensive four lesson unit on plastic pollution and it’s effects on the marine environment.
Explanation of Anchoring PhenomenonPlastics are everywhere in our daily lives, especially single-use plastic products, and we frequently observe them as marine debris. We must understand their pathways to our beaches and coastal waters to in order to minimize the volume of these harmful pollutants in our marine and terrestrial ecosystems.
Plastic Pollution Presents Prodigious Problems Can we trace the plastic pathways to beaches and coastal waters to minimize the impact of these pollutants?
Acknowledgments: This project is based upon work supported by Oregon Sea Grant and the Oregon Coast STEM Hub, as well as the National Science Foundation Regional Class Research Vessels under Cooperative Agreement No. 1333564 Award: OCE-1748726. Any opinions, findings and conclusions or recommendations expressed in this material are those of the author(s) and do not necessarily reflect the views of the National Science Foundation.
RESEARCHER BIO:
Samreen SiddiquiPost doctoral Scholar, OSUBio: I am an aquatic ecotoxicologist with research focus on estuarine model species with pesticide and plastic exposures along the salinity gradient. I have an interdisciplinary background including big data analysis, modelling using R, and Arc GIS.
Classroom: The classes piloting these lessons are in Ahumada’s 8th grade math class as an end of the year enrichment activities. Taft is a Title 1 public school, with >95% of students qualifying for free and reduced lunch.
This marine research matters because:
Plastic pollution has become an eco-crisis with the increasing use of plastic in our everyday lives, especially single-use products. Recent research demonstrates the negative impacts of plastic on aquatic organisms’ growth, behavior and physiology. There is a crucial need to raise awareness and take action on this issue.
Learning Plan Components
Lesson 1:History of Plastics
Lesson 2:Impacts of micro and nano plastics on marine organisms
Lesson 3:The effects of plastics on humans
Lesson 4:The search for solutions: Community Solutions and Actions
Extensions● Awareness Poster● Beach Clean-Up● Letter to local government

TEACHERS:Nicole Kraynik, MAT - Middle School Science teacher in Bandon, ORJason Lipe, Science Teacher at Siuslaw High School in Florence, OR
https://www.dfw.state.or.us/fish/sealion/photos.asphttps://www.dfw.state.or.us/news/2018/11_november/111518.asp
Because of ORSEA:We were able to collaborate and work as a team to create a unit based entirely on local scientific research. We were able to bring different perspectives to the table to formulate a beneficial scientific lesson.Students will gain a better understanding of the connections between living things and the impacts humans have on their environment.
Explanation of Anchoring PhenomenonSea lions have adapted the behavior of migrating miles
upriver to feed on salmon at hydropower dams in the Columbia River Basin. What do these sea lions feeding have to do with human health?
Sea lions are prime sentinel species because they have long life spans, are long-term coastal residents, feed at high trophic levels, and have unique fat stores that can store contaminants. They can alert us to environmental and public health dangers when we are able to study them.
Sea Lion Feeding Frenzy What does sea lion feeding have to do with human health?
Acknowledgments: This project is based upon work supported by Oregon Sea Grant and the Oregon Coast STEM Hub, as well as the National Science Foundation Regional Class Research Vessels under Cooperative Agreement No. 1333564 Award: OCE-1748726. Any opinions, findings and conclusions or recommendations expressed in this material are those of the author(s) and do not necessarily reflect the views of the National Science Foundation.
This marine research matters because:Coastal and tribal communities rely heavily on fish runs
for subsistence, economic, and cultural purposes. These communities are especially tied to fish health and susceptible to marine contaminants. Since sea lions are a sentinel species, scientists use the One Health paradigm to analyze the connection between contaminants, fish, sea lions, and people to make informed decisions regarding public health, environmental protection, and wildlife conservation.
Learning Plan Components
ENGAGE: ● Anchoring Phenomenon: Sea lions eating
salmon at Bonneville dam● Driving question: “What do sea lions
feeding have to do with human health?”
EXPLORE:● Bioaccumulation activity - modeling
bioaccumulation and biomagnification● Data analysis activity - analyzing sea lion
diet data
EXPLAIN:● Bioaccumulation and Biomagnification
presentation - key vocabulary, factors, and case studies
● Sentinel species presentation - key vocabulary and examples
ELABORATE: ● Bioaccumulation extension activities● Sea lions and the One Health Paradigm -
independent reading comprehension or whole-class discussion
● ORSEA Career Connections activity - STEM career exploration and researcher bio
EVALUATE:● Food chains and Biomagnification -
modeling biomagnification● Sentinel species research project - research
and present how organisms can be used to alert us to to dangerous conditions
RESEARCHER:
Classroom: Middle/High School
Samantha Rae, MS Student in Comparative Health Sciences at Oregon State University. Researching Sea Lion Health and Immune Function with a focus on Coastal Contaminants

TEACHER BIOS:Jazmin GarciaWHS Science and Math TeacherBegan teaching January 2020BS Biology, MS Marine Biology
Kelsey HartTaft 7-12 MS Math TeacherBegan teaching 2014BA in Teleproduction, MA Teaching, MS Curriculum & Instruction
Because of ORSEA:We were able to dig deep and find creative ways to present a lesson to students. Through collaboration we gained a better understanding of our individual teaching and learning techniques and we were able to combine them to create an interactive lesson.Students gain a better understanding of math and scientific research skills and get to work together to complete a fun task!
Explanation of Anchoring PhenomenonActivity levels between individuals in a population vary due to differences in age, sex, enviroment and location. Within these subgroups, individuals have different needs and will perform varying degrees of activity each with their own energy costs. Therefore, the caloric needs of individuals will also vary.
Swimming on an Empty Shark Tank:What can cause white shark activity levels to vary between individuals within the species?
Acknowledgments: This project is based upon work supported by Oregon Sea Grant and the Oregon Coast STEM Hub, as well as the National Science Foundation Regional Class Research Vessels under Cooperative Agreement No. 1333564 Award: OCE-1748726. Any opinions, findings and conclusions or recommendations expressed in this material are those of the author(s) and do not necessarily reflect the views of the National Science Foundation.
This marine research matters because:Predators help maintain the health of ecosystems. Part of understanding how White sharks help keep our coastal marine ecosystems healthy is understanding how much they need to eat. In order for a White shark to survive it needs to balance the energy it expends with the energy it takes in. Here wee explore how energy demands change between groups of individuals.
Learning Plan ComponentsENGAGE:Lesson 1 - Intro Video/Shark Frequency Matching + Project Intro
● Students match frequency graphs with recorded shark movements.
● Students learn important terms for the unit.EXPLORE:Lesson 2 - White Shark/Energy Exploration Webquest
● Students learn about calories, energy, and sharks.
Lesson 3 - Calculations Jigsaw + Calculations Worksheet
● Students work in groups to calculate tailbeat frequencies of 32 sharks.
EXPLAIN: Lesson 4 - Energy Cost Worksheet
● Students use the tailbeat frequencies to calculate the average energy cost for each shark subgroup, and analyze the results.
ELABORATE: Lesson 5/6 - Shark Restaurant Project
● Students work to create restaurants that serve human-sized and shark-sized portions of food. Students will compare the energy cost requirements of shark subgroups and humans.
EVALUATE: Lesson 7 - Restaurant Presentation and Gallery Walk
● Students will share their restaurant projects with the rest of the class. Students will make observations and comparisons between restaurants, subgroups, etc.
RESEARCHER BIO:Taylor ChappleAssistant Professor at OSU. Taylor studies the movements, behaviors and population dynamics of sharks and other large marine predators

Anchoring Phenomenon
Land use affects wetland ecosystem health. For example, some wetlands are no longer regularly flooded and become filled with invasive plant species, leading to low biodiversity. Others have natural flood regimes, higher biodiversity and are dominated by native species.
Acknowledgements: This project is based upon work supported by Oregon Sea Grant, Oregon Coast STEM Hub, and the National Science Foundation (NSF) Regional Class Research Vessels under Cooperative Agreement No. 1333564 Award: OCE-1748726. Any opinions, findings and conclusions or recommendations expressed in this material are those of the author(s) and do not necessarily reflect the views of the NSF.
Marsh MagicUnderstanding the importance of coastal wetlands
Our ORSEA partnership:
We created strong, collaborative connections and have imparted the importance of wetlands to students by creating a useful and engaging curriculum.
Classroom:This unit is designed for science (biology, ecology) and math students, grades 7-12. Functional for in-person or virtual learning environments.Science Standards:• HS-LS2-6 Ecosystems: Interactions, Energy, and Dynamics
Math Standards:• HSN.Q.A.2 Define appropriate quantities for the
purpose of descriptive modeling• HSS.IC.B.6 Evaluate reports based on data• HSN.Q.A.1 Use units to understand problems/guide
solutions• HSS.IC.B.5 Use data from randomized experiments to
compare two treatments
Research importance:Wetlands are highly diverse systems, useful for humans by slowing flooding, filtering water, trapping carbon and reducing erosion. In the early 1900’s when humans changed wetlands to farm or build on them (usually by filling, diking and draining them), they lost much of their highly productive capacity.
Researcher Bio – Jenni Schmitt, MS
Jenni is the Watershed MonitoringCoordinator at the South SloughNational Estuarine Research Reserve. Her research interests include understanding wetland ecosystems.
Much of her current work is focused on how climate change influences habitats and species distributions.
Learning Plan Components:
Engage: • Students learn why wetlands
are important via video presentation and teacher-led discussion
• Teacher shares video clips of a least-disturbed wetland, restored wetland, and impacted wetland.; students note differences observed.
Explore:• Students explore the three
wetlands in an online explorer (see below), using graphs/charts to identify patterns in the data.
• Students answer questions in their Field Notebook as they explore
Explain:• Teacher led-discussion to
wrap up each topic areaElaborate:• Students use a Summative
Assessment Tool to create hypotheses
• Students analyze another student’s claim
Evaluate:• Formative assessments
through Field Notebook, class discussions, online quiz game
• Summative Standard Achievement Assessment via Summative Assessment Tool and final online quiz
Teacher Bio – Andy Bedingfield, MS
Andy creates Ph.D. like experiences for HS students, mainly in chemistry. Prior to becoming a teacher, he worked for 10 years as an industrial chemist, and then four years as Director of Education,
Outreach and Diversity at the Center for Sustainable Materials Chemistry. He has an M.S in chemistry and teaching.
Teacher Bio – Kristina Webster, BS, MA
Kristina teaches math, science, and computer science at Toledo Jr/Sr High School. She received her BS from OSU in Fisheries and Wildlife Sciences and her MA in Teaching from
Western Oregon University. This is her third year as an educator.

Updated 08.24.2021
Oregon Sea Grant * Oregon Coast STEM Hub
Oregon Marine Scientist and Educator Alliance
Swimming on an Empty Shark Tank
What can cause white shark activity levels to vary between individuals within the
species?
Overview
The amount of energy we exert on a given day is dependent on
multiple factors- our environment, how big we are, what activity
we are doing, and how efficient we are at that activity. Animals in
the wild are no different. Using biologging tags attached to white
sharks in California and South Africa to measure tailbeat
frequencies (a proxy for activity), students will explore how activity
levels in the largest predatory fish in the ocean compare between
regions and between groups (sex and size) within regions.
Additionally, students will compare the food sources/average
caloric needs of white sharks to those of a human.
Essential Questions
• How is energy calculated and measured?
• How can you use statistical measures to compare energy
expenditures between individuals in a population?
• How can you use statistical measures to make inferences about
populations?
Learning Goals
Students will learn the following:
• Energy expenditure varies between
individuals of a population.
• The amount of energy needed for survival
is directly affected by an animal’s activity
levels.
• All else being equal, sharks need
[more/less] food than humans to
maintain healthy energy levels.
Learning Objectives
Students will be able to:
• Use data to compare energy costs of white shark groups in
different regions and within regions, visually and verbally.
• Use scientific knowledge and student-generated sources of
evidence to describe what factors may cause differences in
energy expenditure between different groups of sharks.
• Use proportions and unit rates to compare the caloric needs of
sharks and humans.
Authors
Kelsey Hart
Taft 7-12 High School
Jazmin Garcia
Waldport High School
Taylor Chapple
Oregon State University
Grade Level
7-10 Time 7 days
Anchoring Phenomenon
Swimming on an Empty Shark
Tank
Driving Question
What can cause white shark
activitiy levels to vary between
individuals within the species?
White shark
In South Africa
wearing a
camera tag.
Source: T. Chapple
Standards
Next Generation Science
Standards
LS2.A – Interdependent
Relationships in Ecosystems
LS2.B – Cycles of Matter and
Energy Transfer in Ecosystems
LS2.C – Ecosystem Dynamics,
Functioning, and Resilience
Common Core Math Standards
7.SP.A.1
7.SP.A.2
7.SP.B.4
7.RP.A.1
Updated 08.04.2021
Oregon Sea Grant * Oregon Coast STEM Hub
Oregon Marine Scientist and Educator Alliance
Teeming with Fish
How many rockfish can we catch and still have a sustainable fishery?
Overview
People love to go fishing in the ocean and catch fish. When they
want to catch “bottom fish” or “groundfish” many go to rocky
reefs because these areas are teeming with life. To be able to fish
over the long haul and still have fish to catch, researchers and
managers team up to provide sustainable fisheries. In this lesson,
students look at data and video footage collected in nearshore
rocky habitats off the Oregon Coast, and investigate how such data
could be used to inform fishery management decisions.
Essential Questions
• How many fish are allowed to be caught each year, and why?
• What is the life history of rockfish?
• How do scientists use math to answer these questions?
• How can scientists estimate how many rockfish of each species
live on rocky reefs off
Oregon?
• What should people do to
take care of these fish?
• Why are rockfish
important? Why is
biodiversity important?
Learning Goals
Students will learn the following:
• Scientists need to understand the habitats and life cycles of
rockfish to predict their populations.
• Scientists use statistics and plot data to answer questions.
• Video lander technology can be used to collect data in offshore
rocky habitats.
Learning Objectives
Students will be able to:
1. Use statistics to understand and analyze rockfish populations.
2. Draw or describe the rockfish life cycle.
3. Advocate for the importance of biodiversity.
Authors
Heidi Wacker
Driftwood School
Jessica Bailey
Taft Elementary School
Greg Krutzikowsky
Oregon Dept Fish and Wildlife
Grade Level
6-8 Anchoring Phenomenon
Teeming with Fish
Driving Question
How many rockfish can we catch
and still have a sustainable
fishery?
Standards
Next Generation Science
Standards
LS2.C – Ecosystem Dynamics,
Functioning and Resilience
LS4.D – Biodiversity and Humans
ESS3.C – Human Impacts on
Earth Systems
ETS.1B – Developing Possible
Solutions
Common Core Math Standards
6.SP.A.1
6.SP.A.2
6.SP.A.3
6.SP.B.4
6.SP.B.5
Expanded Essential Questions
More Questions
Final Lesson Units Coming Soon!
Updated 08.24.2021
Oregon Sea Grant * Oregon Coast STEM Hub
Oregon Marine Scientist and Educator Alliance
Sea Lion Feeding Frenzy
What does sea lion feeding have to do with human health?
Overview
Sea lions migrate miles upriver to feed on salmon at hydropower
dams in the Columbia River Basin. Salmon are a crucial part of the
ecosystem and are a vital food source for many tribal
communities. Contaminants in the water can accumulate in the
bodies of fish and those who eat them, and concentrations of
contaminants can magnify higher up on the food chain. As
“sentinel species”, sea lions can provide valuable information
about potential risks to human health. In this lesson, students
learn about the “one health paradigm” by exploring the
connection between contaminants, fish, sea lions, and people.
Essential Questions
• How do contaminants bioaccumulate and biomagnify in an
ecosystem?
• How can we monitor and analyze levels of contamination in a
species? • Why are sentinel species important indicators in an ecosystem?
• What is the “one health paradigm”?
Learning Goals
Students will learn the following:
• Feeding relationships among species can lead to
bioaccumulation and biomagnification of contaminants in a food
chain. • Scientists gather quantitative contaminant data and analyze
data by converting it into percentages and creating graphs.
• Humans impact the ecosystem by producing and releasing
harmful contaminants.
• Non-human species can be important indicators of ecosystem
and human health.
Learning Objectives
Students will be able to:
• Develop a model for how contaminants bioaccumulate in a food
chain.
• Analyze data by converting values into percentages and creating
stacked column and bar graphs.
• Identify the charactersistics and importance of sentinel species.
• Connect the health of non-human species to human health
through the “one health paradigm”.
Authors Nicole Kraynik
Harbor Lights Middle School
William Lipe
Siuslaw High School
Samantha Rae
Oregon State University
Grade Level
6-12 Time 5 hours
Anchoring Phenomenon
Sea Lion Feeding Frenzy
Driving Question
What does sea lion feeding have
to do with human health?
Standards
Next Generation Science
Standards
LS2.A – Interdependent
Relationships in Ecosystems
LS2.B – Cycles of Matter and
Energy Transfer in Ecosystems
ESS3.C – Human Impact on
Earth Systems
ETS1.B – Developing Possible
Solutions
Common Core Math Standards
6.SP.B.4
6.SP.B.5
6.RP.A.3
7.SP.A.1
Updated 08.19.2021 Oregon Sea Grant * Oregon Coast STEM Hub
Oregon Marine Scientist and Educator Alliance
Prodigious Plastic Pollution By identifying plastics in our daily lives and tracing their pathways to beaches and coastal waters, can we minimize the volume of these harmful pollutants? Overview There are many different sources of marine debris. From intentional littering on land and in waterways, to improperly covered trash bins, items often travel by wind and currents long distances before settling on beaches or on the ocean floor. Marine debris can come from anywhere in a watershed, and be carried by rivers, streams, and other waterways into the ocean. Marine debris can also be generated in the ocean through lost cargo and fishing gear, and even dispersed by natural disasters like hurricanes and tsunamis. In this lesson, students learn about plastic marine debris to find out where it comes from, its impacts on wildlife and humans, and how student actions can address the problem. Essential Questions • What are the different types of plastics and how might they be
present in our everyday lives? • What are the harmful effects of plastics specifically on marine
organisms? • What are the harmful effects of plastics on other living
organisms? • What can we do to help prevent the spread of plastics?
Learning Goals Students will learn the following:
• The use of plastic has increased dramatically over the past 75 years.
• Plastic can have harmful effects on living organisms when its ends up in the marine environment.
• Individual and community actions can mitigate plastic pollution.
Learning Objectives Students will be able to: • Recognize different types of plastics and how each can be
reduced, refused, reused, repurposed, or recycled. • Describe how plastic ends up in the ocean and on beaches. • Make a positive individual footprint. • Support the efforts and actions of organizations working to
reduce plastic pollution.
Authors Eva Ahumada Taft 7-12 Middle & High School Jim Grano Siuslaw Watershed Council Dr. Samreen Siddiqui Oregon State University Grade Level 6-8 Time 5 45-min class periods and one field day Anchoring Phenomenon Prodigious Plastic Pollution Driving Question By identifying plastics in our daily lives and tracing their pathways to beaches and coastal waters, can we minimize the volume of these harmful pollutants? Standards Next Generation Science Standards ESS3.C – Human Impacts on Earth Systems Common Core Math Standards 7.SP.B.4 8.SP.A.4
Updated 08.18.2021
Oregon Sea Grant * Oregon Coast STEM Hub
Oregon Marine Scientist and Educator Alliance
Belugas out of Balance
Are there enough individuals of reproductive age in the Cook Inlet beluga whale
population to promote recovery without human intervention?
Overview
Are beluga populations out of balance? Scientists from
Oregon State University are studying these whales using
epigenetic techniques to find out if their current
population and age structure is viable and sustainable. In
this lesson, students will learn about beluga ecology, how
scientists analyze populations, and epigenetics, and will
apply their new knowledge as they create an action plan
for beluga stewardship.
Essential Questions
• Why are some species “endangered?”
• Why do scientists collect life history data when studying
populations?
• How is epigenetic analysis used to determine the ages of
individuals and the reproductive health of a population?
• Why are conservation efforts so crucial to the survival of certain
species?
Learning Goals
Students will learn the following:
• Endangered species are important to the genetic diversity of
their specific ecosystem. Species can become endangered for a
variety of reasons, including human activities.
• Life history data (such as age distribution in a population) is used
by ecologists to assess the health of a population.
• Epigenetics can be used by ecologists to determine the ages of
living animals and can inform action to support species.
Learning Objectives
Students will be able to:
• Identify factors that contribute to the endangerment of beluga
whales.
• Analyze life history data and create pyramid graphs to model the
age and sex distribution of a population and use them to predict
future reproductive success.
• Use methylation data to determine ages of individuals.
• Determine conservation efforts and develop an action plan.
Authors Erica Street
North Bend High School
Carisa Ketchen
Toledo Jr/Sr High School
Kaimyn O’Neill
Oregon State University
Grade Level 10-12 Time 5-7 class periods
Anchoring Phenomenon
Belugas out of Balance
Driving Question
Are there enough individuals of
reproductive age in the Cook
Inlet beluga whale population to
promote recovery without
human intervention?
Standards
Next Generation Science
Standards
LS2.A – Interdependent
Relationships in Ecosystems
Common Core Math Standards
HD.MP4
HS.MP.2
Photo by Saanvi Vavilala on Unsplash
Updated 08.19.2021
Oregon Sea Grant * Oregon Coast STEM Hub
Oregon Marine Scientist and Educator Alliance
Seafloor Graveyard What is causing episodes of dead animals on the seafloor?
Overview When researchers in Oregon began to see mass graveyards of
animals dead on the seafloor, they had a mystery on their hands.
Students will investigate the cause of these hypoxia events, how
they are measured, and their connection to climate change. They
will also explore the impact on the ecosystem and challenges
researchers face. Essential Questions • Why does Oregon have hypoxia events during the summer?
• Were hypoxia events always occurring off the Oregon coast?
Why are they happening now more than before?
• What role do hypoxia events play in an ecosystem?
• What connection can be made between climate change and
these hypoxia events? • How are hypoxia events measured?
Learning Goals Students will learn the following:
• Upwelling and climate change can contribute to low oxygen
levels offshore. • A change in environment (hypoxia) impacts ecosystems
• Researchers with the Ocean Observing Initiative (OOI) monitor
ocean conditions and use data to make predictions.
Learning Objectives Students will be able to: • Connect causes and effects of hypoxia events to environmental
impacts. • Describe and model how changes to the environment, both
natural (upwelling) and human generated (climate change) may
affect an ecosystem. • Understand the types of research equipment used to monitor
ocean conditions, and the engineering considerations associated
with the equipment.
Image: Dead crabs observed on the
seafloor, 2006. Credit: ODFW ROV
Authors
Sara Pursel Taft 7-12 High School Mitch Lampson Toledo Jr/Sr High School
Jonathan Fram Oregon State University
Grade Level 9-10
Time 1-2 weeks
Anchoring Phenomenon Seafloor Graveyard
Driving Question What is causing episodes of dead animals on the seafloor?
Standards Next Generation Science Standards LS2.A – Interdependent
Relationships in Ecosystems LS2.B – Cycles of Matter and
Energy Transfer in Ecosystems
LS2.C – Ecosystem Dynamics, Functioning, and Resilience
Common Core Math Standards
HS.ID.A.1 - HS.ID.A.4 HS.ID.B.5 – HS.ID.B.6
HS.ID.C.7 – HS.ID.C.9
Updated 08.20.2021 Oregon Sea Grant * Oregon Coast STEM Hub
Oregon Marine Scientist and Educator Alliance
Marsh Magic How has human agriculture had an effect on coastal wetlands? What are the
differences between undisturbed, restored, and impacted wetlands?
Overview South Slough National Estuarine Research Reserve on the southern
Oregon coast has three wetland sites: one least-disturbed, one
impacted (diked, drained and converted to agricultural lands in the
early 1900’s) and in need of restoration, and one impacted but
then restored (2002). For the past few years, Reserve staff have
been collecting data at the three sites including: beaver, lamprey,
vegetation, historical imagery, hydrology, birds, and stream data.
Students will understand the importance of natural wetland
ecosystems by exploring data in an online format. They will fill out
digital field notebooks with guided inquiry within and explore
hypothesis creation and critical analysis of other students’
hypotheses (HS-LS2-6).
Essential Questions Based on HS-LS2-6
• What is a wetland ecosystem?
• Why are wetland ecosystems important?
• What factors affect the health of a wetland ecosystem?
• How do changes to land us affect the health of a wetland
ecosystem?
Learning Goals
Students will learn the following:
• Wetlands provide important ecosystem services.
• Many wetlands in Oregon have been lost since the early 1900s.
• Wetlands that have been impaired have a much reduced function
compared to natural wetlands or even restored wetlands.
Learning Objectives
Students will be able to:
• Make and evaluate a claim using
evidence to explain differences across
wetland ecosystems.
• Analyze data and charts to identify
patterns.
• Articulate explanations that other
scientists have developed.
Authors Kristin Webster
Toledo Jr/Sr High School
Andy Bedingfield
Taft 7-12 High School
Jenni Schmitt
South Slough NERR
Grade Level 7-12 Time 1-2 weeks Anchoring Phenomenon
Marsh Magic
Driving Question
How has human agriculture had
an effect on coastal wetlands?
What are the differences
between undisturbed, restored,
and impacted wetlands?
Standards Next Generation Science
Standards LS2.C – Ecosystem Dynamics,
Functioning, and Resilience
Common Core Math Standards
HSN.Q.A.1 HSN.Q.A.2 HSS.IC.B.5 HSS.IC.B.6

https://oregoncoaststem.oregonstate.edu/orsea
ORSEA
Total Participants25 teachers
14 researchers
Lessons8 units completed7 units in progress

Upcoming Opportunity
TEACHERS * SCIENTISTSApply to participate in ORSEA 2021-22
See the ORSEA website for flyers and links to apply.Teacher participants receive $1500 stipend.
Apply by October 15, 2021
https://oregoncoaststem.oregonstate.edu/orsea
