orphan drugs market
TRANSCRIPT

1
Orphan Drugs Market, by Type (Biological
Orphan Drugs, Non-Biological Orphan
Drugs), Therapeutic Area (Oncology,
Neurology Hematology, Infectious,
Disease, Metabolic Disease, and Others) -
Global Revenue, Trends, Growth, Share,
Size and Forecast to 2022
November 2016

2
About Scalar Market Research
Scalar Market Research, Inc. is a Chicago, U.S-based market research and consulting
firm that serves Fortune 1000 companies, leading businesses and upcoming
organizations from around the world to help them achieve their business goal of
sustainable revenue growth, utilizing Scalar's premium market research reports and
consulting services to make critical strategic decisions.
Our real-time industry data tracking, with the help of advanced analytics and machine
learning, offers our clients highly accurate 360-degree perspective of key
developments in niche markets. Our team of industry experts, with a thorough
understanding of global markets and cumulative industry experience spanning 100+
years, work relentlessly to help our clients realize their most important business goals.
Terms of Use
This report bears a contractual agreement between Scalar Market Research and the
buyer. No part of the content of this report can be shared or published to other
individuals, companies, subsidiaries, divisions, or subdivisions of any organization.
The redistribution of the report in any manner is strictly prohibited without the prior
permission of Scalar Market Research. The publisher will, in-turn, regard the privacy
of the purchaser and will keep it confidential. This report is informative material and is
not meant for managerial, legal or accounting advice. This publication in no case
should be used as an endorsement of any product, a corporate guide or business
manual.
Copyright © 2016 Scalar Market Research, Inc., USA
All Rights Reserved. This document enclosing highly confidential information is the sole
property of Scalar Market Research. No part of this document shall be reproduced, copied,
quoted, circulated, or otherwise shared without prior approval of Scalar Market Research
SAMPLE

3
Table of Contents
1 Introduction .................................................................................................................................. 12
2 Market Overview .......................................................................................................................... 13
2.1 Definitions ............................................................................................................................. 13
2.2 Research Methodology ......................................................................................................... 14
2.2.1 Primary Data ................................................................................................................. 14
2.2.2 Secondary Data ............................................................................................................. 15
2.2.3 Machine Learning .......................................................................................................... 15
2.2.4 Research Scope ............................................................................................................. 16
2.2.5 Years Considered .......................................................................................................... 17
2.2.6 Currency & Pricing......................................................................................................... 17
2.3 Market Segmentation ........................................................................................................... 18
2.4 Key Objectives & Benefits of the Report............................................................................... 19
2.4.1 Objectives of the Report ............................................................................................... 19
2.4.2 Key Benefits of the Report ............................................................................................ 19
2.5 Assumptions .......................................................................................................................... 20
3 Executive Summary ....................................................................................................................... 21
4 Market Dynamics .......................................................................................................................... 23
4.1 Drivers ................................................................................................................................... 23
4.2 Restraints .............................................................................................................................. 27
4.3 Opportunities ........................................................................................................................ 28
4.4 Premium Industry Trends ..................................................................................................... 29
5 Industry Analysis ........................................................................................................................... 30
5.1 Industry Overview ................................................................................................................. 30
5.2 Regulatory Analysis ............................................................................................................... 31
5.2.1 European Union ............................................................................................................ 32
5.2.2 U.S. FDA ......................................................................................................................... 34
5.2.3 Other Countries ............................................................................................................. 35
5.3 Time to Entry Analysis ........................................................................................................... 36
5.4 Pipeline Analysis .................................................................................................................... 37
SAMPLE

4
5.5 Pricing Analysis ...................................................................................................................... 40
6 Orphan Drugs Market, By Type ..................................................................................................... 42
6.1 Share Segmentation .............................................................................................................. 44
6.2 Type ....................................................................................................................................... 46
6.2.1 Biological Orphan Drugs ................................................................................................ 46
6.2.2 Non-Biological Orphan Drugs ........................................................................................ 48
7 Orphan Drugs Market, By Therapeutic Area ................................................................................. 50
7.1 Share Segmentation .............................................................................................................. 51
7.2 Therapeutic Area ................................................................................................................... 53
7.2.1 Oncology ....................................................................................................................... 53
7.2.2 Neurology ...................................................................................................................... 54
7.2.3 Hematology ................................................................................................................... 55
7.2.4 Infectious Disease ......................................................................................................... 56
7.2.5 Metabolic Disease ......................................................................................................... 57
7.2.6 Other Diseases .............................................................................................................. 58
8 Orphan Drugs Market, By Geography ........................................................................................... 59
8.1 North America ....................................................................................................................... 63
8.1.1 By Regions ..................................................................................................................... 64
8.1.1.1 U.S. ............................................................................................................................ 64
8.1.1.2 Canada ...................................................................................................................... 65
8.1.2 By Type .......................................................................................................................... 65
8.1.3 By Therapeutic Area ...................................................................................................... 66
8.2 Europe ................................................................................................................................... 68
8.2.1 By Regions ..................................................................................................................... 69
8.2.1.1 Germany .................................................................................................................... 70
8.2.1.2 U.K ............................................................................................................................. 70
8.2.1.3 France ........................................................................................................................ 70
8.2.1.4 Italy ............................................................................................................................ 70
8.2.1.5 Rest of Europe ........................................................................................................... 71
8.2.2 By Type .......................................................................................................................... 71
8.2.3 By Therapeutic Area ...................................................................................................... 73
SAMPLE

5
8.3 Asia-Pacific ............................................................................................................................ 74
8.3.1 By Regions ..................................................................................................................... 75
8.3.1.1 China ......................................................................................................................... 76
8.3.1.2 India........................................................................................................................... 76
8.3.1.3 Australia .................................................................................................................... 76
8.3.1.4 Japan ......................................................................................................................... 76
8.3.1.5 Singapore .................................................................................................................. 76
8.3.1.6 Rest of Asia-Pacific .................................................................................................... 77
8.3.2 By Type .......................................................................................................................... 77
8.3.3 By Therapeutic Area ...................................................................................................... 78
8.4 Rest of the World (ROW) ...................................................................................................... 79
8.4.1 By Regions ..................................................................................................................... 80
8.4.1.1 Latin America ............................................................................................................ 81
8.4.1.2 Middle East & Africa.................................................................................................. 81
8.4.2 By Type .......................................................................................................................... 81
8.4.3 By Therapeutic Area ...................................................................................................... 82
9 Competitive Landscape ................................................................................................................. 84
9.1 Market Share Analysis ........................................................................................................... 84
9.2 Market Positioning ................................................................................................................ 86
10 Key Market Players ....................................................................................................................... 87
10.1 Amgen Inc. ............................................................................................................................ 87
10.1.1 Overview ....................................................................................................................... 87
10.1.2 Key Strategies ................................................................................................................ 87
10.1.3 Recent Developments ................................................................................................... 87
10.2 Alexion Pharmaceuticals ....................................................................................................... 88
10.2.1 Overview ....................................................................................................................... 88
10.2.2 Key Strategies ................................................................................................................ 88
10.2.3 Recent Developments ................................................................................................... 88
10.3 Pfizer Inc. ............................................................................................................................... 89
10.3.1 Overview ....................................................................................................................... 89
10.3.2 Key Strategies ................................................................................................................ 89
SAMPLE

6
10.3.3 Recent Developments ................................................................................................... 89
10.4 Celgene Corporation ............................................................................................................. 90
10.4.1 Overview ....................................................................................................................... 90
10.4.2 Key Strategies ................................................................................................................ 90
10.4.3 Recent Developments ................................................................................................... 90
10.5 Novartis International AG ..................................................................................................... 91
10.5.1 Overview ....................................................................................................................... 91
10.5.2 Key Strategies ................................................................................................................ 91
10.5.3 Recent Developments ................................................................................................... 91
10.6 Shire Plc ................................................................................................................................. 92
10.6.1 Overview ....................................................................................................................... 92
10.6.2 Key Strategies ................................................................................................................ 92
10.6.3 Recent Developments ................................................................................................... 92
10.7 Hoffman-La Roche (Roche) ................................................................................................... 93
10.7.1 Overview ....................................................................................................................... 93
10.7.2 Key Strategies ................................................................................................................ 93
10.7.3 Recent Developments ................................................................................................... 93
10.8 BioMarin Pharmaceuticals Inc. ............................................................................................. 94
10.8.1 Overview ....................................................................................................................... 94
10.8.2 Key Strategies ................................................................................................................ 94
10.8.3 Recent Developments ................................................................................................... 94
11 Scalar 360 Degree Market Perspective ......................................................................................... 95
12 Appendix ....................................................................................................................................... 97
12.1 Related Reports ..................................................................................................................... 98
SAMPLE

7
List of Tables
Table 1. Assumptions ...................................................................................................................... 20
Table 2. Global Orphan Drugs Market Summary ............................................................................ 22
Table 3. Prevalence of Rare Diseases by Major Countries ............................................................. 24
Table 4. List of Some of the Known Rare Diseases ......................................................................... 25
Table 5. Market Exclusivity for Orphan Drugs by Major Regions ................................................... 26
Table 6. Average Number of Patients in Clinical Trials ................................................................... 29
Table 7. Market Attractiveness for Orphan Drugs Setup ............................................................... 30
Table 8. Regulatory Analysis Snapshot ........................................................................................... 31
Table 9. EMA Approved Orphan Drugs (2015 – 2016) ................................................................... 33
Table 10. Orphan Drug Regulations in Other Countries ................................................................... 35
Table 11. Time to Entry Analysis (Standard Drugs vs. Orphan Drugs) .............................................. 36
Table 12. Average Time for FDA Approval ........................................................................................ 36
Table 13. Orphan Drugs in Phase 3 Stage of the Development (2015) ............................................ 39
Table 14. Pricing with respect to prevalence of rare disease ........................................................... 40
Table 15. Average Price of Orphan Drugs by Type ........................................................................... 40
Table 16. Pricing of Top Orphan Drugs with Average Market Price (2015) ...................................... 41
Table 17. List of 10 Top Marketed Orphan Drugs (2015) ................................................................. 42
Table 18. Global Orphan Drugs Market Size (US$ billion), By Type (2014 – 2022) .......................... 44
Table 19. Global Biological Orphan Drugs Market Size (US$ billion), By Regions (2014 – 2022) ..... 46
Table 20. Global Non-Biological Orphan Drugs Market Size (US$ billion), By Regions (2014 – 2022) .
........................................................................................................................................... 48
Table 21. Global Orphan Drugs Market Size (US$ billion), By Therapeutic Area (2014 – 2022) ...... 51
Table 22. Global Orphan Drugs Market for Oncology; Market Size (US$ billion) (2014 – 2022) ..... 53
Table 23. Global Orphan Drugs Market for Neurology, Market Size (US$ billion) (2014 – 2022) .... 54
Table 24. Global Orphan Drugs Market for Hematology, Market Size (US$ billion) (2014 – 2022) . 55
Table 25. Global Orphan Drugs Market for Infectious Disease, Market Size (US$ billion) (2014 –
2022) ........................................................................................................................................... 56
Table 26. Global Orphan Drugs Market for Metabolic Disease, Market Size (US$ billion) (2014 –
2022) ........................................................................................................................................... 57
SAMPLE

8
Table 27. Global Orphan Drugs Market for Other Diseases, Market Size (US$ billion) (2014 – 2022)
........................................................................................................................................... 58
Table 28. Orphan Drugs Market Prospects, by Geography (2016 – 2022) ....................................... 60
Table 29. Global Orphan Drugs Market Size (US$ billion), By Geography (2014 – 2022) ................ 61
Table 30. Global Orphan Drugs Market, Market Size (%), By Major Regions (2014 – 2022) ........... 62
Table 31. Orphan Drugs Market in North America, Market Size (US$ billion) (2014 – 2022) .......... 64
Table 32. Orphan Drugs Market in U.S., Market Size (US$ billion), (2014 – 2022) .......................... 64
Table 33. Orphan Drugs Market in Canada, Market Size (US$ billion), (2014 – 2022) ..................... 65
Table 34. Orphan Drugs Market in North America, Market Size (US$ billion), By Type (2014 – 2022)
........................................................................................................................................... 65
Table 35. Orphan Drugs Market in North America, Market Size (US$ billion), By Therapeutic Area
(2014 – 2022) ........................................................................................................................................ 66
Table 36. Orphan Drugs Market in Europe, Market Size (US$ billion) ............................................. 69
Table 37. Orphan Drugs Market in Germany, Market Size (US$ billion), (2014 – 2022) .................. 70
Table 38. Orphan Drugs Market in U.K, Market Size (US$ billion), (2014 – 2022) ........................... 70
Table 39. Orphan Drugs Market in France, Market Size (US$ billion), (2014 – 2022) ...................... 70
Table 40. Orphan Drugs Market in Italy, Market Size (US$ billion), (2014 – 2022) .......................... 70
Table 41. Orphan Drugs Market in Rest of Europe, Market Size (US$ billion), (2014 – 2022) ......... 71
Table 42. Orphan Drugs Market in Europe, Market Size (US$ billion), By Type (2014 – 2022) ....... 71
Table 43. Orphan Drugs Market in Europe, Market Size (US$ billion), By Therapeutic Area (2014 –
2022) ........................................................................................................................................... 73
Table 44. Orphan Drugs Market in Asia-Pacific, Market Size (US$ billion) ....................................... 75
Table 45. Orphan Drugs Market in China, Market Size (US$ billion), (2014 – 2022) ........................ 76
Table 46. Orphan Drugs Market in India, Market Size (US$ billion), (2014 – 2022) ......................... 76
Table 47. Orphan Drugs Market in Australia, Market Size (US$ billion), (2014 – 2022) .................. 76
Table 48. Orphan Drugs Market in Japan, Market Size (US$ billion), (2014 – 2022) ....................... 76
Table 49. Orphan Drugs Market in South Korea, Market Size (US$ billion), (2014 – 2022) ............. 76
Table 50. Orphan Drugs Market in Rest of Asia-Pacific, Market Size (US$ billion), (2014 – 2022) .. 77
Table 51. Orphan Drugs Market in Asia-Pacific, Market Size (US$ billion), By Type (2014 – 2022) . 77
Table 52. Orphan Drugs Market in Asia-Pacific, Market Size (US$ billion), By Therapeutic Area
(2014 – 2022) ........................................................................................................................................ 78
Table 53. Orphan Drugs Market in Rest of the World (ROW), Market Size (US$ billion) ................. 80
Table 54. Orphan Drugs Market in Latin America, Market Size (US$ billion), (2014 – 2022)........... 81
SAMPLE

9
Table 55. Orphan Drugs Market in Middle East & Africa, Market Size (US$ billion), (2014 – 2022) 81
Table 56. Orphan Drugs Market in Rest of the World (ROW), Market Size (US$ billion), By Type
(2014 – 2022) ........................................................................................................................................ 81
Table 57. Orphan Drugs Market in Rest of the World (ROW), Market Size (US$ billion), By
Therapeutic Area (2014 – 2022) ........................................................................................................... 82
Table 58. Revenue from Orphan Drugs (US$ billion) By Major Players (2014 & 2015) .................... 85
Table 59. Orphan Drugs Market Snapshot ....................................................................................... 96
Table 60. Acronyms .......................................................................................................................... 97
SAMPLE

10
List of Figures
Research Methodology ..................................................................................................... 16
Orphan Drugs Timeline ..................................................................................................... 30
Orphan Drugs by Stage of Development (2016) ............................................................... 37
Orphan Drugs in Pipeline, by Therapeutic Area (2016) .................................................... 38
Global Orphan Drugs Market By Type: Market Size vs. Market Penetration (2015) ........ 43
Global Orphan Drugs Segment Share (%), By Type (2016 & 2022) ................................... 44
Global Orphan Drugs Market Size (US$ billion), By Type (2016 & 2022) .......................... 45
Global Biological Orphan Drugs Segment Share (%), By Regions (2016 & 2022) ............. 46
Global Biological Orphan Drugs Market Size (US$ billion), By Regions (2016 & 2022) .... 47
Global Non-Biological Orphan Drugs Segment Share (%), By Regions (2016 & 2022) . 48
Global Non-Biological Orphan Drugs Market Size (US$ billion), By Regions (2016 &
2022) ....................................................................................................................................... 49
Market Attractiveness for Orphan Drugs, By Therapeutic (2016) ................................ 50
Global Orphan Drugs Segment Share (%), By Therapeutic Area (2016 & 2022)........... 51
Global Orphan Drugs Market Size (US$ billion), By Therapeutic Area (2016 & 2022).. 52
Global Orphan Drugs Market for Oncology, Market Size (US$ billion) (2016 & 2022) . 53
Global Orphan Drugs Market for Neurology, Market Size (US$ billion) (2015 & 2022)54
Global Orphan Drugs Market for Hematology, Market Size (US$ billion) (2016 & 2022)
....................................................................................................................................... 55
Global Orphan Drugs Market for Infectious Disease, Market Size (US$ billion) (2016 &
2022) ....................................................................................................................................... 56
Global Orphan Drugs Market for Metabolic Disease, Market Size (US$ billion) (2016 &
2022) ....................................................................................................................................... 57
Global Orphan Drugs Market for Other Diseases; Market Size (US$ billion) (2016 &
2022) ....................................................................................................................................... 58
Global Orphan Drugs Market, Segment Share (%), By Geography (2016 & 2022) ....... 61
Orphan Drugs Market in North America, Snapshot ...................................................... 63
Orphan Drugs Market in North America, Market Size (US$ billion) (2014-2022) ........ 63
Orphan Drugs Market in North America, Segment Share (%) By Regions, (2016 &
2022) ....................................................................................................................................... 64
Orphan Drugs Market in North America, Market Size (US$ billion), By Type, 2016
&2022 ....................................................................................................................................... 66
SAMPLE

11
Orphan Drugs Market in North America, Market Size (US$ billion), By Therapeutic
Area (2016 & 2022) ............................................................................................................................... 67
Orphan Drugs Market in Europe, Snapshot .................................................................. 68
Orphan Drugs Market in Europe, Market Size (US$ billion) (2014-2022) ..................... 69
Orphan Drugs Market in Europe, Segment Share (%) By Regions, (2016 & 2022) ....... 69
Orphan Drugs Market in Europe, Market Size (US$ billion), By Type (2016 & 2022) ... 71
Orphan Drugs Market in Europe, Market Size (US$ billion), By Therapeutic Area (2016
& 2022) ....................................................................................................................................... 73
Orphan Drugs Market in Asia-Pacific, Snapshot ........................................................... 74
Orphan Drugs Market in Asia-Pacific, Market Size (US$ billion) (2014 – 2022) ........... 75
Orphan Drugs Market in Asia-Pacific, Segment Share (%) By Regions, (2016 & 2022) 75
Orphan Drugs Market in Asia-Pacific, Market Size (US$ billion), By Type (2016 & 2022)
....................................................................................................................................... 77
Orphan Drugs Market in Asia-Pacific, Market Size (US$ billion), By Therapeutic Area
(2016 & 2022) ....................................................................................................................................... 78
Orphan Drugs Market in Rest of the World, Snapshot ................................................. 79
Orphan Drugs Market in Rest of the World, Market Size (US$ billion) (2014 – 2022) . 80
Orphan Drugs Market in Rest of the World, Segment Share (%) By Regions, (2016 &
2022) ....................................................................................................................................... 80
Orphan Drugs Market in Rest of the World, Market Size (US$ billion), By Type (2016 &
2022) ....................................................................................................................................... 82
Orphan Drugs Market in Rest of the World, Market Size (US$ billion), By Therapeutic
Area (2016 & 2022) ............................................................................................................................... 83
Market Share (%) of Major Players (2015) .................................................................... 84
Market Positioning of Key Players ................................................................................ 86
SAMPLE

12
1 Introduction
The ‘Orphan Drugs Market Global Industry Analysis Report’ presents major
qualitative and quantitative trends in the global orphan drugs market. The report also
identifies important factors driving market growth and provides a profile of key industry
players.
The report provides market size, segmentation, and growth forecast for the global
orphan drugs market. This report segments the market on the basis of type and
therapeutic area. The product type segments included in this report are biological
orphan drugs, and non-biological orphan drugs. The therapeutic areas included in the
report are oncology, neurology, Hematology, infectious disease, metabolic disease
and other. The report includes detailed market size and forecast information for all
these market segments. Furthermore, this report also features the detailed geographic
analysis by major continents and countries. The first section on market overview
discusses the definitions, assumptions and research methodology considered while
preparing the report. The following section of market dynamics examines the impact
of market drivers, restraints, opportunities and trends for years 2016, 2019 and 2022
on global orphan drugs market. The discussion of industry analysis offers information
on regulatory analysis, pipeline analysis, time to entry analysis, and pricing analysis
of top orphan drugs. Section 9 provides with the competitive landscape which gives
the market share analysis and market positioning of key market players in the Orphan
Drugs market for the year 2015. This report also features profiles of top companies in
the global orphan drugs market.
In total, the information contained in this report is intended to communicate a fairly
complete understanding of global orphan drugs market through a series of easily
digestible nuggets. On behalf of Scalar Market Research team and Alcor group, we
hope that you explore and find value in this report. Suggestions for customization,
further information or other improvements are most welcome.
SAMPLE

13
2 Market Overview
2.1 Definitions
Global orphan drugs market is defined as the market size and market share estimation
of the various segments of the Orphan Drugs market, capturing ongoing drivers,
trends, challenges of the market, industry analysis involving the regulatory analysis
and studying about the major participants and players in Orphan Drugs market
environment.
The 'Global Orphan Drugs Market – Market Size and Forecast (2014 – 2022)'
report includes market size and forecast estimates for the period of 2014 to 2022. The
scope of this report is commercially available orphan drugs, regulatory analysis with
respect to geographies, pipeline analysis, and its classification in oncology, neurology,
Hematology, infectious diseases, metabolic diseases, and others. The report has 2014
as the historical year, 2015 as base year and 2016 to 2022 as forecast years.
This report defines the Orphan Drugs as –
Orphan Drugs are the pharmaceutical drugs which can be biologically derived or non-
biologically derived and are majorly used for the treatment of rare diseases. Hence,
these drugs are called as ‘orphan’ drugs. The orphan drug designation is different for
different countries. For Example; a pharmaceutical drug gets an orphan status if the
affected population with a rare disease is less than 200,000 in the U.S. and 5 out of
10,000 in Europe.
Orphan Drugs Market by Type as –
Orphan Drugs that are biological, non-biological and that are commercially available
in the market for treatment of rare and ultra-rare diseases.
Orphan Drugs Market by Therapeutic Area as –
Orphan Drugs in therapeutic areas such as oncology, neurology, hematology,
infectious disease, metabolic disease and other.
SAMPLE

14
2.2 Research Methodology
We utilize a mix of primary research, secondary research and machine learning
algorithms to generate comprehensive data about market sizes and revenue
forecasts. Our primary focus on continuous market tracking, rigorous fact-checking,
data-triangulation, and multiple layers of quality control ensures high-quality data that
can be leveraged for actionable research insights.
2.2.1 Primary Data
Structured interviews with industry specialists, VPs, CEOs, directors, technology
consultants were taken in order to collect the key primary data. The primary data is
focused on both the demand and supply sides of the market. Market engineering has
been carried out from the data and excessive analysis has been done on it. Primary
data is also extensively considered while validating the secondary data.
Perspective Primary Research
Supply Side
Manufacturers
Wholesalers
Distributors
Demand Side End-users
Consumers
Report Parameters Primary Sources
Key Industry Participants (KPIs)
Suppliers
Government Agencies
Regulatory Bodies
Research & Development Companies
Investment Research Companies
Business Consulting Service Providers
Academic Institutions/Universities
Venture Capitalists
SAMPLE

15
2.2.2 Secondary Data
The data from important secondary sources is utilized to obtain industry supply chains,
company profiles and other key areas such as market drivers, opportunities, trends
from the market perspective. In addition, secondary data is gathered using paid
databases such as Bloomberg, Hoovers, Factiva, and government publishing sources.
Report Parameters Perspective Secondary Research
Market Size, Revenue,
Industry Analysis,
Premium Industry
Trends, Market
Segmentation,
Geographic Analysis, Key
Market Players,
Competitive Landscape
Supply Side
Company Annual Reports
SEC Filings
Financial Journals
Trade Journals
Market Journals
Press Releases
Directories
White Papers
Company Websites
Magazines
Demand Side Case Studies
Customer References
2.2.3 Machine Learning
In addition to assigning weights to all the relevant market parameters, to quantify their
market impact for generating projected market growth rate, we use advanced machine
learning algorithms to collate essential market data. The machine learning method
utilizes algorithms such as regression, correlation and decision tree, among others, to
derive the desired output.
SAMPLE

16
Perspective Advantages of Machine Learning-based Forecasts
Using Machine Learning for
Data Forecast
Unlimited Data
Highly Detailed Forecasts
Profound Knowledge of Demand
Broad applicability
Customizable Model Identifies Drivers
Analysis - Product, Value Chain, Supply Chain,
Competitor
2.2.4 Research Scope
We have utilized the top-down, bottom-up approach to study the market size, industry
dynamics, key regional markets, and major market trends. The global market has been
estimated by integrating the regional markets, estimating the market data for the base
year 2015 and annual share and revenue forecasts to 2022 in US$.
Research Methodology
Global
Market Size
Market-specific Revenues of Key Players
Total Revenues of Key Players
Global Market Size
Segment-specific Market Size
Regional
Market
Size
Bottom-up
Top-down
SAMPLE

17
2.2.5 Years Considered
Market Specifics Report Scope
Historical Year 2014
Base Year 2015
Estimated Year 2016
Forecast Period 2016 – 2022
Revenue Currency US$
2.2.6 Currency & Pricing
The currency used in the report is the U.S. dollars, with market size indicated in US$
million and US$ billion.
Revenue is obtained from the annual company reports (For all the companies
reporting their revenue in US$)
Revenue is converted as per the annual currency exchange rate for that
particular year (For the companies reporting their revenue in currencies other
than US$)
SAMPLE

18
2.3 Market Segmentation
Source: Scalar Market Research Analysis
Orphan Drugs Market, By Type
Biological Non-Biological
Orphan Drugs Market, By Region
North America Europe Asia-Pacific Rest of World
Orphan Drugs Market, By Therapeutic Area
NeurologyOncology OthersHaematologyInfectious
DiseaseMetabolic
Disease
SAMPLE
19
2.4 Key Objectives & Benefits of the Report
2.4.1 Objectives of the Report
To offer in-depth information about the key market drivers and restraints
influencing the growth of this market during the forecast period
To analyze the major challenges and opportunities expected to play crucial role
in the revenue and market size growth of the key players in this market
To forecast the market size, in terms of the market size and revenue for all its
segments with respect to the major geographic regions including North
America, Europe, Asia-Pacific, Middle East & Africa, and Latin America
To comprehensively analyze the strategic developments such as mergers &
acquisition, new product launches, business expansions, and the new business
agreements in the Orphan Drugs market
To define the high-growth segments of the market and offer in-depth analysis
of the competitive landscape in the market for various key players
2.4.2 Key Benefits of the Report
In-depth analysis of the market segments that will showcase the greatest
growth potential
Deeper understanding of the behavior of the key players and innovators
influencing this market
Granular understanding of the historical market trend and the resultant market
forecast
Information about the technological advancements influencing the growth of the
global market
Extensive evaluation of all the market dynamics that will impact this market
during the forecast period
SAMPLE

20
2.5 Assumptions
Table 1. Assumptions
Parameter Assumptions
Global Orphan Drugs Market, By Type
Global Orphan Drugs Market, By Therapeutic
Area
Global Orphan Drugs Market. By Region
Market Share Analysis, By Major Players
Source: Scalar Market Research Analysis
SAMPLE

21
3 Executive Summary
Orphan Drugs are the pharmaceutical drugs which can be biologically derived or non-
biologically derived and is majorly used for the treatment of rare diseases. Hence,
these drugs are called as ‘orphan’ drugs. The orphan drug designation is different for
different countries. For Example; a pharmaceutical drug gets an orphan status if the
affected population with a rare disease is less than 200,000 in the U.S. and 5 out of
10,000 in Europe.
The Orphan Drugs market offers many growth opportunities and driving factors as
compared to the restraining factors. It is stated by various research scientists that
development of Orphan Drugs will drastically help the people suffering from rare and
ultra-rare diseases. Thus, large number of key companies such as Novartis, Roche,
Celgene, Amgen, Alexion Pharmaceuticals, and others are in constant efforts to
develop orphan drugs. For which, these companies are rigorously increasing their
research and development expenses on clinical trials to introduce novel Orphan Drugs
which would ultimately drive the market growth. Furthermore, demand for Orphan
Drugs is also expected to increase due to the rise in the incidence of rare disease and
population affected by these diseases. Orphan Drugs have proven a promising option
for the disease diagnosis and mitigation. Other factors such as faster regulatory
approvals, longer market exclusivity, positive result of many orphan drugs during
clinical trials and others drive the market growth to a great extent. However, high costs
of treatment and shift towards stem cell therapy and gene therapy like treatments are
expected to hamper the market growth during the future period.
The major revenue opportunities are expected to come from therapeutic areas such
as Oncology, Metabolic Disease, Infectious Diseases and Neurology. Whereas
oncology will account for XX% of the total revenue generated by 2022, neurology and
metabolic disease will demand a great potential towards Orphan Drugs market.
Biological orphan drugs will continue to dominate in the Orphan Drugs market while
Non-Biological orphan drugs will see increasing growth rate. Areas for investment in
the Orphan Drugs market will focus on improving research and development for the
manufacturing of Orphan Drugs, improving supply chain and reduction in the treatment
price.
SAMPLE

22
The demand for finished Orphan Drugs products is expected to shift to Asia-Pacific
during the forecast period. The countries such as India, Australia, Japan, and
Germany will continue to be in the race for Orphan Drugs market.
The Global Orphan Drugs market was estimated to be US$ 101.82 billion in 2015. This
market is expected to grow at a CAGR of 11.4% in the forecast period and is expected
to be US$ 214.14 billion in 2022. This report segments the Orphan Drugs market by
type, therapeutic area and regions.
Table 2. Global Orphan Drugs Market Summary
Global Orphan Drugs Market Market Size (US$ billion) CAGR%
(2016-2022) 2016 2022
Total 111.87 214.14 11.4%
Typ
e
Biological Orphan Drugs
Non-Biological Orphan Drugs
Ther
apeu
tic
Are
a
Oncology
Neurology
Hematology
Infectious Disease
Metabolic Disease
Other
Geo
grap
hy
North America
Europe
Asia-Pacific
Rest of the World
Source: Scalar Market Research Analysis
SAMPLE

23
4 Market Dynamics
4.1 Drivers
Drivers Impact on the Market
2014 – 2016 2017 – 2019 2020 – 2022
Increasing prevalence of rare
diseases
●=High ◑=Medium ◔=Low
Source: Scalar Market Research Analysis
1. Increasing prevalence of rare diseases
The prevalence of rare diseases has become a challenge for the world as there are
more than 7000 known rare diseases. This count is increasing day by day with 50%
of the affected population of rare diseases being children, and most of the rare
diseases are of genetic origin. Though the definition of rare disease states for ratio
1:10, there are an estimated 350 million people affected with the rare disease in the
world.
SAMPLE

30
5 Industry Analysis
5.1 Industry Overview
Orphan Drugs Timeline
Source: Scalar Market Research Analysis
Table 7. Market Attractiveness for Orphan Drugs Setup
Parameter Regulated Markets Semi-Regulated
Markets
Non-Regulated
Markets
R&D Costs/Production
Costs
Clinical Trials
Capability
Regulatory Rigidity
Attractiveness to
Consumers
●=Favorable ◑=Less Favorable ◔=Not Favorable
Source: Scalar Market Research Analysis
U.S publishes the orphan drugs act and becomes the first country to support the development of orphan drugs
Japan passes the legislation for orphan drugs
Australia passes the legislation for orphan drugs
Orphan drugs constituted 22% of total drug sales
EU passes the legislation for orphan drugs
More than 7000 rare disease occurrences
Increased prevalence of rare diseases; 25 million people affected with rare disease in U.S
1983 1993 1997 2000 2010 2012 2015
SAMPLE
42
6 Orphan Drugs Market, By Type
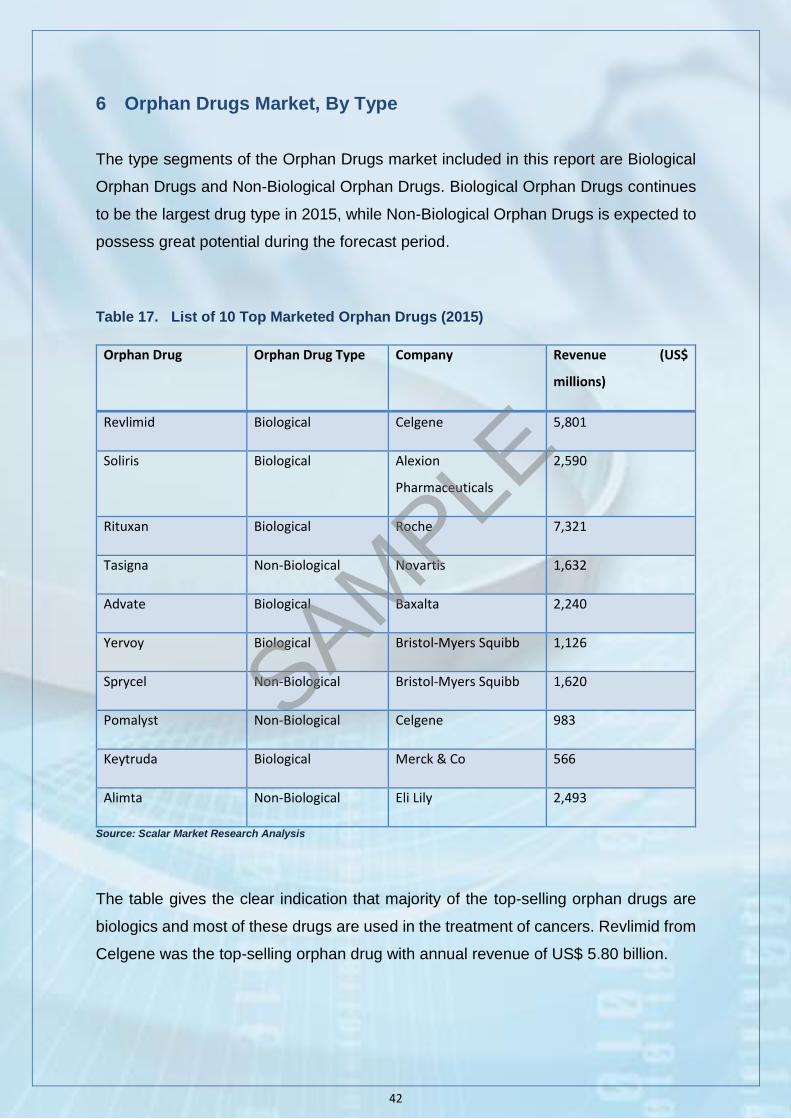
The type segments of the Orphan Drugs market included in this report are Biological
Orphan Drugs and Non-Biological Orphan Drugs. Biological Orphan Drugs continues
to be the largest drug type in 2015, while Non-Biological Orphan Drugs is expected to
possess great potential during the forecast period.
Table 17. List of 10 Top Marketed Orphan Drugs (2015)
Orphan Drug Orphan Drug Type Company Revenue (US$
millions)
Revlimid Biological Celgene 5,801
Soliris Biological Alexion
Pharmaceuticals
2,590
Rituxan Biological Roche 7,321
Tasigna Non-Biological Novartis 1,632
Advate Biological Baxalta 2,240
Yervoy Biological Bristol-Myers Squibb 1,126
Sprycel Non-Biological Bristol-Myers Squibb 1,620
Pomalyst Non-Biological Celgene 983
Keytruda Biological Merck & Co 566
Alimta Non-Biological Eli Lily 2,493
Source: Scalar Market Research Analysis
The table gives the clear indication that majority of the top-selling orphan drugs are
biologics and most of these drugs are used in the treatment of cancers. Revlimid from
Celgene was the top-selling orphan drug with annual revenue of US$ 5.80 billion.
SAMPLE

43
Global Orphan Drugs Market By Type: Market Size vs. Market Penetration
(2015)
Source: Scalar Market Research Analysis
Market Penetration
Ma
rke
t Siz
e
High
Hig
h
Biological Orphan Drugs
Non-Biological Orphan Drugs
SAMPLE
44
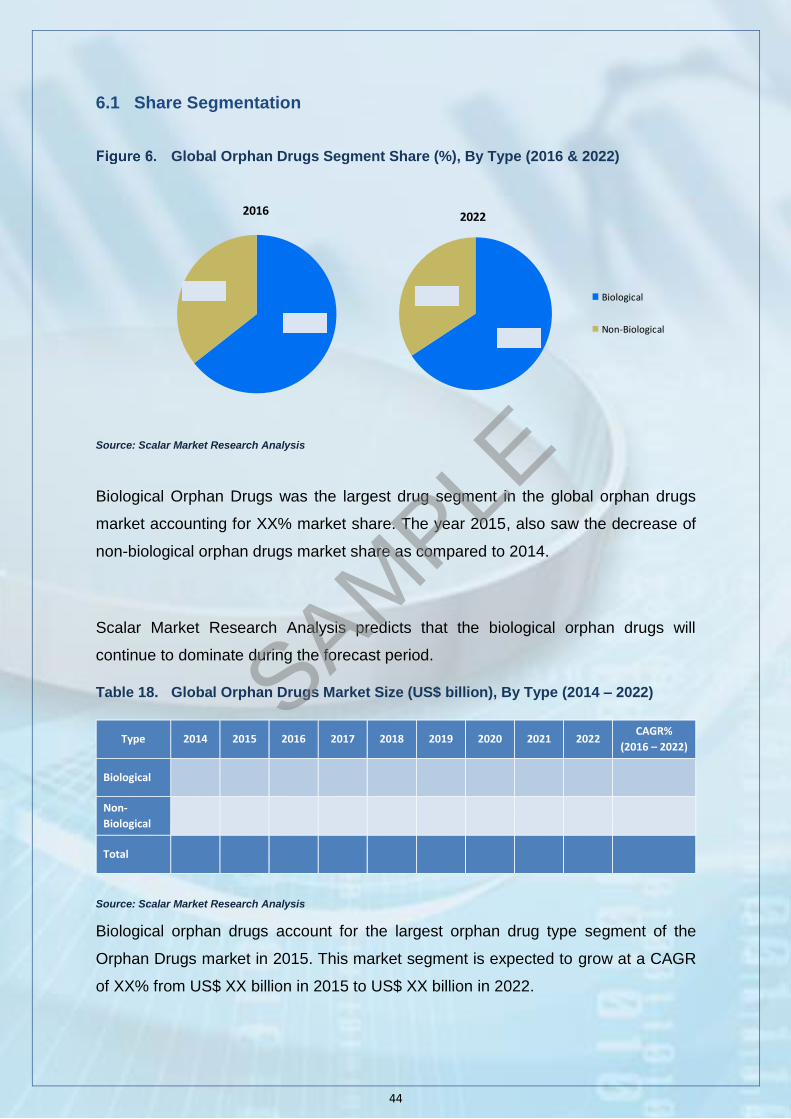
6.1 Share Segmentation
Global Orphan Drugs Segment Share (%), By Type (2016 & 2022)
Source: Scalar Market Research Analysis
Biological Orphan Drugs was the largest drug segment in the global orphan drugs
market accounting for XX% market share. The year 2015, also saw the decrease of
non-biological orphan drugs market share as compared to 2014.
Scalar Market Research Analysis predicts that the biological orphan drugs will
continue to dominate during the forecast period.
Table 18. Global Orphan Drugs Market Size (US$ billion), By Type (2014 – 2022)
Type 2014 2015 2016 2017 2018 2019 2020 2021 2022 CAGR%
(2016 – 2022)
Biological
Non-
Biological
Total
Source: Scalar Market Research Analysis
Biological orphan drugs account for the largest orphan drug type segment of the
Orphan Drugs market in 2015. This market segment is expected to grow at a CAGR
of XX% from US$ XX billion in 2015 to US$ XX billion in 2022.
64.4%
35.6%
2016
65.7%
34.3%
2022
Biological
Non-Biological
SAMPLE

45
Global Orphan Drugs Market Size (US$ billion), By Type (2016 & 2022)
Source: Scalar Market Research Analysis
72.05
140.79
39.82
73.36
2016 2022
Biological Non-Biological
Mar
ketS
ize
(US$
Bil
lion
)
SAMPLE

50
7 Orphan Drugs Market, By Therapeutic Area
The application segments of the Orphan Drugs market included in this report are
Oncology, Neurology, Hematology, Infectious Disease, Metabolic Disease, and Other
Diseases. Oncology was the largest therapeutic segment for orphan drugs in 2015,
and it’s also expected to be the fastest growing application segment in the forecast
period.
Market Attractiveness for Orphan Drugs, By Therapeutic (2016)
Therapeutic Area Market Size Growth Rate Overall Attractiveness
Oncology
Neurology
Hematology
Infectious Disease
Metabolic Disease
Other Diseases
●=Significantly Attractive ◑=Attractive ◔=Less
Attractive Source: Scalar Market Research Analysis
SAMPLE
51
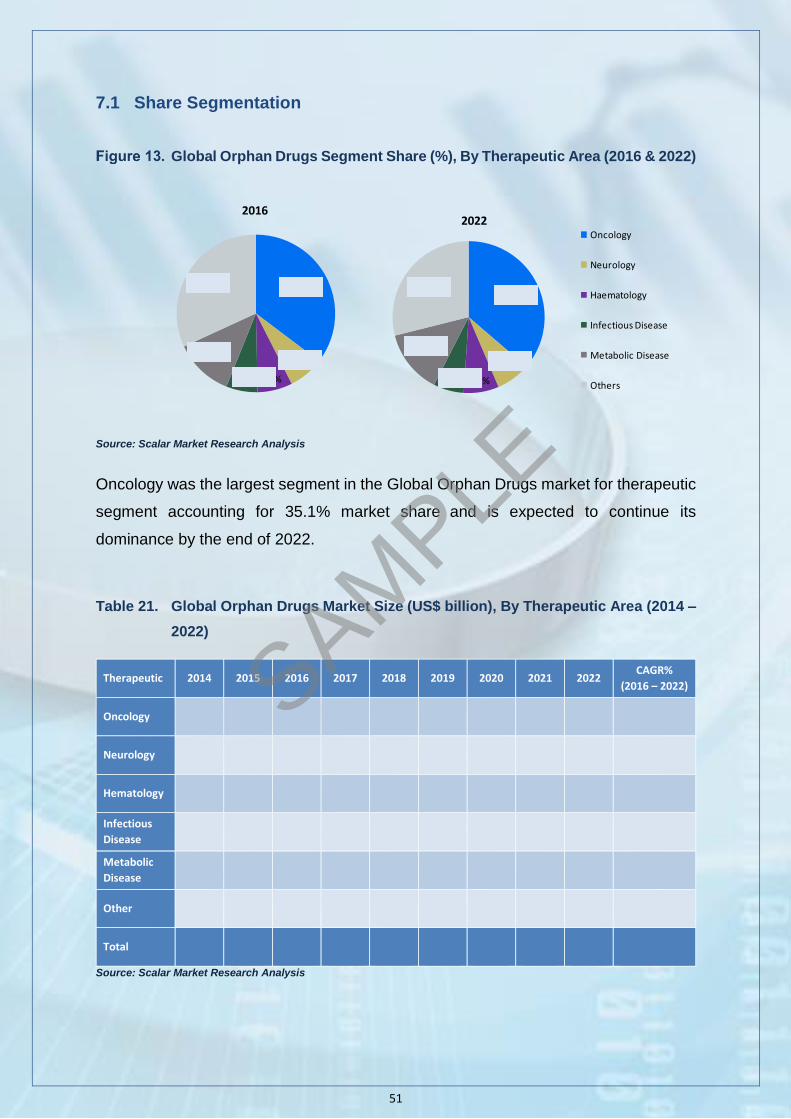
7.1 Share Segmentation
Global Orphan Drugs Segment Share (%), By Therapeutic Area (2016 & 2022)
Source: Scalar Market Research Analysis
Oncology was the largest segment in the Global Orphan Drugs market for therapeutic
segment accounting for 35.1% market share and is expected to continue its
dominance by the end of 2022.
Table 21. Global Orphan Drugs Market Size (US$ billion), By Therapeutic Area (2014 –
2022)
Therapeutic 2014 2015 2016 2017 2018 2019 2020 2021 2022 CAGR%
(2016 – 2022)
Oncology
Neurology
Hematology
Infectious
Disease
Metabolic
Disease
Other
Total
Source: Scalar Market Research Analysis
35.3%
7.2%
7.1%6.5%
12.0%
31.9%
2016
36.3%
7.3%
7.5%6.5%
13.6%
28.9%
2022Oncology
Neurology
Haematology
Infectious Disease
Metabolic Disease
Others
SAMPLE

52
Global Orphan Drugs Market Size (US$ billion), By Therapeutic Area (2016 &
2022)
Source: Scalar Market Research Analysis
39.47
8.10 7.97 7.2213.46
35.64
77.71
15.61 15.95 13.88
29.06
61.93
Oncology Neurology Haematology Infectious Disease
Metabolic Disease
Others
2016 2022
Mar
ketS
ize
(US$
Bil
lion
)
SAMPLE

59
8 Orphan Drugs Market, By Geography
The regional segments of the Orphan Drugs market included in this report are North
America (NA), Europe (EU), Asia-Pacific (APAC), and the Rest of the World (ROW).
North America was the largest regional segment in 2015, while Asia-Pacific is
expected to be the fastest-growing regional segment in the forecast period.
SAMPLE

60
Table 28. Orphan Drugs Market Prospects, by Geography (2016 – 2022)
Geography Growth Prospects Indicators
North America
Europe
Asia-Pacific
Latin America
Middle East &
Africa
Source: Scalar Market Research Analysis
SAMPLE

61
Global Orphan Drugs Market, Segment Share (%), By Geography (2016 &
2022)
Source: Scalar Market Research Analysis
Europe was the largest regional segment of the Orphan Drugs market in 2015. The
market had a XX% share of the global market in 2015. However, Europe is expected
to lose its market share to North America by 2022.
Table 29. Global Orphan Drugs Market Size (US$ billion), By Geography (2014 – 2022)
Geography 2014 2015 2016 2017 2018 2019 2020 2021 2022 CAGR%
(2016 – 2022)
North
America
Europe
Asia-Pacific
Rest of
World
Total
Source: Scalar Market Research Analysis
Asia-Pacific is expected to be the largest growing regional segment with a CAGR of
XX% during the forecast period.
55.5%24.6%
16.5%
3.4%
2016
54.9%
22.9%
18.2%
4.0%
2022
NA
Europe
APAC
ROW
SAMPLE

63
8.1 North America
Orphan Drugs Market in North America, Snapshot
Orphan Drugs Market in North America Market Size (US$ billion) CAGR%
(2016-2022) 2016 2022
Total
Typ
e
Biological Orphan Drugs
Non-Biological Orphan Drugs
Ther
apeu
tic
Are
a
Oncology
Neurology
Hematology
Infectious Disease
Metabolic Disease
Other
Reg
ion
s United States
Canada
Source: Scalar Market Research Analysis
Orphan Drugs Market in North America, Market Size (US$ billion) (2014-2022)
Source: Scalar Market Research Analysis
53.67 56.54 62.06
68.40 75.71
84.18 94.10
105.21
117.63
2014 2015 2016 2017 2018 2019 2020 2021 2022
SAMPLE

64
Table 31. Orphan Drugs Market in North America, Market Size (US$ billion) (2014 –
2022)
2014 2015 2016 2017 2018 2019 2020 2021 2022 CAGR% (2016-2022)
Market Size
Source: Scalar Market Research Analysis
8.1.1 By Regions
Orphan Drugs Market in North America, Segment Share (%) By Regions,
(2016 & 2022)
Source: Scalar Market Research Analysis
8.1.1.1 U.S.
Table 32. Orphan Drugs Market in U.S., Market Size (US$ billion), (2014 – 2022)
Country 2014 2015 2016
2017 2018 2019
2020 2021 2022 CAGR% (2016-2022)
United States
Source: Scalar Market Research Analysi
86.7%
13.3%
2016
88.3%
11.7%
2022
United States
Canada
SAMPLE

84
9 Competitive Landscape
9.1 Market Share Analysis
Market Share (%) of Major Players (2015)
Source: Scalar Market Research Analysis
The above chart gives the market share of the top leading players in the Orphan Drugs
market. The companies Novartis, Alexion Pharmaceuticals, Roche, Sanofi, and
Celgene, accounts for almost XX% of the market share in this market. However, these
companies are expected to lose their market share to other major players such as
Pfizer and Eli Lilly in the long run. Novartis holds the number one position and is
expected to remain on the top in the coming years because of its long portfolio of
orphan drugs. Shire is expected to enter in top 5 following its recent acquisition of
Baxalta for US$32 billion in June, 2016.
9.4%
2.5%
6.7%
4.3%
7.9%
3.2%66.0%
Novartis
Alexion Pharmaceuticals
Celgene
Shire
Roche
Sanofi
Others
SAMPLE
95
11 Scalar 360 Degree Market Perspective
The Global Orphan Drugs market is estimated to grow from US$ 111.87 billion in 2016
to US$ 214.14 billion in 2022, at a CAGR of 11.4% during the forecast period of 2016
– 2022. Biological Orphan Drugs will account for maximum share during the forecast
period whereas the market for Non-Biological Orphan will see a huge potential in the
coming years.
The major revenue opportunities are expected to come from therapeutic areas such
as oncology and metabolic diseases. Oncology will account for 36.29% market share
whereas the market for Orphan Drugs in neurology, Hematology and infectious
diseases will see huge opportunities in the Asia-Pacific regions.
North America will continue to be the region for developments in Orphan Drugs market
whereas Japan will account for major opportunities by 2022. Countries like India,
China, Germany, Australia, and Singapore will also see a huge potential for expansion
of this market in the forecast period.
The leading players in the Orphan drugs market are Novartis, Celgene, Roche, Alexion
Pharmaceuticals, BioMarin Pharmaceuticals, Sanofi, Pfizer, and Amgen. Scalar
Market research study believes that Novartis will continue to dominate the orphan
drugs market by 2022 and could reach a market share of 11%.
Forward Thinking: Orphan Drugs Shows Great Potential for Commercialization
Despite of less population of rare diseases and less patient pool, the
commercialization of the development of orphan drugs has been more
attractive than the non-orphan drug development.
The economic development of orphan drugs development is largely driven by
premium pricing, tax credits, faster rate of regulatory approvals, longer market
exclusivity, and lesser marketing costs.
Also, the rising prevalence of rare diseases in different geographies is attracting
big pharmaceuticals for the development of orphan drugs.
SAMPLE

96
Table 59. Orphan Drugs Market Snapshot
Criteria Orphan Drugs Market
Business Maturity
Type of Market Players
Number of Market Players
Market Perimeter
R&D Investment
Market Evolutionary Stage
Growth Strategies
Source: Scalar Market Research Analysis
SAMPLE

97
12 Appendix
Table 60. Acronyms
CAGR Compounded Annual Growth Rate
NA North America
EU Europe
APAC Asia-Pacific
MEA Middle East & Africa
LA Latin America
NR Not Reported
R&D Research & Development
EMA European Medicines Agency
Source: Scalar Market Research Analysis
SAMPLE

98
12.1 Related Reports
Healthcare Business Process Outsourcing (BPO) Market, by Provider Service
(Medical Billing, Medical Coding, Medical Transcription and Others), Payer
Services (Member Management Services, Claims Management Services,
Provider Management Services and Others), Pharmaceutical Services
(Research and Development, Manufacturing and Non-Clinical Services) -
Global Revenue, Trends, Growth, Share, Size and Forecast to 2022
Biosimilars Market, by Product Types (Recombinant Glycosylated Proteins,
Recombinant Non-Glycosylated Proteins, Recombinant Peptides), Applications
(Oncology, Blood Disorders, Infectious Diseases, Autoimmune Diseases, and
Others) - Global Revenue, Trends, Growth, Share, Size and Forecast to 2022
Active Pharmaceutical Ingredient Market, By Types (Synthetic Chemical,
Biological), Therapeutic Areas (Cardiovascular Disorders, Metabolic Disorders,
Neurological Disorders, Oncology, NSAIDs, Other Disorders), Manufacturing
Formats (Captive, Contract) - Global Revenue, Trends, Growth, Share, Size
and Forecast to 2022
SAMPLE

99
Disclaimer
Scalar Market Research offers strategic, thorough, and customized business intelligence and market
research in response to the requirement received from our customers. This analysis is limited to
publication as it contains valuable revenue data and market information. This Scalar Market Research
publication is solely for the purpose of internal usage by our registered customers. By placing an order
with us, the customers acknowledge that the strategic market research information received by them is
restricted for disclosure, general publication or sharing with any third party.
All the information written on this website is on the “as available” basis. In no event shall Scalar be held
liable for the use of the information available on this website, unless specified otherwise. Scalar Market
Research does not make any claims for the accuracy as this data is liable to minute to large fluctuation
due to the nature of the data collection and unpredictability of different markets. Scalar Market Research
does not take any responsibility for the discrepancies found in the data shared by the suppliers,
manufacturers, or users.
Any type of reproduction of this market analysis is proscribed unless granted prior permission from Scalar
Market Research.
For more information and permissions regarding privacy policy and disclaimer, contact:
Scalar Market Research
8770 W Bryn Mawr Ave.,
Suite 1300
Chicago, IL 60631
Tel.: +1-800-213-5170 (U.S./Canada Toll-free)
Email:[email protected]