orlen group - static1.money.pl filepkn orlen - selected data pln million eur million 3 months ended...
TRANSCRIPT
ORLEN GROUP
CONSOLIDATED QUARTERLY REPORT
FOR THE 1st QUARTER
20184

ORLEN GROUP
ORLEN GROUP - SELECTED DATA
PLN million EUR million
3 MONTHS ENDED
31/03/2018
3 MONTHS ENDED
31/03/2017
3 MONTHS ENDED
31/03/2018
3 MONTHS ENDED
31/03/2017
Sales revenues 23 241 22 875 5 562 5 333
Profit from operations increased by depreciation and amortisation (EBITDA) 2 040 2 838 488 662
Profit from operations (EBIT) 1 414 2 276 338 531
Profit before tax 1 245 2 539 298 592
Net profit 1 044 2 088 250 487
Total net comprehensive income 1 057 2 164 253 505
Net profit attributable to equity owners of the parent 1 042 1 920 249 448
Total net comprehensive income attributable to equity owners of the parent 1 006 2 101 241 490
Net cash from operating activities 510 673 122 156
Net cash (used) in investing activities (4 796) (907) (1 148) (211)
Net cash from/(used in) financing activities 2 088 (808) 500 (188)
Net (decrease) in cash and cash equivalents (2 198) (1 042) (526) (243)
Net profit and diluted net profit per share attributable to equity owners of the parent (in PLN/EUR per share) 2.44 4.49 0.58 1.05
31/03/2018 31/12/2017 31/03/2018 31/12/2017
Non-current assets 32 126 31 740 7 634 7 610
Current assets 27 966 28 924 6 645 6 935
Total assets 60 092 60 664 14 279 14 545
Share capital 1 058 1 058 251 254
Equity attributable to equity owners of the parent 32 227 32 197 7 658 7 719
Total equity 32 728 35 211 7 777 8 441
Non-current liabilities 10 201 9 071 2 424 2 176
Current liabilities 17 163 16 382 4 078 3 928
Number of shares 427 709 061 427 709 061 427 709 061 427 709 061
Carrying amount and diluted carrying amount per share attributable to equity owners of the parent (in PLN/EUR per share) 75.35 75.28 17.90 18.05
PKN ORLEN - SELECTED DATA
PLN million EUR million
3 MONTHS ENDED
31/03/2018
3 MONTHS ENDED
31/03/2017
3 MONTHS ENDED
31/03/2018
3 MONTHS ENDED
31/03/2017
Sales revenues 18 323 17 051 4 385 3 975
Profit from operations increased by depreciation and amortisation (EBITDA) 1 395 1 582 334 369
Profit from operations (EBIT) 1 078 1 285 258 300
Profit before tax 966 1 582 231 369
Net profit 788 1 275 189 297
Total net comprehensive income 757 1 896 181 442
Net cash from/(used in) operating activities 363 (105) 87 (25)
Net cash (used) in investing activities (3 861) (323) (924) (75)
Net cash from/(used in) financing activities 1 491 (824) 357 (192)
Net (decrease) in cash (2 007) (1 252) (480) (292)
Net profit and diluted net profit per share (in PLN/EUR per share) 1.84 2.98 0.44 0.70
31/03/2018 31/12/2017 31/03/2018 31/12/2017
Non-current assets 29 951 26 407 7 117 6 331
Current assets 20 885 22 945 4 963 5 501
Total assets 50 836 49 352 12 080 11 832
Share capital 1 058 1 058 251 254
Total equity 28 298 27 565 6 724 6 609
Non-current liabilities 9 400 8 253 2 234 1 979 Current liabilities 13 138 13 534 3 122 3 244
Number of shares 427 709 061 427 709 061 427 709 061 427 709 061
Carrying amount and diluted carrying amount per share (in PLN/EUR per share) 66.16 64.45 15.72 15.45
The above data for the 3 month period of 2018 and 2017 was translated into EUR using the following exchange rates:
items in the statement of profit or loss and other comprehensive income and the statement of cash flows - by the arithmetic average of average exchange rates published by the National Bank of Poland as of the last day of each month during the reporting period: from 1 January to 31 March 2018 – 4.1784 EUR/PLN and from 1 January to 31 March 2017 – 4.2891 EUR/PLN;
items of assets, equity and liabilities – by the average exchange rate published by the National Bank of Poland as at 31 March 2018 – 4.2085 EUR/PLN and as at 31 December 2017 – 4.1709 EUR/PLN.

ORLEN GROUP
TABLE OF CONTENTS
A. INTERIM CONDENSED CONSOLIDATED FINANCIAL STATEMENTS PREPARED IN ACCORDANCE WITH INTERNATIONAL FINANCIAL REPORTING STANDARDS AS ADOPTED BY THE EUROPEAN UNION ............................................................................................................................................................... 5 Consolidated statement of profit or loss and other comprehensive income ............................................................................................................................................................. 5 Consolidated statement of financial position ..................................................................................................................................................................................................................... 6 Consolidated statement of changes in equity .................................................................................................................................................................................................................... 7 Consolidated statement of cash flows ................................................................................................................................................................................................................................. 8
EXPLANATORY NOTES TO THE INTERIM CONDENSED CONSOLIDATED FINANCIAL STATEMENTS .................................................................................................. 9 1. Principal activity of the ORLEN Group...................................................................................................................................................................................................................... 9 2. Information on principles adopted for the preparation of the interim condensed consolidated financial statements ........................................................................ 9
2.1. Statement of compliance and general principles for preparation .............................................................................................................9 2.2. Applied accounting principles and amendments to International Financial Reporting Standards (IFRS) ...................................................9 2.3. Functional currency and presentation currency of financial statements and methods applied to translation of financial data .................. 13 2.4. Information concerning the seasonal or cyclical character of the ORLEN Group’s operations in the presented period ............................ 13
3. Group’s achievements accompanied by factors having a significant impact on quarterly condensed consolidated financial statements ................................ 13 3.1. Organization of the ORLEN Group ....................................................................................................................................................... 15 3.2. Changes in the structure of the ORLEN Group from 1 January 2018 up to the date of preparation of the foregoing report ..................... 15
4. Segment reporting ....................................................................................................................................................................................................................................................... 15 5. Other notes .................................................................................................................................................................................................................................................................... 17
5.1. Sales revenues ................................................................................................................................................................................... 17 5.2. Operating expenses ............................................................................................................................................................................ 18 5.3. Other operating income and expenses ................................................................................................................................................. 18 5.4. Finance income and costs ................................................................................................................................................................... 19 5.5. Loans and bonds ................................................................................................................................................................................. 19 5.6. Derivatives and other assets and liabilities ........................................................................................................................................... 19 5.7. Provisions ........................................................................................................................................................................................... 20 5.8. Methods applied in determining fair value (fair value hierarchy) ............................................................................................................ 20 5.9. Finance lease payments ...................................................................................................................................................................... 20 5.10. Future commitments resulting from signed investment contracts .......................................................................................................... 21 5.11. Issue, redemption and repayment of debt securities ............................................................................................................................. 21 5.12. Proposal of distribution of the profit for 2017 ........................................................................................................................................ 21 5.13. Contingent assets and liabilities........................................................................................................................................................... 21 5.14. Related parties transactions ................................................................................................................................................................ 22 5.15. Guarantees ......................................................................................................................................................................................... 23 5.16. Events after the end of the reporting period ......................................................................................................................................... 23
B. OTHER INFORMATION TO CONSOLIDATED QUARTERLY REPORT .................................................................................................................................................... 25 1. Major factors having impact on EBITDA LIFO (profit on operations increased by depreciation and amortisation by LIFO method of inventory valuation) . 25 2. The most significant events in the period from 1 January 2018 up to the date of preparation of the foregoing report ..................................................................... 25 3. Other information ......................................................................................................................................................................................................................................................... 27
3.1. Composition of the Management Board and the Supervisory Board ............................................................................................................... 27 3.2. Shareholders holding directly or indirectly via related parties at least 5% of total votes at the Parent’s General Shareholders’ Meeting as at the
submission date of the foregoing report ..................................................................................................................................................... 27 3.3. Changes in the number of the Parent Company’s shares held by the Management Board and the Supervisory Board Members ............................. 27 3.4. Information on loan sureties or guarantees of at least 10% of the Parent Company’s equity granted by the Parent Company or its subsidiaries to one
entity or its subsidiary ............................................................................................................................................................................. 27 3.5. Statement of the Management Board regarding the possibility to realize previously published forecasts of the current year results .......................... 27
C. QUARTERLY FINANCIAL INFORMATION OF PKN ORLEN ......................................................................................................................................................................... 29 Separate statement of profit or loss and other comprehensive income.................................................................................................................................................................... 29 Separate statement of financial position............................................................................................................................................................................................................................ 30 Separate statement of changes in equity .......................................................................................................................................................................................................................... 31 Separate statement of cash flows........................................................................................................................................................................................................................................ 32 Statement of the Management Board ................................................................................................................................................................................................................................. 33

INTERIM CONDENSED CONSOLIDATED FINANCIAL STATEMENTS
FOR THE 3 MONTH PERIOD ENDED 31 MARCH
PREPARED IN ACCORDANCE WITH INTERNATIONAL FINANCIAL REPORTING STANDARDS AS ADOPTED BY THE EUROPEAN UNION
20184

ORLEN GROUP (in PLN million)
CONSOLIDATED QUARTERLY REPORT FOR THE 1st QUARTER OF 2018 (Translation of a document originally issued in Polish) 5 / 33
A. INTERIM CONDENSED CONSOLIDATED FINANCIAL STATEMENTS PREPARED IN ACCORDANCE WITH INTERNATIONAL FINANCIAL REPORTING STANDARDS AS ADOPTED BY THE EUROPEAN UNION
Consolidated statement of profit or loss and other comprehensive income
NOTE
3 MONTHS ENDED
31/03/2018 (unaudited)
3 MONTHS ENDED
31/03/2017 (unaudited)
Sales revenues 5.1 23 241 22 875
revenues from sales of finished goods and services 19 092 17 787
revenues from sales of merchandise and raw materials 4 149 5 088
Cost of sales 5.2. (20 436) (19 449)
cost of finished goods and services sold (16 723) (14 753)
cost of merchandise and raw materials sold (3 713) (4 696)
Gross profit on sales 2 805 3 426
Distribution expenses (1 135) (1 037)
Administrative expenses (378) (367)
Other operating income 5.3. 344 249
Other operating expenses 5.3. (262) (64)
Loss/reversal of loss due to impairment of financial instruments 5 -
Share in profit from investments accounted for under equity method 35 69
Profit from operations 1 414 2 276
Finance income 5.4. 503 679
Finance costs 5.4. (671) (416)
Net finance income and costs (168) 263
Loss/reversal of loss due to impairment of financial instruments (1) -
Profit before tax 1 245 2 539
Tax expense (201) (451)
current tax (187) (338)
deferred tax (14) (113)
Net profit 1 044 2 088
Other comprehensive income:
which will not be reclassified subsequently into profit or loss 6 -
gains/(losses) on investments in equity instruments at fair value through other comprehensive income 8 -
deferred tax (2) -
which will be reclassified into profit or loss 7 76
hedging instruments (39) 832
hedging costs 24 -
exchange differences on translating foreign operations 16 (598)
deferred tax 6 (158)
13 76
Total net comprehensive income 1 057 2 164
Net profit attributable to 1 044 2 088
equity owners of the parent 1 042 1 920
non-controlling interest 2 168
Total net comprehensive income attributable to 1 057 2 164
equity owners of the parent 1 006 2 101
non-controlling interest 51 63
Net profit and diluted net profit per share attributable to equity owners of the parent (in PLN per share) 2.44
4.49
The accompanying notes disclosed on pages 9 – 23 are an integral part of the foregoing interim condensed consolidated financial statements.
ORLEN GROUP (in PLN million)
CONSOLIDATED QUARTERLY REPORT FOR THE 1st QUARTER OF 2018 (Translation of a document originally issued in Polish) 6 / 33
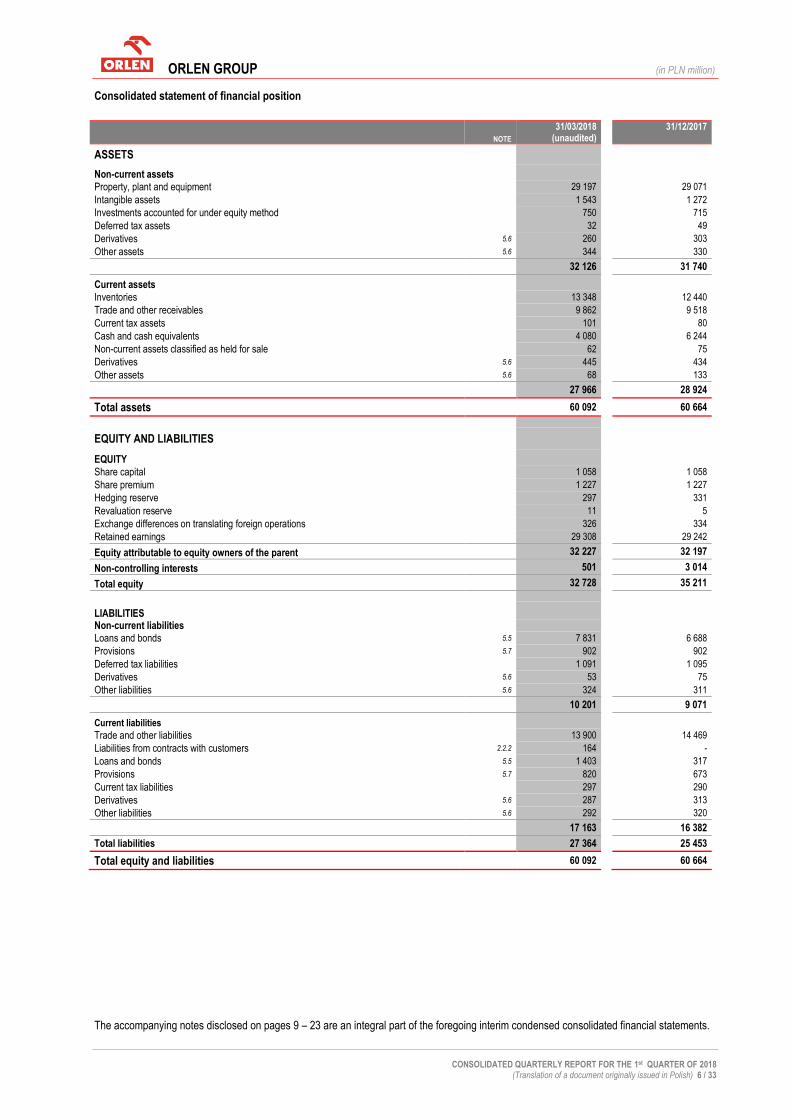
Consolidated statement of financial position
NOTE
31/03/2018 (unaudited)
31/12/2017
ASSETS
Non-current assets
Property, plant and equipment 29 197 29 071
Intangible assets 1 543 1 272
Investments accounted for under equity method 750 715
Deferred tax assets 32 49
Derivatives 5.6 260 303
Other assets 5.6 344 330
32 126 31 740
Current assets
Inventories 13 348 12 440
Trade and other receivables 9 862 9 518
Current tax assets 101 80
Cash and cash equivalents 4 080 6 244
Non-current assets classified as held for sale 62 75
Derivatives 5.6 445 434
Other assets 5.6 68 133
27 966 28 924
Total assets 60 092 60 664
EQUITY AND LIABILITIES
EQUITY
Share capital 1 058 1 058
Share premium 1 227 1 227
Hedging reserve 297 331
Revaluation reserve 11 5
Exchange differences on translating foreign operations 326 334
Retained earnings 29 308 29 242
Equity attributable to equity owners of the parent 32 227 32 197
Non-controlling interests 501 3 014
Total equity 32 728 35 211
LIABILITIES
Non-current liabilities
Loans and bonds 5.5 7 831 6 688
Provisions 5.7 902 902
Deferred tax liabilities 1 091 1 095
Derivatives 5.6 53 75
Other liabilities 5.6 324 311
10 201 9 071
Current liabilities
Trade and other liabilities 13 900 14 469
Liabilities from contracts with customers 2.2.2 164 -
Loans and bonds 5.5 1 403 317
Provisions 5.7 820 673
Current tax liabilities 297 290
Derivatives 5.6 287 313
Other liabilities 5.6 292 320
17 163 16 382
Total liabilities 27 364 25 453
Total equity and liabilities 60 092 60 664
The accompanying notes disclosed on pages 9 – 23 are an integral part of the foregoing interim condensed consolidated financial statements.
ORLEN GROUP (in PLN million)
CONSOLIDATED QUARTERLY REPORT FOR THE 1st QUARTER OF 2018 (Translation of a document originally issued in Polish) 7 / 33
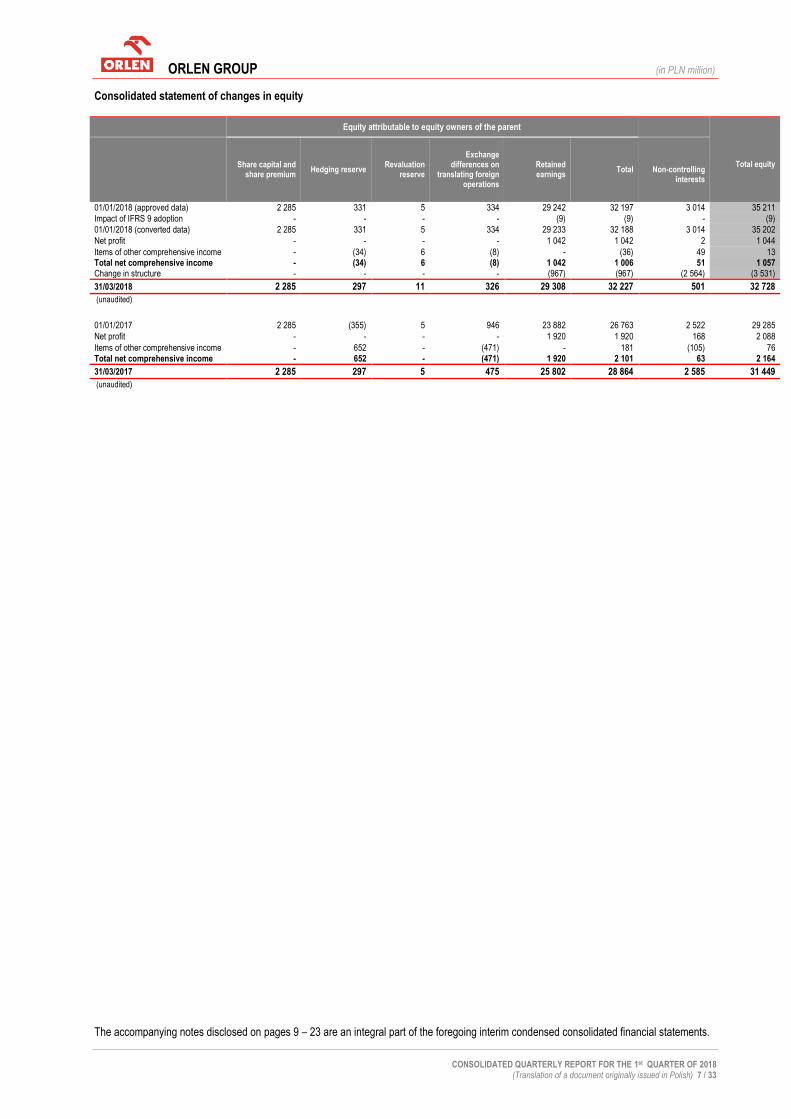
Consolidated statement of changes in equity
Equity attributable to equity owners of the parent
Total equity
Share capital and share premium
Hedging reserve Revaluation
reserve
Exchange differences on
translating foreign operations
Retained earnings
Total
Non-controlling interests
01/01/2018 (approved data) 2 285 331 5 334 29 242 32 197 3 014 35 211
Impact of IFRS 9 adoption - - - - (9) (9) - (9)
01/01/2018 (converted data) 2 285 331 5 334 29 233 32 188 3 014 35 202
Net profit - - - - 1 042 1 042 2 1 044
Items of other comprehensive income - (34) 6 (8) - (36) 49 13 Total net comprehensive income - (34) 6 (8) 1 042 1 006 51 1 057 Change in structure - - - - (967) (967) (2 564) (3 531)
31/03/2018 2 285 297 11 326 29 308 32 227 501 32 728
(unaudited)
01/01/2017 2 285 (355) 5 946 23 882 26 763 2 522 29 285
Net profit - - - - 1 920 1 920 168 2 088
Items of other comprehensive income - 652 - (471) - 181 (105) 76 Total net comprehensive income - 652 - (471) 1 920 2 101 63 2 164
31/03/2017 2 285 297 5 475 25 802 28 864 2 585 31 449
(unaudited)
The accompanying notes disclosed on pages 9 – 23 are an integral part of the foregoing interim condensed consolidated financial statements.

ORLEN GROUP (in PLN million)
CONSOLIDATED QUARTERLY REPORT FOR THE 1st QUARTER OF 2018 (Translation of a document originally issued in Polish) 8 / 33
Consolidated statement of cash flows
3 MONTHS ENDED
31/03/2018 (unaudited)
3 MONTHS ENDED
31/03/2017 (unaudited)
Cash flows from operating activities
Profit before tax 1 245 2 539
Adjustments for:
Share in profit from investments accounted for under equity method (35) (69)
Depreciation and amortisation 626 562
Foreign exchange (gain)/loss 68 (137)
Interest, net 49 50
Loss on investing activities 145 110
Change in provisions 150 71
Change in working capital (1 398) (1 735)
inventories (880) (930)
receivables (280) (72)
liabilities (238) (733)
Other adjustments, incl.: (137) 11
rights received free of charge (130) (70)
Income tax (paid) (203) (729)
Net cash from operating activities 510 673
Cash flows from investing activities
Acquisition of property, plant and equipment, intangible assets and perpetual usufruct of land
(1 149)
(889)
Acquisition of shares (3 531) -
Disposal of property, plant and equipment, intangible assets and perpetual usufruct of land
58
50
Settlement of derivatives not designated as hedge accounting (170) (63)
Other (4) (5)
Net cash (used) in investing activities (4 796) (907)
Cash flows from financing activities
Proceeds from loans and borrowings received 2 126 19
Repayments of loans and borrowings (1) (785)
Interest paid (28) (34)
Payments of liabilities under finance lease agreements (8) (7)
Other (1) (1)
Net cash from/(used in) financing activities 2 088 (808)
Net (decrease) in cash and cash equivalents (2 198) (1 042)
Effect of exchange rate changes 34 (214)
Cash and cash equivalents, beginning of the period 6 244 5 072
Cash and cash equivalents, end of the period 4 080 3 816
The accompanying notes disclosed on pages 9 – 23 are an integral part of the foregoing interim condensed consolidated financial statements.

ORLEN GROUP (in PLN million)
CONSOLIDATED QUARTERLY REPORT FOR THE 1st QUARTER OF 2018 (Translation of a document originally issued in Polish) 9 / 33
EXPLANATORY NOTES TO THE INTERIM CONDENSED CONSOLIDATED FINANCIAL STATEMENTS 1. Principal activity of the ORLEN Group The Parent Company of the Polski Koncern Naftowy ORLEN S.A. Capital Group is Polski Koncern Naftowy ORLEN S.A. (“PKN ORLEN”, “Company”, “Parent Company”) domiciled in Płock, 7 Chemików Street. The core business of the ORLEN Group is crude oil processing and production of fuel, petrochemical and chemical goods, as well as, wholesale and retail of products. The ORLEN Group conducts also exploration, recognition and extraction of hydrocarbons, and generates, distributes and trades of electricity and heat. The activity of the ORLEN Group companies is also service-related activity: storage of crude oil and fuels, transportation, maintenance and overhaul services, laboratory, security, design, administrative, insurance and financial services.
2. Information on principles adopted for the preparation of the interim condensed consolidated financial statements
2.1. Statement of compliance and general principles for preparation The foregoing interim condensed consolidated financial statements (“consolidated financial statements”) were prepared in accordance with requirements of IAS 34 “Interim financial reporting” and in the scope required under the Minister of Finance Regulation of 19 February 2009 on current and periodic information provided by issuers of securities and conditions of recognition as equivalent information required by the law of a non member state (consolidated text: Official Journal 2014, item 133, as amended Official Journal 2016, item 860) (“Regulation”) and present the Polski Koncern Naftowy ORLEN S.A. Capital Group’s (“Group”, “ORLEN Group”) financial position as at 31 March 2018 and as at 31 December 2017, financial results and cash flows for the 3 month period ended 31 March 2018 and 31 March 2017.
The foregoing interim condensed consolidated financial statements were prepared assuming that the Group will continue to operate as a going concern in the foreseeable future. As at the date of approval of the foregoing interim condensed consolidated financial statements there is no evidence indicating that the Group will not be able to continue its operations as a going concern.
The duration of the Parent Company and the entities comprising the ORLEN Group is unlimited.
The foregoing interim condensed consolidated financial statements, except for the consolidated statement of cash flows, were prepared using the accrual basis of accounting.
2.2. Applied accounting principles and amendments to International Financial Reporting Standards (IFRS) 2.2.1. Accounting principles In the foregoing interim condensed consolidated financial statements, the significant accounting policies applied by the Group and significant values based on judgments and estimates were the same as described in separate explanatory notes in the Consolidated Financial Statements for 2017, except for the adopted new IFRS 15 – Revenue from Contracts with Costumers and IFRS 9 - Financial Instruments described in note 2.2.2.
Selected accounting principles - Consolidated financial statements of ORLEN Group for the year ended 31 December 2017 Note
Investments in subsidiaries, jointly controlled entities and associates 6.1
Operating segments 8.1
Sales revenues 9.1.1
Costs 9.1.3
Income tax expenses (tax expense) 9.1.7
Property, plant and equipment 9.2.1
Exploration and extraction of mineral resources 9.2.1
Intangible assets 9.2.2
Investments accounted for under equity method 9.2.4
Impairment of property, plant and equipment and intangible assets 9.2.5
Inventories 9.2.6.1
Trade and other receivables 9.2.6.2
Trade and other liabilities 9.2.6.3
Net debt 9.2.7
Equity 9.2.8
Provisions 9.2.10
Financial instruments 9.3
Fair value measurement 9.3
Lease 9.4.2
Contingent assets and liabilities 9.4.4
The Group adopted the requirements of IFRS 9 and IFRS 15 with a modified retrospective approach with effect from 1 January 2018. According to the option allowed by the standard, the Group resigned from converting comparable data. As at 31 December 2017 and for the 1st quarter of 2017 data were prepared based on IAS 39, IAS 18 and IAS 11. The previously adopted selected accounting principles within sales revenues (IAS 18, IAS 11) and financial instruments (IAS 39) were disclosed in the financial statements for 2017.

ORLEN GROUP (in PLN million)
CONSOLIDATED QUARTERLY REPORT FOR THE 1st QUARTER OF 2018 (Translation of a document originally issued in Polish) 10 / 33
2.2.2. Amendments to International Financial Reporting Standards (IFRS)
IFRS 9 Financial instruments
Selected accounting principles
Measurement of financial assets and liabilities From 1 January 2018, the Group classifies financial assets into one of the following categories: - measured at amortized cost, - measured at fair value through other comprehensive income, - measured at fair value through profit or loss, - hedging financial instruments.
The Group classifies debt financial assets to the appropriate category depending on the business model of financial assets management and on the characteristics of contractual cash flows for a given financial asset.
The Group as assets measured at amortized cost classifies trade receivables, loans granted, other financial receivables as well as cash and cash equivalents.
At the moment of initial recognition, the Group classifies equity instruments, i.e. shares in other entities, to the category of financial instruments measured at fair value through other comprehensive income.
The Group classifies to assets measured at fair value through profit or loss derivatives that are not designated for hedge accounting and hedged items that are measured in accordance with hedge accounting principles.
The Group classifies financial liabilities into one of the following categories: - measured at amortized cost, - measured at fair value through profit or loss, - hedging financial instruments.
The Group as liabilities measured at amortized cost classifies trade liabilities, loans, borrowings and bonds. Liabilities on derivatives not designated for hedge accounting are classified by the Group as measured at fair value through profit or loss.
The Group classifies to the category of hedging financial instruments, financial assets and liabilities which constitute derivative hedging cash flows and fair value.
Measurement of financial assets at amortized cost The Group applies the effective interest rate method to measure financial assets at amortized cost. Trade receivables after initial recognition are measured at amortized cost using the effective interest rate method, including impairment allowances, while trade receivables with a maturity of less than 12 months from the date of recognition (i.e. not including the financing component) and not appointed to factoring, are not discounted and are measured at nominal value.
Measurement of financial assets at fair value through other comprehensive income Gains and losses on a financial asset constituting an equity instrument for which was applied the option of fair value through other comprehensive income is recognized in other comprehensive income, except for revenues from received dividends.
Measurement of financial assets at fair value through profit or loss Gains or losses on the measurement of a financial asset that is classified as measured at fair value through profit or loss are recognized in profit or loss during the period in which they were recognized. Gains or losses from the valuation of items measured at fair value through profit or loss also include interest and dividend income.
Measurement of hedging financial instruments Hedging financial instruments are measured in accordance with the principles of hedge accounting.
Impairment of financial assets IFRS 9 introduces a new approach to estimating the impairment of financial assets measured at amortized cost or at fair value through other comprehensive income (with the exception of investments in capital assets and contract assets). The impairment model is based on the expected loss calculation as opposed to the currently applied model resulting from IAS 39, which was based on the concept of incurred loss. The most important item of financial assets in the Group’s financial statements, which is subject to the new principles of calculating expected credit losses, are trade receivables.
The Group uses the following models for determining impairment allowances: - general model (basic), - simplified model.
The general model is used by the Group for financial assets measured at amortized cost - other than trade receivables and assets measured at fair value through other comprehensive income. In the general model, the Group monitors the changes in the level of credit risk associated with a given financial asset and classifies financial assets to one of the three stages of impairment allowances based on the observation of the change in the credit risk level in relation to the initial recognition of the instrument. Depending on the classification to particular stages, the impairment allowance is estimated in the 12-month horizon (stage 1) or in the life horizon of the instrument (stage 2 and stage 3). On each day ending the reporting period, the Group considers the indications resulting in the classification of financial assets to particular stages of determining impairment allowances. Indications may include changes in the debtor's rating, serious financial problems of the debtor, a significant unfavourable change in its economic, legal or market environment. For the purposes of estimating the expected credit loss, the Group uses default probability levels based on market credit quotes of derivatives for entities with a given rating and from a given sector.
ORLEN GROUP (in PLN million)
CONSOLIDATED QUARTERLY REPORT FOR THE 1st QUARTER OF 2018 (Translation of a document originally issued in Polish) 11 / 33
The Group includes information on the future in the parameters of the expected loss estimation model by calculating the probability parameters of insolvency based on current market quotes.
The simplified model is used by the Group for trade receivables. In the simplified model, the Group does not monitor changes in the credit risk level during the life of the instrument and estimates the expected credit loss in the horizon up to maturity of the instrument. In particular, for the insolvency event, the Group recognizes when the contractor has not satisfied the obligation after 90 days from the due receivables date. For the purpose of estimating the expected credit loss, the Group uses a provision matrix estimated on the basis of historical levels of repayment and recoveries from receivables from contractors. The Group includes information about the future in the parameters used in the expected loss estimation model, through the management adjustment of the basic insolvency probability parameters. To calculate the expected credit loss, the Group determines the probability parameter of receivables defaults estimated on the basis of the analysis of the number of unpaid invoices in the last five years, and the liabilities default rate estimated on the basis of the value of unpaid invoices in the last five years. The expected credit loss is calculated when the receivable is recognized in the statement of financial position and is updated on each subsequent day ending the reporting period, depending on the number of days for which the receivable is due.
Loss/reversal of losses due to impairment of financial instruments The losses/reversal of losses due to impairment of financial instruments include, in particular, losses/reversals of losses due to impairment of trade receivables and losses/reversals of losses due to impairment of granted loans.
Hedge accounting Derivatives designated as hedging instruments from which it is expected that their fair value or resulting from them cash flows will offset changes in fair value or cash flows of hedged item are recognized in accordance with the principles of fair value hedge accounting or cash flow hedges. The Group assesses the effectiveness of hedging both at the moment of establishing the hedging and in subsequent periods, at least at each end of the reporting period. Verification of satisfaction of the conditions for the effectiveness of linking is made on a prospective basis, based on a qualitative analysis. If necessary, the Group uses a quantitative analysis (linear regression method) to confirm an economic relation between the hedging instrument and the hedged item. In the case of cash flow hedge accounting, the Group: - the part of profits or losses related to the hedging instrument, which constitute an effective hedge due to the hedged risk, is recognized in other
comprehensive income, - in addition (in the case of FX hedging - spot risk element), a change in the fair value due to the forward element (including the cross-currency
margin) is recognized within the capital in a separate position (hedging cost), - the inefficient part of profits or losses related to the hedging instrument is recognized in the statement of profit or loss. In the case of hedging
cash flows from operating activities, the ineffective part is recognized in other operating income/expenses, and in the case of hedging cash flows of financing activities in finance income/costs.
- reclassification from capital to the statement of profit or loss is to the line in which the hedged item is presented, - reclassification from capital is made as an adjustment to the initial value of the hedged item (if the realization of the hedged item results in the
recognition of the non-financial asset - for example, an inventory). In the case of fair value hedge (operating activity), changes in the fair value of the hedging instrument and the hedged item are recognized in the statement of profit or loss in the item other operating income/expenses.
The table below presents the impact of the implementation of IFRS 9 on the change in the classification and measurement of the Group's financial assets as at 1 January 2018.
Financial instruments by class Classification according to IAS 39 Classification according to IFRS 9
Unquoted shares Available for sale Financial assets at fair value through other comprehensive income
Loans granted Loans and receivables Measured at amortized cost
Trade and other receivables Loans and receivables Measured at amortized cost
Derivatives not designated as hedge accounting At fair value through profit or loss At fair value through profit or loss
Cash flow hedging instruments Hedging financial instruments Hedging financial instruments
Cash and cash equivalents Loans and receivables Measured at amortized cost
Receivables on settled derivatives Loans and receivables Measured at amortized cost
In the area of hedge accounting, the Group applies the requirements of IFRS 9 in the construction of hedging relationships. In particular, it concerns matching of the definitions of commodity risk hedging to the exposure characteristics and applied risk management strategies. The Group aims to limit the underlying risk in hedging relationships (resulting from various commodity indices on the side of the hedging instrument and the hedged item).
The Group applied principles of recognition the hedging cost within FX hedging transactions, where the forward component and the cross-currency margin is recorded in a separate item in other comprehensive income.
ORLEN GROUP (in PLN million)
CONSOLIDATED QUARTERLY REPORT FOR THE 1st QUARTER OF 2018 (Translation of a document originally issued in Polish) 12 / 33
IFRS 15 Revenue from Contracts with Customers
Selected accounting principles The Group applies the principles of IFRS 15 in a five-step model in relation to the portfolio of contracts (or performance obligations) with similar characteristics, if the entity reasonably expects that the impact of the following principles on the financial statements will not significantly differ from the application of the following principles to individual contracts (or performance obligations).
Requirements to identify a contract with a costumer A contract with a costumer meets its definition when all of the following criteria are met: the parties of the contract have approved the contract and are committed to perform their obligations; the Group can identify each party‘s rights regarding goods or services to be transferred; the Group can identify the payment terms for the goods or services to be transferred; the contract has commercial substance and it is probable that the Group will collect the consideration to which it will be entitled in exchange for the goods or services that will be transferred to the customer.
Identification of performance obligations At contract inception the Group assesses the goods or services promised in the contract with a customer and identifies as a performance obligation each promise to transfer to the customer: goods or services (or a bundle of goods or services) that can be separated or groups of separate goods or services which are basically the same and for which the transfer to the customer is of the same nature.
Determination of the transaction price The Group considers the terms of the contract and its the customary business practices to determine the transaction price. The transaction price is the amount of consideration to which the Group expects to be entitled in exchange for transferring promised goods or services to a customer, excluding amounts collected on behalf of third parties (for example, some sales taxes, fuel charges, excise taxes). The consideration promised in the contract with a customer may include fixed amounts, variable amounts or both.
To estimate variable consideration, the Group decided to apply the most probable value method for contracts with one value threshold and the expected value method for contracts with more value thresholds from which a rebate is granted to the customer.
Allocating the transaction price to individual performance obligations The Group allocates the transaction price to each performance obligation (or distinct good or service) at an amount that reflects the amount of consideration to which the Group expects to be entitled in exchange for transferring the promised goods or services to the customer.
Recognition of revenue when performance obligations are satisfied The Group recognises revenue when (or as) the Group satisfies performance obligations by transferring a promised good or service (i.e. an asset) to a costumer (the costumer obtains control of that asset). Revenue is recognised as amounts equal to the transaction price that has been allocated to a given performance obligation. The Group transfers control of good or service over time and, therefore, satisfies a performance obligation and recognises revenue over time, if one of the following criteria is met: - the customer simultaneously receives and consumes the benefits from performance as the Group performs, - the asset is created or enhanced as a result of the performance, and the customer controls the asset as it is created or enhanced, - as a result of the performance of the service, an alternative component for the Group is not created, and the Group has an enforceable right to
payment for performance completed to date. Impact of the implementation of new IFRS 9 and IFRS 15
The table below summarizes the impact of the implementation of IFRS 9 and IFRS 15 on the Group's consolidated financial statements as at 1 January 2018:
IFRS / IAS applied
31 December 2017 Carrying amount
Change resulting from change in
classification
Change resulting from change in
measurement
1 January 2018 Carrying amount
1 January 2018 Impact on
retained earnings
Financial assets available for sale IAS 39 84 (84) - - -
Financial assets at fair value through other comprehensive income
IFRS 9 - 84 - 84 -
Trade and other receivables IAS 39/IFRS 9 9 518 - (9) 9 509 (9)
Other short-term liabilities due to loyalty programs IAS 18 145 (145) - - -
Other short-term liabilities due to prepaid cards IAS 18 19 (19) - - -
Liabilities from contracts with customers IFRS 15 - 164 - 164 -
The change in trade and other receivables results from the change in the measurement of impairment allowances estimated in accordance with IFRS 9, which takes into account the requirements of the expected credit losses model. The impact of the application of IFRS 15 on the items of the consolidated financial statements of the Group in the 1st quarter of 2018 compared to IAS 11, IAS 18 and related interpretations was immaterial. Additionally, the Group disclosed information on the estimated effect of applying IFRS 9 and IFRS 15 in the annual consolidated financial statements of the Group for 2017 in note 5.5.
The Group intends to adopt the published, but not effective as at the date of publication of the interim condensed consolidated financial statements, amendments to IFRS, in accordance with their effective date.
ORLEN GROUP (in PLN million)
CONSOLIDATED QUARTERLY REPORT FOR THE 1st QUARTER OF 2018 (Translation of a document originally issued in Polish) 13 / 33
2.3. Functional currency and presentation currency of financial statements and methods applied to translation of financial data 2.3.1. Functional currency and presentation currency
The functional currency of the Parent Company and presentation currency of the foregoing interim condensed consolidated financial statements is the Polish Zloty (PLN). The data is presented in PLN million in the consolidated financial statements, unless stated differently. 2.3.2. Methods applied to translation of financial data
Translation into PLN of financial statements of foreign entities, for consolidation purposes:
particular assets and liabilities – at spot exchange rate as at the end of the reporting period,
items of the statement of profit or loss and other comprehensive income and the statement of cash flows - at the average exchange rate for the reporting period (arithmetic average of daily average exchange rates published by the National Bank of Poland ("NBP") in a given period).
Foreign exchange differences resulting from the above recalculations are recognized in equity in the line exchange differences on translating foreign operations.
CURRENCY
Average exchange rate for the reporting period
Exchange rate as at the end
of the reporting period
3 MONTHS ENDED
31/03/2018
3 MONTHS ENDED
31/03/2017 31/03/2018 31/12/2017
EUR/PLN 4.1802 4.3229 4.2085 4.1709 USD/PLN 3.4000 4.0597 3.4139 3.4813 CZK/PLN 0.1646 0.1600 0.1659 0.1632 CAD/PLN 2.6905 3.0681 2.6529 2.7765
2.4. Information concerning the seasonal or cyclical character of the ORLEN Group’s operations in the presented period The ORLEN Group does not report any material seasonal or cyclical character of its operations. 3. Group’s achievements accompanied by factors having a significant impact on quarterly condensed consolidated financial
statements Profit or loss
The increase of sales revenues of the ORLEN Group by PLN 366 million (y/y) to PLN 23,241 million reflects a 4% (y/y) increase in sales volumes and crude oil prices by 24% (y/y) and also as a result of the quotation of main refinery and petrochemical products. In the 1st quarter of 2018, there was an increase (y/y) in gasoline prices (by 17%), gas oil (by 23%), light fuel oil (by 22%), heavy fuel oil (by 22%), ethylene (by 4%) and propylene (by 12%).
The operating activity expenses increased by PLN (1,096) million (y/y) to PLN (21,949) million. The largest item in this cost structure constitute the costs of materials and energy consumption related mainly to the crude oil used in technological processes. The increase in the costs of materials and energy consumption by 17% (y/y) resulted mainly from higher by 13 USD/bbl (y/y) crude oil and increase by 8% (y/y) crude oil processing to 8.5 million tons.
Positive result of other operating activities amounted to PLN 82 million and decreased by PLN (103) million (y/y) mainly due to lack of compensation related to the accident on installation FCC (Fluid Catalytic Cracking) in Unipetrol Group from the 1st quarter 2017 in the amount of PLN 163 million.
Share in profit from investments accounted for under equity method decreased by PLN (34) million (y/y) to the PLN 35 million.
As a result profit from operations amounted to PLN 1,414 million and was lower by PLN (862) million (y/y)
Additional information on the change in the result (y/y), including after eliminating the impact of changes in crude oil prices on the valuation of inventories, is presented in note B1.
Net finance expenses in the described period amounted to PLN (168) million and included mainly settlement and valuation of net financial instruments in the amount of PLN (108) million, net interest expenses in the amount of PLN (40) million and net foreign exchange losses in the amount of PLN (10) million. After consideration of tax charges in the amount of PLN (201) million, the net profit of the ORLEN Group for the 3 months of 2018 amounted to PLN 1,044 million with compared PLN 2,088 million in the corresponding period of the previous year. Statement of financial position As at 31 March 2018, total assets of the ORLEN Group amounted to PLN 60,092 million and was lower by PLN (572) million in comparison with 31 December 2017.
As at 31 March 2018, the value of non-current assets amounted to PLN 32,126 million and was higher by PLN 386 million in comparison with the end of the previous year, mainly due to increasing the value of property, plant and equipment and intangible assets by PLN 397 million.
Balance change of property, plant and equipment and intangible assets comprised mainly investment expenditures in the amount of PLN 802 million, primarily for the Construction of the Polyethylene 3 installation in Unipetrol Group, heat and power plants CCGT and Metathesis Installation in Płock, upstream projects in Canada, depreciation and amortisation in the amount of PLN (626) million, granted CO2 emission
ORLEN GROUP (in PLN million)
CONSOLIDATED QUARTERLY REPORT FOR THE 1st QUARTER OF 2018 (Translation of a document originally issued in Polish) 14 / 33
rights for 2018 in the amount of PLN 271 million and impact of exchange differences from recalculation of balances of foreign entities of the ORLEN Group on PLN in the amount of PLN (39) million.
The value of current assets decreased by PLN (958) million, mainly as result of decrease of cash and cash equivalents by PLN (2,164) million, increase in trade and other receivables by PLN 344 million and increase in balance of inventories by PLN 908 million mainly as a result of the increase in quantity.
As at 31 March 2018, equity amounted to PLN 32,728 million and was lower by PLN (2,483) million in comparison with the end of 2017, mainly due to the redemption of 31.04% of shares in non-controlling interests of Unipetrol a.s. in the amount of PLN (3,531) million and recognition of net profit for 3 months of 2018 in the amount of PLN 1,044 million.
As at 31 March 2018 provisions amounted to PLN 1,722 million and were higher by PLN 147 million compared to the end of 2017, mainly due to a higher provision balance of estimated CO2 emissions.
As at 31 March 2018, net financial indebtedness of the ORLEN Group amounted to PLN 5,154 million and was higher by PLN 4,393 million in comparison with the end of 2017. Change of indebtedness included net proceeds of loans under existing credit lines in the amount of PLN 2,125 million, decrease of cash and cash equivalents balance by PLN 2,164 million and the net impact of negative exchange differences from revaluation of indebtedness valuation and interests in total amount of PLN 104 million. Statement of cash flows
Proceeds of net cash from operating activities for the 3 months of 2018 amounted to PLN 510 million and comprised mainly profit from operations increased by depreciation and amortisation in the amount of PLN 2,040 million, the negative impact of increase in a net working capital by PLN (1,398) million and paid income tax in the amount of PLN (203) million.
Net cash used in investing activities for the 3 months of 2018 amounted to PLN (4,796) million and comprised mainly net expenses for the acquisition of Unipetrol shares of PLN (3,531) million and acquisition and disposal of property, plant and equipment, intangible assets and perpetual usufruct of land in the amount of PLN (1,091) million.
Net proceeds of cash used in financing activities for the 3 months of 2018 amounted to PLN 2,088 million and comprised mainly the net proceeds of loans in the amount of PLN 2,125 million and interest paid in the amount of PLN (28) million.
After consideration the revaluation of cash due to exchange differences, the cash balance in the 3 months of 2018 decreased by PLN (2,164) million and as at 31 March 2018 amounted to PLN 4,080 million. Factors and events which may influence on future results Similar factors as described above will influence on future financial results.

ORLEN GROUP (in PLN million)
CONSOLIDATED QUARTERLY REPORT FOR THE 1st QUARTER OF 2018 (Translation of a document originally issued in Polish) 15 / 33
3.1. Organization of the ORLEN Group The ORLEN Group includes PKN ORLEN as the Parent Company and entities located in Poland, Germany, Czech Republic, Lithuania, Malta, Sweden, the Netherlands, Slovakia, Hungary, Estonia, Latvia and the USA and Canada.
3.2. Changes in the structure of the ORLEN Group from 1 January 2018 up to the date of preparation of the foregoing report - On 2 February 2018, PKN ORLEN SA acquired 17 shares from minority shareholders of ORLEN KolTrans Sp. z o.o. Currently, in the
share capital of ORLEN KolTrans Sp. z o.o, PKN ORLEN owns 99.91% of shares, and non-controlling shareholders - 0.09% of shares. - On 23 February 2018 PKN ORLEN purchased 56,280,592 Unipetrol, a.s. shares for 3,531 million PLN, which were subscribed for the
sale in response to the announcement of a voluntary tender offer. The Unipetrol shares purchased by PKN ORLEN represent 31.04% of the Unipetrol share capital. The above transaction was result in a decrease in equity of the non-controlling interests in the amount of PLN (2,564) million and decrease retained earnings by PLN (967) million. Currently, in the share capital of UNIPETROL a.s. PKN ORLEN owns 94.03% of shares, and non-controlling shareholders owns 5.97% of shares.
Changes in the Group structure are an element of the ORLEN Group strategy, assuming a focus on core activities and allocating capital for development of the Group in the most prospective areas.
4. Segment reporting The operations of the ORLEN Group is conducted in: - the Downstream segment, which includes integrated areas of refining, petrochemical production and sales and operations in the energy
production activity, - the Retail segment, which includes activity carried out at the petrol stations, - the Upstream segment, which includes the activity related to exploration and extraction of mineral resources,
and Corporate Functions i.e. reconciling items, which include activities related to management, administration and remaining activities not allocated to separate operating segments. The allocation of the ORLEN Group’s companies to operating segments and Corporate Functions was presented in note 3.1.

ORLEN GROUP (in PLN million)
CONSOLIDATED QUARTERLY REPORT FOR THE 1st QUARTER OF 2018 (Translation of a document originally issued in Polish) 16 / 33
Revenues, costs, financial results, investments expenditures
for the 3 month period ended 31 March 2018
NOTE Downstream Segment
Retail Segment
Upstream Segment
Corporate Functions
Adjustments Total
(unaudited) (unaudited) (unaudited) (unaudited) (unaudited) (unaudited)
External revenues 5.1 15 161 7 919 145 16 - 23 241 Inter-segment revenues 3 610 9 - 108 (3 727) -
Sales revenues 18 771 7 928 145 124 (3 727) 23 241
Operating expenses (17 677) (7 576) (132) (291) 3 727 (21 949)
Other operating income 5.3 281 22 - 41 - 344
Other operating expenses 5.3 (176) (17) (22) (47) - (262)
Loss/reversal of loss due to impairment of financial instruments
9 - - (4) - 5
Share in profit from investments accounted for under equity method 35 - - - - 35
Profit/(Loss) from operations 1 243 357 (9) (177) - 1 414
Net finance income and costs 5.4 (168) Loss/reversal of loss due to impairment of financial instruments
(1)
Profit before tax 1 245
Tax expense (201)
Net profit 1 044
Depreciation and amortisation 5.2 412 114 75 25 - 626
EBITDA 1 655 471 66 (152) - 2 040
CAPEX 400 128 247 27 - 802
for the 3 month period ended 31 March 2017
NOTE Downstream Segment
Retail Segment
Upstream Segment
Corporate Functions
Adjustments Total
(unaudited) (unaudited) (unaudited) (unaudited) (unaudited) (unaudited)
External revenues 5.1 14 833 7 892 134 16 - 22 875 Inter-segment revenues 3 220 11 - 74 (3 305) -
Sales revenues 18 053 7 903 134 90 (3 305) 22 875 Operating expenses (16 141) (7 634) (129) (254) 3 305 (20 853) Other operating income 5.3 223 17 - 9 - 249 Other operating expenses 5.3 (26) (17) (1) (20) - (64) Share in profit from investments accounted for under equity method 69 - - - - 69
Profit/(Loss) from operations 2 178 269 4 (175) - 2 276
Net finance income and costs 5.4 263
Profit before tax 2 539
Tax expense (451)
Net profit 2 088
Depreciation and amortisation 5.2 361 103 75 23 - 562
EBITDA 2 539 372 79 (152) - 2 838
CAPEX 446 88 153 36 - 723
EBITDA – profit/(loss) from operations increased by depreciation and amortization CAPEX - increase of property, plant and equipment, intangible assets, investment property and perpetual usufruct of land together with the capitalisation of borrowing costs
Assets by operating segments
31/03/2018
(unaudited) 31/12/2017
Downstream Segment 43 468 42 159
Retail Segment 6 700 6 511
Upstream Segment 3 849 3 839
Segment assets 54 017 52 509
Corporate Functions 6 156 8 206
Adjustments (81) (51)
60 092 60 664

ORLEN GROUP (in PLN million)
CONSOLIDATED QUARTERLY REPORT FOR THE 1st QUARTER OF 2018 (Translation of a document originally issued in Polish) 17 / 33
5. Other notes 5.1. Sales revenues Performance obligations
While establishing contracts, the Group commits to deliver mainly refining, petrochemical and energy products and merchandise to customers. Within the contracts, the Group acts as a principal. There are no obligations for returns, refunds and other similar obligations. The guarantees provided within the contracts are guarantees assuring the customer that the product complies with the established specification. They do not involving the performance of a separate service.
Within the Downstream segment, in the sales of refinery and petrochemical products, the moment of performance all obligations within the contract follows the delivery of the good, and the moment of recognition of revenue from individual performance obligations depends on the applied delivery terms. Within the Downstream segment, there is mainly sales with deferred payment dates.
Within the Retail segment, there are both cash sales as well as sales with deferred payment dates, performed based on fleet contracts. The moment of satisfaction of the performance obligation is the moment of release of the good. In contracts with costumers of the Downstream and Retail segments, in most cases are payment dates that do not exceed 30 days.
Within the Upstream segment, revenues relate mainly to the sale of gas and crude oil. The Group transfers control over the sold products over the time, measures the degree of satisfaction of the performance obligation on a monthly basis and based on it recognizes revenues. In contracts with customers of the Upstream segment, in most cases are applied payment dates that do not exceed 60 days.
Variability of consideration in contracts with customers is related mainly with volume rebates. The Group also defers the part of revenue related to the VITAY loyalty program, according to which the customer is entitled to future benefits (i.e. VITAY points).
5.1.1. Sales revenues by assortments
3 MONTHS ENDED
31/03/2018 (unaudited)
3 MONTHS ENDED
31/03/2017 (unaudited)
Downstream Segment
Medium distillates 6 791 6 654 Light distillates 2 656 2 969 Heavy fractions 1 360 1 304 Monomers 914 714 Polymers 712 647 PTA 382 432 Plastics 383 416 Fertilizers 209 221 Aromas 321 276 Other 1 433 1 200
15 161 14 833
Retail Segment Medium distillates 4 125 3 927 Light distillates 2 899 3 133 Other ** 895 832
7 919 7 892
Upstream Segment NGL * 79 58 Crude oil 18 19 Natural Gas 47 54 Other 1 3
145 134
Corporate Functions 16 16
23 241 22 875 * NGL (Natural Gas Liquids)
** The line other in retail segment includes mainly sale of non-fuel merchandise
In the 3 month period ended 31 March 2018 revenues from contracts with customers amounted to PLN 23 205 million, while other revenues related to rent and lease services amounted to PLN 36 million.
ORLEN GROUP (in PLN million)
CONSOLIDATED QUARTERLY REPORT FOR THE 1st QUARTER OF 2018 (Translation of a document originally issued in Polish) 18 / 33
5.2. Operating expenses
Cost by nature
3 MONTHS ENDED
31/03/2018 (unaudited)
3 MONTHS ENDED
31/03/2017 (unaudited)
Materials and energy (16 458) (14 062)
Cost of merchandise and raw materials sold (3 713) (4 696)
External services (1 033) (1 010)
Employee benefits (659) (586)
Depreciation and amortisation (626) (562)
Taxes and charges (352) (284)
Other (85) (103)
(22 926) (21 303)
Change in inventories 927 393
Cost of products and services for own use 50 57
Operating expenses (21 949) (20 853)
Distribution expenses 1 135 1 037
Administrative expenses 378 367
Cost of sales (20 436) (19 449)
5.3. Other operating income and expenses
Other operating income
3 MONTHS ENDED
31/03/2018 (unaudited)
3 MONTHS ENDED
31/03/2017 (unaudited)
Profit on sale of non-current non-financial assets 4 12
Reversal of provisions 4 7
Reversal of receivables impairment allowances - 4
Reversal of impairment allowances of property, plant and equipment and intangible assets and other non-current assets
9
7
Penalties and compensations 100 176
Settlement and valuation of derivative financial instruments related to operational exposure 129 -
Ineffective part related to operational exposure 39 -
Other 59 43
344 249
The line penalties and compensation in the 3 month period ended 31 March 2018 includes mainly penalties and compensation received for improper execution of the contract of the power plant CCGT in Płock and the power plant CCGT in Włocławek in the total amount of PLN 84 million. In the 3 month period ended 31 March 2017 this line includes mainly the impact of partial settlement of damage related to the accident on installation FCC (Fluid Catalytic Cracking) in Unipetrol Group of May 2016 in the amount of PLN 163 million.
Other operating expenses
3 MONTHS ENDED
31/03/2018 (unaudited)
3 MONTHS ENDED
31/03/2017 (unaudited)
Loss on sale of non-current non-financial assets (14) (9)
Recognition of provisions (6) (9)
Recognition of receivables impairment allowances - (5)
Recognition of impairment allowances of property, plant and equipment and intangible assets and other non-current assets
(6) (9)
Settlement and valuation of derivative financial instruments related to operational exposure (148) -
Ineffective part related to operational exposure (47) -
Other (41) (32)
(262) (64)
Beginning from 1 January 2018 the Group presents settlement and valuation of derivatives not designated as hedge accounting and the ineffective part of hedged derivatives related to hedging exposures to risk related to operating activities in other operating income and expenses. In previous periods, the Group presented the above transactions within its finance income. Comparative data were not converted due to their immaterial impact. As a result of changes in the presentation, the Group recognizes both changes in the value of the hedged item and the effects of hedging transactions within the result from operations.

ORLEN GROUP (in PLN million)
CONSOLIDATED QUARTERLY REPORT FOR THE 1st QUARTER OF 2018 (Translation of a document originally issued in Polish) 19 / 33
5.4. Finance income and costs
Finance income
3 MONTHS ENDED
31/03/2018 (unaudited)
3 MONTHS ENDED
31/03/2017 (unaudited)
Interest calculated using the effective interest rate method 10 9
Net foreign exchange gain - 364
Settlement and valuation of derivative financial instruments 462 299
Other 31 7
503 679
Finance costs
3 MONTHS ENDED
31/03/2018 (unaudited)
3 MONTHS ENDED
31/03/2017 (unaudited)
Interest calculated using the effective interest rate method (48) (53)
Other interest (2) (2)
Net foreign exchange loss (10) -
Settlement and valuation of derivative financial instruments (570) (351)
Other (41) (10)
(671) (416)
Borrowing costs capitalized in the 3 month period ended 31 March 2018 and 31 March 2017 amounted to PLN (9) million and PLN (18) million, respectively. 5.5. Loans and bonds
Non-current Current Total
31/03/2018 (unaudited)
31/12/2017 31/03/2018 (unaudited)
31/12/2017 31/03/2018 (unaudited)
31/12/2017
Loans 2 105 - 97 48 2 202 48
Bonds 5 726 6 688 1 306 269 7 032 6 957
7 831 6 688 1 403 317 9 234 7 005
In the period covered by the foregoing interim condensed consolidated financial statements, as well as after the reporting date, there were no instances of principal or interest non repayment nor loan covenant violations.
5.6. Derivatives and other assets and liabilities Derivatives and other assets
Non-current Current Total
31/03/2018 (unaudited)
31/12/2017 31/03/2018 (unaudited)
31/12/2017 31/03/2018 (unaudited)
31/12/2017
Cash flow hedging instruments 253 303 338 311 591 614
currency forwards 253 303 240 225 493 528
commodity swaps - - 98 86 98 86
Derivatives not designated as hedge accounting 4 - 98 123 102 123
currency forwards - - 31 89 31 89
commodity swaps - - 66 33 66 33
currency interest rate swaps - - 1 1 1 1
interest rate swaps 4 - - - 4 -
Fair value hedging instruments 3 - 9 - 12 - commodity swaps 3 - 9 - 12 -
Derivatives 260 303 445 434 705 737
Other financial assets 102 93 68 133 170 226
receivables on settled derivatives - - 59 126 59 126
financial assets at fair value through other comprehensive income
89 - - - 89 -
financial assets available for sale - 84 - - - 84
other 13 9 9 7 22 16
Other non-financial assets 242 237 - - 242 237
investment property 105 104 - - 105 104
perpetual usufruct of land 117 115 - - 117 115
other 20 18 - - 20 18
Other assets 344 330 68 133 412 463

ORLEN GROUP (in PLN million)
CONSOLIDATED QUARTERLY REPORT FOR THE 1st QUARTER OF 2018 (Translation of a document originally issued in Polish) 20 / 33
Derivatives and other liabilities
Non-current Current Total
31/03/2018 (unaudited)
31/12/2017 31/03/2018 (unaudited)
31/12/2017 31/03/2018 (unaudited)
31/12/2017
Cash flow hedging instruments - - 174 141 174 141
currency forwards - - 17 7 17 7
commodity swaps - - 157 134 157 134
Derivatives not designated as hedge accounting 51 75 111 172 162 247
currency forwards - - 11 100 11 100
commodity swaps - - 78 72 78 72
interest rate swaps 51 56 - - 51 56
currency interest rate swaps - 19 22 - 22 19
Fair value hedging instruments 2 - 2 - 4 - commodity swaps 2 - 2 - 4 -
Derivatives 53 75 287 313 340 388
Other financial liabilities 315 302 38 125 353 427
liabilities on settled derivatives - - 38 125 38 125
investment liabilities 111 108 - - 111 108
finance lease 171 166 - - 171 166
other 33 28 - - 33 28
Other non-financial liabilities 9 9 254 195 263 204 deferred income, incl.: 9 9 254 195 263 204
VITAY loyalty program, prepaid cards - - - 164 - 164
rights granted free of charge - - 215 - 215 -
Other liabilities 324 311 292 320 616 631
5.7. Provisions
Non-current Current Total
31/03/2018 (unaudited)
31/12/2017 31/03/2018 (unaudited)
31/12/2017 31/03/2018 (unaudited)
31/12/2017
Environmental 624 626 61 67 685 693
Jubilee bonuses and post-employment benefits
239 238 39 39 278 277
CO₂ emissions, energy certificates - - 556 376 556 376
Other 39 38 164 191 203 229
902 902 820 673 1 722 1 575
5.8. Methods applied in determining fair value (fair value hierarchy)
As compared to the previous reporting period the Group did not change the valuation methods concerning financial instruments. Methods applied in determining the fair value were described in the Consolidated Financial Statements for the year 2017 in note 9.3.3. Fair value hierarchy
-
31/03/2018 (unaudited)
31/12/2017
Level 2
Financial assets
Derivatives 705 737
705 737
Financial liabilities
Derivatives 340 388
340 388
The fair value of financial assets and liabilities quoted on active markets is determined based on market quotations (so called Level 1). In other cases, the fair value is determined based on other input data which are directly or indirectly observable (so called Level 2) or unobservable inputs (so called Level 3). During the reporting period and comparative period there were no reclassifications in the Group between Level 1 and Level 2 of the fair value hierarchy. 5.9. Finance lease payments As at 31 March 2018 and as at 31 December 2017 the Group possessed as a lessee the finance lease agreements, concerning mainly buildings, technical equipment and machinery and means of transportation.
31/03/2018 (unaudited)
31/12/2017
Value of future minimum lease payments 260 254
Present value of future minimum lease payments 204 198

ORLEN GROUP (in PLN million)
CONSOLIDATED QUARTERLY REPORT FOR THE 1st QUARTER OF 2018 (Translation of a document originally issued in Polish) 21 / 33
5.10. Future commitments resulting from signed investment contracts As at 31 March 2018 and as at 31 December 2017 , the value of future commitments resulting from investment contracts signed until that day amounted to PLN 1,621 million and PLN 1,538 million, respectively. 5.11. Issue, redemption and repayment of debt securities In the 1st quarter of 2018 PKN ORLEN issued/redeemed short term bonds in favour of the Group companies as a part of liquidity optimisation in the ORLEN Group, using the corporate bond issue program from 2012. These transactions are eliminated at the ORLEN Group level. 5.12. Proposal of distribution of the profit for 2017
The Management Board of PKN ORLEN, after considering the liquidity situation and achievement of strategic financial objectives, proposes to distribute the net profit of PKN ORLEN for the year 2017 in the amount of PLN 6,101,792,575.09 as follows: PLN 1,283,127,183 will be allocated as a dividend payment (PLN 3 per 1 share) and the remaining amount of PLN 4,818,665,392.09 as reserve capital. The Management Board of PKN ORLEN recommends 20 July 2018 as the dividend date and 3 August 2018 as the dividend payment date. This recommendation of the Management Board will be presented to the General Shareholders’ Meeting of PKN ORLEN, which will make a conclusive decision in this matter. 5.13. Contingent assets and liabilities 5.13.1. Contingent assets On 13 August 2015 the steam cracker unit accident in Unipetrol Group took place. Based on the insurance policies Unipetrol Group expects insurers to cover reconstruction costs of installations lost business profits, which estimated at approximately PLN 2,206 million translated using the exchange rate as at 31 March 2018 (representing CZK 13,300 million). In 2016 Group recognized in other operating income amounts of partial compensation received from insurers in the amount of PLN 1,280 million and in 2017 in the amount of PLN 442 million. After consideration the above amounts the value of contingent asset as at 31 March 2018 due to described above damage was estimated in the amount of approximately PLN 415 million translated using the exchange rate as at 31 March 2018 (representing CZK 2,500 million). The final amount of compensation will depend on the final agreement with insurers. The steam cracker unit resumed work in the 4th quarter of 2016. 5.13.2. Contingent liabilities
Information concerning significant proceedings in front of court, body appropriate for arbitration proceedings or in front of administration bodies in which the companies of the ORLEN Group act as the defendant with the total value not exceeding 10% of the Issuer’s equity: I.P.-95 s.r.o. compensation claim against UNIPETROL RPA s.r.o. On 23 May 2012, UNIPETROL RPA s.r.o. received from the District Court in Ostrava a claim brought by I.P.-95 s.r.o. for compensation related to the filing by UNIPETROL RPA s.r.o. a motion for bankruptcy of I.P.-95 s.r.o. in November 2009. The total amount of the claim is approximately PLN 297 million, translated using the exchange rate as at 31 March 2018 (representing CZK 1,789 million). UNIPETROL RPA s.r.o. is one of eight defendants which the claim was brought against. At the request of the I.P.-95 s.r.o proceeding is pending concerning the accession to the claim as plaintiff NESTARMO TRADING LIMITED. Finally the court refused the Company to permission to enter to the case. According to UNIPETROL RPA s.r.o the claim is without merit. At the beginning of February 2018, the court dismissed in entirety claim ruling in favour of UNIPETROL RPA s.r.o. I.P.-95 s.r.o. appealed against the decision of the court of first instance to the court of appeals. Claim of Warter Fuels S.A. (before: OBR S.A.) for compensation On 5 September 2014, OBR S.A. (currently: Warter Fuels S.A.) filled an action against PKN ORLEN with the District Court in Łódź for a claim for payment in respect of an alleged breach by PKN ORLEN of patent rights. The amount of the claim in the lawsuit was estimated by Warter Fuels S.A. in the amount of approximately PLN 83 million. The claim covers the adjudged sum of money from PKN ORLEN for Warter Fuels S.A. in the amount corresponding to the value of the license fee for the use of the solution under the above patent and adjudge the obligation to repay the benefits derived from the use of this solution. On 16 October 2014 PKN ORLEN responded to the lawsuit. By the procedural document from 11 December 2014 the value of the dispute was referred to by the plaintiff in the amount of approximately PLN 247 million. By the court order from 21 May 2015 the parties were directed to mediation. Mediation proceedings were completed in the 2nd quarter of 2016. The case returned to the District Court in Łódź. The first hearing was held on 19 October 2016. At the hearing on 22 March 2017 witnesses were heard. The case is before the court of first instance. The next hearing date was set on May 2018. In the opinion of PKN ORLEN the above claims are without merit. Polocktransneft Druzhba claim against AB ORLEN Lietuva On 21 September 2017, AB ORLEN Lietuva received from the court a claim brought by the Belarusian company Polocktransneft Druzhba (operator of the Belarus section of the Druzhba pipeline) for payment of compensation for crude oil (so-called ‘technological oil’) back in 1992 it was located in Lithuanian section of the Druzhba pipeline belonging to ORLEN Lietuva. Operation of this section was stopped in 2006. Polocktransneft Druzhba believes that this oil was its property. The value of the claim is approximately PLN 287 million converted by exchange rate as at 31 March 2018 (representing USD 84 million). The claim also includes a request for procedural interest and litigation cost. ORLEN Lietuva responded to the claim. On 15 March 2018 a hearing took place. On 29 March 2018, the court dismissed the plaintiff's claim. Polokotransneft Druzhba has the right to appeal against the judgment dismissing the claim. According to ORLEN Lietuva, the above claim is without merit.
Except of described above proceedings, the Group has not identified any other significant contingent liabilities.

ORLEN GROUP (in PLN million)
CONSOLIDATED QUARTERLY REPORT FOR THE 1st QUARTER OF 2018 (Translation of a document originally issued in Polish) 22 / 33
5.14. Related parties transactions
5.14.1. Transactions of the key executive personnel and their relatives with related parties of the ORLEN Group As at 31 March 2018 and as at 31 December 2017 and in the 3 month period ended 31 March 2018 and 31 March 2017, on the basis of submitted declarations, there were no transactions of related parties with members of the Management Board and the Supervisory Board of the Parent Company. In the 3 month period ended 31 March 2018 and 31 March 2017 on the basis of submitted declarations, there were transactions of close relatives with the other key executive personnel of the Parent Company and key executive personnel of the ORLEN Group companies with related parties in the amount of PLN 0.12 million and PLN 0.1 million, respectively; included the main amounts regarded purchase of legal services and marketing services. As at 31 March 2018 there were no trade and other liabilities due to the above transactions and as at 31 December 2017 balance of liabilities was not significant. 5.14.2. Remuneration of key executive personnel of the Parent Company and ORLEN Group companies
3 MONTHS ENDED
31/03/2018 (unaudited)
3 MONTHS ENDED
31/03/2017 (unaudited)
Parent Company
Short-term employee benefits 11.1 11.2
Termination benefits (severance pay and other remuneration) 4.6 0.1
Subsidiaries
Short-term employee benefits 32.1 29.3
Termination benefits (severance pay and other remuneration) 1.5 0.8
49.3 41.4
The above table presents remuneration paid and due or potentially due to the key management personnel of the Parent Company and subsidiaries in the reporting period.
The value of provisions for post-employment benefits and other long term employee benefits for the key management personnel of the Parent Company and subsidiaries are at the same level as presented in the consolidated financial statements of the ORLEN Group for the year ended 31 December 2017 in note 9.4.6.1. and are updated on an annual basis.
5.14.3. ORLEN Group companies’ transactions and balances of settlements with related parties Sales Purchases
3 MONTHS
ENDED 31/03/2018
3 MONTHS ENDED
31/03/2017
3 MONTHS ENDED
31/03/2018
3 MONTHS ENDED
31/03/2017 (unaudited) (unaudited) (unaudited) (unaudited)
Jointly-controlled entities 799 683 (37) (35) joint ventures 758 651 (11) (10) joint operations 41 32 (26) (25)
Associates - 7 - (1)
799 690 (37) (36)
Trade and other receivables Trade and other liabilities
31/03/2018 31/12/2017 31/03/2018 31/12/2017
(unaudited) (unaudited)
Jointly-controlled entities 596 484 16 16
joint ventures 579 463 6 8
joint operations 17 21 10 8
596 484 16 16
The above transactions with related parties include mainly sales and purchases of refinery and petrochemicals products and services. In the 3 month period ended 31 March 2018 and 31 March 2017 there were no related parties transactions within the Group concluded on other than an arm’s length basis. 5.14.4. Transactions with entities related to the State Treasury As at 31 March 2018 and as at 31 December 2017 the State Treasury owned 27.52% of the ORLEN Group Parent Company's shares - PKN ORLEN and has ability to exert a significant influence on it. The Group identified transactions with related parties with the State Treasury mainly on the basis of "The Council of Ministers Regulation of 3 January 2017 on the list of companies in which the rights of the State Treasury shares carry other than the President Council of Ministers members of the Council of Ministers’, Government Plenipotentiaries or state legal entities” (Official Journal 2017, item 10, as amended Official Journal 2017, item 205 and item 1164).
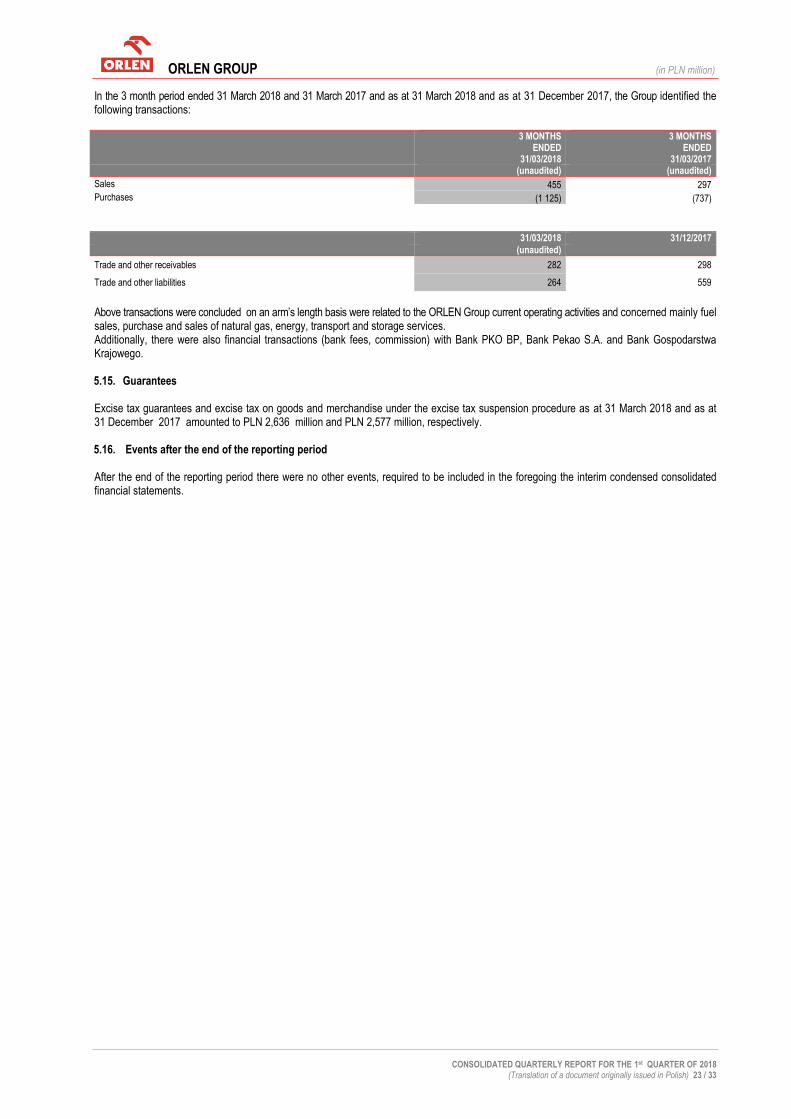
ORLEN GROUP (in PLN million)
CONSOLIDATED QUARTERLY REPORT FOR THE 1st QUARTER OF 2018 (Translation of a document originally issued in Polish) 23 / 33
In the 3 month period ended 31 March 2018 and 31 March 2017 and as at 31 March 2018 and as at 31 December 2017, the Group identified the following transactions:
3 MONTHS
ENDED 31/03/2018
3 MONTHS ENDED
31/03/2017 (unaudited) (unaudited)
Sales 455 297
Purchases (1 125) (737)
31/03/2018 31/12/2017
(unaudited)
Trade and other receivables 282 298
Trade and other liabilities 264 559
Above transactions were concluded on an arm’s length basis were related to the ORLEN Group current operating activities and concerned mainly fuel sales, purchase and sales of natural gas, energy, transport and storage services. Additionally, there were also financial transactions (bank fees, commission) with Bank PKO BP, Bank Pekao S.A. and Bank Gospodarstwa Krajowego. 5.15. Guarantees Excise tax guarantees and excise tax on goods and merchandise under the excise tax suspension procedure as at 31 March 2018 and as at 31 December 2017 amounted to PLN 2,636 million and PLN 2,577 million, respectively. 5.16. Events after the end of the reporting period After the end of the reporting period there were no other events, required to be included in the foregoing the interim condensed consolidated financial statements.

OTHER INFORMATION TO CONSOLIDATED QUARTERLY REPORT
FOR THE 3 MONTH PERIOD ENDED 31 MARCH
2018

ORLEN GROUP (in PLN million)
CONSOLIDATED QUARTERLY REPORT FOR THE 1st QUARTER OF 2018 (Translation of a document originally issued in Polish) 25 / 33
B. OTHER INFORMATION TO CONSOLIDATED QUARTERLY REPORT
1. Major factors having impact on EBITDA LIFO (profit on operations increased by depreciation and amortisation by LIFO method
of inventory valuation) Profit or loss for the 3 months of 2018 Profit from operations increased by depreciation and amortisation (so-called EBITDA) amounted to PLN 2,040 million and was lower by PLN (798) million (y/y).
ORLEN Group’s inventories are valued in the financial statements in accordance with International Financial Reporting Standards at weighted average cost method or purchase price method. Therefore, an upward trend in crude oil prices has a positive effect and the downtrend has a negative impact on the reported results
The estimated, positive impact of changes in crude oil prices on inventory valuation recognized in a reported result in the described period amounted to PLN 144 million and was lower by PLN (375) million (y/y).
As a result profit from operations increased by depreciation and amortisation before consideration of changes of crude oil prices on inventory valuation (so-called EBITDA LIFO) and impairment allowances of non-current assets for the 3 months of 2018 amounted to PLN 1,896 million and was lower by PLN (423) million (y/y).
Changes in macroeconomic factors lowered the ORLEN Group results in the described period by PLN (836) million (y/y) and included mainly the negative effect of margins on downstream products, lower Ural /Brent differentials as well as appreciation of the PLN exchange rate against the foreign currencies.
The total sales volume amounted to PLN 10,067 thousand tonnes and was higher by 4.0% (y/y). Sales of the downstream segment increased by 1.9% as a result of higher refinery volumes by 1.3% (y/y) and petrochemicals by 5.2% (y/y). High sales of downstream segment were achieved despite the cyclical shutdown of the Unipetrol Group in Kralupy commenced in mid-March 2018. The volume of retail sales was higher by 10.9% (y/y), while the sales of the upstream segment increased by 16.3% (y/y). As a result, the positive volume effect amounted to PLN 372 million (y/y).
The impact of the other factors amounted to PLN 41 million (y/y) and included mainly effect of higher (y/y) trade margins in the downstream and retail segment as well as changes in the balance on other operating activities in the amount of PLN (108) million (y/y). 2. The most significant events in the period from 1 January 2018 up to the date of preparation of the foregoing report
JANUARY 2018
Convening of the Extraordinary General Meeting of PKN ORLEN
On 4 January the Management Board of PKN ORLEN S.A., acting pursuant to Article 399 § 1, Article 402(1) of the Commercial Companies Code and § 7 item 4 point 1 of the Company’s Articles of Association in conjunction with the motion of the Minister of Energy informed about convenes for 2 February 2018 the Extraordinary General Meeting of PKN ORLEN. Changes in the composition of the Supervisory Board of PKN ORLEN
On 5 January 2018 the Minister of Energy acting on behalf of the shareholder the State Treasury, according to § 8 item 2 point 1 of the Company’s Articles of Association appointed Ms Małgorzata Niezgoda to the PKN ORLEN S.A. Supervisory Board. Approval by the Polish Financial Supervision Authority of an annex to the prospectus relating to bond issue programme
On 12 January 2018 the Polish Financial Supervision Authority approved the annex to the prospectus relating to the public bond issue programme directed to the individual investor (“Annex”). The Annex was prepared in relation to the start of the procedure of the announcement and execution of a voluntary tender offer to acquire shares of Unipetrol a.s. by PKN ORLEN S.A.
FEBRUARY 2018
Changes in PKN ORLEN Supervisory Board
On 1 February 2018 Mrs. Małgorzata Niezgoda resigned from the position of PKN ORLEN Supervisory Board Member
On 2 February 2018 PKN ORLEN Extraordinary General Meeting of Shareholders dismissed from the Supervisory Board Ms Agnieszka Krzętowska, Ms Angelina Sarota and Mr Adrian Dworzyński and appointed Ms Izabela Felczak-Poturnicka as the Chairman of the Supervisory Board, Ms Agnieszka Biernat-Wiatrak, Ms Jadwiga Lesisz and Ms Małgorzata Niezgoda as members of the Supervisory Board.
On 5 February 2018 the Minister of Energy acting on behalf of the shareholder the State Treasury, according to § 8 item 2 point 1 of the Company’s Articles of Association appointed Mr Józef Węgrecki to the PKN ORLEN S.A. Supervisory Board.
Changes in PKN ORLEN Management Board
On 5 February 2018 the Supervisory Board of PKN ORLEN S.A, has dismissed following persons from the Company’s Management Board: - Mr Wojciech Jasiński, - Mr Mirosław Kochalski, - Ms Maria Sosnowska.
At the same meeting the Supervisory Board, pursuant to § 9 item 1 point 3 of the Company’s Articles of Association, acting on the basis of the motion of the Minister of Energy as of 5 February 2018, appointed with the effect from 6 February 2018 Mr Daniel Obajtek to the

ORLEN GROUP (in PLN million)
CONSOLIDATED QUARTERLY REPORT FOR THE 1st QUARTER OF 2018 (Translation of a document originally issued in Polish) 26 / 33
position of the President of the PKN ORLEN S.A. Management Board. The Supervisory Board decided also to delegate with the effect from 5 February 2018 Mr Józef Węgrecki for temporary acting as the Member of the PKN ORLEN S.A. Management Board, Investments and Procurement.
Polish Financial Supervision Authority approved the annex no 2 to the prospectus relating to bond issue programme
On 15 February 2018 the Polish Financial Supervision Authority approved the annex no 2 to the prospectus relating to the public bond issue programme directed to the individual investor (“Annex”). The prospectus was initially approved by the Polish Financial Supervision Authority on 20 July 2017 and the annex no 1 to that prospectus on 12 January 2018. The Annex was prepared in connection with the changes in composition of the PKN ORLEN S.A. Management Board from 5 February 2018.
Signing a letter of intent concerning taking capital control over Grupa Lotos S.A. by PKN ORLEN S.A
On 27 February 2018 was signed a letter of intent between PKN ORLEN and the State Treasury concerning taking capital control over Grupa Lotos S.A. (“Lotos Group”) by PKN ORLEN, understood as a purchase by PKN ORLEN directly or indirectly minimum 53% stake in Lotos Group share capital (“Transaction”). By signing the letter of intent, PKN ORLEN and the State Treasury agreed to start, in a good faith, discussions with the intent to conclude the Transaction. The Transaction assumes the purchase of Lotos Group shares from its shareholders by PKN ORLEN, in particular from the State Treasury, in line with the requirements of the Act on Public Offering, Conditions Governing the Introduction of Financial Instruments to Organised Trading, and Public Companies of 29 July 2005 (unified text Journal of Laws of 2016, item 1639, as amended), governing the requirement of announcement of a tender offer to acquire or exchange shares. PKN ORLEN informed that the Transaction model, the schedule and detailed rules of its finalisation require detailed analysis. Finalisation of the Transaction will be possible, among others, after receiving appropriate corporate approvals and approvals of the competition protection authorities. According to the assumptions of both parties of the letter of intent, the Transaction is aimed at creating of a strong, integrated company capable of better competing internationally, more resistant to market fluctuations, among others through utilization of operating and costs synergies. PKN ORLEN indicated that the letter of intent is not a binding commitment to execution of the Transaction.
MARCH 2018
Polish Financial Supervision Authority approved the annex no 3 to the prospectus relating to bond issue programme
On 6 March 2018 the Polish Financial Supervision Authority approved the annex no 3 to the prospectus relating to the public bond issue programme directed to the individual investor (“Annex no 3”). The Annex no 3 was prepared in connection with signing, on 27 February 2018, a letter of intent between PKN ORLEN S.A. and the State Treasury concerning taking capital control over Grupa Lotos S.A. by PKN ORLEN S.A.
Changes in PKN ORLEN Supervisory Board
On 22 March 2018 Mr Józef Węgrecki submitted a statement of resignation from the position of PKN ORLEN S.A. Supervisory Board Member with the effect from 22 March 2018.
Changes in PKN ORLEN Management Board
On 22 March 2018 the Supervisory Board of PKN ORLEN has dismissed Mr Krystian Pater from the Company’s Management Board with the effect from 22 March 2018. At the same meeting the Supervisory Board decided to delegate with the effect from 23 March 2018 Ms Jadwiga Lesisz for temporary acting as the Member of the PKN ORLEN S.A. Management Board, Investments and Procurement. Moreover the Supervisory Board appointed following persons to the Company’s Management Board: - Mr Ryszard Lorek to the position of the Member of the PKN ORLEN S.A. Management Board, Trade, with the effect from 10 April 2018, - Mr Józef Węgrecki to the position of the Member of the PKN ORLEN S.A. Management Board, Operations, with the effect from 23
March 2018.
Mr Ryszard Lorek resigned from taking up of the position of PKN ORLEN Management Board Member
On 29 March 2018 the Company received a resignation of Mr Ryszard Lorek from taking up, with the effect from 10 April 2018, of the position of the Member of the PKN ORLEN S.A. Management Board responsible for Trade.
APRIL 2018
The issue of PKN ORLEN Series C bonds within the programme from 2017 On 24 April 2018 the Company’s Management Board decided to launch the issue of Series C of bearer bonds within the bond issue programme directed to the individual investors (“Programme”), included in the prospectus approved by the Polish Financial Supervision Authority on 20 July 2017. The bond issue programme assumes the issue of several bond series up to the total amount of PLN 1 billion during 12 months from the date of approval of the prospectus. The subsequent series of bonds will be offered in a public offering. PKN ORLEN plans to introduce the bonds to trading on the Catalyst regulated market operated by the Warsaw Stock Exchange. Series A and B bonds issued within the Programme are listed on the Catalyst market.
Series C bond issue terms and conditions: 1. Subscription period: from 7 May 2018 to 21 May 2018 (the period may be shortened when the oversubscription occurs) 2. Date of bonds allocation: 22 May 2018 3. Expected bonds issue date: 5 June 2018 4. Redemption date: 5 June 2022 5. Number of Series C bonds issued: up to 2,000,000 6. The total nominal value of Series C bonds: up to PLN 200,000,000 7. Interest rate: variable 8. Margin: 1.2 % 9. Base rate: 6M WIBOR 10. Nominal value of one bond: PLN 100 11. Issue price: dependent on the day of subscription; in the range from PLN 100.00 to PLN 100.11 12. Rating to the bond issue programme: A (pol) 13. Bond’s allocation mechanism: the detailed terms of allocation are available in the final terms of the offer.
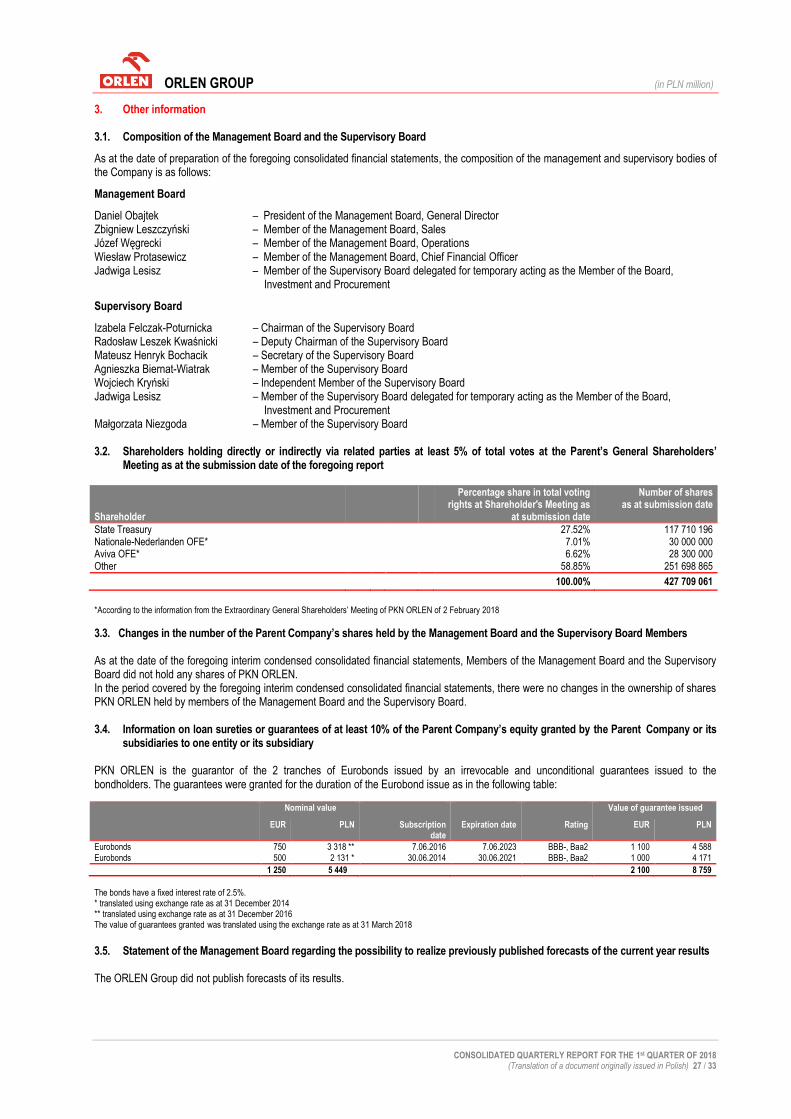
ORLEN GROUP (in PLN million)
CONSOLIDATED QUARTERLY REPORT FOR THE 1st QUARTER OF 2018 (Translation of a document originally issued in Polish) 27 / 33
3. Other information 3.1. Composition of the Management Board and the Supervisory Board
As at the date of preparation of the foregoing consolidated financial statements, the composition of the management and supervisory bodies of the Company is as follows:
Management Board
Daniel Obajtek – President of the Management Board, General Director Zbigniew Leszczyński – Member of the Management Board, Sales Józef Węgrecki – Member of the Management Board, Operations Wiesław Protasewicz – Member of the Management Board, Chief Financial Officer Jadwiga Lesisz – Member of the Supervisory Board delegated for temporary acting as the Member of the Board,
Investment and Procurement
Supervisory Board
Izabela Felczak-Poturnicka – Chairman of the Supervisory Board Radosław Leszek Kwaśnicki – Deputy Chairman of the Supervisory Board Mateusz Henryk Bochacik – Secretary of the Supervisory Board Agnieszka Biernat-Wiatrak – Member of the Supervisory Board Wojciech Kryński – Independent Member of the Supervisory Board Jadwiga Lesisz – Member of the Supervisory Board delegated for temporary acting as the Member of the Board,
Investment and Procurement Małgorzata Niezgoda – Member of the Supervisory Board 3.2. Shareholders holding directly or indirectly via related parties at least 5% of total votes at the Parent’s General Shareholders’
Meeting as at the submission date of the foregoing report
Shareholder
Percentage share in total voting rights at Shareholder's Meeting as
at submission date
Number of shares as at submission date
State Treasury 27.52% 117 710 196 Nationale-Nederlanden OFE* 7.01% 30 000 000 Aviva OFE* 6.62% 28 300 000 Other 58.85% 251 698 865
100.00% 427 709 061
*According to the information from the Extraordinary General Shareholders’ Meeting of PKN ORLEN of 2 February 2018
3.3. Changes in the number of the Parent Company’s shares held by the Management Board and the Supervisory Board Members As at the date of the foregoing interim condensed consolidated financial statements, Members of the Management Board and the Supervisory Board did not hold any shares of PKN ORLEN. In the period covered by the foregoing interim condensed consolidated financial statements, there were no changes in the ownership of shares PKN ORLEN held by members of the Management Board and the Supervisory Board. 3.4. Information on loan sureties or guarantees of at least 10% of the Parent Company’s equity granted by the Parent Company or its
subsidiaries to one entity or its subsidiary PKN ORLEN is the guarantor of the 2 tranches of Eurobonds issued by an irrevocable and unconditional guarantees issued to the bondholders. The guarantees were granted for the duration of the Eurobond issue as in the following table: Nominal value Value of guarantee issued
EUR PLN Subscription date
Expiration date Rating EUR PLN
Eurobonds 750 3 318 ** 7.06.2016 7.06.2023 BBB-, Baa2 1 100 4 588
Eurobonds 500 2 131 * 30.06.2014 30.06.2021 BBB-, Baa2 1 000 4 171
1 250 5 449 2 100 8 759
The bonds have a fixed interest rate of 2.5%. * translated using exchange rate as at 31 December 2014 ** translated using exchange rate as at 31 December 2016 The value of guarantees granted was translated using the exchange rate as at 31 March 2018
3.5. Statement of the Management Board regarding the possibility to realize previously published forecasts of the current year results The ORLEN Group did not publish forecasts of its results.

QUARTERLY FINANCIAL INFORMATION PKN ORLEN
FOR THE 1st QUARTER 2018
PREPARED IN ACCORDANCE WITH INTERNATIONAL FINANCIAL REPORTING STANDARDS AS ADOPTED BY THE EUROPEAN UNION
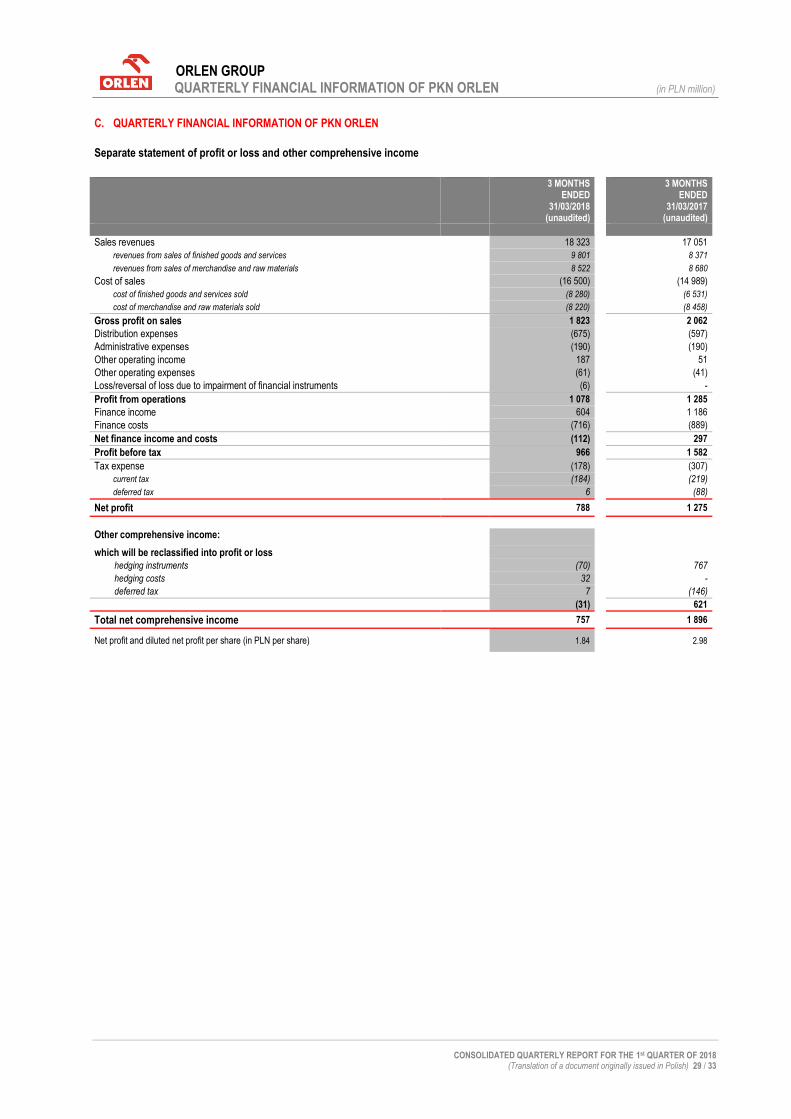
ORLEN GROUP QUARTERLY FINANCIAL INFORMATION OF PKN ORLEN (in PLN million)
CONSOLIDATED QUARTERLY REPORT FOR THE 1st QUARTER OF 2018 (Translation of a document originally issued in Polish) 29 / 33
C. QUARTERLY FINANCIAL INFORMATION OF PKN ORLEN
Separate statement of profit or loss and other comprehensive income
3 MONTHS
ENDED 31/03/2018
(unaudited)
3 MONTHS ENDED
31/03/2017 (unaudited)
Sales revenues 18 323
17 051
revenues from sales of finished goods and services
9 801
8 371
revenues from sales of merchandise and raw materials
8 522
8 680
Cost of sales (16 500)
(14 989)
cost of finished goods and services sold
(8 280)
(6 531)
cost of merchandise and raw materials sold
(8 220)
(8 458)
Gross profit on sales 1 823
2 062
Distribution expenses
(675)
(597)
Administrative expenses
(190)
(190)
Other operating income 187
51
Other operating expenses (61)
(41)
Loss/reversal of loss due to impairment of financial instruments
(6)
-
Profit from operations 1 078
1 285
Finance income 604
1 186
Finance costs (716)
(889)
Net finance income and costs (112)
297
Profit before tax 966
1 582
Tax expense
(178)
(307)
current tax
(184)
(219)
deferred tax
6
(88)
Net profit 788
1 275
Other comprehensive income:
which will be reclassified into profit or loss
hedging instruments
(70)
767
hedging costs
32
-
deferred tax
7
(146)
(31)
621
Total net comprehensive income 757
1 896
Net profit and diluted net profit per share (in PLN per share) 1.84
2.98

ORLEN GROUP QUARTERLY FINANCIAL INFORMATION OF PKN ORLEN (in PLN million)
CONSOLIDATED QUARTERLY REPORT FOR THE 1st QUARTER OF 2018 (Translation of a document originally issued in Polish) 30 / 33
Separate statement of financial position
31/03/2018 31/12/2017
ASSETS
Non-current assets
Property, plant and equipment
15 607
15 690
Intangible assets
896
772
Shares in related parties
13 096
9 564
Derivatives
159
189
Other assets 193
192
29 951 26 407
Current assets
Inventories
8 711
8 239
Trade and other receivables
7 139
7 335
Current tax assets
56
58
Cash
3 488
5 477
Non-current assets classified as held for sale
157
170
Derivatives
419
396
Other assets
915
1 270
20 885 22 945
Total assets 50 836
49 352
EQUITY AND LIABILITIES
EQUITY
Share capital
1 058
1 058
Share premium
1 227
1 227
Hedging reserve
222
253
Retained earnings
25 791
25 027
Total equity 28 298 27 565
LIABILITIES
Non-current liabilities
Loans, borrowings and bonds 7 913
6 736
Provisions
440
440
Deferred tax liabilities
766
782
Derivatives 53
75
Other liabilities
228
220
9 400 8 253
Current liabilities
Trade and other liabilities 8 974
9 897
Liabilities from contracts with customers 164
-
Loans, borrowings and bonds 1 473
552
Provisions 378
321
Current tax liabilities 93
66
Derivatives
313
278
Other liabilities, incl.:
1 743
2 420
intercompany cash pool
1 586
2 063 VITAY loyalty program, prepaid cards - 164
13 138 13 534
Total liabilities 22 538 21 787
Total equity and liabilities 50 836
49 352
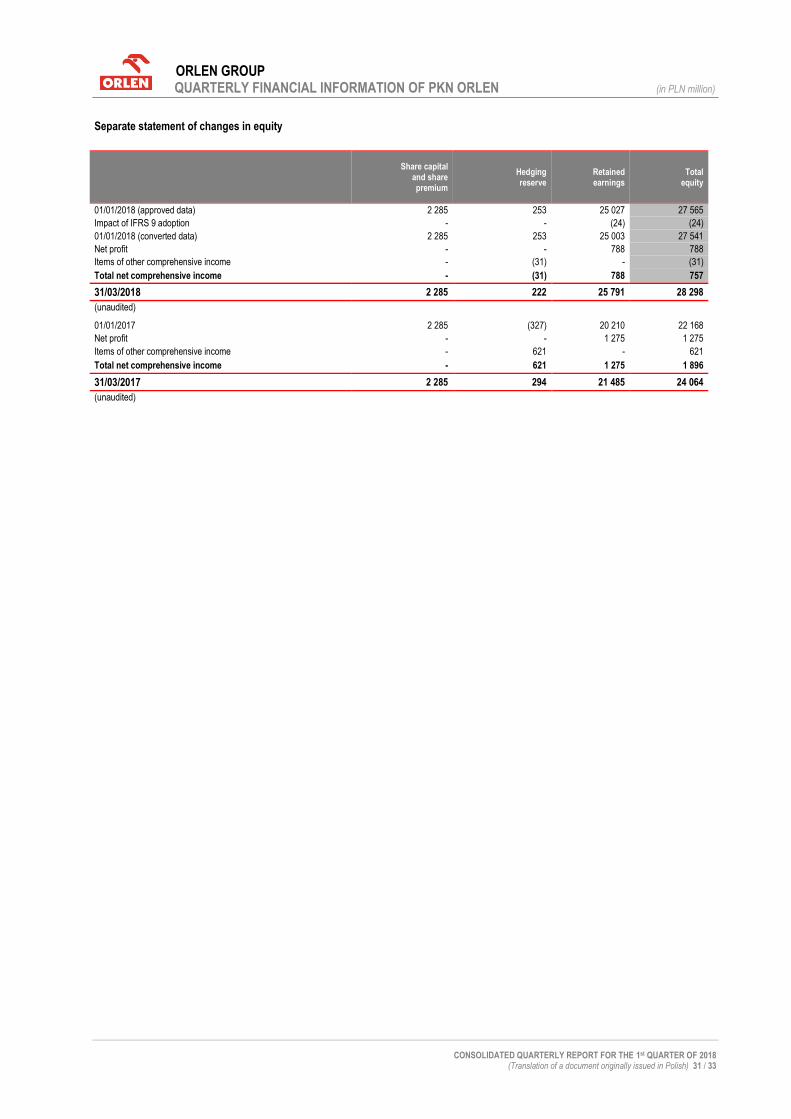
ORLEN GROUP QUARTERLY FINANCIAL INFORMATION OF PKN ORLEN (in PLN million)
CONSOLIDATED QUARTERLY REPORT FOR THE 1st QUARTER OF 2018 (Translation of a document originally issued in Polish) 31 / 33
Separate statement of changes in equity
Share capital and share premium
Hedging reserve
Retained earnings
Total equity
01/01/2018 (approved data) 2 285 253 25 027 27 565
Impact of IFRS 9 adoption - - (24) (24)
01/01/2018 (converted data) 2 285 253 25 003 27 541
Net profit - - 788 788
Items of other comprehensive income - (31) - (31)
Total net comprehensive income - (31) 788 757
31/03/2018 2 285 222 25 791 28 298
(unaudited)
01/01/2017 2 285 (327) 20 210 22 168
Net profit - - 1 275 1 275
Items of other comprehensive income - 621 - 621
Total net comprehensive income - 621 1 275 1 896
31/03/2017 2 285 294 21 485 24 064
(unaudited)
ORLEN GROUP QUARTERLY FINANCIAL INFORMATION OF PKN ORLEN (in PLN million)
CONSOLIDATED QUARTERLY REPORT FOR THE 1st QUARTER OF 2018 (Translation of a document originally issued in Polish) 32 / 33
Separate statement of cash flows
3 MONTHS
ENDED 31/03/2018
(unaudited)
3 MONTHS ENDED
31/03/2017 (unaudited)
Cash flows from operating activities
Profit before tax 966
1 582
Adjustments for:
Depreciation and amortisation
317
297
Foreign exchange (gain)/loss
77
(109)
Interest, net
43
45
Dividends
(3)
(589)
Loss on investing activities, incl.:
93
634
recognition of impairment allowances of shares Orlen Lietuva -
517
Change in provisions
57
37
Change in working capital (957)
(1 277)
inventories
(471)
(726)
receivables
195
820
liabilities
(681)
(1 371)
Other adjustments, incl.:
(74)
(83)
rights received free of charge (84)
(43)
Income tax (paid)
(156)
(642)
Net cash from/(used in) operating activities 363
(105)
Cash flows from investing activities
Acquisition of property, plant and equipment, intangible assets and perpetual usufruct of land (462)
(506)
Acquisition of shares
(3 531)
-
Disposal of property, plant and equipment, intangible assets and perpetual usufruct of land 52
54
Interest received
7
5
Dividends received
3
591
Proceeds from non-current loans granted -
1
Proceeds/(Expenses) from current loans granted 1
(403)
Proceeds/(Outflows) from cash pool facility 185
(14)
Other
(116)
(51)
Net cash (used) in investing activities (3 861)
(323)
Cash flows from financing activities
Proceeds from loans received
2 075
-
Bonds issued
115
303
Repayments of loans
-
(783)
Redemption of bonds
(197)
(255)
Interest paid
(32)
(36)
Outflows from cash pool facility (463)
(48)
Other
(7)
(5)
Net cash from/(used in) financing activities 1 491
(824)
Net (decrease) in cash (2 007)
(1 252)
Effect of exchange rate changes 18
(27)
Cash, beginning of the period 5 477
2 563
Cash, end of the period 3 488
1 284
