· orion real estate ltd annual report 2015 orion real estate limited orion real estate limited...
TRANSCRIPT

1
OR
ION
RE
AL E
STATE LTD
A
NN
UA
L RE
PO
RT 2
015
Annual Report 2015
ANNUAL REPORT AND FINANCIAL STATEMENTS FOR THE YEAR ENDED 30 JUNE 2015
www.oriongroup.co.za

2
OR
ION
RE
AL
EST
ATE
LTD
A
NN
UA
L R
EP
OR
T 2
015
The risks and rewards faced by Orion Real Estate Limited relate primarily to the operating segments being retail, commercial, industrial, residential and hospitality. Lettable space is also classified in these segments according to the nature of the tenants.
Orion Real Estate Limited, it’s subsidiary companies and controlled trust Incorporated in the Republic of South Africa Registration number 1997/021085/06
Our business is getting better every day in every way
Our Vision An Orion experience in 50 countries
Our MissionCreating stakeholder value and building strength through diversity
Our Values• Honesty• Integrity• Treating people with dignity• Reward & recognition• Generosity• Innovation and productivity

1
OR
ION
RE
AL E
STATE LTD
A
NN
UA
L RE
PO
RT 2
015
1
OR
ION
RE
AL E
STATE LTD
A
NN
UA
L RE
PO
RT 2
015

2
OR
ION
RE
AL
EST
ATE
LTD
A
NN
UA
L R
EP
OR
T 2
015
OR
ION
RE
AL
EST
ATE
LTD
A
NN
UA
L R
EP
OR
T 2
015
ORION REAL ESTATE LIMITED Orion Real Estate Limited was originally formed in 1991 with the purchase of Intec House in downtown Johannesburg’s financial district. The Company has grown steadily since and evolved into a Group with property holdings and investments in excess of R770 million. Orion Real Estate Limited currently also manages private property portfolios for related parties.
With the acquisition of Alpina Investments Limited, the Company gained a listing on the Johannesburg Stock Exchange (JSE) in March 2006. The listed portfolio (Orion Real Estate Limited) consists of 27 properties with a market value in excess of R770 million.
The long-term goal is to own properties in 50 countries and to have an annual compound growth rate of not less than 28% at a gearing level of 50%.
KEY PERFORMANCE INDICATORS
20152014
(Restated) % change
Revenue R 99 547 277 R 96 708 821 2,9
Profit for the year R 109 814 308 R39 922 671 175,1
Basic earnings per share (2014: linked unit) (cents) 17,52 6,37 175,0
Diluted earnings per share (2014: linked unit) (cents) 17,52 6,37 175,0
Headline earnings per share (2014: linked unit) (cents) -0,57 1,44 -140,0
Diluted headline earnings per share (2014 linked unit) (cents) -0,57 1,44 -140,0
Net asset value per share (2014: linked unit) at year-end (cents) 98,68 81,16 21,6
Average in-force escalation (%) 8,2 8,5 -3,5
Lease expiry profile for existing leases at 30 June 2015:
Expire % of gross rental
By June 2016 35
By June 2017 22
By June 2018 15
By June 2019 19
By June 2020 5
After June 2020 4
Orion Real Estate Limited has been acknowledged as one of the Best Employers, South Africa for the fourth time in a row.
3
OR
ION
RE
AL E
STATE LTD
A
NN
UA
L RE
PO
RT 2
015
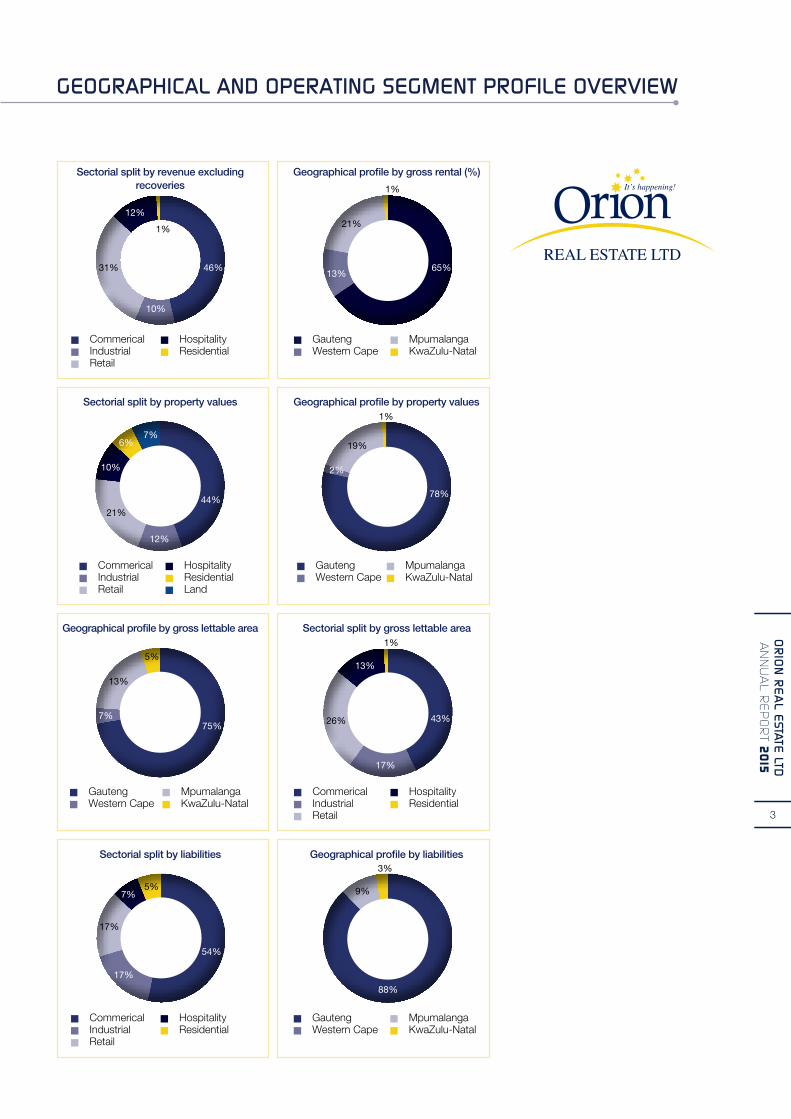
Sectorial split by revenue excluding recoveries
Geographical profile by gross rental (%)
n Commericaln Industrialn Retail
n Hospitalityn Residential
46%
12%
10%
31%
1%
n Gautengn Western Cape
n Mpumalangan KwaZulu-Natal
65%
21%
13%
1%
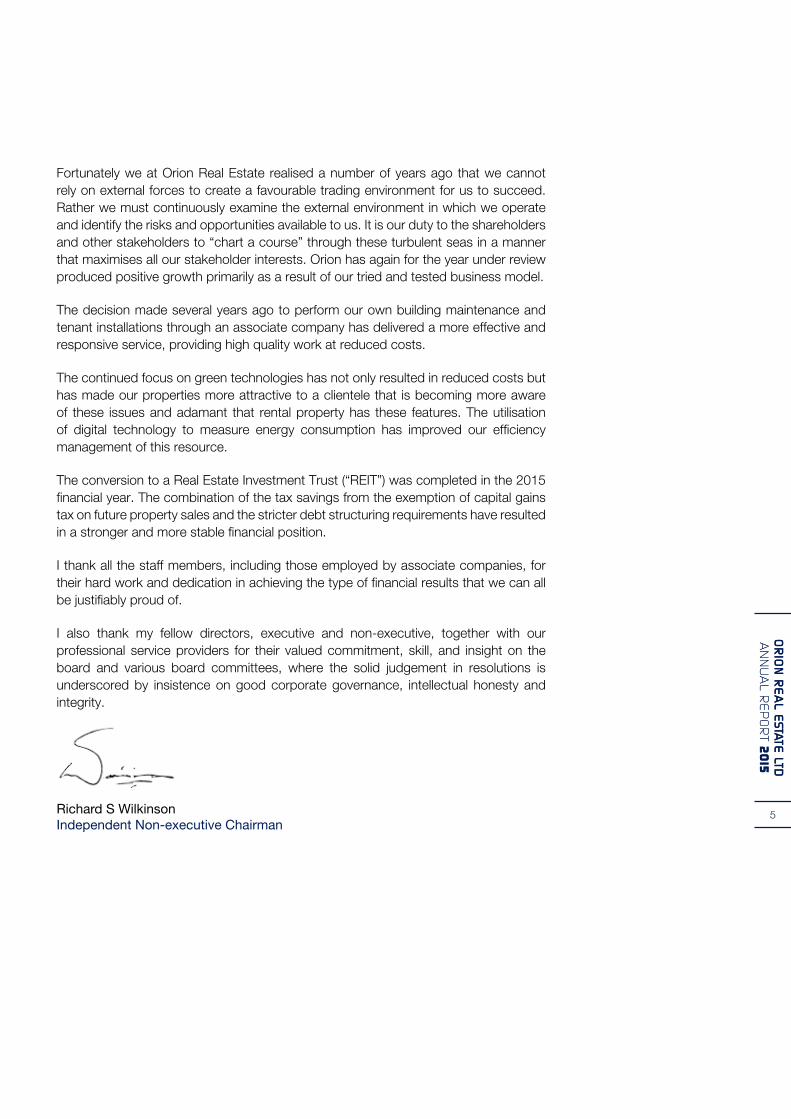
Geographical profile by gross lettable area
n Gautengn Western Cape
n Mpumalangan KwaZulu-Natal
75%
13%
7%
5%
Geographical profile by property values
n Gautengn Western Cape
n Mpumalangan KwaZulu-Natal
78%
2%
19%
1%
Sectorial split by gross lettable area
n Commericaln Industrialn Retail
n Hospitalityn Residential
43%26%
17%
1%
13%
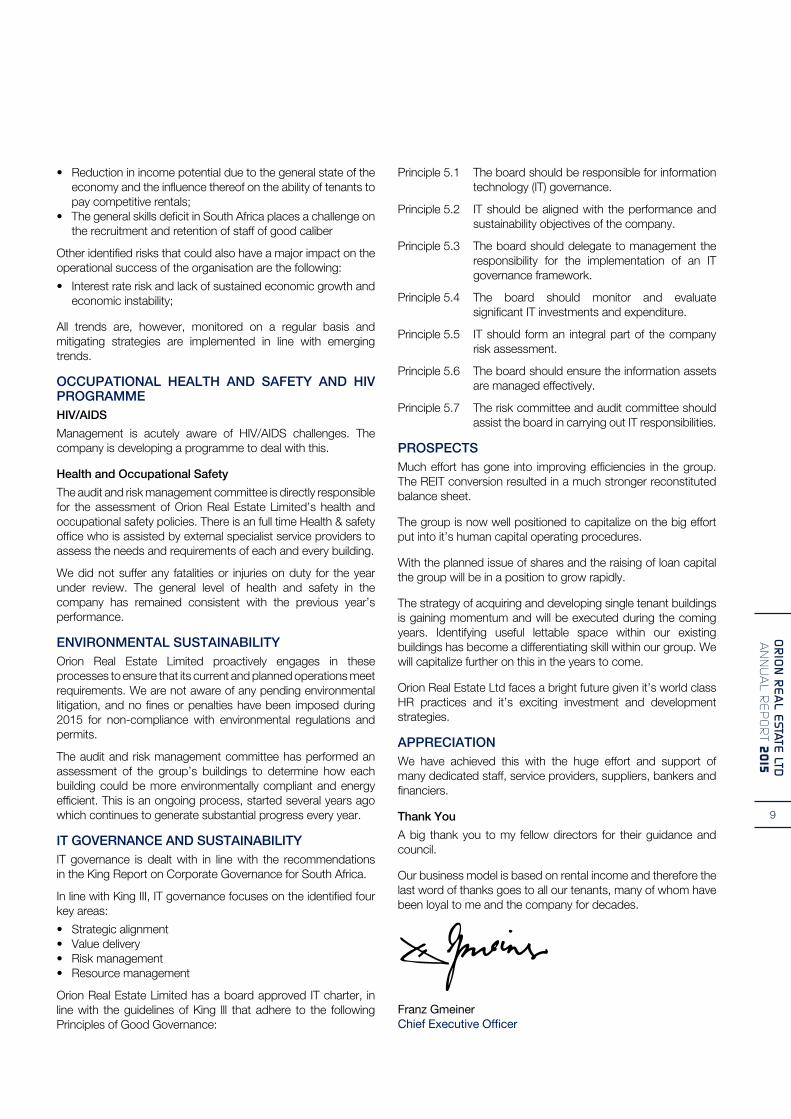
Sectorial split by liabilities Geographical profile by liabilities
n Commericaln Industrialn Retail
n Hospitalityn Residential
n Gautengn Western Cape
n Mpumalangan KwaZulu-Natal
88%
9%
3%
54%
17%
7%
17%
5%
Sectorial split by property values
n Commericaln Industrialn Retail
n Hospitalityn Residentialn Land
44%21%
6%7%
12%
10%

4
OR
ION
RE
AL
EST
ATE
LTD
A
NN
UA
L R
EP
OR
T 2
015
South African economic growth over the last year has continued the trend of recent years by “limping along” at a rate well below that required to address South Africa’s economic challenges. Given the current highly publicised economic downturns affecting the mining and steel industries combined with Eskom’s inability to provide a reliable electricity supply, it is unlikely that the situation will improve greatly in the next few years. Particularly as the slowing Chinese economy combined with a sluggish European economic performance means that we cannot rely on increased external demand for our mineral resources and goods.
Richard Wilkinson
4
OR
ION
RE
AL
EST
ATE
LTD
A
NN
UA
L R
EP
OR
T 2
015
5
OR
ION
RE
AL E
STATE LTD
A
NN
UA
L RE
PO
RT 2
015O
RIO
N R
EA
L ESTATE
LTD
AN
NU
AL R
EP
OR
T 2015
Fortunately we at Orion Real Estate realised a number of years ago that we cannot rely on external forces to create a favourable trading environment for us to succeed. Rather we must continuously examine the external environment in which we operate and identify the risks and opportunities available to us. It is our duty to the shareholders and other stakeholders to “chart a course” through these turbulent seas in a manner that maximises all our stakeholder interests. Orion has again for the year under review produced positive growth primarily as a result of our tried and tested business model.
The decision made several years ago to perform our own building maintenance and tenant installations through an associate company has delivered a more effective and responsive service, providing high quality work at reduced costs.
The continued focus on green technologies has not only resulted in reduced costs but has made our properties more attractive to a clientele that is becoming more aware of these issues and adamant that rental property has these features. The utilisation of digital technology to measure energy consumption has improved our efficiency management of this resource.
The conversion to a Real Estate Investment Trust (“REIT”) was completed in the 2015 financial year. The combination of the tax savings from the exemption of capital gains tax on future property sales and the stricter debt structuring requirements have resulted in a stronger and more stable financial position.
I thank all the staff members, including those employed by associate companies, for their hard work and dedication in achieving the type of financial results that we can all be justifiably proud of.
I also thank my fellow directors, executive and non-executive, together with our professional service providers for their valued commitment, skill, and insight on the board and various board committees, where the solid judgement in resolutions is underscored by insistence on good corporate governance, intellectual honesty and integrity.
Richard S Wilkinson Independent Non-executive Chairman

6
OR
ION
RE
AL
EST
ATE
LTD
A
NN
UA
L R
EP
OR
T 2
015
THE COMPANY
Since the reverse listing into Alpina Investments Ltd on the main board of the JHB Stock Exchange in 2006 Orion Real Estate Ltd has produced steady growth. The company converted to a Real Estate Investment Trust (REIT) in April 2015. This resulted in a significantly stronger balance sheet. The net equity of R618 million has grown from R63 million in 2006. This represents an almost 10 fold increase over a nine year period. The net asset value per share of 98 cents positions the group for healthy growth and an upward rerating of the share price.
Franz Gmeiner
6
OR
ION
RE
AL
EST
ATE
LTD
A
NN
UA
L R
EP
OR
T 2
015

7
OR
ION
RE
AL E
STATE LTD
A
NN
UA
L RE
PO
RT 2
015O
RIO
N R
EA
L ESTATE
LTD
AN
NU
AL R
EP
OR
T 2015
It is also a stated strategy to dilute the Gmeiner Family’s stake from around 94% down to 50%. This will increase the capital base by around R550 million. In addition to this the company is pursuing alternative financing models including corporate bonds. The group has strong and cordial relationships with its current financiers and would like to continue those relationships. The additional capital and funding will be utilised to pay down existing debt and to increase the property portfolio by acquisition and development.
THE COMPANY CULTURE AND VALUESThe company’s purpose of “maximising capital providers’ value through innovative investment strategies” is not only aimed at shareholders but includes the providers of capital and all other stakeholders.
The brand promise “It’s Happening” both describes the intentions of the company to grow and highlights the immediate and sustained effort being expended every day to make this a reality. This message is further emphasised by our operating philosophy “Our business is getting better every day in every way” which emphasises continued measurable improvement as the result of the unrelenting hard work contributed by every member of our dynamic team.
The company’s purpose, culture and brand promise are further entrenched throughout the company through team coaching at all staff levels within the company.
The Orion values system is based on the following values:
• Honesty – Act in a way that leads to trust in each other. Always tell the truth. Never take anything that does not belong to them.
• Integrity – Be truthful no matter what the situation or circumstance. Take responsibility for your actions.
• Treating People with Dignity – Do not reprimand each other in public. Respect diverse opinions & cultures. Meet agreed commitments & deadlines.
• Reward & Recognition – Show appreciation by “catching people doing things right”. Provide opportunity for career development.
• Generosity – Share knowledge. Show empathy and understanding. Go the extra mile
• Innovation and productivity – Look for a “better way” each day. Cultivate an “I can” attitude. Deliver high quality work.
These values are further entrenched in the organisation through monthly discussion documents and the team coaching process.
OUR EMPLOYEESThe group currently employs 74 staff directly as full time employees of which 47% are female. 77% of the total employees are from previously disadvantaged communities.
The amount invested in training and coaching R496 900 (2014: R478,001).
The gross property revenue per employee is R 1 367 183 (2014: R3,719,570).
The net profit per employee is R 1 484 204 (2014: R1 535 487)
The group has also been successful for the fourth consecutive year to be officially recognised as “Top Employer certified by the Top Employers Institute, Amsterdam, The Netherlands. This consistent achievement of such a distinguished international award has confirmed that our Human Resource practices remain in-line with the best in the world. This achievement not only positions Orion as a preferred employer enabling us to attract and retain top quality staff.
GOVERNANCE STRUCTUREOrion Real Estate Limited has a unitary board, which fulfills oversight and control functions. The responsibilities of the board are set out in the board charter. The board consists of four non-executive directors including the chairman of the board and two executive directors. Two non-executive directors are independent as defined in King III. The roles of the chairman of the board, and the chief executive officer are separate, ensuring a clear division of duties and responsibilities. The various directors bring a wealth of knowledge, experience and skills to the board. The board has established a number of committees to enable it to perform its duties. These are the audit and risk management committee, the social and ethics committee and the remuneration committee.
ASSURANCEThe company has continued to follow the combined assurance model whereby assurance for different aspects of the report will be provided by different assurance providers. The audit committee has agreed to limit external assurance to financial information. Internal assurance will be the responsibility of internal audit, the audit committee and management.
THE STRATEGY AND HIGHLIGHTS OF 2015 Based on balanced score card principles the company has 11 key strategic objectives in the financial, internal business process, customer and learning, and growth perspectives within which Orion Real Estate Limited functions. The key elements of the strategic plan are indicated below:
Financial Perspective – Expectations in terms of growth and profitability
Goal 1 – Growth and diversification• Acquisitionofproperties• Developmentofnewproperties• Redevelopmentofexistingproperties• Developnewrevenuestreams
Goal 2 – Expand Geographical footprint• DevelopsingletenantpropertiesinAfrica
Goal 3 – Make your own way• Increasenetincomestreams• Capitalraisingviashareissues• Alternatefunding
Goal 4 – Environmentally responsible• Improveenergyefficiencyatallproperties
Internal Business Process Perspective
Goal 5 – Positive agent for change and Good Corporate Governance

8
OR
ION
RE
AL
EST
ATE
LTD
A
NN
UA
L R
EP
OR
T 2
015
Goal 6 – Continuous process and systems improvement• Nicor–PastelIntegration
Goal 7 – Optimising the use of technology• Webbasedapplications&technologies.
Goal 8 – Building the Orion brands
Goal 9 – Attract, serve and retain customers
• Tenantsatisfactionindexofatleast85%.
Learning and Growth Perspective
Goal 10 – Employer of choice
• Traininganddevelopmentofstaff• Life skills andbusiness coaching of all supervisory &
management staff
Goal 11 – Attract, develop and retain skilled staff
• Intensivecoachingofkeyindividuals• Paymentofmarketrelatedsalaries&benefits
The implementation of the plan is monitored on a regular basis through financial and management information, monthly feedback meetings and reporting to the board of directors. Substantial progress in a number of the identified areas has been made and further strategic plan can be summarised as follows:
Goal 1 – Growth and diversification
• Developandredevelopexistingbuildings
The house on the Standard Bank Bramley property which was completely run down and unfit for human habitation has been completely rebuilt as state of the art offices.
Large developments have commenced at Orion House and Promenade Shopping Centre where key “blue-chip” tenants have entered into major lease agreements which require total refurbishment of the respective buildings.
The second floor of the Northcliff Atrium is being converted into small self contained offices in response to a demand for such space in the area.
Goal 6 – Continuous process and systems improvement
• Constant improvement on tenant communication andrelations
• NewOrionRealEstatewebsite
The web site implementation phase was completed last year and we have now entered a phase of continuous review and upgrade of the content.
Goal 7 – Optimising the use of technology
• LinkPastelandNicorsystemtogenerateopenitemdebtorsaccounts in Pastel and streamline reporting
• ImplementacomputerizedCustomerRelationsManagement(“CRM”) system.
Goal 10 – Employer of choice
• Traininganddevelopmentofstaff• Business&lifeskillscoachingofallsupervisorystaff
Fourth consecutive year of attaining “Top Employer” status. Only 74 companies in South Africa have achieved this.
KEY FINANCIAL HIGHLIGHTSIt is a privilege to report to shareholders that Orion Real Estate has shown growth and positive results in a number of areas.
The gross property revenue before straight line adjustments grew from R94,8 million in 2014 to 101,2 million in 2015 a growth of 6.7%, this growth was achieved despite the sale of some properties. Other direct property operating costs, administrative and management expenses and repairs and maintenance, were well managed and increased only from R76,3 million in 2014 to R80,8 million in 2015 an increase of 5.8%. This despite the substantial costs incurred in fees relating to the REIT conversion. This is a clear indication that costs were well contained and further improvements are anticipated in the current financial year.
The total comprehensive income for the year attributable to equity holders of the group has increased from R39.9 million to R109,8 million. This is primarily attributable to the adjustment to the deferred taxation balance raised in previous years for capital gains tax on the revalued investment properties.
Headline earnings fell from 1.44 cents in 2014 to a loss of 0.57 cents in 2015. Basic earnings per share have increased from 6.37 cents in 2014 to 17.52 cents in 2015. The NAV has improved from 81.16 cents to 98.68 cents which represents a 21.6% growth in NAV
The group’s continued focus on the insourcing and efficient management of the property portfolio has resulted in a significant drop in repairs and maintenance costs during the year.
The value of the property portfolio has fallen from R783,2 million in 2014 to R772,0 million, primarily as a result of the sale of the Mountain View Shopping Centre, Malboro 142 and Score – Mfuleni properties for a total disposal price of R34,2 million. The disposal of these three properties generated a combined profit of R11.3 million.
RISKS FACING THE GROUPEffective risk management is integral to the company’s objective of consistently adding value to the business. Management is continuously developing and enhancing its risk and control procedures to improve the mechanisms for identifying and monitoring risks. This means the company will:
• Utiliseaneffectiveandintegratedriskmanagementprocesswhile maintaining business flexibility;
• Identifyandassessmaterialrisktoenablecontinuedgrowthof the business; and
• Monitor,manageandmitigaterisks.
Orion Real Estate Limited maintains financial and operational systems of internal control. The systems include a documented organisational structure and division of responsibility, established policies and procedures, including a code of ethics to foster a strong ethical climate, which is communicated throughout the group through staff training and team coaching.
Based on its assessment, the group believes that, as at 30 June 2015, its system of internal control over financial reporting and safeguarding of assets against unauthorised acquisitions, use or disposition met the required criteria. Despite the substantial progress made in risk management over the past few years, the board considered that there was still room for improvement in the following:
9
OR
ION
RE
AL E
STATE LTD
A
NN
UA
L RE
PO
RT 2
015
• Reductioninincomepotentialduetothegeneralstateoftheeconomy and the influence thereof on the ability of tenants to pay competitive rentals;
• ThegeneralskillsdeficitinSouthAfricaplacesachallengeonthe recruitment and retention of staff of good caliber
Other identified risks that could also have a major impact on the operational success of the organisation are the following:
• Interestrateriskandlackofsustainedeconomicgrowthandeconomic instability;
All trends are, however, monitored on a regular basis and mitigating strategies are implemented in line with emerging trends.
OCCUPATIONAL HEALTH AND SAFETY AND HIV PROGRAMMEHIV/AIDS
Management is acutely aware of HIV/AIDS challenges. The company is developing a programme to deal with this.
Health and Occupational Safety
The audit and risk management committee is directly responsible for the assessment of Orion Real Estate Limited’s health and occupational safety policies. There is an full time Health & safety office who is assisted by external specialist service providers to assess the needs and requirements of each and every building.
We did not suffer any fatalities or injuries on duty for the year under review. The general level of health and safety in the company has remained consistent with the previous year’s performance.
ENVIRONMENTAL SUSTAINABILITYOrion Real Estate Limited proactively engages in these processes to ensure that its current and planned operations meet requirements. We are not aware of any pending environmental litigation, and no fines or penalties have been imposed during 2015 for non-compliance with environmental regulations and permits.
The audit and risk management committee has performed an assessment of the group’s buildings to determine how each building could be more environmentally compliant and energy efficient. This is an ongoing process, started several years ago which continues to generate substantial progress every year.
IT GOVERNANCE AND SUSTAINABILITYIT governance is dealt with in line with the recommendations in the King Report on Corporate Governance for South Africa.
In line with King III, IT governance focuses on the identified four key areas:
• Strategicalignment• Valuedelivery• Riskmanagement• Resourcemanagement
Orion Real Estate Limited has a board approved IT charter, in line with the guidelines of King lll that adhere to the following Principles of Good Governance:
Principle 5.1 The board should be responsible for information technology (IT) governance.
Principle 5.2 IT should be aligned with the performance and sustainability objectives of the company.
Principle 5.3 The board should delegate to management the responsibility for the implementation of an IT governance framework.
Principle 5.4 The board should monitor and evaluate significant IT investments and expenditure.
Principle 5.5 IT should form an integral part of the company risk assessment.
Principle 5.6 The board should ensure the information assets are managed effectively.
Principle 5.7 The risk committee and audit committee should assist the board in carrying out IT responsibilities.
PROSPECTSMuch effort has gone into improving efficiencies in the group. The REIT conversion resulted in a much stronger reconstituted balance sheet.
The group is now well positioned to capitalize on the big effort put into it’s human capital operating procedures.
With the planned issue of shares and the raising of loan capital the group will be in a position to grow rapidly.
The strategy of acquiring and developing single tenant buildings is gaining momentum and will be executed during the coming years. Identifying useful lettable space within our existing buildings has become a differentiating skill within our group. We will capitalize further on this in the years to come.
Orion Real Estate Ltd faces a bright future given it’s world class HR practices and it’s exciting investment and development strategies.
APPRECIATIONWe have achieved this with the huge effort and support of many dedicated staff, service providers, suppliers, bankers and financiers.
Thank You
A big thank you to my fellow directors for their guidance and council.
Our business model is based on rental income and therefore the last word of thanks goes to all our tenants, many of whom have been loyal to me and the company for decades.
Franz GmeinerChief Executive Officer

10
OR
ION
RE
AL
EST
ATE
LTD
A
NN
UA
L R
EP
OR
T 2
015
OR
ION
RE
AL
EST
ATE
LTD
A
NN
UA
L R
EP
OR
T 2
015
Non-executive DirectorDr Antoinette Gmeiner Age: 52DCur; Master Exec Coach
Group CEO and MD Franz Gmeiner Age: 56BCom (Hons) CA(SA)
Independent Non-executive ChairmanRichard Wilkinson Age: 75
FRANZ GMEINERMr Franz Gmeiner attained his BCom Accounting (Hons) and qualified as one of the top ten students in the Chartered Accountants examination in 1983. During his accountancy career he became a partner in Cohen and Gmeiner Accountants, which he led to become one of the largest auditing firms in South Africa. He founded a property company in 1991, which has grown into the current Orion Real Estate Limited, listed on the JSE Limited. During 1999 he took over the hotel operations of the Hotel Devonshire and since then the Orion Hotels division has built up a portfolio of 13 hotels. He is a member of several clubs and organisations and holds numerous Directorships and trusteeships.
DR ANTOINETTE GMEINERDr Antoinette Gmeiner is the chief executive officer of Orion Business Solutions, and also a director of OBS Coach House. She completed her doctorate in Nursing Science in 1993 atRandAfrikaansUniversity.Sheisa Master Executive Coach and has extensive coaching experience on executive committee and Board level. She has been coaching for more than fourteen years and has established an internal Coaching Programme for the Orion Group, where twenty one teams are being coached on a monthly basis. Dr Antoinette Gmeiner and a partner, have a Business Partner relationship with an LPL (Learning Performance Link), as well as the ETDP SETA, where they have established a coaching academy. She specialises in team coaching and has been coaching internal and external teams in organisations for more than 26 years.
RICHARD WILKINSONMr Richard Wilkinson retired as Executive Director of the Institute of Directors in Southern Africa during 2003, a position he held since 1991. He provided the Secretariat to, and was a member of the King Committee on Corporate Governance. He holds several Directorships on listed and non-listed companies and in the non-governmental organisational sector. He retired in 1991 as Executive Director of Rennies Group Limited having served the enterprise for 35 years.

11
OR
ION
RE
AL E
STATE LTD
A
NN
UA
L RE
PO
RT 2
015O
RIO
N R
EA
L ESTATE
LTD
AN
NU
AL R
EP
OR
T 2015
Independent Non-executive Director Mlamuli Delani MthembuAge: 57BA Hons (UJ), MSc (Univ KZN)
ANTHONY OLD (Subsequently appointed as CFO on 1 October 2015)
Anthony has a Bachelor of Business StudiesfromMasseyUniversityinNewZealand, a Bachelor of Accounting Science(Hons)fromUnisa,andisamember of the South African Institute of Chartered Accountants.
Having been employed in 2 of the big 4 accounting firms, Anthony has subsequently earned extensive senior financial management experience in the Property, Mining, Retail and Agriculture sectors, over the last 20 years.
DELANI MTHEMBUMr Delani Mthembu holds BA Honours HRD(UJ)andMScLeadershipandInnovation(UKZN)degrees.Hehasalsocompleted a postgraduate certificate inCoachingfromMiddlesexUniversity(UK)andMastersLevelAccreditationby EMCC and WABC. Currently he is a PhDcandidateattheUniversityofKZN.
He has memberships to various business organisations and is lecturing part time at various universities. Mr Mthembu has served as CEO and Board member to a number of private and public organisations.
Group Chief Financial OfficerAnthony OldAge: 53BBS B Compt (Hons), CA (SA)
12
OR
ION
RE
AL
EST
ATE
LTD
A
NN
UA
L R
EP
OR
T 2
015
12
OR
ION
RE
AL
EST
ATE
LTD
A
NN
UA
L R
EP
OR
T 2
015
Orion Real Estate Limited complies broadly with the principles and spirit of the Code of Corporate Practices and Conduct contained in the King Report on Corporate Governance for South Africa (“King III Report”). Full compliance was not continuously maintained through the financial year under review, in respect of:
1. INTERNAL AUDIT SERVICES
As a consequence of the demand for internal auditors in South Africa, internal audit services were not being regularly rendered to the business of the Company.
2. AUDIT COMMITTEE
The members of the Audit Committee were, as a consequence of their other commitments, not able to attend all Audit Committee meetings. This resulted in a number of decisions being taken by a resolution of members of the Audit Committee.
The Board is addressing the above, with a view to an on-going improvement.
THE CONSTITUTION AND OPERATION OF THE BOARD OF DIRECTORS
The Board:
• is accountable and responsible for the performance andaffairs of the Company;
• hasadoptedaCharteroutliningitsresponsibilities;• takesresponsibilityforguidingandmonitoringcompliance
with all applicable laws, regulations and codes of business practice;
• maintainsoversightovercomplianceandRiskmanagement,but delegates operational control to Management;
• hasdefinedlevelsofmateriality;• hasdelegated relevantmatters to the executive directors
and senior management based on detailed authority levels;• believesithasfullandeffectivecontrolovertheCompany
and oversight of management activities; and• hasthecommitmentofindividualdirectorsto:
- act in good faith- perform in the best interests of the Company- apply a high degree of skill and care- avoid conflicts with personal interests
BOARD CONSIST
The Board operates a unitary Board, consisting of one executive and four non-executive directors, of whom three are independent non-executive directors.
Following the death of the Financial Director, Mr C Nolte, the JSE Limited has agreed that Mr F Gmeiner should perform the duties of the Financial Director, until a satisfactory appointment was made.
The Board Chairman is an independent non-executive director.
The non-executive directors, who are trained and experienced, bring insight and expertise to Board deliberations.
COMPANY SECRETARY
The company secretary, Corporate Governance Facilitators Close Corporation, is an independent company secretarial practice providing services to numerous JSE-listed companies. The board is satisfied that the company secretary, and in particular its representative Clive Kneale, maintains an arm’s-length relationship with the board at all times and is sufficiently qualified and skilled to act in accordance with, and update directors in terms of the recommendations of the King III Report and other relevant regulations and legislation.
ACCESS TO INFORMATION
Directors have full and unrestricted access to all relevant Company information.
Non-executive directors enjoy unrestricted access to executive management.
All directors have unrestricted access to independent professional advice at the Company’s expense, by arrangement with the Company Secretary’s office, and on the approval of the Chairman of the Board.
CONFLICTS OF INTEREST
The directors declare actual and possible conflicts of interest to their co-directors and ensure that declarations are included in the minutes of the Board Meeting. The directors with an interest in any matter also recuse themselves from the relevant Board meeting, while their co-directors take a decision on the matter.
SUCCESSION PLANNING
The Board participates in the review of succession planning for key senior executive positions.
The directors periodically discuss succession planning and are comfortable that, in the event of any executive and senior management transition, plans are in place to ensure smooth transition.
DIRECTORS’: RETIREMENT BY ROTATION
Directors are appointed and re-appointed, by shareholders on the basis of one third of the non-executive directors resigning at each Annual General Meeting.
OTHER DIRECTORSHIPS
The Board believes that other directorships held by directors do not affect their ability to fully discharge their responsibilities as directors of Orion Real Estate Limited.

13
OR
ION
RE
AL E
STATE LTD
A
NN
UA
L RE
PO
RT 2
015
BOARD MEETINGS
During the year under review the Board met on a quarterly basis. All directors are encouraged to attend the Annual General Meeting.
Details of Board attendance for the year under review are included at the end of this report.
The Board has during the year under review conducted a continuous Board and Audit Committee evaluation process, to identify training needs, missed opportunities and governance matters.
BOARD COMMITTEES
The Audit committee is appointed by the shareholders and the board have also allocated to it the oversight of risk management. All the members of the committee are independent non-executive directors.
The Board is satisfied that the Committee has satisfactorily fulfilled its responsibilities, in line with its respective terms of reference, during the year under review.
AUDIT AND RISK MANAGEMENT COMMITTEE
In line with the requirements of section 94 of the Companies Act of South Africa, as amended, the Audit and Risk Management Committee has confirmed the following:
• AllmembersoftheAuditandRiskManagementCommitteeare independent non-executive directors.
• ThedutiesoftheAuditandRiskManagementCommitteeare specified in the report of the Audit Committee.
• OtherdutiesoftheAuditandRiskManagementCommitteeinclude the following:
- Nominating the external Auditor for appointment as Auditor of the Company;
- Verifying the independence of any proposed appointee as external Auditor, before the appointment becomes final;
- Approval of Audit fees;- Specifying the nature and extent of non-Audit services;- Pre-approval of contracts for non-Audit services;- Dealing with concerns or complaints relating to the
following:♦ accounting policies♦ internal Audit♦ the Audit or content of annual financial statements♦ internal financial controls
- The effectiveness of Risk management, internal controls and the governance processes.
DIRECTORS’ AND ExECUTIVE MANAGEMENT PERFORMANCE EVALUATION AND REwARD
Remuneration, in particular as it relates to executive management, is motivated by the dual criteria of delivering sustainable financial returns to shareholders and the recognition and reward for outstanding performance. Executive compensation is also linked to the achievement of the organisation’s non-financial goals.
Details of the remuneration of each individual director are provided in the Annual Financial Statements. A Self evaluation by directors was completed during the current year under review.
After review by the Board, the remuneration rates for non-executive directors, are approved by the shareholders at each Annual General Meeting, for implementation with retrospective effect to the beginning of the financial year, following the year under review. Rates for the 2015/16 financial year are set out in the Notice of meeting.
RISK MANAGEMENT AND INTERNAL CONTROLS
The Board is responsible and accountable for risk management and internal control.
Executive management, under the Board’s oversight, assumes responsibility for the integration of Risk practices into operational activities.
The Board is satisfied that management is attuned to both the negative and positive aspects of business Risk. The Board believes it has adequate information to facilitate the balanced assessment and management of significant Risks, the latter through effective internal control systems.
The Board believes that, in the year under review and up to the date of approval of annual reports and financial statements, Orion Real Estate Limited operated an adequate system of internal controls to minimise operational and financial Risks. The system of internal controls, which is Risk based, is regularly reviewed and tested. The Board believes that the system of internal control provides reasonable, but not absolute, assurance of the effectiveness and efficacy of controls, throughout the business.
Managerial responsibility for monitoring and reviewing controls lies with the Financial Director.
Currently the Internal Audit function focuses primarily on:
• verifying the effectiveness of controls, mentioned above;and
• advising management on improvements to operationalprocedures and risk management practices.

14
OR
ION
RE
AL
EST
ATE
LTD
A
NN
UA
L R
EP
OR
T 2
015
SUSTAINABILITY REPORT
Management is aware of the need to uplift the communities in which it operates. This is done by recruiting employees locally and providing training to improve their quality of life and skills.
DIRECTORS’ ATTENDANCE AT MEETINGS
Attendance at the Board of Directors meetings and the Audit and Risk Management Committee meetings is as follows:
DIRECTOR
Number of meetings attended
Board of Directors
Audit and Risk Management Committee
Social & Ethics Committee
Executive Directors
Mr F Gmeiner 5/5 5/5 4/4
Mr C Nolte 3/5 3/5 3/4
Non-Executive Director
Dr A C Gmeiner 3/5 2/5 2/4
Independent Non-executive Directors
Mr R S Wilkinson 5/5 5/5 4/4
Prof F Viruly 2/5 2/5 2/4
Mr M D K Mthembu 3/5 2/5 2/4
DIRECTORS’ REMUNERATION
Details of directors’ remuneration are set out in the financial statements.

15
OR
ION
RE
AL E
STATE LTD
A
NN
UA
L RE
PO
RT 2
015
15
OR
ION
RE
AL E
STATE LTD
A
NN
UA
L RE
PO
RT 2
015
The reports and statements set out below comprise the consolidated annual financial statements presented to the shareholders:
Directors’ Responsibilities and Approval 16
Certificate by the Company Secretary 17
Report of the Audit and Risk Management Committee 18
Directors’ Report 19
Report of the Independent Auditors 24
Consolidated Statement of Financial Position 25
Consolidated Statement of Comprehensive Income 26
Consolidated Statement of Changes in Equity 27
Consolidated Statement of Cash Flows 28
Accounting Policies 29
Notes to the consolidated annual financial statements 37
Notice of the Annual General Meeting 75
Level of Assurance
These annual financial statements have been audited in compliance with the applicable requirements of Section 30 (2)(a) of the Companies Act.
Preparer
These annual financial statements were compiled by Janie Jansen van Vuuren, B.Com (Hons) Professional Accountant (SA)
Published
30 September 2015

16
OR
ION
RE
AL
EST
ATE
LTD
A
NN
UA
L R
EP
OR
T 2
015
16
OR
ION
RE
AL
EST
ATE
LTD
A
NN
UA
L R
EP
OR
T 2
015
The directors are required in terms of the Companies Act of South Africa to maintain adequate accounting records and are responsible for the content and integrity of the consolidated annual financial statements and related financial information included in this report. It is their responsibility to ensure that the consolidated annual financial statements fairly present the state of affairs of the group as at the end of the financial year and the results of its operations and cash flows for the period then ended, in conformity with the International Financial Reporting Standards. The external auditors are engaged to express an independent opinion on the consolidated annual financial statements.
The consolidated annual financial statements are prepared in accordance with International Financial Reporting Standards and the requirements of the Companies Act of South Africa and are based upon appropriate accounting policies consistently applied and supported by reasonable and prudent judgements and estimates.
The directors acknowledge that they are ultimately responsible for the system of internal financial control established by the group and place considerable importance on maintaining a strong control environment. To enable the directors to meet these responsibilities, the board of directors sets standards for internal control aimed at reducing the risk of error or loss in a cost effective manner. The standards include the proper delegation of responsibilities within a clearly defined framework, effective accounting procedures and adequate segregation of duties to ensure an acceptable level of risk. These controls are monitored throughout the group and all employees are required to maintain the highest ethical standards in ensuring the group’s business is conducted in a manner that in all reasonable circumstances is above reproach. The focus of risk management in the group is on identifying, assessing, managing and monitoring all known forms of risk across the group. While operating risk cannot be fully eliminated, the group endeavours to minimise it by ensuring that appropriate infrastructure, controls, systems and ethical behaviour are applied and managed within predetermined procedures and constraints.
The directors are of the opinion, based on the information and explanations given by management, that the system of internal control provides reasonable assurance that the financial records may be relied on for the preparation of the consolidated annual financial statements. However, any system of internal financial control can provide only reasonable, and not absolute, assurance against material misstatement or loss.
The directors have reviewed the group’s cash flow forecast for the next 12months from the date of approval of the consolidated annual financial statements, in the light of this review and the current financial position, they are satisfied that the group has or has access to adequate resources to continue in operational existence for the foreseeable future.
The external auditors are responsible for independently auditing and reporting on the group’s consolidated annual financial statements and company annual financial statements. The consolidated annual financial statements have been examined by the group’s external auditors and their report is presented on page 24.
The consolidated annual financial statements set out on pages 25 to 74, which have been prepared on the going concern basis, were approved by the board of directors on 22 September 2015 and were signed on its behalf by:
F Gmeiner MDK MthembuManaging Director DirectorJohannesburg Johannesburg

17
OR
ION
RE
AL E
STATE LTD
A
NN
UA
L RE
PO
RT 2
015
We declare that, to the best of our knowledge, in terms of the Companies Act of South Africa, as amended, that in respect of the financial year ended 30 June 2015, the Company has lodged with the Companies and Intellectual Property Commission all such returns as are required of a public company in terms of the Companies Act of South Africa, as amended, and that all such returns are true, correct and up-to-date.
CORPORATE GOVERNANCE FACILITATORS CC Chartered Secretaries
30 September 2015

18
OR
ION
RE
AL
EST
ATE
LTD
A
NN
UA
L R
EP
OR
T 2
015
1. INTRODUCTION
The Audit and Risk Management Committee has pleasure in submitting this report, as required by section 94.7(f), (g) and (h) of the Companies Act of South Africa, as amended.
2. FUNCTIONS OF THE AUDIT AND RISK COMMITTEE
The Audit and Risk Committee performed the following functions during the year:
2.1 Review of the interim and year-end financial statements and accounting practices, culminating with a recommendation to the Board.
2.2 Review of the external audit reports, after audit of the interim and year-end financial statements.
2.3 Review of the internal audit and risk management reports, which, when relevant, culminating in recommendations being made to the Board of Directors.
2.4 In the course of its review the Committee:
• took appropriate steps to ensure that financialstatements are prepared in accordance with International Financial Reporting Standards (IFRS);
• TheCommitteethroughitsreviewofthe2016budgetand discussions with executive management reported to the board that it supports management’s view that the Company will continue to operate as a going concern for the foreseeable future.
• considered and, made recommendations to theBoard on internal financial controls and the going concern concept analysis;
• verifiedtheindependenceoftheexternalauditor;
• authorisedtheauditfeesinrespectofboththeinterimand year-end audits;
• specified guidelines on the nature and extent andpre-approved agreements with the auditors, for the provision of non-audit services;
• evaluated the effectiveness of risk management,controls and the governance processes, in all group companies;
• evaluated theperformanceof theFinancialDirector,as required by JSE Listings Requirement 3.84(i);
• dealt with concerns or complaints relating to thefollowing:
- Accounting practices- Internal audit- The audit or content of the Consolidated Annual
Financial Statements- Internal financial controls
3. MEMBERS OF THE AUDIT AND RISK MANAGEMENT COMMITTEE
3.1 The Audit and Risk Management Committee has, during the year under review, consisted of three independent non-executive directors, namely Professor F Viruly, Mr R Wilkinson and Mr MDK Mthembu. Following the resignation of Professor Viruly, Mr DPW André was appointed as a committee member but resigned on 22 September 2015.
3.2 The members of the Audit and Risk Management Committee have at all times acted in an independent manner.
4. AUDITORS ATTENDANCE AT COMMITTEE MEETINGS
The internal and external auditors were invited to attend all meetings of the Audit and Risk Management Committee.
5. INVITATIONS TO ATTEND MEETINGS OF THE COMMITTEE
Committee members of the Audit and Risk Management Committee regularly hold confidential meetings with the internal and external auditors.
Any director who is not a member of the Audit and Risk Management Committee, has a standing invitation to attend meetings of the Committee, on a “by invitation” basis.
6. INDEPENDENCE OF AUDIT
BDO South Africa Inc were appointed the Auditors of your company, in respect of the year under review. The Audit and Risk Management Committee have reviewed and confirms the independence of the Auditor.
7. ExPERTISE AND ExPERIENCE OF FINANCIAL DIRECTOR AND COMPANY SECRETARY
As required by JSE Listings Requirement 3.84, the Audit and Risk Management Committee and the Board, respectively, are satisfied that the Financial Director and the Company Secretary have appropriate expertise and experience.

19
OR
ION
RE
AL E
STATE LTD
A
NN
UA
L RE
PO
RT 2
015
The directors have pleasure in submitting their report for the year ended 30 June 2015.
Nature of business
Orion Real Estate Limited is a property investment and development company listed on the JSE Limited (“JSE”) investing in commercial, hospitality, industrial, residential and retail properties and deriving income from rentals. There were no material changes in the nature of the business during the financial year.
Capital structure
To align the Company’s capital structure with the REIT standard in South Africa and to comply with JSE Listings Requirements for REITs, Orion Real Estate Limited converted its linked unit capital structure into an all share capital structure within the scheme of arrangement framework provided for in terms of section 114 of the Companies Act of South Africa. The implementation date of the scheme was 8 April 2015 resulting in a R40 101 148 increase in share capital.
Company addresses
The company’s addresses are as follows:
Registered Office & Business address Postal address16th Floor, Orion House PO Box 3141649 Jorissen Street Braamfontein Braamfontein Johannesburg Johannesburg 20172017
Financial results
The operating results and state of affairs of the group are fully set out in the attached consolidated annual financial statements. Please refer to note 35 for the restatement of prior year company results.
The group’s performance against previous year’s results is summarised as follows:
2015 Restated 2014
% change
Revenue 99 547 277 96 708 822 2,9%
Profit before taxation 32 890 034 50 003 160 -34,2%
Net profit attributable to equity holders 109 814 308 39 922 671 175,1%
Restated 2014
2013 % change
Revenue 96 708 822 91 224 924 6,0%
Profit before taxation 50 003 160 31 941 729 56,5%
Net profit attributable to equity holders 39 922 671 25 361 634 57,4%
2013 2012 % change
Revenue 91 224 924 95 473 815 -4,5%
Profit before taxation 31 941 729 79 264 442 -59,7%
Net profit attributable to equity holders 25 361 634 47 966 586 -47,1%
Total revenue
Consolidated revenue increased by 2.9% to R99 547 277 in 2015 (2014: 96 708 822). The increase in rentals were due to normal annual rental increases.
Results
Net profit attributable to equity holders substantially increased by 175.1% to R109 814 308 in 2015 due to REIT conversion (2014: R39 922 671).
The group consolidated profit before taxation decreased by 34.2% to R32 890 034 in 2015, mainly due to lower fair value adjustments (2014: R50 003 160). The directors took a more conservative approach on internal valuations, given the current economic challenges in the market.
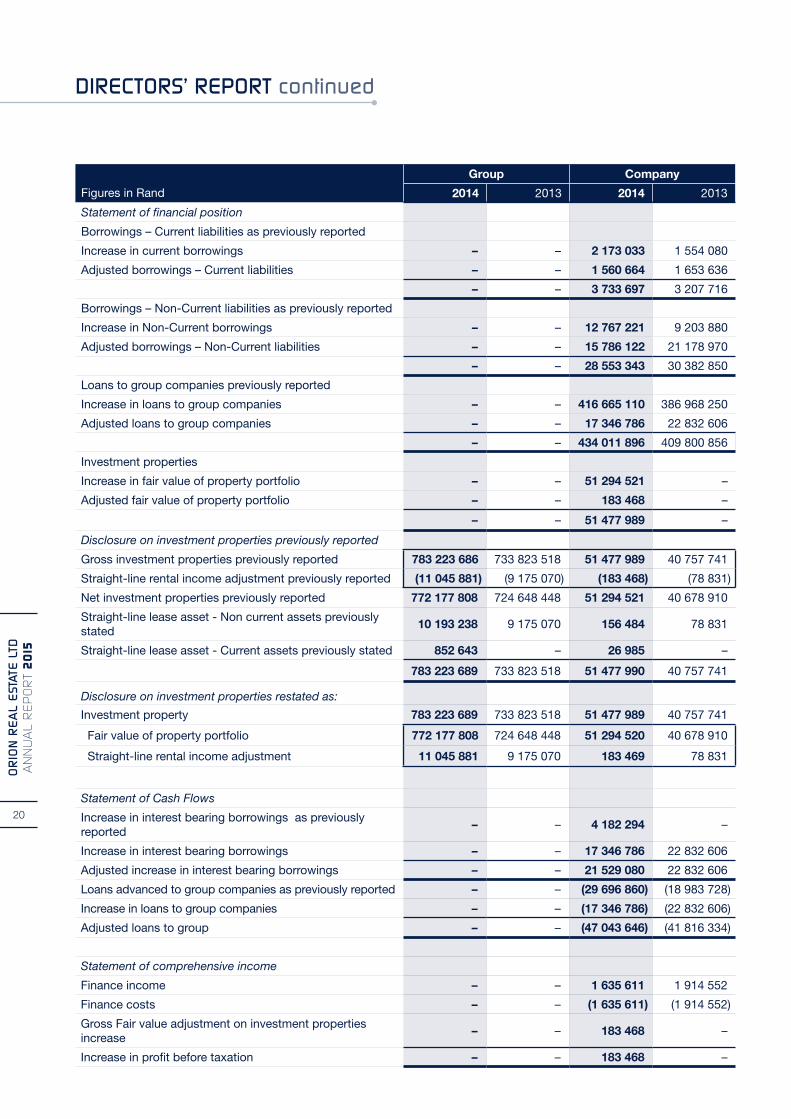
Prior period restatement
The prior period restatements have arisen due to a calculation error on the fair value adjustment on investment property as well as incorrect disclosure of Investment properties on the Statement of Financial position.
A mortgage bond that was accounted for in the incorrect subsidiary has been transferred to the holding company. The effects of the restatements were as follows:
20
OR
ION
RE
AL
EST
ATE
LTD
A
NN
UA
L R
EP
OR
T 2
015
Figures in Rand
Group Company
2014 2013 2014 2013
Statement of financial position
Borrowings – Current liabilities as previously reported
Increase in current borrowings – – 2 173 033 1 554 080
Adjusted borrowings – Current liabilities – – 1 560 664 1 653 636
– – 3 733 697 3 207 716
Borrowings – Non-Current liabilities as previously reported
Increase in Non-Current borrowings – – 12 767 221 9 203 880
Adjusted borrowings – Non-Current liabilities – – 15 786 122 21 178 970
– – 28 553 343 30 382 850
Loans to group companies previously reported
Increase in loans to group companies – – 416 665 110 386 968 250
Adjusted loans to group companies – – 17 346 786 22 832 606
– – 434 011 896 409 800 856
Investment properties
Increase in fair value of property portfolio – – 51 294 521 –
Adjusted fair value of property portfolio – – 183 468 –
– – 51 477 989 –
Disclosure on investment properties previously reported
Gross investment properties previously reported 783 223 686 733 823 518 51 477 989 40 757 741
Straight-line rental income adjustment previously reported (11 045 881) (9 175 070) (183 468) (78 831)
Net investment properties previously reported 772 177 808 724 648 448 51 294 521 40 678 910
Straight-line lease asset - Non current assets previously stated
10 193 238 9 175 070 156 484 78 831
Straight-line lease asset - Current assets previously stated 852 643 – 26 985 –
783 223 689 733 823 518 51 477 990 40 757 741
Disclosure on investment properties restated as:
Investment property 783 223 689 733 823 518 51 477 989 40 757 741
Fair value of property portfolio 772 177 808 724 648 448 51 294 520 40 678 910
Straight-line rental income adjustment 11 045 881 9 175 070 183 469 78 831
Statement of Cash Flows
Increase in interest bearing borrowings as previously reported
– – 4 182 294 –
Increase in interest bearing borrowings – – 17 346 786 22 832 606
Adjusted increase in interest bearing borrowings – – 21 529 080 22 832 606
Loans advanced to group companies as previously reported – – (29 696 860) (18 983 728)
Increase in loans to group companies – – (17 346 786) (22 832 606)
Adjusted loans to group – – (47 043 646) (41 816 334)
Statement of comprehensive income
Finance income – – 1 635 611 1 914 552
Finance costs – – (1 635 611) (1 914 552)
Gross Fair value adjustment on investment properties increase
– – 183 468 –
Increase in profit before taxation – – 183 468 –

21
OR
ION
RE
AL E
STATE LTD
A
NN
UA
L RE
PO
RT 2
015
The adjusted profit in Rands was calculated as follows:
2015 2014
Profit before taxation – 50 003 160
Adjusted for:
Linked debenture interest (amortisation) – 535 978
Fair value adjustment to debtors – discounting – (4 656 177)
Debenture interest distribution – 2 597 606
Fair value adjustments on investment properties – (38 816 938)
Operating lease adjustment – (1 870 812)
Adjusted profit before taxation – 7 792 817
Debenture interest distribution of 33,3% of adjusted profit before taxation – 2 597 606
Dividends and distributions
DividendsNo dividends were declared during the year under review (2014: R Nil). Refer to note 36.
Debenture interest distributionA debenture interest distribution was made to linked unit holders in accordance with the third supplemental trust deed.
Board of directors
The following were directors of the company throughout the financial year:
Name Nature of appointment Nationality
Mr RS Wilkinson Independent Non-executive Chairman
South African
Mr MDK Mthembu Independent Non-executive South African
Dr AC Gmeiner Non-executive Director South African
Mr F Gmeiner Managing Director Austrian
Mr DPW André * Independent Non-executive South African
* Resigned 22 September 2015
Directors remuneration
The directors’ remuneration for the year ended 30 June 2015 was approved by way of a special resolution passed at the Annual General Meeting held on 24 November 2014. Details of remuneration are disclosed in note 26.
Directors’ term of service
One third of the board of directors in office are to retire at each annual general meeting. The directors to retire shall be those
who have been the longest in office since their last election or appointment. The managing director may be appointed by contract for a maximum period of five years at any one time. Retiring directors shall be eligible for re-election.
Dr AC Gmeiner and Mr RS Wilkinson were re-elected as directors on 24 November 2014. Prof Viruly has resigned as director on 18 March 2015. Mr CN Nolte has passed away during the current year and was removed as director on 28 May 2015. Mr DPW André was elected to the board of directors on 28 May 2015 and subsequently has resigned as director on 22 September 2015.
Directors’ interest in contracts
During the previous year the group and company’s property portfolio were managed (in terms of an agreement) by OFM Property Management Proprietary Limited. The company is fully controlled in terms of shareholding by Mr F Gmeiner and Dr A C Gmeiner who are also directors of the company. Since 1 March 2015 some of the services are no longer outsourced.
Rental agreements are in place between Orion Real Estate Limited, its subsidiaries and controlled trust with the following companies:
Company Controlled by
Orion Creative Business Ideas Proprietary Limited
F Gmeiner and AC Gmeiner
OFM Property Management Proprietary Limited
F Gmeiner and AC Gmeiner
Orion Hotels and Resorts (SA) Proprietary Limited
F Gmeiner
Orion Hotels and Resorts Proprietary Limited
F Gmeiner
All related party transactions and balances are fully disclosed in note 30.
Borrowing powers of directors
The Memorandum of Incorporation (“MOI”) authorises the directors to borrow or raise for the purposes of the company such sums as they deem fit in particular by mortgage bond or by the issue of debentures or debenture stock of the company, whether unsecured or charged upon all or any part of the property of the company. The level of borrowings are within the limits authorised by the Memorandum of Incorporation.
Authorised and issued share capital and debentures
The authorised share capital comprises of 2 000 000 000 shares with no par value. The authorised and issued share capital were converted into shares with no par value during the year under review.
As at 30 June 2015 there where 630 698 688 ordinary shares (2014: 630 698 688 linked units) in issue.
During the year under review, the process to convert to a REIT was successfully completed and the linked units (comprising of

22
OR
ION
RE
AL
EST
ATE
LTD
A
NN
UA
L R
EP
OR
T 2
015
one ordinary share of 1 cent and one unsecured debenture of 1 cent per linked unit) were delinked. The debenture capital and premium now also forms part of the issued share capital of the company. The new financial instruments were listed on the JSE and in future will trade as shares in the company.
Details of the authorised share capital and share premium are stated in note 9 and details of the debentures are stated in note 10.
Shares spread
The shareholders (2014: linked unit holders) spread is disclosed in note 34.
Directors’ shareholding
The directors’ shareholding (2014: linked unit holding) is disclosed in note 34.
Interest in subsidiary companies and controlled trusts
Details of the company’s investment in subsidiary companies and controlled trusts are disclosed in note 5.
The net income/(loss) after taxation per subsidiaries and controlled trust for 2015 were as follows:
Name of subsidiary or trust
Net income/(loss) after
taxation (R)
CBB Properties Proprietary Limited 25 363
Elma Park 195 Limited (5 484 444)
GEHS Leasing Company Proprietary Limited (221 223)
Gold Edge III Proprietary Limited 1 658
Ixia Trading 532 Proprietary Limited 5 896 555
Orion Development One Proprietary Limited (112 140)
Orion Development Two Proprietary Limited 9 800
Orion Development Three Proprietary Limited (200)
Orion Property Holding Trust –
SBD Investments Proprietary Limited 3 243 759
3 359 128
The above entities are incorporated in the Republic of South Africa.
Company secretary
The secretary of the company is Corporate Governance Facilitators CC (C Kneale) whose sole member has extensive experience and is professionally qualified as a Company Secretary and in corporate governance matters. As required by JSE Listings Requirement 3.84(i), the Audit and Risk Management Committee and the Board, respectively, are satisfied that the Company Secretary has appropriate expertise and experience.
The contact addresses of the company secretary are as follows:
Business address Postal address16th Floor, Orion House Private Bag X449 Jorissen Street Jukskei ParkBraamfontein Johannesburg2017 2153
Auditors
BDO South Africa Incorporated was appointed in office as auditors for the company during the 2015 financial year.
Going concern
The financial statements have been prepared on the basis of accounting policies applicable to a going concern. This basis presumes that funds will be available to finance future operations and that the realisation of assets and settlement of liabilities, contingent obligations and commitments will occur in the ordinary course of business. The board of Directors believes that the group have adequate resources to continue in operational existence for the foreseeable future.
Group management has considered the cash flow forecast for the next 12 months, the 5 year operational income forecast and other planned potential developments in the short and medium term. Based on this they remain satisfied with the group’s liquidity position. The other planned potential developments are the re-financing of certain bonds to 50% of fair value, planned repayment by conncected parties of debt and the sale of properties.
Liquidity and solvency
The directors have performed the liquidity and solvency tests required by the Companies Act of South Africa.
Group management has considered the cash flow forecast for the next 12 months, the 5 year operational income forecast and other planned potential developments in the short and medium term. Based on this they remain satisfied with the group’s liquidity position. The other planned potential developments are the issue of term notes and planned repayment of connected party debt through the purchase of a property from connected party. Refer to note 36.

23
OR
ION
RE
AL E
STATE LTD
A
NN
UA
L RE
PO
RT 2
015
Events after the reporting period
The directors are not aware of any other reportable matter or circumstance arising since the end of the financial year, not otherwise dealt with in the financial statements, which would affect the operations of the company and the group or the results of these operations significantly. Refer to note 36.
Capital commitments
Refer to note 28 of the consolidated annual financial statements where details of the capital commitments can be found.
Litigation statement
The directors are not aware of any legal or arbitration procedures that are pending or threatening, that may have had, in the previous 12 months, a material effect on the group’s financial position. Refer to note 29 for possible contingent liabilities relating to ongoing litigation.
Special Resolutions & Amendments to Articles of Association / Memorandum of Incorporation
The following special resolutions were passed in the group during the year:
Conversion to a REIT
Special resolutions have been passed to authorise the company to convert to a REIT.
Remuneration of Non-executive Directors
The remuneration paid to Non-executive Directors were approved with retrospect effect for the year ending 30 June 2015.
Company’s remuneration policy
Shareholders voted in favour of the company’s remuneration policy.
Financial Assistance - Intercompany Loans
Special resolutions have been passed at the Annual General Meeting, to authorise the Company to provide financial assistance to certain related and/or inter-related companies.
Memorandum of Incorporation
Special resolution to replace the existing Memorandum and Articles of Association of the company in its entirety by the new Memorandum of Incorporation in compliance with the Companies Act, the Listing Requirements of the JSE Limited and King III Report of corporate governance due to the conversion to a REIT.
Appointment of Audit Committee
Election of Mr MDK Mthembu, MR RS Wilkinson and Prof FM Viruly (subsequently resigned) to serve as members of the Audit Committee.
Authority to issue shares
Authority was given to the Directors to allot and issue the unissued share capital of the Company at their discretion until the next Annual General Meeting, limited to 15% of the Company’s issued share capital at 30 June 2015.
Authority to purchase securities
General approval was given for the Company and/or any subsidiary of the Company to acquire the issued shares of the Company subject to the provisions of the Companies Act, the JSE Listings Requirements and the Memorandum of Incorporation.

24
OR
ION
RE
AL
EST
ATE
LTD
A
NN
UA
L R
EP
OR
T 2
015
We have audited the consolidated and separate financial statements of Orion Real Estate Limited, as set out on pages 25 to 74, which comprise the statement of financial position as at 30 June 2015, and the statement of comprehensive income, statement of changes in equity and statement of cash flows for the year then ended, and the notes, comprising a summary of significant accounting policies and other explanatory information.
Directors’ responsibility for the consolidated financial statements
The Company’s directors are responsible for the preparation and fair presentation of these consolidated and separate financial statements in accordance with International Financial Reporting Standards, and requirements of the Companies Act of South Africa, and for such internal control as the directors determine is necessary to enable the preparation of consolidated and separate financial statements that are free from material misstatements, whether due to fraud or error.
Auditors’ responsibility
Our responsibility is to express an opinion on these consolidated and separate financial statements based on our audit. We conducted our audit in accordance with International Standards on Auditing. Those standards require that we comply with ethical requirements and plan and perform the audit to obtain reasonable assurance whether the consolidated and separate financial statements are free from material misstatement. An audit involves performing procedures to obtain audit evidence about the amounts and disclosures in the financial statements. The procedures selected depend on the auditors’ judgement, including the assessment of the risks of material misstatement of the financial statements, whether due to fraud or error. In making those risk assessments, the auditor considers internal control relevant to the entity’s preparation and fair presentation of the financial statements in order to design audit procedures that are appropriate in the circumstances, but not for the purpose of expressing an opinion on the effectiveness of the entity’s internal control. An audit also includes evaluating the appropriateness of accounting policies used and the reasonableness of accounting estimates made by management, as well as evaluating the overall presentation of the financial statements.
We believe that the audit evidence we have obtained is sufficient and appropriate to provide a basis for our audit opinion.
Opinion
In our opinion, the consolidated and separate financial statements present fairly, in all material respects, the consolidated and separate financial position of Orion Real Estate Limited as at 30 June 2015, and its consolidated and separate financial performance and its consolidated and separate cash flows for the year then ended in accordance with International Financial Reporting Standards, andthe requirements of the Companies Act of South Africa.
Other reports required by the Companies Act of South Africa
As part of our audit of the consolidated and separate financial statements for the year ended 30 June 2015, we have read the Directors’ report, Audit, Risk and Compliance Committees’ report and the Company Secretary’s declaration for the purpose of identifying whether there are material inconsistencies between these reports and the audited consolidated and separate financial statements. These reports are the responsibility of the respective preparers. Based on reading these reports we have not identified material inconsistencies between these reports and the audited consolidated and separate financial statements. However, we have not audited these reports and accordingly do not express an opinion on these reports.
BDO South Africa Incorporated H Bhaga Muljee 22 Wellington Road Director Parktown Registered auditor Johannesburg 2193
30 September 2015
TO THE SHAREHOLDERS OF ORION REAL ESTATE LIMITED

25
OR
ION
RE
AL E
STATE LTD
A
NN
UA
L RE
PO
RT 2
015
Figures in Rand Notes
Group Company
2015Restated
2014 Restated
2013 2015Restated
2014 Restated
2013
ASSETS
Investment property 3 772 015 611 783 223 689 733 823 518 50 442 030 51 477 989 40 757 741
Fair value of property portfolio 3 762 593 997 772 177 808 724 648 448 49 685 838 51 294 520 40 678 810
Straight-line rental income adjustment 6 9 421 614 11 045 881 9 175 070 756 192 183 469 78 931
Property, plant and equipment 4 1 337 724 1 289 050 564 705 599 143 331 313 61 102
Investments in subsidiaries and controlled trusts 5 – – – 21 028 144 21 028 144 21 028 144
Trade and other receivables 7 – 20 007 034 10 922 285 – – –
Total Non-current assets 773 353 335 804 519 773 745 310 508 72 069 317 72 837 446 61 846 987
Loans to related parties 13 19 923 506 14 508 175 5 740 324 19 868 538 14 453 207 5 172 023
Loans to directors 15 – 160 071 – 260 160 071 –
Loans to group companies 14 – – – 453 518 391 434 011 896 409 800 856
Stock on hand 4 321 – – 4 321 – –
Trade and other receivables 7 43 139 146 14 959 234 19 703 737 2 403 163 860 107 3 035 840
Cash and cash equivalents 8 3 606 291 774 188 4 187 424 3 591 001 753 991 4 151 587
Investment properties held for sale – – 24 650 000 – – –
Total Current Assets 66 673 264 30 401 668 54 281 485 479 385 674 450 239 272 422 700 306
Total Assets 840 026 599 834 921 441 799 591 993 551 454 991 523 076 718 484 547 293
EQUITY AND LIABILITIESCapital and reserves
Share capital and share premium 9 114 336 674 74 235 526 74 235 526 115 031 746 74 272 415 74 272 415
Debenture reserve 11 – 10 675 886 10 675 886 – 10 675 886 10 675 886
Retained earnings 504 392 314 369 012 064 329 090 478 381 056 766 266 551 541 236 744 261
Total equity attributable to owners of the parent 618 728 988 453 923 476 414 001 890 496 088 512 351 499 842 321 692 562
Non-controlling interest (286 933) (270 127) (271 127) – – –
Total equity 618 442 055 453 653 349 413 730 678 496 088 512 351 499 842 321 692 562
Linked debentures 10 – 54 974 397 54 438 419 – 55 632 580 55 096 602
Borrowings 12 127 353 881 167 250 231 169 992 645 25 399 774 28 553 343 30 382 850
Deferred tax liabilities 16 1 856 393 79 800 174 73 403 399 1 118 208 61 562 898 57 482 933
Total Non-current liabilities 129 210 274 302 024 802 297 834 463 26 517 982 145 748 821 142 962 385
Current income tax liabilities 25.2 8 610 355 11 005 713 13 064 856 6 212 605 8 361 145 10 377 162
Loans from directors 15 18 248 18 508 18 508 – – -
Loans from related parties 13 21 012 435 360 2 126 356 21 012 435 360 2 126 241
Loans from group companies 14 – – – 9 128 413 6 603 051 39 754
Tenant deposits 17.1 6 961 064 6 563 381 6 371 863 349 064 127 357 140 622
Trade and other payables 17 47 452 023 38 718 411 30 141 534 5 882 296 3 022 816 1 987 806
Borrowings 12 25 758 076 17 923 438 33 846 265 4 237 866 3 733 697 3 207 716
Bank overdraft 8 3 553 492 4 578 479 2 457 470 3 017 242 3 544 629 2 013 045
Current Liabilities 92 374 271 79 243 290 88 026 852 28 848 498 25 828 055 19 892 346
Total Liabilities 221 584 544 381 268 092 385 861 315 55 366 480 171 576 876 162 854 731
Total Equity and Liabilities 840 026 599 834 921 441 799 591 993 551 454 991 523 076 718 484 547 293

26
OR
ION
RE
AL
EST
ATE
LTD
A
NN
UA
L R
EP
OR
T 2
015
Figures in Rand Notes
Group Company
2015
2014
2015
Restated 2014
Revenue 99 547 277 96 708 822 5 243 605 2 907 284
Property revenue 18 101 171 545 94 838 010 4 670 882 2 802 646
Straight-line rental income accrual 6 (1 624 268) 1 870 812 572 723 104 638
Other income 19 13 080 160 3 049 775 11 043 291 15 910
Other direct property operating costs 20 (74 886 055) (68 146 174) (26 724 923) (9 910 758)
Adminstrative and management expenses 20 – (200 760) (41 400) (113 421)
Repairs and maintenance 20 (5 877 678) (7 982 122) (446 626) (201 899)
Profit distribution from controlled trust 33 – – 43 169 597 47 477 687
Fair value adjustment 3 13 372 211 38 816 938 (1 608 682) 1 115 710
Gross change in fair value of investment property 3 11 747 942 40 687 749 (1 035 959) 1 220 348
Straight-line lease adjustment 6 1 624 268 (1 870 812) (572 723) (104 638)
Fair value adjustment to debtors 7 446 238 4 656 177 – –
Operating profit before interest 45 682 153 66 902 656 30 634 862 41 290 513
Finance income 21 4 492 671 3 171 429 1 882 228 1 772 348
Linked debenture interest 10 – (535 978) – (535 978)
Finance costs 22 (17 284 790) (19 534 947) (2 986 184) (5 681 269)
Profit before taxation 32 890 034 50 003 160 29 530 906 36 845 614
Taxation 23 76 924 274 (10 080 489) 59 425 184 (7 038 334)
Profit for the year 109 814 308 39 922 671 88 956 090 29 807 280
Other comprehensive income – – – –
Total comprehensive income for the year 109 814 308 39 922 671 88 956 090 29 807 280
Figures in Rand Note
Group
2015 2014
Profit/(loss) and total comprehensive income/(loss) for the year attributable to:
Owners of the parent 109 831 115 39 921 586
Non-controlling interest (16 806) 1 085
109 814 308 39 922 671
Earnings per share
Basic earnings per share (cents) 24 17,52 6,37
Diluted earnings per share (cents) 24 17,52 6,37

27
OR
ION
RE
AL E
STATE LTD
A
NN
UA
L RE
PO
RT 2
015
GROUP
Figures in RandShare
capital Share
premium
Total share capital and
premium Debenture
reserve Retained earnings Total
Non- controlling
interest Total
equity
Balance at 30 June 2013 6 270 098 67 965 428 74 235 526 10 675 886 329 090 478 414 001 890 (271 212) 413 730 678
Total comprehensive income for the year – profit/(loss) as previously stated – – – – 34 819 171 34 819 171 1 085 34 820 256
Restatement for discounting of debtors – – – – 5 102 415 5 102 415 – 5 102 415
Balance at 30 June 2014 6 270 098 67 965 428 74 235 526 10 675 886 369 012 064 453 923 476 (270 127) 453 653 349
Total comprehensive income for the year – – – – 109 831 115 109 831 115 (16 806) 109 814 309
REIT conversion of Debentures reserve – – – (10 675 886) 10 675 886 – – –
REIT conversion of Debentures valuation premium – – – – 14 873 249 14 873 249 – 14 873 249
REIT conversion of Share premium 67 965 428 (67 965 428) – – – – – –
REIT conversion of Debenture capital & premium 40 101 148 – 40 101 148 – – 40 101 148 – 40 101 148
Balance at 30 June 2015 114 336 674 – 114 336 674 – 504 392 314 618 728 988 (286 933) 618 442 055
Notes 9 9 9 11
COMPANY
Figures in RandShare
capital Share
premium
Total share capital and
premium Debenture
reserve Retained earnings
Totalequity
Balance at 30 June 2013 6 306 987 67 965 428 74 272 415 10 675 886 236 744 261 321 692 562
Total comprehensive income for the year – profit as previously stated – – – – 24 521 396 24 521 396
Restatement of distribution from controlled trust – – – – 5 102 415 5 102 415
Restatement of gross change in fair value of investment property – – – – 183 469 183 469
Balance at 30 June 2014 Restated 6 306 987 67 965 428 74 272 415 10 675 886 266 551 541 351 499 842
Total comprehensive income for the year – – – – 88 956 090 88 956 090
REIT conversion Debentures reserve – – – (10 675 886) 10 675 886 –
REIT conversion Debentures valuation premium – – – – 14 873 249 14 873 249
REIT conversion of Share premium 67 965 428 (67 965 428) – – – –
REIT conversion of Debenture capital & premium 40 759 331 – 40 759 331 – – 40 759 331
Balance at 30 June 2015 115 031 746 – 115 031 746 – 381 056 766 496 088 512
Notes 9 9 9 11
28
OR
ION
RE
AL
EST
ATE
LTD
A
NN
UA
L R
EP
OR
T 2
015
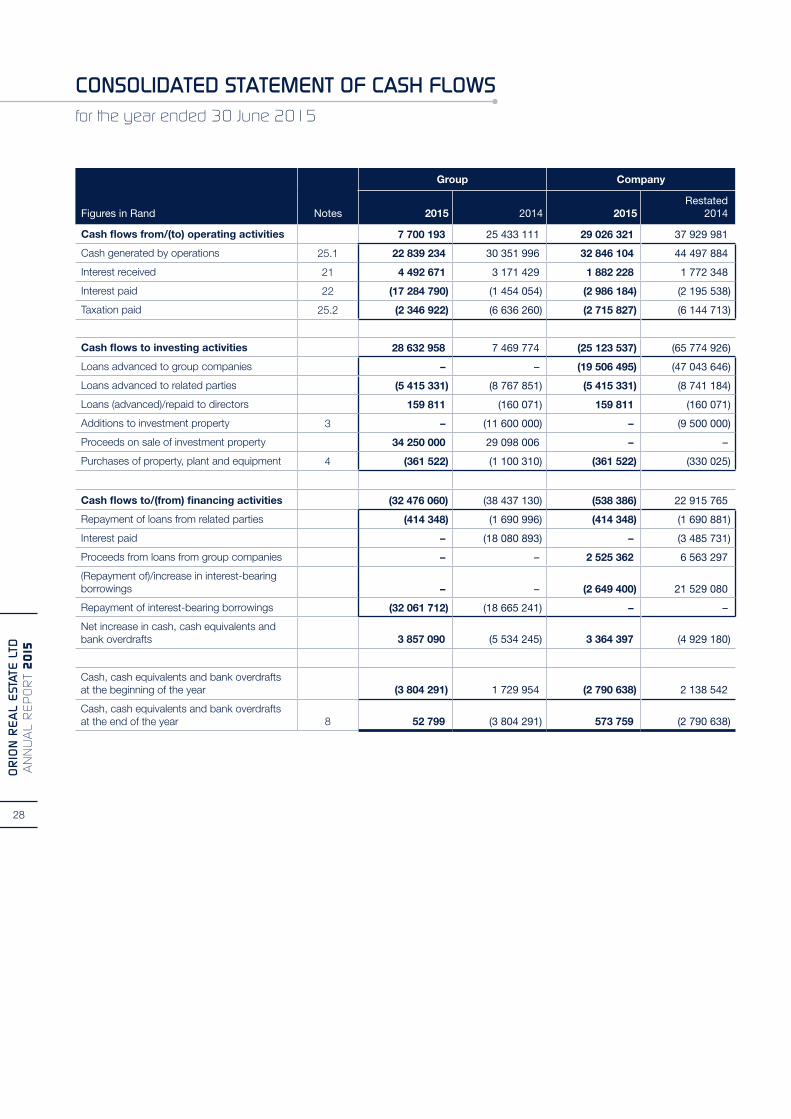
Figures in Rand Notes
Group Company
2015 2014 2015Restated
2014
Cash flows from/(to) operating activities 7 700 193 25 433 111 29 026 321 37 929 981
Cash generated by operations 25.1 22 839 234 30 351 996 32 846 104 44 497 884
Interest received 21 4 492 671 3 171 429 1 882 228 1 772 348
Interest paid 22 (17 284 790) (1 454 054) (2 986 184) (2 195 538)
Taxation paid 25.2 (2 346 922) (6 636 260) (2 715 827) (6 144 713)
Cash flows to investing activities 28 632 958 7 469 774 (25 123 537) (65 774 926)
Loans advanced to group companies – – (19 506 495) (47 043 646)
Loans advanced to related parties (5 415 331) (8 767 851) (5 415 331) (8 741 184)
Loans (advanced)/repaid to directors 159 811 (160 071) 159 811 (160 071)
Additions to investment property 3 – (11 600 000) – (9 500 000)
Proceeds on sale of investment property 34 250 000 29 098 006 – –
Purchases of property, plant and equipment 4 (361 522) (1 100 310) (361 522) (330 025)
Cash flows to/(from) financing activities (32 476 060) (38 437 130) (538 386) 22 915 765
Repayment of loans from related parties (414 348) (1 690 996) (414 348) (1 690 881)
Interest paid – (18 080 893) – (3 485 731)
Proceeds from loans from group companies – – 2 525 362 6 563 297
(Repayment of)/increase in interest-bearing borrowings – – (2 649 400) 21 529 080
Repayment of interest-bearing borrowings (32 061 712) (18 665 241) – –
Net increase in cash, cash equivalents and bank overdrafts 3 857 090 (5 534 245) 3 364 397 (4 929 180)
Cash, cash equivalents and bank overdrafts at the beginning of the year (3 804 291) 1 729 954 (2 790 638) 2 138 542
Cash, cash equivalents and bank overdrafts at the end of the year 8 52 799 (3 804 291) 573 759 (2 790 638)

29
OR
ION
RE
AL E
STATE LTD
A
NN
UA
L RE
PO
RT 2
015
1.1 Basis of preparation
Orion Real Estate Limited is a property investment and development company. The company is a public limited company which is listed on the JSE Limited and is incorporated and domiciled in South Africa.
The consolidated and separate financial statements are prepared in accordance with International Financial Reporting Standards and the interpretations adopted by the International Accounting Standards Board (IASB) and the International Financial Reporting Interpretations committee of the IASB. The consolidated and separate financial statements comply with the SAICA Financial Reporting Guides as issued by the Accounting Practices Committee and Financial Reporting Pronouncements as issued by the Financial Reporting Standards Council, the JSE Listing Requirements and the requirements of the Companies Act of South Africa.
The consolidated annual financial statements are prepared on the historic cost basis, except for investment property which are carried at fair value, and incorporate the principal accounting policies set out below.
The annual financial statements are prepared on a going-concern basis and are presented in Rands.
These accounting policies are consistent with the previous period.
1.2 Consolidation
Basis of consolidation
The consolidated Group annual financial statements incorporate the annual financial statements of the Company and all entities, which are controlled by the Company.
Subsidiaries are all entities (including special purpose entities) where the parent is exposed to, or has rights to, variable returns from its involvement with the entity, and has the ability to effect those returns through its power over the entity.
The results of the subsidiaries are included in the consolidated Group annual financial statements from the effective date of acquisition to the effective date of disposal. On acquisition the Group recognises the subsidiary’s identifiable assets, liabilities and contingent liabilities at fair value, except for assets classified as held-for-sale, which are recognised at fair value less costs to sell.
Adjustments are made when necessary to the Group annual financial statements of subsidiaries to bring their accounting policies in line with those of the Group.
All intra-group transactions, balances, income and expenses are eliminated in full on consolidation.
Transactions which result in changes in ownership levels, where the Group has control of the subsidiary both before and after the transaction are regarded as equity transactions and are recognised directly in the statement of changes in equity.
Investment in subsidiaries and controlled trust
Group and Company annual financial statementsThe Group annual financial statements include those of the holding company and its subsidiaries. The results of the subsidiary are included from the date control of the subsidiary is obtained (i.e. effective date of acquisition) until the date that control of the subsidiary is lost (i.e. disposal date).
Company annual financial statementsIn the Company’s separate annual financial statements, investment in subsidiary is carried at cost less any accumulated impairment.
1.3 Financial Instruments
1.3.1 Initial recognition
Financial instruments are recognised on the statements of financial position when the group becomes a party to the contractual provisions of the instrument. Initial measurement is at fair value which includes transaction costs.
The group’s financial instruments recognised on the statements of financial position include trade and other receivables, cash and cash equivalents, loans to and from group companies, long term borrowings and trade and other payables.
1.3.2 Classification
The group classifies its financial assets as loans and receivables and financial liabilities as financial liabilities at amortised cost.
The classification depends on the purpose for which the assets were acquired and takes place at initial recognition.
1.3.3 Subsequent measurement
Loans and receivables are subsequently measured at amortised costs, using the effective interest rate method, less accumulated impairment losses.
Financial liabilities at amortised costs are subsequently measured at amortised cost, using the effective interest rate method.
Trade and other receivables
Trade and other receivables are classified as loans and receivables.
Trade and other receivables are non-derivative financial assets with fixed or determinable payments that are not quoted in an active market. After initial measurement loans and receivables are carried at amortised cost using the effective interest method less any allowance for impairment.
Appropriate allowances for estimated irrecoverable amounts are recognised in profit or loss in the statement of comprehensive income when there is objective evidence that the asset is impaired. Significant financial difficulties of the debtor, probability that the debtor will enter bankruptcy or financial reorganisation, and default or delinquency in payments are considered objective indicators that the trade receivable is impaired. The allowance recognised is measured as the difference between the asset’s carrying amount and the present value of estimated future cash flows discounted at the effective interest rate computed at initial recognition.

30
OR
ION
RE
AL
EST
ATE
LTD
A
NN
UA
L R
EP
OR
T 2
015
The carrying amount of the asset is reduced through the use of an allowance account, and the amount of the loss is recognised in profit or loss in the statement of comprehensive income within operating expenses. When a trade receivable is uncollectible, it is written off against the allowance account for trade receivables. Subsequent recoveries of amounts previously written off are credited against operations expenses in profit or loss in the statement of comprehensive income.
Cash and cash equivalents
Cash and cash equivalents are classified as loans and receivables. Cash and cash equivalents comprise cash on hand, demand deposits and other short-term investments that are readily convertible to a known amount of cash and are subject to insignificant risk of changes in value. These are initially measured at fair value, and are subsequently measured at amortised cost.
Trade and other payables
Trade and other payables are classified as fair value at amortised cost and are initially measured at fair value and are subsequently measured at amortised cost, using the effective interest method.
Bank overdrafts and borrowings
Bank overdrafts and borrowings are classified as financial liabilities at amortised cost. Bank overdrafts and borrowings are initially measured at fair value and subsequently measured at amortised cost, using the effective interest rate method. Bank overdrafts and borrowings are classified as current liabilities unless the company has an unconditional right to defer settlement of the liability for at least 12 months after the statement of financial position date.
Linked debenture instruments
Compulsory redeemable debentures are compound instruments, consisting of a liability component and an equity component. At the date of issue, the fair value of the liability component is estimated using the prevailing market interest rate for similar non-convertible debt. The difference between the proceeds of issue of the redeemable instruments and the fair value assigned to the liability component is included in equity.
Combined units are compound instruments, consisting of a debenture (liability) component and a share (equity) component. The debentures are carried at amortised cost using the effective interest rate method.
Issue costs are apportioned between the liability and equity components of the compound instruments based on their relative carrying amounts at the date of issue. The portion relating to the equity component is charged directly against equity. During the current year the group converted to a REIT and all debentures were delinked.
Loans from shareholders and directors
These financial liabilities are classified as loans and receivables measured at amortised cost.
Loans to/(from) group companies and related parties
These include loans to and from subsidiaries and related parties.
Loans to group companies and related parties are classified as loans and receivables.
Loans from group companies and related parties are classified as financial liabilities measured at amortised cost.
1.3.4 Impairment of financial assets
At each reporting date the group assesses all financial assets to determine whether there is objective evidence that a financial asset or group of financial assets has been impaired. For amounts due to the group: Significant financial difficulties of the debtor, probability that the debtor will enter bankruptcy and default of payments are all considered indicators of impairment.
Impairment losses are recognised in profit or loss.
Impairment losses are reversed when an increase in the financial asset’s recoverable amount can be related objectively to an event occurring after the impairment was recognised, subject to the restriction that the carrying amount of the financial asset at the date that the impairment is reversed shall not exceed what the carrying amount would have been had the impairment not been recognised.
Reversals of impairment losses are recognised in profit or loss. Where financial assets are impaired through use of an allowance account, the amount of the loss is recognised in profit or loss within operating expenses. When such assets are written off, the write off is made against the relevant allowance account. Subsequent recoveries of amounts previously written off are credited against operating expenses.
1.3.5 Derecognition
The derecognition of a financial instrument occurs when the group no longer controls the contractual rights or the obligation has been extinguished, which is normally the case when the instrument is sold, or all the cash flows attributable to the instrument are passed through an independent third party. Any profit or loss on derecognition is recognised in profit or loss.
1.4 Investment property
Property that is held for long-term rental yields or for capital appreciation or both, and that is not occupied by the companies in the consolidated group, is classified as investment property.
Investment property is recognised as an asset when, and only when, it is probable that the future economic benefits that are associated with the investment property will flow to the enterprise, and the cost of the investment property can be measured reliably.
Investment property consists of land and buildings as well as vacant land held to for capital appreciation. Properties are stated at cost on acquisition and subsequent additions that enhance the value of the property are capitalised.
Investment property is measured initially at cost, including related transaction costs.
31
OR
ION
RE
AL E
STATE LTD
A
NN
UA
L RE
PO
RT 2
015
Investment property is maintained, upgraded and refurbished where necessary, in order to preserve or improve the capital value as far as is possible to do so. Maintenance and repairs which neither materially add to the value of the properties nor prolong their useful lives are charged to profit or loss during the financial period in which they are incurred.
Subsequent to initial measurement investment property is measured at fair value, adjusted for the straight-line lease income adjustment. A gain or loss arising from a change in fair value is included in net profit or loss for the period in which it arises.
Independent valuations are obtained on a rotational basis, ensuring that every property is independently valued every three years. Valuations are performed as at the financial position date by professional valuators who hold recognised and relevant professional qualifications and have received experience in the location and category of the investment property being valued. The directors value the remaining properties annually, using the capitalisation of net income method and taking into account the effects of lease smoothing in terms of IAS 40. This method takes net rentals and capitalises them at a rate which is consistent with comparable market transactions. The capitalisation rates reflect the risks inherent in the net cash flows and are constantly monitored by reference to comparable market transactions.
The gross value of investment property is adjusted with the fair value adjustment in profit or loss.
The fair value of investment property reflects, among other things, the assumptions about rental income from future leases in the light of current market conditions. The fair value also reflects, on a similar basis, any cash outflows that could be expected in respect of the property. Some of those outflows are recognised as a liability, including finance lease liabilities in respect of leasehold land classified as investment property; others, including contingent rent payments, are not recognised in the financial statements. Subsequent expenditure is capitalised to the asset’s carrying amount only when it is probable that future economic benefits associated with the expenditure will flow to the Group and the cost of the item can be measured reliably. When part of an investment property is replaced, the replacement part is recognised in the carrying amount of the investment property and the carrying amount of the replaced part is derecognised.
Investment properties are derecognised either when they have been disposed of or when the investment property is permanently withdrawn from use and no future economic benefit is expected from its disposal.
On disposal of investment properties, the difference between the net disposal proceeds and the fair value at the date of the last valuation is charged or credited to profit or loss.
1.5 Tenant deposits
Deposits from tenants are received as a guarantee for returning the property at the end of the lease term in a specified good condition or for the lease payments for a period ranging from
1 to 12 months. Such deposits are initially and subsequently recognised at fair value. (refer to note 1.7 for the recognition of rental income).
1.6 Leases
A lease is classified as a finance lease if it transfers substantially all the risks and rewards incidental to ownership. A lease is classified as an operating lease if it does not transfer substantially all the risks and rewards incidental to ownership.
Finance leases – lessee
Finance leases are recognised as assets and liabilities in the statement of financial position at amounts equal to the fair value of the leased asset or, if lower, the present value of the minimum lease payments. The liability to the lessor is included in the statement of financial position as a finance lease obligation.
The discount rate used in calculating the present value of the minimum lease payments is the company’s incremental borrowing rate.
The lease payments are apportioned between the finance charge and reduction of the outstanding liability. The finance charge is allocated to each period during the lease term so as to produce a constant periodic rate on the remaining balance of the liability.
Operating leases – lessor
Operating lease income is recognised as an income on a straight-line basis over the lease term. The difference between the amount recognised as income and the contractual payments is recognised as an operating lease accrual. The accrual is not discounted.
Initial direct costs incurred in negotiating and arranging operating leases are added to the carrying amount of the leased asset and recognised as an expense over the lease term on the same basis as the lease income.
Income for leases is disclosed under revenue in profit or loss.
Properties leased out under operating leases are included in investment property in the statement of financial position. Refer to note 1.7 for the recognition of rental income.
Operating leases – lessee
Operating lease payments are recognised as an expense on a straight-line basis over the lease term. The difference between amounts recognised as an expense and the contracted payments are recognised as an operating lease asset. The asset in not discounted. Any contingent rents are expensed in the period they are incurred.
1.7 Revenue
Revenue from the letting of investment property comprises gross rental income. Recoveries of municipal charges are classified as revenue as the company acts as principal in these transactions.
Revenue comprises the fair value of the consideration received or receivable for the services in the ordinary course of the

32
OR
ION
RE
AL
EST
ATE
LTD
A
NN
UA
L R
EP
OR
T 2
015
group’s activities. Revenue is shown net of value-added tax, after eliminating sales within the group. The group recognises revenue when the amount of revenue can be reliably measured, it is probable that future economic benefits will flow to the entity and when specific criteria have been met for each of the group’s activities. The group bases its estimates on historical results, taking into consideration the type of customer, the type of transaction and the specifics of each arrangement.
Rental income from operating leases is recognised in accordance with the lease policy.
Service and management charges are recognised in the accounting period in which the services are rendered.
1.8 Income TaxIncome tax expenses
Tax expense comprises current and deferred tax.
Current and deferred taxes are recognised as income or an expense and included in profit or loss for the period, except to the extent that the tax arises from a transaction recognised in other comprehensive income.
Current income tax assets and liabilities
Current income tax for current and prior periods is, to the extent unpaid, recognised as a liability. If the amount already paid in respect of current and prior periods exceeds the amount due for those periods, the excess is recognised as an asset.
Current income tax liabilities (assets) for the current and prior periods are measured at the amount expected to be paid to (recovered from) the tax authorities, using the tax rates (and tax laws) that have been enacted or substantively enacted by the end of the reporting period.
Management periodically evaluates positions taken in tax returns with respect to situations in which applicable tax regulation is subject to interpretation. It establishes provisions where appropriate on the basis of amounts expected to be paid to the tax authorities.
Deferred income tax assets and liabilities
A deferred tax liability is recognised for all taxable temporary differences, except to the extent that the deferred tax liability arises from the initial recognition of an asset or liability in a transaction which at the time of the transaction, affects neither accounting profit nor taxable profit (tax loss).
A deferred tax asset is recognised for all deductible temporary differences to the extent that it is probable that taxable profit will be available against which the deductible temporary difference can be utilised. A deferred tax asset is not recognised when it arises from the initial recognition of an asset or liability in a transaction at the time of the transaction, affects neither accounting profit nor taxable profit (tax loss).
A deferred tax asset is recognised for the carry forward of unused tax losses to the extent that it is probable that future
taxable profit will be available against which the unused tax losses can be utilised.
Deferred tax assets and liabilities are measured at the tax rates that are expected to apply to the period when the asset is realised or the liability is settled, based on tax rates (and tax laws) that have been enacted or substantively enacted by the end of the reporting period.
Deferred income tax assets and liabilities are offset when there is a legally enforceable right to offset current tax assets against current tax liabilities and when the deferred income taxes assets and liabilities relate to income taxes levied by the same taxation authority on either the same taxable entity or different taxable entities where there is an intention to settle the balances on a net basis.
1.9 Property, plant and equipment
All property, plant and equipment is stated at historical cost less accumulated depreciation and any accumulated impairment losses. Historical cost includes expenditure that is directly attributable to the acquisition of the items.
The cost of an item of property, plant and equipment is recognised as an asset when:
• itisprobablethatfutureeconomicbenefitsassociatedwiththe item will flow to the company; and
• thecostoftheitemcanbemeasuredreliably.
Property, plant and equipment is initially measured at cost.
Costs include costs incurred initially to acquire or construct an item of property, plant and equipment and costs incurred subsequently to add to, replace part of, or service it. If a replacement cost is recognised in the carrying amount of an item of property, plant and equipment, the carrying amount of the replaced part is derecognised.
Subsequent costs are included in the asset’s carrying amount or recognised as a separate asset, as appropriate, only when it is probable that future economic benefits associated with the item will flow to the Group and the cost of the item can be measured reliably. Repairs and maintenance are charged to the statement of comprehensive income during the financial period in which they are incurred.
Depreciation is calculated on the straight-line basis over their useful lives to their estimated residual values.
The useful lives of property, plant and equipment have been assessed as follows:
Item Average useful life
Fittings 5 yearsComputer equipment 3 years Furniture 6 yearsMotor vehicles 5 yearsParking equipment 5 years

33
OR
ION
RE
AL E
STATE LTD
A
NN
UA
L RE
PO
RT 2
015
The depreciation charge for each period is recognised in profit or loss. The residual value, useful life and depreciation method of each asset are reviewed at the end of each reporting period. If the expectations differ from previous estimates, the change is accounted for as a change in accounting estimate.
The gain or loss arising from the derecognition of an item of property, plant and equipment is included in profit or loss when the item is derecognised. The gain or loss arising from the recognition of an item of property, plant and equipment is determined as the difference between net disposal proceeds, if any, and the carrying amount of the item.
1.10 Impairment of Non-Financial Assets
The group assesses at each end of the reporting period whether there is any indication that an asset may be impaired. If there is any indication that an asset may be impaired, the recoverable amount is estimated for the individual asset.
The recoverable amount of an asset is the higher of its fair value less costs to sell and its value in use. In assessing value in use, the estimated future cash flows are discounted to their present value using a pre-tax discount rate that reflects current market assessments of the time value of money and the risks specific to the asset. In determining fair value less costs to sell, an appropriate valuation model is used.
If the recoverable amount of an asset is less than its carrying amount, the carrying amount of the asset is reduced to its recoverable amount. That reduction is an impairment loss.
An entity assesses at each reporting date whether there is any indication that an impairment loss recognised in prior periods may no longer exist or may have decreased. If any such indication exists, the recoverable amounts of those assets are estimated.
1.11 Segment Reporting
An operating segment is a component of the group that engages in business activities whose operating results are regularly reviewed by the group’s decision makers. These results are utilised to assess the segment’s performance and facilitate decisions regarding resource allocation. The core business of the group is property rental, which is reported into segments based on the nature and business functions of the tenants for JSE reporting purposes.
The following segments are listed in this report:
– commercial, industrial, retail, hospitality and residential
The individual locations are listed in note 27. The measurement policies the group uses for segment reporting under IFRS 8 are the same as those used in its financial statements.
1.12 Related parties
Related parties mostly consist of other entities controlled by directors of this group. Refer to note 30 where detailed disclosure regarding related party balances and transactions are presented. Key management consist of members of the board of directors.
1.13 Share capital and equity
Ordinary shares and Treasury shares are classified as equity. An equity instrument is any contract that evidences a residual interest in the assets of an entity after deducting all of its liabilities.
Incremental costs directly attributable to the issue of new shares (or options) are shown in equity from the proceeds.
1.14 Non-current assets held for sale
Non-current assets are classified as held for sale if their carrying amount will be recovered through a sale transaction rather than through continuing use. This condition is regarded as met only when the sale is highly probable and the asset is available for immediate sale in its present condition. Management must be committed to the sale, which should be expected to qualify for recognition as a completed sale within one year from the date of classification.
Investment properties are not depreciated (or amortised) while it is classified as held for sale, or while it is part of a disposal group classified as held for sale. Assets classified as held for sale are held at fair value less cost to sell.
1.15 Employee benefitsShort-term benefits
The cost of short-term employee benefits are recognised in the period in which the service is rendered and are not discounted.
The expected cost of compensated absences is recognised as an expense as the employees render services that increase their entitlement or, in the case of non-accumulating absences, when the absence occurs. The expected cost of profit-sharing and bonus payments is recognised as an expense when there is a legal or contractual obligation to make such payments as a result of past performance.
1.16 Significant judgements and key sources of estimation uncertainty
In preparing the Group financial statements, management is required to make estimates and assumptions affecting the amounts represented in the financial statements and related disclosures.Useofavailable informationand theapplicationofjudgement is inherent in the formation of estimates. Actual results in the future could differ from these estimates which may be material to the financial statements. Significant judgments include:
1.16.1 Trade receivables and loans and receivables
The group and company assess its trade receivables and loans and receivables for impairment at each reporting date. In determining whether an impairment loss should be recorded in the statement of comprehensive income, the group makes judgements as to whether there is observable data indicating a measurable decrease in the estimated future cash flows from a financial asset.
The impairment is recognised when there is a material difference between the asset’s carrying amount and the present value of estimated future cash flows discounted at the effective interest rate computed at initial recognition.

34
OR
ION
RE
AL
EST
ATE
LTD
A
NN
UA
L R
EP
OR
T 2
015
Where discounting of trade receivables are applied, the group makes judgements of possible future cash flows over the term the debtor are expected to repay in full discounted at a market related interest rate.
The impairment for trade receivables and loans and receivables is calculated on a case by case basis, based on known factors relating to the specific item. (Note 7)
1.16.2 Fair value estimation
The fair value of financial instruments that are not traded in an active market is determined by using valuation techniques. The group uses a variety of methods and makes assumptions that are based on market conditions existing at each reporting date. Quoted market prices or dealer quotes for similar instruments are used for long-term debt. Other techniques, such as estimated discounted cash flows, are used to determine fair value for the remaining financial instruments.
1.16.3 Impairment testing
The recoverable amounts of individual assets have been determined based on the higher of value-in-use calculations and fair values less cost to sell. These calculations require the use of estimates and assumptions.
The group reviews and tests the carrying value of assets when events or changes in circumstances suggest that the carrying amount may not be recoverable. Assets are grouped at the lowest level for which identifiable cash flows are largely independent of cash flows of other assets and liabilities. If there are indications that impairment may have occurred, estimates are prepared of expected future cash flows for each group of assets. Expected future cash flows used to determine the value in use of tangible assets are inherently uncertain and could materially change over time. (Note 4)
1.16.4 Investment property
A Third of all properties are externally valued each year on a rotational basis. The calculation of the market values of the properties has been based on the net income capitalisation method, making use of market rental rates and capitalisation rates. Other aspects that are considered by the external valuator includes:
• Natureoftheproperty• Forwardrentandearningcapability• Exposuretofutureexpensesandpropertyrisk• Tenancyincomecapability• Propertyexpenditure• Locality• Thecurrenteconomy• Riskprofile
The value thus indicates the fair market values for the properties.
Where a property is already sectionalised, the direct comparable sales method was used by the directors whereby the subject sections was compared with registered sales in the area to determine the market value. The vacant land has been valued
by the directors on the “Direct comparison basis”, taking into account the size of the land as well as the physical attributes of the property including all topographical characteristics of the land, structures if any on the land as well as the location of the property. Refer to note 3 for detailed disclosure on fair value assumptions.
Property acquisitions which, in the opinion of the directors, meet the definition of a business, as defined in IFRS 3, are recognised and measured in accordance with that Standard. An acquisition is deemed to be a business if it comprises the acquisition of an integrated set of activities and assets that are capable of being conducted and managed for the purpose of providing a return, lower costs or other economic benefits directly to investors. Property acquisitions which do not meet the definition of a business, as defined in IFRS 3, are recognised and measured as the acquisition of an investment property in accordance with IAS 40.
In terms of IAS 40, consideration has been given to whether Orion House should be classified as being owner-occupied. However, due to the immaterial percentage occupation by group companies, the main use of the property results in the treatment as investment property with revaluation under IAS 40.
1.16.5 Linked debenture instruments
During the current year the group converted to a REIT and all linked debenture instruments were delinked and reclassified as share capital. In the prior year, the group shares were traded as linked units on the JSE Ltd’s main board. A linked unit consist of 1 ordinary share with a par value of 1 cent and 1 debenture with a par value of 1 cent. On initial recognition the par value of the shares and the debentures are allocated as appropriate. The premium is allocated between a debenture liability and equity by first determining the value of the liability and the residual balance of the premium is allocated to share premium. The liability was calculated by present valuing the future expected cash flows over the life of the debenture. Subsequent to initial measurement the debentures were amortised over the life of the debenture. Judgement was used by the directors on the predicted profit distributions for these debentures, the directors have assumed an average growth rate of 14% to calculate the future distributions to the debenture holders, present valued and recorded as a liability. (Note 10)
1.16.6 Taxation
Judgement is required in determining the provision for income taxes due to the complexity of legislation. There are many transactions and calculations for which the ultimate tax determination is uncertain during the ordinary course of business. The group recognises liabilities for anticipated tax audit issues based on estimates of whether additional taxes will be due. Where the final tax outcome of these matters is different from the amounts that were initially recorded, such differences will impact the income tax and deferred tax provisions in the period in which such determination is made.
The group recognises the net future tax benefit related to deferred income tax assets to the extent that it is probable

35
OR
ION
RE
AL E
STATE LTD
A
NN
UA
L RE
PO
RT 2
015
that the deductible temporary differences will reverse in the foreseeable future. Assessing the recoverability of deferred income tax assets requires the group to make significant estimates related to expectations of future taxable income. Estimates of future taxable income are based on forecast cash flows from operations and the application of existing tax laws in each jurisdiction. To the extent that future cash flows and taxable income differ significantly from estimates, the ability of the company to realise the net deferred tax assets recorded at the end of the reporting period could be impacted. (Note 16)
1.16.7 Statement of Comprehensive Income
The presentation format of the statement of comprehensive income is a mixture of both nature and function which in the opinion of the directors, provides the reader with a comprehensive understanding of the operations of the group. A detailed analysis of expenses by nature is included in Note 20.
2. New Standards and Interpretations 2.1 Standards and Interpretations effective and
adopted in the current year
In the current year, the group has adopted the following standards and interpretations that are effective for the current financial year and that are relevant to its operations:
IFRS 7 (Amendment): Financial Instruments: Disclosures – Offsetting of Financial Assets and Financial LiabilitiesThe amended disclosures requires more extensive disclosures than are currently required under IFRS. The disclosures focus on quantitative information about recognised financial instruments that are offset in the statement of financial position, as well as those recognised financial instruments that are subject to master netting or similar arrangements irrespective of whether they are offset.
The effective date of the amendment is for years beginning on or after 1 January 2013. The group has adopted the standard in the consolidated annual financial statements. The amendment did not have a material impact on the group’s financial statements.
IFRS 12 – Disclosures of interests in other entities The standard sets out disclosure requirements for investments in Subsidiaries, associates, joint ventures and unconsolidated structured entities. The disclosures are aimed to provide information about the significance and exposure to risks of such interests. The effective date of the amendment is for years beginning on or after 1 January 2013. The group has adopted the standard in the consolidated annual financial statements. The amendment did not have a material impact on the group’s financial statements.
IFRS 13 Fair Value Measurement New standard setting out guidance on the measurement and disclosure of items measured at fair value or required to be disclosed at fair value in terms of other IFRS’s.
IFRS 13 does not change when an entity is required to use fair value, but rather provides guidance on how to measure fair value under IFRS. IFRS 13 defines fair value as an exit price. As a result of the guidance in IFRS 13, the group reassessed its policies for measuring fair values.
The effective date of the standard is for years beginning on or after 01 January 2013. The adoption of this standard has not had a material impact on the results of the company, but has resulted in more disclosure than would have previously been provided in the annual financial statements, refer to note 3.
IAS 32 (Amendment) Offsetting of Financial Assets and Financial LiabilitiesThe application guidance of IAS 32 has been amended to clarify some of the requirements for offsetting financial assets and financial liabilities on the statement of financial position. The amendments do not change the current offsetting model in IAS 32, but clarify that the right of set-off must be available today – that is, it is not contingent on a future event. It also must be legally enforceable for all counterparties in the normal course of business, as well as in the event of default, insolvency or bankruptcy. The amendments also clarify that gross settlement mechanisms (such as through a clearing house) with features that both (i) eliminate credit and liquidity risk and (ii) process receivables and payables in a single settlement process, are effectively equivalent to net settlement; they would therefore satisfy the IAS 32 criterion in these instances. Master netting agreements where the legal right of offset is only enforceable on the occurrence of some future event, such as default of the counterparty, continue not to meet the offsetting requirements.
The effective date of the amendment is for years beginning on or after 1 January 2014. The group has adopted the standard in the consolidated annual financial statements. The amendment did not have a material impact on the group’s financial statements.
IAS 24 – Annual improvements for 2010 – 2012 cycle 01 July 2014Amendments to the definitions and disclosure requirements for key management personnel.
The effective date of the amendment is for years beginning on or after 1 July 2014. The group has adopted the standard in the consolidated annual financial statements. The amendment did not have a material impact on the group’s financial statements.
IAS 40 – Investment Property Annual Improvements 2011 – 2013 Cycle: Amendments to clarify the interrelationship between IFRS 3 and IAS 40 when classifying property as investment property or owner occupied property.
The effective date of the amendment is for years beginning on or after 1 July 2014. The group has adopted the standard in the consolidated annual financial statements. The amendment did not have a material impact on the group’s financial statements.
36
OR
ION
RE
AL
EST
ATE
LTD
A
NN
UA
L R
EP
OR
T 2
015
2.2 Standards and interpretations not yet effective
The group has chosen not to early adopt the following standards and interpretations, which have been published and are mandatory for the group’s accounting periods beginning on or after 1 July 2015 or later periods:
IFRS 9 Financial Instruments: Classification and MeasurementNew standard that replaces IAS 39 Financial Instruments: Recognition and Measurement. Classification and measurement requirements now driven by cash flow characteristics and business models. Only three classes of financial instruments: amortised cost, fair value through profit or loss and fair value through other comprehensive income. Expected loss impairment model now required and hedge accounting is more aligned with risk management activities.
Amendments:
- fair value adjustments to investments in equity instruments through a contingent consideration on a business combination may not be presented through Other Comprehensive Income.
- financial liabilities raised due to contingent considerations in business combinations are subsequently measured at fair value through profit and loss.
The effective date of the amendment is for years beginning on or after 01 January 2018. The group expects to adopt the standard when it becomes applicable. The impact of this standard is currently being assessed.
IFRS 15 Revenue from contracts with customersIFRS 15 establishes a single, comprehensive framework for determining when to recognise revenue and the amount of revenue to be recognised. The standard incorporates a five step process to recognise revenue, which is based on the core principle that an entity recognises revenue to depict the transfer of promised goods or services to the customer in an amount that reflects the consideration to which the company expects to be entitled in exchange for those goods or services.
IFRS 15 replaces the previous revenue standards IAS 18 Revenue and IAS 11 Construction Contracts and the related interpretations IFRIC 13 Customer Loyalty Programmes, IFRIC 15 Agreements for the Construction of Real Estate, IFRIC 18 Transfers of Assets from Customers and SIC-31 Revenue –Barter Transactions Involving Advertising Services.
The new standard:
- improves the comparability of revenue from contracts with customers,
- reduces the need for interpretive guidance to address emerging revenue recognition issues, and
- provides more useful information through improved disclosure requirements.
The Group is in the process of assessing the impact of the new standard on its revenue recognition and measurement. The group expects the adoption of the new standard to result in additional disclosure.
The group will adopt the new standard on its mandatory effective date which is for years beginning on or after 1 January 2018.
IAS 1 – Presentation of Financial StatementsDisclosure Initiative: Amendments designed to encourage entities to apply professional judgement in determining what information to disclose in their financial statements.
For example, the amendments make clear that materiality applies to the whole of financial statements and that the inclusion of immaterial information can inhibit the usefulness of financial disclosures. Furthermore, the amendments clarify that entities should use professional judgement in determining where and in what order information is presented in the financial disclosures.
The effective date of the amendment is beginning on or after 01 January 2016. The group expects to adopt the standard when it becomes applicable. The impact of this standard is currently being assessed.
IAS 16 – Property, Plant and EquipmentAmendments to IAS 16 and IAS 38 to clarify the basis for the calculation of depreciation and amortisation, as being the expected pattern of consumption of the future economic benefits of an asset.
Amendment to both IAS 16 and IAS 38 establishing the principle for the basis of depreciation and amortisation as being the expected pattern of consumption of the future economic benefits of an asset. Clarifying that revenue is generally presumed to be an inappropriate basis for measuring the consumption of economic benefits in such assets.
Amendments to IAS 16 and IAS 41 which defines bearer plants and includes bearer plants in the scope of IAS 16 Property, plant and Equipment, rather than IAS 41 allowing such assets to be accounted for after initial recognition in accordance with IAS 16.
The effective date of the amendment is beginning on or after 01 January 2016. The group expects to adopt the standard when it becomes applicable. The impact of this standard is currently being assessed.
IAS 27 – Consolidated and Separate Financial StatementsAmendments to IAS 27 will allow entities to use the equity method to account for investments in subsidiaries, joint ventures and associates in their separate financial statements.
The effective date of the amendment is beginning on or after 01 January 2016. The group expects to adopt the standard when it becomes applicable. The impact of this standard is currently being assessed.

37
OR
ION
RE
AL E
STATE LTD
A
NN
UA
L RE
PO
RT 2
015
3. Investment properties
Figures in Rand
Group Company
2015Restated
2014Restated
2013 2015Restated
2014Restated
2013
Net carrying value
Cost 760 267 664 733 360 870 683 885 031 51 477 989 50 178 810 33 000 000
Fair value surplus 13 372 211 38 816 938 40 763 417 (1 608 682) 1 115 710 7 678 810
773 639 875 772 177 808 724 648 448 49 869 307 51 294 520 40 678 810
Movement for the year
Investment property at the beginning of the year 772 177 808 724 648 353 686 239 623 51 294 520 40 678 810 33 000 000
Disposals at fair value (22 956 022) (27 537 483) – – – –
Fair value adjustment 13 372 211 38 816 938 40 763 417 (1 608 682) 1 115 710 7 678 810
Capitalised costs – 2 100 000 12 295 408 – – –
Additions – 9 500 000 – – 9 500 000 –
Transferred from investment property reclassified as held for sale – 24 650 000 10 000 000 – – –
Transferred to investment property reclassified as held for sale – – (24 650 000) – – –
762 593 997 772 177 808 724 648 448 49 685 838 51 294 520 40 678 810
Reconciliation to valuation
Investment property carrying amount 762 593 997 772 177 808 724 648 448 49 685 838 51 294 520 40 678 810
Straight-line rental income accrual - (note 6) 9 421 614 11 045 878 9 175 070 756 192 183 469 78 931
Total investment property 772 015 611 783 223 686 733 823 518 50 442 030 51 477 989 40 757 741
Disclosure on investment properties previously reportedIn prior years the disclosure on the Statement of financial position indicated the reconciliation from Gross Investment properties to Net Investment properties and the Straight-line lease asset was shown separately and split between the long term and short term portion. There was also a calculation error on the fair value adjustment on properties in 2014 and has been adjusted for accordingly. Refer to note 35.
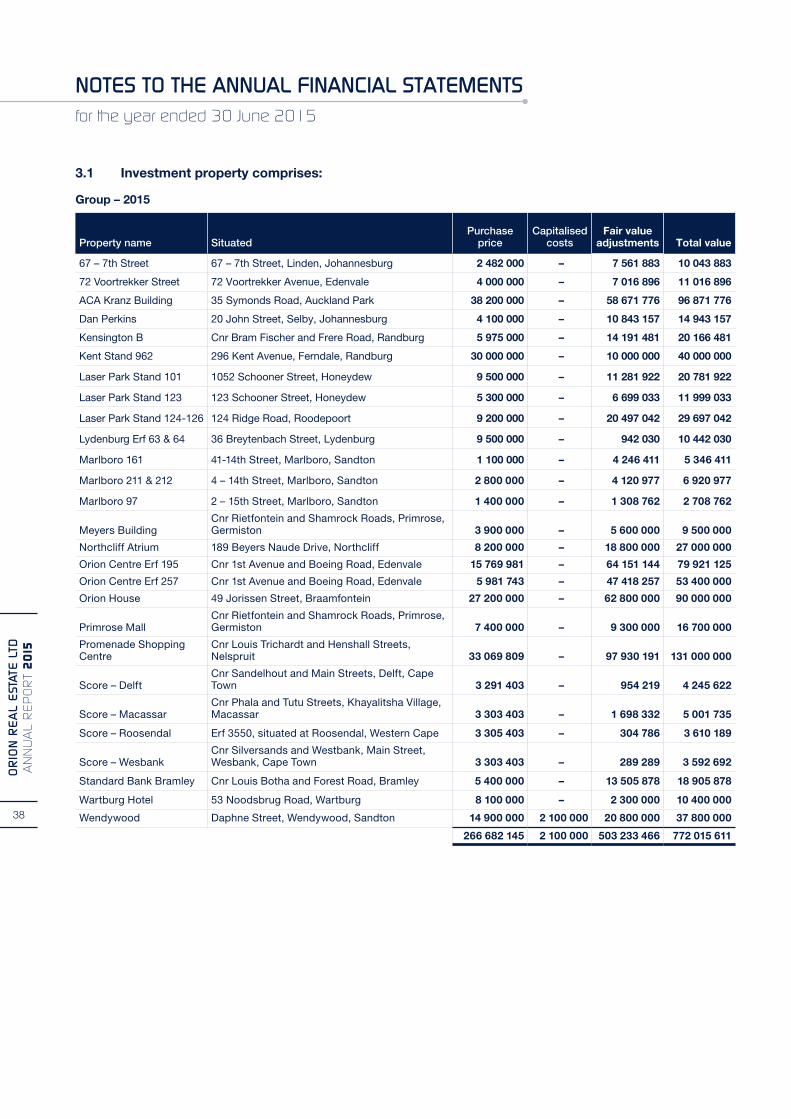
38
OR
ION
RE
AL
EST
ATE
LTD
A
NN
UA
L R
EP
OR
T 2
015
3.1 Investment property comprises:
Group – 2015
Property name SituatedPurchase
priceCapitalised
costsFair value
adjustments Total value
67 – 7th Street 67 – 7th Street, Linden, Johannesburg 2 482 000 – 7 561 883 10 043 883
72 Voortrekker Street 72 Voortrekker Avenue, Edenvale 4 000 000 – 7 016 896 11 016 896
ACA Kranz Building 35 Symonds Road, Auckland Park 38 200 000 – 58 671 776 96 871 776
Dan Perkins 20 John Street, Selby, Johannesburg 4 100 000 – 10 843 157 14 943 157
Kensington B Cnr Bram Fischer and Frere Road, Randburg 5 975 000 – 14 191 481 20 166 481
Kent Stand 962 296 Kent Avenue, Ferndale, Randburg 30 000 000 – 10 000 000 40 000 000
Laser Park Stand 101 1052 Schooner Street, Honeydew 9 500 000 – 11 281 922 20 781 922
Laser Park Stand 123 123 Schooner Street, Honeydew 5 300 000 – 6 699 033 11 999 033
Laser Park Stand 124-126 124 Ridge Road, Roodepoort 9 200 000 – 20 497 042 29 697 042
Lydenburg Erf 63 & 64 36 Breytenbach Street, Lydenburg 9 500 000 – 942 030 10 442 030
Marlboro 161 41-14th Street, Marlboro, Sandton 1 100 000 – 4 246 411 5 346 411
Marlboro 211 & 212 4 – 14th Street, Marlboro, Sandton 2 800 000 – 4 120 977 6 920 977
Marlboro 97 2 – 15th Street, Marlboro, Sandton 1 400 000 – 1 308 762 2 708 762
Meyers BuildingCnr Rietfontein and Shamrock Roads, Primrose, Germiston 3 900 000 – 5 600 000 9 500 000
Northcliff Atrium 189 Beyers Naude Drive, Northcliff 8 200 000 – 18 800 000 27 000 000
Orion Centre Erf 195 Cnr 1st Avenue and Boeing Road, Edenvale 15 769 981 – 64 151 144 79 921 125
Orion Centre Erf 257 Cnr 1st Avenue and Boeing Road, Edenvale 5 981 743 – 47 418 257 53 400 000
Orion House 49 Jorissen Street, Braamfontein 27 200 000 – 62 800 000 90 000 000
Primrose MallCnr Rietfontein and Shamrock Roads, Primrose, Germiston 7 400 000 – 9 300 000 16 700 000
Promenade Shopping Centre
Cnr Louis Trichardt and Henshall Streets, Nelspruit 33 069 809 – 97 930 191 131 000 000
Score – DelftCnr Sandelhout and Main Streets, Delft, Cape Town 3 291 403 – 954 219 4 245 622
Score – MacassarCnr Phala and Tutu Streets, Khayalitsha Village, Macassar 3 303 403 – 1 698 332 5 001 735
Score – Roosendal Erf 3550, situated at Roosendal, Western Cape 3 305 403 – 304 786 3 610 189
Score – WesbankCnr Silversands and Westbank, Main Street, Wesbank, Cape Town 3 303 403 – 289 289 3 592 692
Standard Bank Bramley Cnr Louis Botha and Forest Road, Bramley 5 400 000 – 13 505 878 18 905 878
Wartburg Hotel 53 Noodsbrug Road, Wartburg 8 100 000 – 2 300 000 10 400 000
Wendywood Daphne Street, Wendywood, Sandton 14 900 000 2 100 000 20 800 000 37 800 000
266 682 145 2 100 000 503 233 466 772 015 611

39
OR
ION
RE
AL E
STATE LTD
A
NN
UA
L RE
PO
RT 2
015
3.1 Investment property comprises (continued):
Group – 2014
Property name SituatedPurchase
priceCapitalised
costsFair value
adjustments Total value
67 – 7th Street 67 – 7th Street, Linden, Johannesburg 2 482 000 – 6 993 110 9 475 110
72 Voortrekker Street 72 Voortrekker Avenue, Edenvale 4 000 000 – 5 530 884 9 530 884
ACA Kranz Building 35 Symonds Road, Auckland Park 38 200 000 – 55 800 000 94 000 000
Dan Perkins 20 John Street, Selby, Johannesburg 4 100 000 – 10 200 000 14 300 000
Kensington B Cnr Bram Fischer and Frere Roads, Randburg 5 975 000 – 10 356 409 16 331 409
Kent Stand 962 296 Kent Avenue, Ferndale, Randburg 30 000 000 – 11 977 989 41 977 989
Laser Park Stand 101 1052 Schooner Street, Honeydew 9 500 000 – 11 000 000 20 500 000
Laser Park Stand 123 123 Schooner Street, Honeydew 5 300 000 – 5 900 000 11 200 000
Laser Park Stand 124–126 124 Ridge Road, Roodepoort 9 200 000 – 17 800 000 27 000 000
Lydenberg Erf 63 & 64 36 Breytenbach Street, Lydenberg 9 500 000 – – 9 500 000
Marlboro 142 (Sold in 2015) 7 – 5th Avenue, Marlboro, Sandton 1 100 000 – 1 565 300 2 665 300
Marlboro 161 41 – 14th Street, Marlboro, Sandton 1 100 000 – 5 442 543 6 542 543
Marlboro 211 & 212 4 – 14th Street, Marlboro, Sandton 2 800 000 – 3 165 770 5 965 770
Marlboro 97 2 – 15th Street, Marlboro, Sandton 1 400 000 – 2 069 550 3 469 550
Meyers Building Cnr Rietfontein and Shamrock Roads, Primrose, Germiston 3 900 000 – 5 386 140 9 286 140
Mountain View Shopping Centre (Sold in 2015) 10 Somerlust Street, Gordon’s Bay 10 000 000 12 295 407 (6 004 689) 16 290 718
Northcliff Atrium 189 Beyers Naude Drive, Northcliff 8 200 000 – 19 063 265 27 263 265
Orion House 49 Jorissen Street, Braamfontein 27 200 000 – 56 523 675 83 723 675
Primrose Mall Cnr Rietfontein and Shamrock Roads, Primrose, Germiston 7 400 000 – 4 147 530 11 547 530
Promenade Shopping Centre
Cnr Louis Trichardt and Henshall Streets, Nelspruit 33 069 809 – 109 338 094 142 407 903
Score – Delft Cnr Sandelhout and Main Street, Delft, Cape Town 3 291 403 – 1 408 597 4 700 000
Score – Macassar Cnr Phala and Tutu Street, Khayalitsha Village, Macassar 3 303 403 – 1 896 597 5 200 000
Score – Mfuleni (Sold in 2015)
Cnr Lukhanyo and Main Street, Mfuleni, Cape Town 3 301 403 – 698 597 4 000 000
Score – Roosendal Erf 3550, situated at Roosendal, Western Cape 3 305 403 – 594 597 3 900 000
Score – Wesbank Cnr Silversands and Westbank, Main Street, Wesbank, Cape Town 3 303 403 – 766 597 4 070 000
Standard Bank Bramley Cnr Louis Botha and Forest Roads, Bramley 5 400 000 – 13 600 000 19 000 000
Wartburg Hotel 53 Noodsbrug Road, Wartburg 8 100 000 – 1 600 000 9 700 000
Wendywood Daphne Street, Wendywood, Sandton 14 900 000 2 100 000 20 175 900 37 175 900
Orion Centre Erf 257 Cnr 1st Avenue and Boeing Road, Edenvale 5 981 743 – 47 418 257 53 400 000
Orion Centre Erf 195
Sections 1 and 2 and units 203, 204, 302, 1005, 1103, 1401, 1402, 1405, 1501, 1601, 1702, 1903, 1095, 2001, 2002, 2003 and 2005 of the Sectional Title scheme known as Orion Centre 15 769 981 – 63 330 019 79 100 000
259 331 824 14 395 407 376 996 455 650 723 686

40
OR
ION
RE
AL
EST
ATE
LTD
A
NN
UA
L R
EP
OR
T 2
015
3.1 Investment property comprises (continued):
Company – 2015
Property name Situated Purchase priceCapitalised
costsFair value
adjustments Total value
Kent Stand 962 296 Kent Avenue, Ferndale, Randburg 30 000 000 – 10 000 000 40 000 000
Lydenberg Erf 63 & 64 36 Breytenbach Street, Lydenburg 9 500 000 – 942 030 10 442 030
39 500 000 – 10 942 030 50 442 030
Company – 2014
Property name Situated Purchase priceCapitalised
costsFair value
adjustments Total value
Kent Stand 962 296 Kent Avenue, Ferndale, Randburg 30 000 000 – 11 977 989 41 977 989
Lydenberg Erf 63 & 64 36 Breytenbach Street, Lydenburg 9 500 000 – – 9 500 000
39 500 000 – 11 977 989 51 477 989
All properties were rental producing during the current year under review. Orion Centre Erf 195 is held under sectional title. Mountain View Shopping Centre, Marlboro 142 and Score - Mfuleni properties were sold during the year under review. Direct operating costs (including repairs and maintenance), relating to the investment properties are included in the profit or loss and are disclosed on the face of the statements of comprehensive income.
Details of valuation
Investment properties are valued by the directors on an annual basis. The properties are also valued, on a rotational basis, by external valuation experts on a three year cycle. The external valuer used was Bradley R Ryle M.I.V.(SA). Mr Ryle is not connected to the group or the company and has recent experience in location and category of the investment properties being valued at 30 June 2015 and holds a recognised relevant professional qualification. The effective date of external valuations was 1 July 2015.
The valuation of investment properties totalling R638 694 486 was based on the Net Income Capitalisation method. Orion Centre was valued using the Direct Comparable Sales method.
Assumptions used in valuations were based on current market conditions. Refer to note 1.18.5 - Significant judgements and sources of estimation uncertainty - Fair value of investment property for inputs and basis of valuation used. Valuations are considered to be level 3 on the fair value hierarchy as per IFRS 13. Level 3 valuations makes use of significant assumptions that are based on inputs that are not observable in the market and necessitates the use of internal information in situations in which there is little market activity.
There have been no movements of inputs between fair value hierarchy levels and no changes in the methods of valuation as mentioned in this note. Refer to note 38 for more detail on the fair value hierarchy.
Information about fair value measurements using significant unobservable inputs (Level 3).
External valuations
Property Valuation method Unobservable inputs Capitalisation rate
296 Kent Avenue
Meyers Building
Northcliff Atrium
Orion House
Primrose Mall
Promenade Shopping Centre
Wendywood Shopping Centre
Net Income Capitalisation
Net Income Capitalisation
Net Income Capitalisation
Net Income Capitalisation
Net Income Capitalisation
Net Income Capitalisation
Net Income Capitalisation
Capitalisation rate
Capitalisation rate
Capitalisation rate
Capitalisation rate
Capitalisation rate
Capitalisation rate
Capitalisation rate
11,0%
10,5%
10,5%
11,0%
10,5%
10,0%
10,5%

41
OR
ION
RE
AL E
STATE LTD
A
NN
UA
L RE
PO
RT 2
015
3.1 Investment property comprises (continued):
Information about fair value measurements using significant unobservable inputs (Level 3).
Internal valuations
Property Valuation method Unobservable inputs Capitalisation rate
Laser park properties
Wartburg property
ACA Kranz building
Dan Perkins
Orion Centre Erf 195
Orion Centre Erf 257
Standard Bank Bramley
Score Properties
Marlboro Properties
72 Voortrekker
67 7th Street Linden
Kensington B
Net Income Capitalisation
Net Income Capitalisation
Net Income Capitalisation
Net Income Capitalisation
Direct Comparable Sales
Direct Comparable Sales
Net Income Capitalisation
Net Income Capitalisation
Net Income Capitalisation
Net Income Capitalisation
Net Income Capitalisation
Net Income Capitalisation
Capitalisation rate
Capitalisation rate
Capitalisation rate
Capitalisation rate
Price per m²
Price per m²
Capitalisation rate
Capitalisation rate
Capitalisation rate
Capitalisation rate
Capitalisation rate
Capitalisation rate
10,0%
10,0%
10,0%
10,0%
5,0%
5,0%
10,0%
20,0%
10,0%
10,0%
10,0%
10,0%
The directors have fair valued the group and company`s investment property at 30 June 2015 based on a valuation carried out at that date by taking into account prevailing market rentals, occupation levels, property expenditure, expected rental income and capitalisation rates applied to the property portfolio between 5% (2014:9%) and 20% (2014:10.5%) with an average of 11% (2014: 10%).
The capitalisation percentage for each building was determined by evaluation of the type of building, the condition of the building and the locality of the property.
The capitalisation rate used for the Score properties is high as the area Delft, where the properties are located is a low income suburb consisting of government housing projects.
The director’s valuations are consistent when comparing to the calculations by the sworn independent appraiser’s referred to above. The investment properties are encumbered by mortgage bonds over the properties as detailed in note 12.
Summary of valuations: 2015 2014
Value of external valuations 352 000 000 350 070 000
Value of internal valuations 420 015 611 433 153 686
Total value of portfolio 772 015 611 783 223 686
Reconciliation summary of Level 3 fair value measurements 2015 2014
Opening balance – Properties at fair value (Level 3) 783 223 686 733 823 518
Level 3 fair value adjustment to investment properties 13 372 211 40 687 750
Additions, disposals and capitalisation of cost to investment property (22 956 022) 8 712 418
Closing balance – Properties at fair value (Level 3) 772 015 611 783 223 686
A 1% decrease in the capitalisation rates would increase the property valuation by R74,178,557 (company: R5,384,286) and a 1% increase in the capitalisation rates would decrease the property valuation by R51,140,003 (company: R4,393,066). Property valuations are extremely sensitive to changes in capitalisation rates used as can be seen from company sensitivity analysis. Higher rates will result in a decrease in property values and vice versa.

42
OR
ION
RE
AL
EST
ATE
LTD
A
NN
UA
L R
EP
OR
T 2
015
4. Property, plant and equipment
Group – 2015
Figures in Rand Total FittingsComputer
equipment FurnitureMotor
vehiclesParking
equipment
Cost 2 917 711 1 397 271 967 883 92 413 295 926 164 218
Accumulated depreciation (1 628 661) (576 144) (943 214) (28 802) (39 447) (41 054)
Carrying value at 30 June 2014 1 289 050 821 127 24 669 63 611 256 479 123 164
Opening carrying value at 1 July 2014 1 289 050 821 127 24 669 63 611 256 479 123 164
Additions 361 522 – – – 361 522 –
Depreciation (312 838) (175 177) (16 087) (13 335) (75 395) (32 844)
Closing carrying value at 30 June 2015 1 337 734 645 950 8 582 50 276 542 606 123 164
Cost 3 279 233 1 397 271 967 883 92 413 657 448 164 218
Accumulated depreciation (1 941 509) (751 321) (959 301) (42 137) (114 852) (73 898)
Carrying value at 30 June 2015 1 337 724 645 950 8 582 50 276 542 596 90 320
Group – 2014
Figures in Rand Total FittingsComputer
equipment FurnitureMotor
vehiclesParking
equipment
Cost 1 817 401 612 192 948 578 92 413 – 164 218
Accumulated depreciation (1 252 696) (417 928) (807 733) (18 824) – (8 211)
Carrying value at 30 June 2013 564 705 194 264 140 845 73 589 – 156 007
Opening carrying value at 1 July 2013 564 705 194 264 140 845 73 589 – 156 007
Additions 1 100 310 785 079 19 305 – 295 926 –
Depreciation (375 965) (158 216) (135 481) (9 978) (39 447) (32 843)
Closing carrying value at 30 June 2014 1 289 050 821 127 24 669 63 611 256 479 123 164
Cost 2 917 711 1 397 271 967 883 92 413 295 926 164 218
Accumulated depreciation (1 628 661) (576 144) (943 214) (28 802) (39 447) (41 054)Carrying value at 30 June 2014 1 289 050 821 127 24 669 63 611 256 479 123 164
Pledged as security:All motor vehicles and parking equipment is encumbered by borrowings as per note 12.
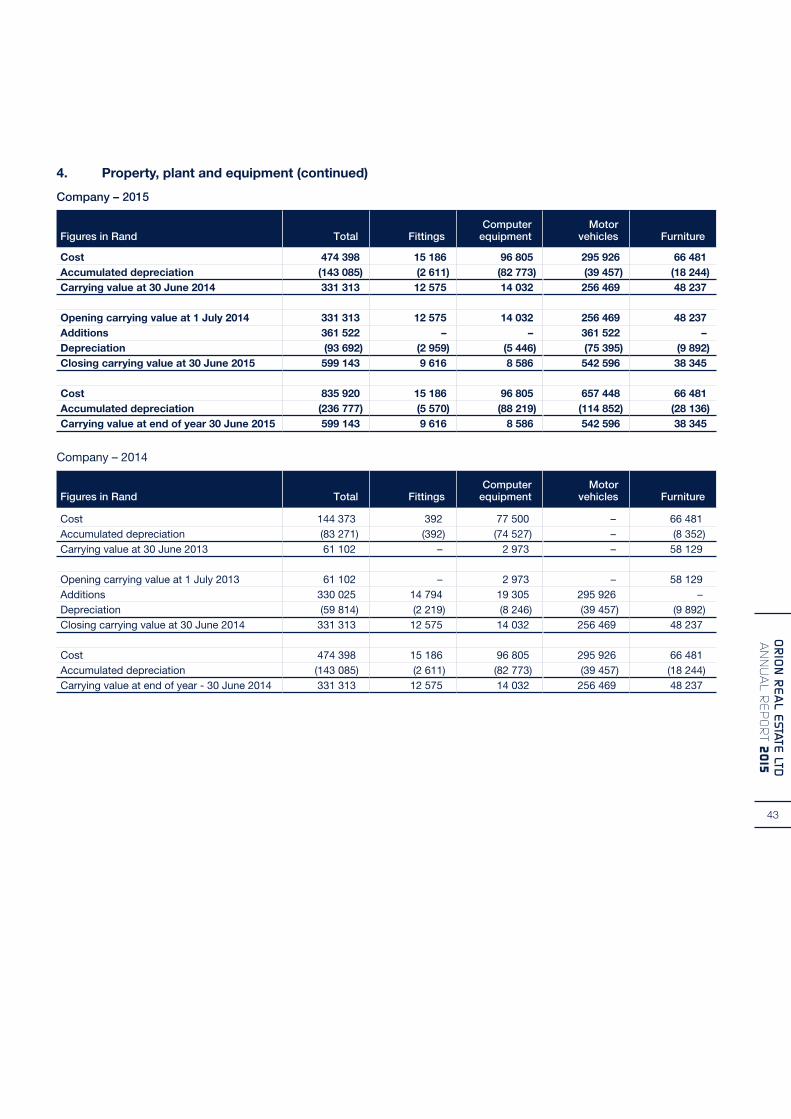
43
OR
ION
RE
AL E
STATE LTD
A
NN
UA
L RE
PO
RT 2
015
4. Property, plant and equipment (continued)
Company – 2015
Figures in Rand Total FittingsComputer
equipmentMotor
vehicles Furniture
Cost 474 398 15 186 96 805 295 926 66 481Accumulated depreciation (143 085) (2 611) (82 773) (39 457) (18 244)Carrying value at 30 June 2014 331 313 12 575 14 032 256 469 48 237
Opening carrying value at 1 July 2014 331 313 12 575 14 032 256 469 48 237Additions 361 522 – – 361 522 – Depreciation (93 692) (2 959) (5 446) (75 395) (9 892)Closing carrying value at 30 June 2015 599 143 9 616 8 586 542 596 38 345
Cost 835 920 15 186 96 805 657 448 66 481Accumulated depreciation (236 777) (5 570) (88 219) (114 852) (28 136)Carrying value at end of year 30 June 2015 599 143 9 616 8 586 542 596 38 345
Company – 2014
Figures in Rand Total FittingsComputer
equipmentMotor
vehicles Furniture
Cost 144 373 392 77 500 – 66 481Accumulated depreciation (83 271) (392) (74 527) – (8 352)Carrying value at 30 June 2013 61 102 – 2 973 – 58 129
Opening carrying value at 1 July 2013 61 102 – 2 973 – 58 129Additions 330 025 14 794 19 305 295 926 –Depreciation (59 814) (2 219) (8 246) (39 457) (9 892)Closing carrying value at 30 June 2014 331 313 12 575 14 032 256 469 48 237
Cost 474 398 15 186 96 805 295 926 66 481Accumulated depreciation (143 085) (2 611) (82 773) (39 457) (18 244)Carrying value at end of year - 30 June 2014 331 313 12 575 14 032 256 469 48 237

44
OR
ION
RE
AL
EST
ATE
LTD
A
NN
UA
L R
EP
OR
T 2
015
5. Investment in subsidiaries and controlled trust – Company
Figures in Rand
2015 2014
Nature of business
Issued share
capitalPercentage
holdingCost less
impairments
Issued share
capitalPercentage
holdingCost less
impairments
Beneficiaries of Trust
Orion Property Holding Trust* Property trust 100 100 – 100 100 –
Investment in subsidiaries
CBB Properties Proprietary Limited Dormant 100 100 100 100 100 100
Erf 195 Elma Park Limited Property 200 100 21 024 659 200 100 21 024 659 GEHS Leasing Company Proprietary Limited Property 1 000 100 1 000 1 000 100 1 000
Gold Edge III Proprietary Limited Dormant 1 000 100 1 000 1 000 100 1 000
Ixia Trading 532 Proprietary Limited Property 100 100 100 100 100 100 Orion Development One Proprietary Limited Property 100 85 85 100 85 85 Orion Development Two Proprietary Limited (previously known as Gold Edge VI Proprietary Limited) Dormant 100 100 100 100 100 100 Orion Development Three Proprietary Limited (previously known as Gold Edge XIV Proprietary Limited) Dormant 100 100 100 100 100 100
SBD Investments Proprietary Limited Property 1 000 100 1 000 1000 100 1 000
21 028 144 21 028 144
All subsidiaries are incorporated in the Republic of South Africa. Refer to note 30 for disclosure on loans between the company and fellow subsidiaries. The percentage holding equates to the percentage voting power. Orion Development One Proprietary Limited has no material interest in group activities and cash flows.
* Per the trust deed of Orion Property Holding Trust the sole capital and income beneficiary of the trust is Orion Real Estate Limited (Note 33). In addition Orion Real Estate Limited has the only right to nominate the trustees of the Orion Property Holding Trust.

45
OR
ION
RE
AL E
STATE LTD
A
NN
UA
L RE
PO
RT 2
015
6. Straight-line lease adjustments
Figures in Rand
Group Company
2015 2014 2015 2014
Non-current assets 8 433 017 10 193 238 1 043 653 156 484
Current asset/(liability) 988 597 852 643 (287 461) 26 985
Total straight-line lease asset 9 421 614 11 045 881 756 192 183 469
Reconciliation of movement in straight-line lease adjustments:
Opening balance 11 045 881 9 175 070 183 469 78 931
Profit/(loss) recognised during the year (1 624 267) 1 870 811 572 723 104 538
Closing balance 9 421 614 11 045 881 756 192 183 469
Future minimum lease income:
The future minimum aggregate lease commitments receivable under non-cancellable operating leases are as follows:
Group Company
2015 2014 2015 2014
Not later than one year 46 323 836 59 577 483 3 590 066 1 606 438
Later than one year and no later than five years 77 351 082 100 612 449 13 139 499 1 954 004
Later than five years 1 330 998 8 438 759 605 698 –
Total future contractual lease revenue 125 005 916 168 628 691 17 335 263 3 560 442
The balance recognised relates to rental income recognised on a straight-line basis which does not necessarily match the cash payments received.
The group and company enters into lease contracts with tenants in exchange for their use of the property.

46
OR
ION
RE
AL
EST
ATE
LTD
A
NN
UA
L R
EP
OR
T 2
015
7. Trade and other receivables – current
Figures in Rand
Group Company
2015 2014 2015 2014
Trade receivables 7 548 435 7 417 565 780 066 280 534
Related party receivables 33 807 569 29 444 689 108 202 –
Discounting of trade receivables 446 238 (446 238) – –
Less: Provision for impairment of trade receivables (3 234 394) (4 589 082) – –
Trade receivables – net 38 567 848 31 826 934 888 268 280 534
Deposits 1 762 394 1 499 280 280 951 173 551
Other receivables 2 152 893 82 975 37 399 77 815
VAT receivable 656 011 1 557 079 1 196 545 328 207
43 139 146 34 966 268 2 403 163 860 107
The carrying amounts of the group and company’s trade and other receivables are denominated in South African Rands. The fair value of trade and other receivables is disclosed in note 32. The group and company does not hold any collateral as security. The carrying amount of the trade and other receivables approximates fair value due to its short-term nature, except for the non-current portion, for which discounting has been applied when required.
In 2014, a two year repayment period was used in the discounting calculation based on expected repayment. Assumed cash flow were based on the current repayment history with annual forecasted increases.
A discount rate of 10.00% was applied in 2014. The long-term receivable was reclassified as current based on the subsequent settlement of all long term debtors within the next year. Refer to note 36.
Trade and other receivables past due but not impaired
Due to the nature of the agreements, all trade receivables are past due at reporting date. Ageing of trade receivables impaired and net of impairment is shown below.
Each trade receivable has been reviewed for impairment and provided for when required based on payment history, signed acceptance of debt and other relevant known information pertaining to the tenant.
Ageing analysis of trade and other receivables net of impairment:
Group Past due
2015 2014
Gross Impaired Net Gross Impaired Net
Current Past due 4 868 254 18 822 4 849 432 2 713 510 276 085 2 437 425
30 days Past due 1 986 712 212 976 1 773 736 1 301 876 280 459 1 021 417
60 days Past due 3 619 942 499 984 3 119 958 1 523 711 498 753 1 024 958
90 days Past due 1 410 236 365 508 1 044 728 1 412 215 466 376 945 839
Over 90 days Past due 29 917 098 2 137 104 27 779 994 29 464 704 3 067 409 26 397 295
41 802 242 3 234 394 38 567 848 36 416 016 4 589 082 31 826 934
Company Past due
2015 2014
Gross Impaired Net Gross Impaired Net
Current Past due 358 849 – 358 849 70 738 – 70 738
30 days Past due 59 939 – 59 939 51 829 – 51 829
60 days Past due 50 754 – 50 754 44 202 - 44 202
90 days Past due 56 560 - 56 560 36 466 – 36 466
Over 90 days Past due 362 166 – 362 166 77 299 – 77 299
888 268 – 888 268 280 534 – 280 534
There are no receivables neither past due nor impaired.
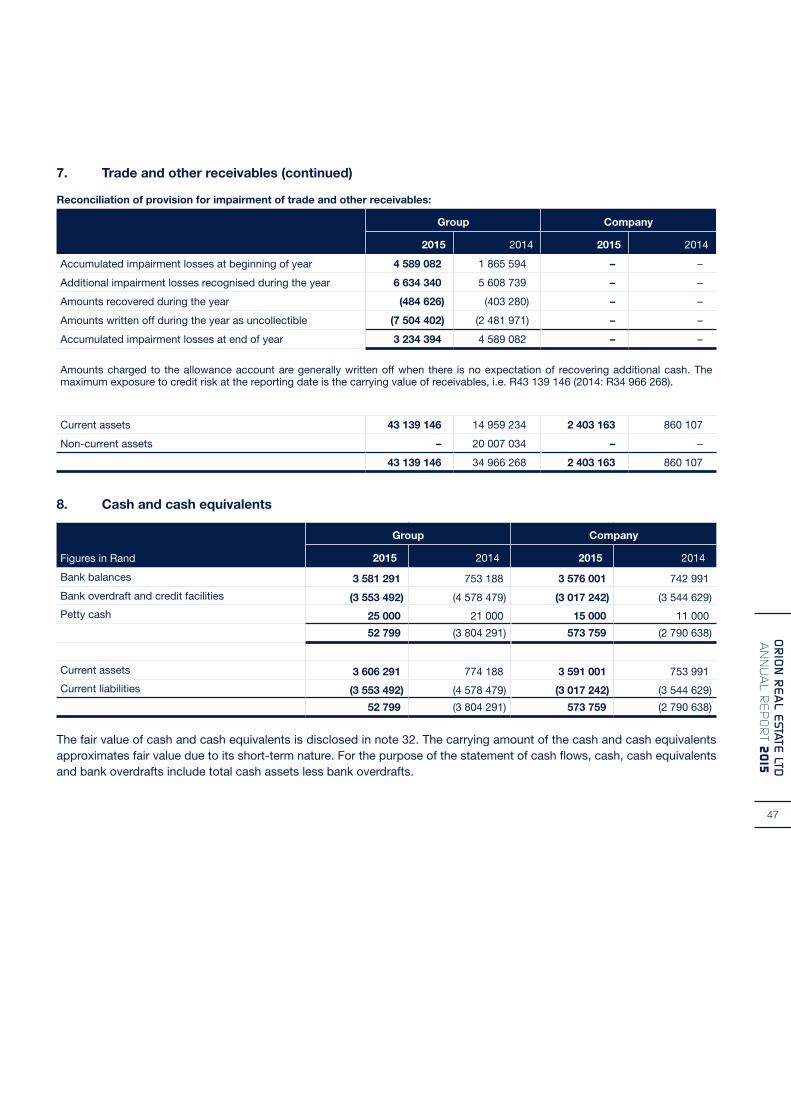
47
OR
ION
RE
AL E
STATE LTD
A
NN
UA
L RE
PO
RT 2
015
7. Trade and other receivables (continued)
Reconciliation of provision for impairment of trade and other receivables:
Group Company
2015 2014 2015 2014
Accumulated impairment losses at beginning of year 4 589 082 1 865 594 – –
Additional impairment losses recognised during the year 6 634 340 5 608 739 – –
Amounts recovered during the year (484 626) (403 280) – –
Amounts written off during the year as uncollectible (7 504 402) (2 481 971) – –
Accumulated impairment losses at end of year 3 234 394 4 589 082 – –
Amounts charged to the allowance account are generally written off when there is no expectation of recovering additional cash. The maximum exposure to credit risk at the reporting date is the carrying value of receivables, i.e. R43 139 146 (2014: R34 966 268).
Current assets 43 139 146 14 959 234 2 403 163 860 107
Non-current assets – 20 007 034 – –
43 139 146 34 966 268 2 403 163 860 107
8. Cash and cash equivalents
Figures in Rand
Group Company
2015 2014 2015 2014
Bank balances 3 581 291 753 188 3 576 001 742 991
Bank overdraft and credit facilities (3 553 492) (4 578 479) (3 017 242) (3 544 629)
Petty cash 25 000 21 000 15 000 11 000
52 799 (3 804 291) 573 759 (2 790 638)
Current assets 3 606 291 774 188 3 591 001 753 991
Current liabilities (3 553 492) (4 578 479) (3 017 242) (3 544 629)
52 799 (3 804 291) 573 759 (2 790 638)
The fair value of cash and cash equivalents is disclosed in note 32. The carrying amount of the cash and cash equivalents approximates fair value due to its short-term nature. For the purpose of the statement of cash flows, cash, cash equivalents and bank overdrafts include total cash assets less bank overdrafts.

48
OR
ION
RE
AL
EST
ATE
LTD
A
NN
UA
L R
EP
OR
T 2
015
9. Ordinary share capital
Figures in Rand
Group Company
2015 2014 2015 2014
Authorised
2 000 000 000 shares of no par value (2014: 2,000,000,000 shares of 1 cent each) 20 000 000 20 000 000 20 000 000 20 000 000
Issued
630 698 688 ordinary shres of no par value (2014: 630 698 688 ordinary shares of 1 cent each) 115 031 746 6 306 987 115 031 746 6 306 987
Balance at the beginning of the year 6 306 987 6 306 987 6 306 987 6 306 987
REIT Conversion of ordinary share premium, debenture capital and premium 108 724 759 – 108 724 759 –
3 366 866 treasury shares of no par value (2014: 3 688 866 treasury shares of 1 cent each) (695 072) (36 889) – –
Balance at beginning of the year (36 889) (36 889) – –
REIT Conversion of Treasury linked debenture capital and premium (658 183) – – –
Share premium – 67 965 428 – 67 965 428
Balance at beginning of the year 67 965 428 67 965 428 67 965 428 67 965 428
REIT Conversion (67 965 428) – (67 965 428) –
114 336 674 74 235 526 115 031 746 74 272 415
The unissued shares are under the control of the directors. This authority remains in force until the next annual general meeting of the company. During the year under review, the process to convert Orion Real Estate Limited was successfully completed and all linked units were delinked. The new financial instruments were listed on the JSE on 4 June 2015 and in future will trade as shares in the company. Accordingly, Orion Real Estate Limited’s debentures capital and premium as well as the Treasury debenture capital and premium were reallocated to share capital during the current year.
10. Linked debentures
Figures in Rand
Group Company
2015 2014 2015 2014
Issued Debentures
630 698 688 debentures of 1 cent each 6 306 987 6 306 987 6 306 987 6 306 987
REIT Conversion (6 306 987) – (6 306 987) –
– 6 306 987 – 6 306 987
Treasury Debentures
3 688 866 debentures of 1 cent each (36 889) (36 889) – –
REIT Conversion 36 889 – – –
– (36 889) – –
Movement in Debenture premium
Debenture premium at the beginning of the year 48 704 299 48 789 615 49 325 593 48 789 615
Treasury debenture premium (621 294) (621 294) – –
Amortisation of debenture premium during the year – 535 978 – 535 978
REIT Conversion (48 083 005) – (49 325 593) –
– 48 704 299 – 49 325 593
Total value of debentures – 54 974 397 – 55 632 580
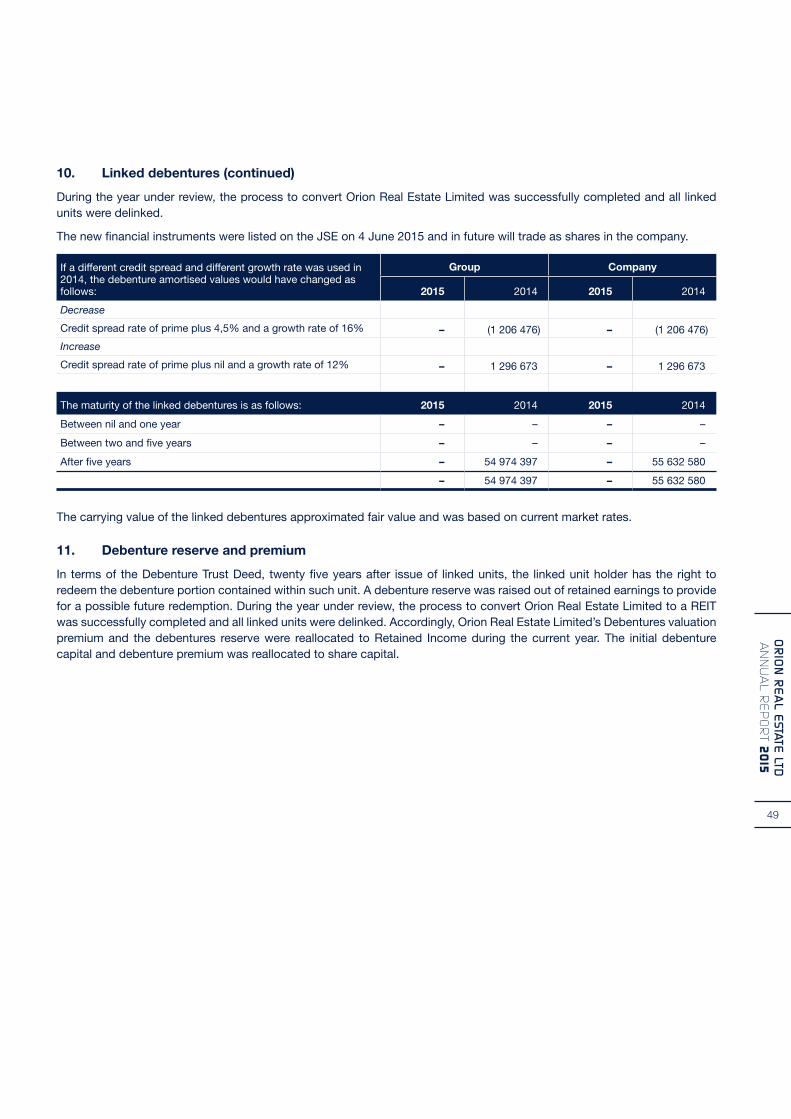
49
OR
ION
RE
AL E
STATE LTD
A
NN
UA
L RE
PO
RT 2
015
10. Linked debentures (continued)
During the year under review, the process to convert Orion Real Estate Limited was successfully completed and all linked units were delinked.
The new financial instruments were listed on the JSE on 4 June 2015 and in future will trade as shares in the company.
If a different credit spread and different growth rate was used in 2014, the debenture amortised values would have changed as follows:
Group Company
2015 2014 2015 2014
Decrease
Credit spread rate of prime plus 4,5% and a growth rate of 16% – (1 206 476) – (1 206 476)
Increase
Credit spread rate of prime plus nil and a growth rate of 12% – 1 296 673 – 1 296 673
The maturity of the linked debentures is as follows: 2015 2014 2015 2014
Between nil and one year – – – –
Between two and five years – – – –
After five years – 54 974 397 – 55 632 580
– 54 974 397 – 55 632 580
The carrying value of the linked debentures approximated fair value and was based on current market rates.
11. Debenture reserve and premium
In terms of the Debenture Trust Deed, twenty five years after issue of linked units, the linked unit holder has the right to redeem the debenture portion contained within such unit. A debenture reserve was raised out of retained earnings to provide for a possible future redemption. During the year under review, the process to convert Orion Real Estate Limited to a REIT was successfully completed and all linked units were delinked. Accordingly, Orion Real Estate Limited’s Debentures valuation premium and the debentures reserve were reallocated to Retained Income during the current year. The initial debenture capital and debenture premium was reallocated to share capital.

50
OR
ION
RE
AL
EST
ATE
LTD
A
NN
UA
L R
EP
OR
T 2
015
12. Borrowings
Figures in Rand
Group Company
2015 2014 2015Restated
2014Restated
2013
Secured mortgage finance/bonds
Settlement date
Monthly instalment Rate %
Secured over
investmentproperties
with a value of (Refer to
note 3)
Investec31 March 2018 930 593
Prime less 0,50% 328 325 923 68 659 186 73 875 858 – – –
Citibank Settled 350 000 14,43% – – 1 258 826 – –
Investec30 September 2017 249 262
Prime less 0,50% 75 076 295 15 794 258 17 346 786 15 794 258 17 346 786 22 832 606
Investec 1 May 2017 348 784Prime less
0,50% 131 000 000 7 709 396 11 087 323 – –
Investec1 September 2018 55 809
Prime less 0,25% 10 400 000 1 892 972 2 373 643 – –
Investec30 October 2018 122 257
Prime less 0,25% 53 400 000 9 070 623 9 690 147 – –
Investec31 March 2016 128 903
Prime less 0,25% 79 921 125 7 613 790 8 441 724 – –
Investec Settled – Prime – – 22 054 567 – –
Investec 30 April 2019 67 768 Prime 10 442 030 5 130 007 5 457 710 5 130 007 5 457 710 –
FNB 7 March 2020 140 295Prime less
0.25% 27 000 000 10 895 862 – – – –
Absa Settled 94 216Prime less
1% – – 3 995 445 – –
Standard Bank1 February 2017 195 059
Prime less 0.75% 40 000 000 7 253 624 8 931 169 7 253 624 8 931 169 10 581 725
Wartburgerhof cc – second bond* Extended 11 250 9,00% 10 400 000 1 500 000 1 500 000 – – –
Total mortgage finance 2 694 197 765 965 373
135 519 718
166 013 198 28 177 889 31 735 665 33 414 331

51
OR
ION
RE
AL E
STATE LTD
A
NN
UA
L RE
PO
RT 2
015
Figures in Rand
Group Company
2015 2014 2015Restated
2014Restated
2013
Secured mortgage finance/bonds
Settlement date
Monthly instalment Rate %
Secured over
assetswith a value of (Refer to
note 4)
Instalment sale and finance lease agreements
Standard Bank Instalment Sale Settled – Prime – 41 300 – – 176 235
Standard Bank Instalment Sale Settled –
Prime less 0,25% – 91 812 – 91 812 –
Standard Bank Instalment Sale
10 October 2018 3 114
Prime plus 1% 103 064 127 734 103 064 127 734 –
Standard Bank Instalment Sale
20 October 2018 4 451
Prime plus 1% 151 805 187 090 151 805 187 090 –
Standard Bank Instalment Sale 9 April 2017 5 033
Prime plus 2% 98 807 144 739 98 807 144 739 –
Standard Bank Instalment Sale
15 December 2019 7 179
Prime plus 1% 314 051 – 314 051 – –
Standard Bank Instalment Sale 1 April 2020 11 388
Prime plus 0,5% 585 709 – 585 709 – –
Standard Bank Instalment Sale 7 April 2020 4 078
Prime plus 0,5% 206 315 – 206 315 – –
Energon Energy Saving Finance Lease 1 June 2016 34 967 25,00% 395 940 888 900 – – –
Karabo Parking Management Finance Lease
31 March 2018 3 530
Prime plus 2% 99 002 134 358 – – –
Total instalment sale and finance lease agreements 73 740 632 916 1 954 693 1 615 933 1 459 751 551 375 176 235
Medium Term Loans
Investec Loan31 August 2016 282 062
Prime less 0.25% 15 637 546 17 544 538 – – –
282 062 15 637 546 17 544 538 – – –
Less: short term portions (25 758 076) (17 923 437) (4 237 866) (3 733 697) (3 207 716)
Total 3 049 999 766 598 289 127 353 881 167 250 232 25 399 774 28 553 343 30 382 850
12. Borrowings (continued)
* A private bond with a value of R1,500,000 have expired and are in the process of being renegotiated. This is standard practice within the property industry.There is no history of failed renegotiations and therefore management do not believe that any additional liquidity risk exists as a result of the bonds maturing in the near future.The instalment sales and finance lease agreements are secured over motor vehicles and parking equipment with a carrying value of R632 916. Refer to note 4.
Investec LimitedThe loan is secured by a first mortgage bond over various properties with a fair value of R688,565,373 (2014: R692,112,432) and limited surety issued by the director F Gmeiner of R180,100,000. The interest rate and monthly instalments are disclosed above. (This is applicable for group) An Investec loan was reallocated to the holding company as it was incorrectly accounted for in Ixia Trading 532 (Pty) Ltd. Refer to note 35.

52
OR
ION
RE
AL
EST
ATE
LTD
A
NN
UA
L R
EP
OR
T 2
015
12. Borrowings (continued)
First National BankThe loan is secured by a first mortgage bond over investment properties with a fair value of R27,000,000 (2014: R27,263,265) a limited surety issued by the director F Gmeiner of R11,081,400 as well as a cession of leases and rentals associated by the above mentioned property. The interest rate and monthly instalments are disclosed above. (This is applicable for group).
Standard Bank LimitedThe loan is secured by a first mortgage bond over investment properties with a fair value of R40,000,000 (2014: R41,977,989), limited surety issued by the director F Gmeiner of R17,500,000.The interest rate and monthly instalments are disclosed above. Instalment sales relate to the purchase of motor vehicles as well as financing of computer equipment. (This is applicable for group and company)
Wartburgerhof CCThe loan is secured by a second mortgage bond over investment properties with a fair value of R10,400,000 (2014: R9,700,000). The interest rate and monthly instalments are disclosed above. (This is applicable for group).
The maturity of security mortgage finance borrowings:
Figures in Rand
Group Company
2015 2014 2015Restated
2014 Restated
2013
Within one year 22 870 572 15 188 109 3 860 164 3 625 577 4 424 430
Between one and five years 112 649 146 150 825 089 24 317 725 28 110 088 30 065 356
After five years – – – – –
135 519 718 166 013 198 28 177 889 31 735 665 34 489 786
The maturity of loans, instalment sale and finance lease agreements:
Within one year 2 879 058 2 735 328 1 109 465 201 089 84 496
Between one and five years 14 713 181 16 425 143 350 286 350 286 91 739
17 592 239 19 160 471 1 459 751 551 375 176 235
The entity has not breached the terms of any loans or loan agreements.
13. Loans (from)/to related parties
Figures in Rand
Group Company
2015 2014 2015 2014
OFM Property Management Proprietary Limited 6 173 699 4 353 791 6 173 814 4 353 906
Orion Security Services Proprietary Limited 71 007 (376 154) 71 007 (376 154)
Gmeiner Family Trust 467 316 (59 206) 467 316 (59 206)
Gmeiner Investment Holding Proprietary Limited 10 995 519 6 281 453 10 995 519 6 281 453
Orion Agri Proprietary Limited 1 665 1 515 1 665 1 515
Orion Creative Business Ideas Proprietary Limited 314 051 – 314 051 –
Eagle Fleet Solutions Proprietary Limited 591 559 624 426 591 559 624 426
Fargoscene Proprietary Limited (21 012) 66 988 (21 012) 66 988
Orion Hotels and Resorts Proprietary Limited 1 308 690 3 180 002 1 253 607 3 124 919
Total 19 902 494 14 072 815 19 847 526 14 017 847
The loans are unsecured, bear no interest and have no fixed terms of repayment.
The fair value of loans (from)/to related parties is disclosed in note 32. The carrying value of loans (from)/to related parties approximates its fair value and the effect of discounting is immaterial. The group does not hold any collateral as security.
Current assets 19 923 506 14 508 175 19 868 538 14 453 207
Current liabilities (21 012) (435 360) (21 012) (435 360)
19 902 494 14 072 815 19 847 526 14 017 847

53
OR
ION
RE
AL E
STATE LTD
A
NN
UA
L RE
PO
RT 2
015
14. Loans (from)/to group companies
Figures in Rand
Company
2015Restated
2014Restated
2013
CBB Properties Proprietary Limited 911 493 914 068 924 015
Elma Park 195 Limited 40 578 814 33 536 729 33 454 754
GEHS Leasing Company Proprietary Limited (3 582 669) 5 715 227 2 559 133
Gold Edge III Proprietary Limited 33 468 36 028 (8 029)
Ixia Trading 532 Proprietary Limited (5 545 744) (6 566 300) 3 706 986
Ixia Trading 532 Proprietary Limited - Property bond * 15 794 258 17 346 786 22 832 606
Orion Development One Proprietary Limited 1 886 008 1 876 966 1 864 114
Orion Development Two Proprietary Limited 941 10 741 19 988
Orion Development Three Proprietary Limited 4 153 3 953 3 900
Orion Property Holding Trust 395 406 600 377 380 925 347 244 887
SBD Investments Proprietary Limited 1 712 182 (36 751) (31 725)
Less: Impairment of loans to group companies (2 809 526) (2 809 527) (2 809 527)
Total 444 389 978 427 408 845 409 761 102
The fair value of loans (from) / to group companies is disclosed in note 32. The carrying value of loans (from)/to group companies approximates its fair value and the effect of discounting is immaterial.
* The IXIA property loan is secured over investment property with a fair value of R75,076,295 (2014: R67,650,391) bearing interest at prime minus 1% per annum with monthly instalments of R249,262 (2014: R246,235). The loan will be repaid in full by 30 September 2017.
The maximum exposure to credit risk at the reporting date is the fair value of each class of loan mentioned above. All the other loans are unsecured, bear no interest and have no fixed terms of repayment.
The group does not hold any collateral as security for the other loans mentioned above.
Current assets 453 518 391 434 011 896 409 800 856
Current liabilities (9 128 413) (6 603 051) (39 754)
444 389 978 427 408 845 409 761 102
15. Loans from/(to) directors
Figures in Rand
Group Company
2015 2014 2015 2014
AC Gmeiner (18 248) (18 508) 260 –
F Gmeiner – 160 071 – 160 071
(18 248) 141 563 260 160 071
The AC Gmeiner loan is unsecured, bears no interest and has no fixed terms of repayment. The F Gmeiner loan was unsecured, and had no fixed terms of repayment. The fair value of loans from/(to) directors are disclosed in note 32. The maximum exposure to credit risk at the reporting date is the fair value of each class of loan mentioned above. The group does not hold any collateral as security.
Current assets – 160 071 260 160 071
Current liabilities (18 248) (18 508) – –
(18 248) 141 563 260 160 071

54
OR
ION
RE
AL
EST
ATE
LTD
A
NN
UA
L R
EP
OR
T 2
015
16. Deferred tax
Figures in Rand
Group Company
Rate 2015 2014 2015 2014
Deferred tax liability
Fair value adjustments on investment properties – buildings 18,66% – (68 379 490) – (48 940 639)
Fair value adjustments on investment properties – land 18,66% – (21 977 143) – (11 058 232)
Building allowance 18,66% – (344 271) – (344 271)
Impairment of loans to group companies 18,66% – – 524 471 524 471
Linked debenture amortisation 28% – (137 298) – (137 298)
Operating lease assets 28% (2 638 052) (3 092 847) (1 961 195) (2 099 811)
Provision for leave temporary differences 28% 102 436 92 882 102 436 92 882
Tax losses available for set-off against future taxable income 28% – 13 074 286 – –
Temporary differences arising from provision for bad debts 28% 679 223 963 707 216 080 400 000
Total (1 856 393) (79 800 174) (1 118 208) (61 562 898)
Figures in Rand
Group Company
2015 2014 2015 2014
Reconciliation of deferred tax liability
At beginning of the year (79 800 174) (73 403 399) (61 562 898) (57 482 933)
Fair value adjustments on investment properties – buildings 68 379 490 (9 124 757) 48 940 639 (3 754 387)
Fair value adjustments on investment properties – land 21 977 143 (932 378) 11 058 232 37 542
Fair value adjustments on investment properties held for sale – 1 518 875 – –
Building allowance 344 271 (172 136) 344 271 (172 136)
Impairment of loans to group companies – – – –
Disposal of investment properties – 3 018 641 – –
Linked debentures amortisation – current year 137 298 – 137 298 –
Operating lease assets 454 795 (523 828) 138 616 (486 785)
Provision for leave temporary differences 9 554 63 277 9 554 63 277
Tax losses available for set off against future taxable income (13 074 286) (816 404) – –
Temporary differences arising from provision for bad debts (284 454) 571 933 (183 920) 232 524
Total (1 856 393) (79 800 176) (1 118 208) (61 562 898)
Orion Real Estate Limited has been approved as a Real Estate Investment Trust (REIT), with effect from 1 July 2014, resulting in capital gains no longer being applicable on the sale of investment property in terms of section 25BB of the Income Tax Act. The deferred tax rate applied to investment property at the sale rate will therefore be 0%. Consequently, no deferred tax was raised on deferred capital gains of investment property. Deferred income taxation assets and liabilities are offset when the income taxes relate to the same fiscal authority, are within the same legal entity and there is a legal right to off-set at settlement. Deferred tax assets have been recognised where there is the expectation of sufficient taxable income in future to utilise temporary differences.

55
OR
ION
RE
AL E
STATE LTD
A
NN
UA
L RE
PO
RT 2
015
17. Trade and other payables
Figures in Rand
Group Company
2015 2014 2015 2014
Accounts payable – third party 41 181 553 36 050 409 3 235 469 1 838 638
Accounts payable – related party 2 035 572 – 571 537 –
Total accounts payable 43 217 125 36 050 409 3 807 006 1 838 638
Accruals 3 744 664 2 090 311 1 585 056 606 487
Debenture interest accrual 124 392 245 971 124 392 245 971
Provision for leave pay 365 842 331 720 365 842 331 720
47 452 023 38 718 411 5 882 296 3 022 816
The carrying amounts of the group’s trade and other payables are denominated in South African Rands. Accounts payable are invoiced with 30 - 90 day terms.
The fair value of trade and other payables is disclosed in note 32. The carrying value of trade payables approximates its fair value due to its short term nature.
17.1 Tenant deposits
Figures in Rand
Group Company
2015 2014 2015 2014
Tenant deposits received 6 961 064 6 563 381 349 064 127 357
The carrying amounts of the group’s tenant deposits are denominated in South African Rands. Tenant deposits are refundable within three months of the tenant vacating the premises. The carrying value approximates the fair value.
18. Revenue
Figures in Rand
Group Company
2015 2014 2015 2014
Basic operating cost income per rental contracts 8 532 951 9 433 364 271 160 222 801
Rental income (excluding parking) 67 500 935 59 936 335 3 479 295 1 790 706
Parking rental income 4 003 009 4 397 352 360 310 310 702
Recoveries 21 134 650 21 070 959 560 117 478 437
101 171 545 94 838 010 4 670 882 2 802 646
19. Other income
Figures in Rand
Group Company
2015 2014 2015 2014
Bad debts recovered (note 7) 484 626 403 280 – –
Insurance recoveries 235 049 196 860 83 883 –
Administration and management fees received 211 397 – 10 929 755 –
Profit on disposal of investment property 11 793 982 1 798 801 – –
Signage and sundry rental income 355 106 650 834 29 653 15 910
13 080 160 3 049 775 11 043 291 15 910
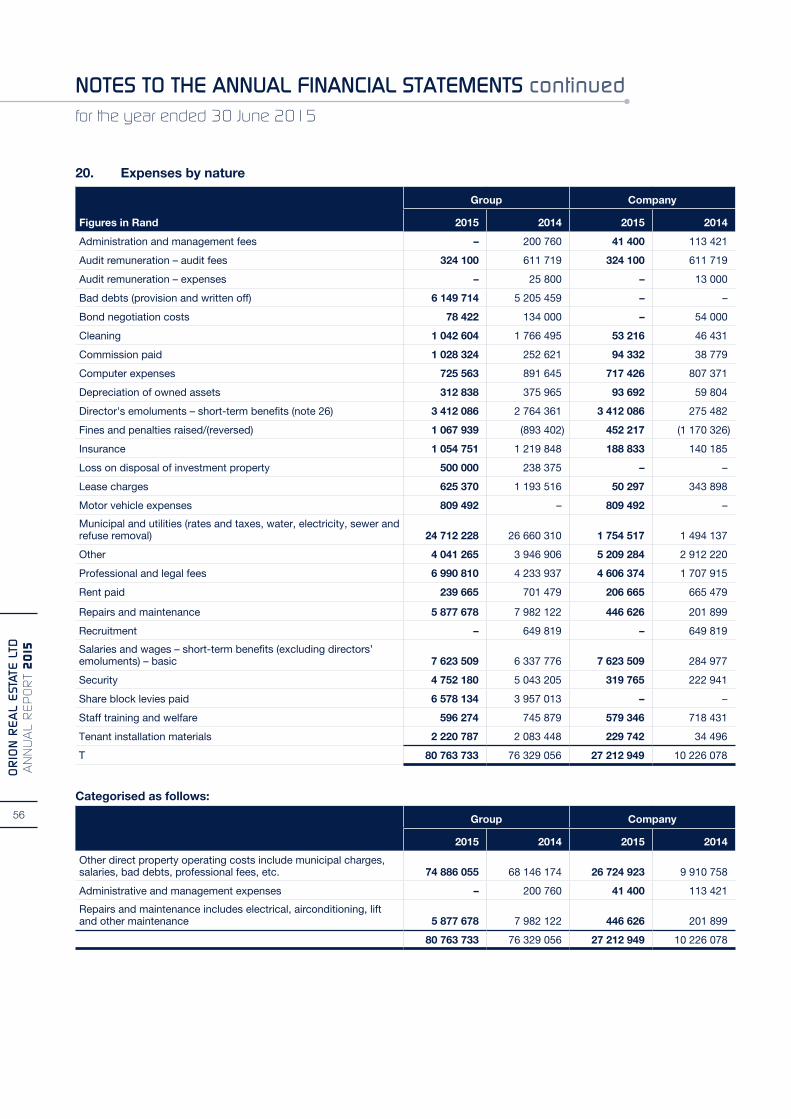
56
OR
ION
RE
AL
EST
ATE
LTD
A
NN
UA
L R
EP
OR
T 2
015
20. Expenses by nature
Figures in Rand
Group Company
2015 2014 2015 2014
Administration and management fees – 200 760 41 400 113 421
Audit remuneration – audit fees 324 100 611 719 324 100 611 719
Audit remuneration – expenses – 25 800 – 13 000
Bad debts (provision and written off) 6 149 714 5 205 459 – –
Bond negotiation costs 78 422 134 000 – 54 000
Cleaning 1 042 604 1 766 495 53 216 46 431
Commission paid 1 028 324 252 621 94 332 38 779
Computer expenses 725 563 891 645 717 426 807 371
Depreciation of owned assets 312 838 375 965 93 692 59 804
Director's emoluments – short-term benefits (note 26) 3 412 086 2 764 361 3 412 086 275 482
Fines and penalties raised/(reversed) 1 067 939 (893 402) 452 217 (1 170 326)
Insurance 1 054 751 1 219 848 188 833 140 185
Loss on disposal of investment property 500 000 238 375 – –
Lease charges 625 370 1 193 516 50 297 343 898
Motor vehicle expenses 809 492 – 809 492 –
Municipal and utilities (rates and taxes, water, electricity, sewer and refuse removal) 24 712 228 26 660 310 1 754 517 1 494 137
Other 4 041 265 3 946 906 5 209 284 2 912 220
Professional and legal fees 6 990 810 4 233 937 4 606 374 1 707 915
Rent paid 239 665 701 479 206 665 665 479
Repairs and maintenance 5 877 678 7 982 122 446 626 201 899
Recruitment – 649 819 – 649 819
Salaries and wages – short-term benefits (excluding directors’ emoluments) – basic 7 623 509 6 337 776 7 623 509 284 977
Security 4 752 180 5 043 205 319 765 222 941
Share block levies paid 6 578 134 3 957 013 – –
Staff training and welfare 596 274 745 879 579 346 718 431
Tenant installation materials 2 220 787 2 083 448 229 742 34 496
T 80 763 733 76 329 056 27 212 949 10 226 078
Categorised as follows:
Group Company
2015 2014 2015 2014
Other direct property operating costs include municipal charges, salaries, bad debts, professional fees, etc. 74 886 055 68 146 174 26 724 923 9 910 758
Administrative and management expenses – 200 760 41 400 113 421
Repairs and maintenance includes electrical, airconditioning, lift and other maintenance 5 877 678 7 982 122 446 626 201 899
80 763 733 76 329 056 27 212 949 10 226 078

57
OR
ION
RE
AL E
STATE LTD
A
NN
UA
L RE
PO
RT 2
015
21. Finance income
Figures in Rand
Group Company
2015 2014 2015 Restated 2014 Restated 2013
Debtors’ interest – third parties 1 616 882 1 367 715 448 420 136 737 47 045
Debtors’ interest – related parties 2 875 789 1 803 714 – – –
Loans receivable interest – related parties – – 1 433 808 1 635 611 1 914 552
4 492 671 3 171 429 1 882 228 1 772 348 1 961 597
22. Finance costs
Figures in Rand
Group Company
2015 2014 2015 Restated 2014 Restated 2013
Interest-bearing borrowings 15 199 376 15 483 287 2 580 838 2 523 736 2 829 088
Linked unit distribution – 2 597 606 – 2 597 606 747 524
Bank interest 2 085 414 1 454 054 405 346 559 927 172 230
17 284 790 19 534 947 2 986 184 5 681 269 3 748 842
23. Taxation
Figures in Rand
Group Company
2015 2014 2015 2014
Major components of the taxation expense/(income)
Current 1 019 504 3 683 715 1 019 504 2 958 370
Taxation – current period 1 019 504 3 849 317 1 019 504 3 080 929
Taxation – over provision prior years – (165 602) – (122 559)
Deferred (77 943 778) 6 396 774 (60 444 688) 4 079 964
Originating and reversing temporary differences (77 943 778) 6 396 774 (60 444 688) 4 079 964
Taxation per statement of comprehensive income (76 924 274) 10 080 489 (59 425 184) 7 038 334
Tax losses available for set-off against future taxable income 53 839 293 46 693 878 – –
Reconciliation between accounting profit and taxation expense:
Accounting profit 32 890 034 50 003 160 29 530 906 36 662 145
Taxation at the applicable tax rate of 28% (2014: 28%) 9 209 210 14 000 885 8 268 654 10 265 401
Tax effect of adjustments on taxable income
Non-deductible expense – debenture amortisation (137 298) 150 074 (137 298) 150 074
Non-deductible expense/(taxable income) – discounting adjustment to accounts receivable (124 947) (1 303 729) (124 947) (1 303 729)
Tax adjustment in respect of prior years – over provision – (165 602) – (122 559)
Non-tax portion on fair value adjustments to investment properties (97 263 167) (732 046) (65 093 954) (820 989)
Non-deductible expenses for tax purposes 834 975 144 314 720 870 11 453
Non-taxable income for tax purposes (554 884) (327 691) – (327 691)
Deferred tax asset unrecognised 15 248 182 – – –
Deferred tax asset on tax losses not recognised utilised – 2 320 – –
Non-taxable portion on gain on sale of investment properties – (1 688 036) – (813 625)
Qualifying distribution S25BB (4 136 344) – (3 058 509) –
(76 924 274) 10 080 489 (59 425 184) 7 038 334

58
OR
ION
RE
AL
EST
ATE
LTD
A
NN
UA
L R
EP
OR
T 2
015
24. Earnings per share
Basic earnings per share is determined by dividing profit or loss attributable to the ordinary equity holders of the parent by the weighted average number of shares outstanding during the year.Headline earnings per share is determined by dividing headline earnings by the weighted average number of shares during the year.Headline earnings is determined by adjusting basic earnings by excluding separately identifiable re-measurement items. Headline earnings is presented after tax and non-controlling interest. There are no dilutionary instruments in issue.
Reconciliation of numerators used for basic and diluted earnings per linked unit:
Figures in Rand
Group
2015 2014
Shares (2014: Linked units) in issue 630 698 688 630 698 688
Number of shares (2014: linked units) for basic earnings 630 698 688 630 698 688
Less: treasury shares (2014: treasury linked units) (3 688 866) (3 688 866)
Number of shares for net asset value per share (2014: linked unit) 627 009 822 627 009 822
Number of shares (2014: linked units) for diluted earnings per share (2014: linked unit) 627 009 822 627 009 822
Weighted average number of shares (2014: linked units) in issue 627 009 822 627 009 822
Headline earnings reconciliation:
Basic earnings 109 831 115 39 921 586
Fair value adjustment to investment properties (11 747 942) (40 687 749)
Linked debenture interest – 535 978
Deferred tax (reversed due to REIT Conversion) / raised on fair value adjustment to investment properties (90 356 633) 7 594 287
Deferred tax raised on linked debenture interest – (150 074)
Net (profit)/loss on disposal of investment properties (11 293 982) (1 560 426)
Capital gains tax raised on disposal of investment property – 3 365 964
Headline earnings (3 567 442) 9 019 566
Reconciliation of net asset value:
Total equity attributable to equity holders of the parent 618 728 988 453 923 476
Linked debentures – 54 974 397
Total net asset value 618 728 988 508 897 873
Earnings per share (2014: linked unit)
Basic earnings per share (2014: linked unit) (cents) 17,52 6,37
Diluted earnings per share (2014: linked unit) (cents) 17,52 6,37
Headline earnings per share (2014: linked unit) (cents)
Headline earnings per share (2014: linked unit) (cents) (0,57) 1,44
Diluted headline earnings per share (2014: linked unit) (cents) (0,57) 1,44
Net asset value per share (2014: linked unit)
Net asset value per share at year-end (cents) 98,68 81,16

59
OR
ION
RE
AL E
STATE LTD
A
NN
UA
L RE
PO
RT 2
015
25. Statement of cash flow information
25.1 Cash generated from operations
Figures in Rand
Group Company
2015 2014 2015 2014
Profit before taxation 32 890 034 50 003 160 29 530 906 36 662 145
Adjusted for:
Finance income (4 492 671) (3 171 429) (1 882 228) (136 737)
Finance costs 17 284 790 19 534 947 2 986 184 4 045 658
Add or deduct non-cash items:
– Straight-line operating lease adjustment 1 624 268 (1 870 811) (572 723) (104 638)
– Depreciation 312 838 375 965 93 692 59 814
– Loss on disposal of investment property 500 000 238 375 – –
– Profit on disposal of investment property (11 793 971) (1 798 801) – –
– SARS penalties incurred (1 067 939) 893 402 (452 217) 1 170 326
– Linked debenture interest (amortisation) – 535 978 – 535 978
– Fair value adjustment to debtors (discounting) (446 238) (4 656 177) – –
– Fair value adjustment to investment properties (13 372 211) (38 816 939) (1 608 682) (932 131)
21 438 900 21 267 670 31 312 296 41 300 415
Changes in working capital
Trade and other payables 8 733 612 8 576 874 2 859 480 1 035 010
Tenant deposits 397 683 191 518 221 707 (13 265)
Stock on hand (4 321) – (4 321) –
Trade and other receivables (7 726 640) 315 931 (1 543 058) 2 175 724
Cash generated/(utilised) from operations 22 839 234 30 351 993 32 846 104 44 497 884
25.2 Taxation paid
Figures in Rand
Group Company
2015 2014 2015 2014
Opening balance 11 005 713 13 064 856 8 361 145 10 377 162
Taxation in statement of comprehensive income 1 019 504 3 683 715 1 019 504 2 958 370
SARS penalties (1 067 939) 893 402 (452 217) 1 170 326
Closing balance (8 610 355) (11 005 713) (6 212 605) (8 361 145)
Taxation paid 2 346 922 6 636 260 2 715 827 6 144 713

60
OR
ION
RE
AL
EST
ATE
LTD
A
NN
UA
L R
EP
OR
T 2
015
26. Directors’ remuneration
Figures in Rand
Group Company
2015 2014 2015 2014
Non-executive 105 840 91 000 105 840 91 000
Executive 3 306 246 2 673 361 3 306 246 184 482
3 412 086 2 764 361 3 412 086 275 482
The directors’ short-term remuneration for the year ended 30 June 2015 was as follows: Salary Bonus Fees
Fringe benefits Total
Non-executive (group and company)
Mr R Wilkinson – – 63 618 – 63 618
Dr AC Gmeiner – – 19 840 – 19 840
Mr DK Mthembu – – 14 942 – 14 942
Prof F Viruly – – 7 440 – 7 440
– – 105 840 – 105 840
Executive (group)
Mr F Gmeiner 2 245 911 50 000 – 617 670 2 913 581
Mr CB Nolte 357 665 35 000 – – 392 665
2 603 576 85 000 – 617 670 3 306 246
Salary Bonus FeesFringe
benefits Total
Executive (company)
Mr F Gmeiner 2 245 911 50 000 – 617 670 2 913 581
Mr CB Nolte 357 665 35 000 – – 392 665
2 603 576 85 000 – 617 670 3 306 246
The directors’ short-term remuneration for the year ended 30 June 2014 was as follows: Salary Bonus Fees
Travel Allowance Total
Non-executive
Mr R Wilkinson – – 41 400 – 41 400
Dr AC Gmeiner – – 12 400 – 12 400
Mr DK Mthembu – – 12 400 – 12 400
Prof F Viruly – – 24 800 – 24 800
– – 91 000 – 91 000
Executive (group)
Mr F Gmeiner 1 897 405 50 000 – 270 000 2 217 405
Mr CB Nolte 425 956 30 000 – – 455 956
2 323 361 80 000 – 270 000 2 673 361
Executive (company)
Mr F Gmeiner 131 263 3 226 – 18 644 153 133
Mr CB Nolte 29 414 1 935 – – 31 349
160 677 5 161 – 18 644 184 482

61
OR
ION
RE
AL E
STATE LTD
A
NN
UA
L RE
PO
RT 2
015
27. Segment report
Operating segments are reported in a manner consistent with the internal reporting provided to the chief operating decision-maker. The chief operating decision-maker, who is responsible for allocating resources and assessing performance of the operating segments, has been identified as the managing director in consultation with the board of directors. The chief operating decision-maker evaluates and reports on the group results as a whole on a monthly basis. It was decided to disclose results based on the specific industry due to practicality.
The risks and rewards faced by the entity relate primarily to the operating segments being retail, commercial, industrial, residential and hospitality. Lettable space is classified as retail, commercial, industrial, residential or hospitality according to the nature of the tenants.
Revenue (excluding recoveries)
2015 2014
R % R %
Commercial 37 315 186 46 35 088 213 47
Industrial 8 173 053 10 9 216 222 12
Retail 24 535 908 31 24 057 345 33
Hospitality 9 344 550 12 4 246 290 6
Residential 668 198 1 1 158 981 2
80 036 895 100 73 767 051 100
The group does not have any inter-segment revenue.
Profit before taxation
2015 2014
R % R %
Commercial 16 431 477 50 24 473 062 49
Industrial 9 096 397 28 11 413 154 23
Retail 17 518 975 53 6 625 057 13
Hospitality (1 736 825) (5) 10 733 998 21
Residential (8 419 989) (26) (3 242 111) (6)
32 890 035 100 50 003 160 100
Property values (including properties held for sale, before adjustment for straight-lining of leases) (note 3)
2015 2014
R % R %
Commercial 339 235 830 44 329 978 783 43
Industrial 87 896 177 11 86 843 163 11
Retail 161 663 471 21 182 559 352 23
Hospitality 80 874 438 10 81 999 571 10
Residential 48 945 695 6 48 442 817 6
Land 53 400 000 7 53 400 000 7
772 015 611 100 783 223 686 100
Borrowings (excluding instalment sales and loans) (note 12)
2015 2014
R % R %
Commercial 72 530 231 53 71 554 364 43
Industrial 22 800 003 17 25 597 334 15
Retail 23 069 847 17 49 138 070 30
Hospitality 9 505 847 7 11 281 707 7
Residential 7 613 790 6 8 441 724 5
135 519 718 100 166 013 199 100

62
OR
ION
RE
AL
EST
ATE
LTD
A
NN
UA
L R
EP
OR
T 2
015
27. Segment report (continued)
Rating of tenants (rental income)
2015 2014
R % R %
Commercial A 4 231 515 6 3 583 868 6
B 13 661 821 20 8 819 767 15
C 18 474 674 28 13 380 752 22
Industrial A – – – –B 5 945 293 9 5 285 476 9
C 1 547 200 2 2 644 652 4
Retail A 2 974 139 5 2 999 091 5
B 8 920 070 13 4 849 775 8
C 8 365 052 12 13 254 761 22
Hospitality A – – – –
B 2 712 974 4 3 944 524 7
C – – – –
Residential A – – – –
B – – – –
C 668 199 1 1 173 669 2
67 500 937 100 59 936 335 100
A: Represents major listed companies
B: Represents smaller listed companies and big unlisted companies
C: Represents smaller unlisted companies and private businesses

63
OR
ION
RE
AL E
STATE LTD
A
NN
UA
L RE
PO
RT 2
015
27. Segment report – property portfolio information (continued)
Property name and operating segment
Acquisition date Major tenants
Rentable area
(m²) by operating segment
Total income
per building
excluding recoveries
Weighted average
rental per month
per square metre
Vacancy %
Purchase price
Valuations 30 June 2015
R
Average annu-alised
property yield
ORION CENTRE ERF 195 (RETAIL SEGMENT) *
23/04/2008 Bergens Old Style Fish & Chips
10 642 1 527 186 11,96 65,25 15 769 981 79 921 125 1,91%
(RESIDENTIAL SEGMENT) (BUILDING)
1 799 668 199 30,95
ORION CENTRE ERF 257 (LAND)
23/04/2008 Parking6 099 0,00 5 981 743 53 400 000 0,00%
PROMENADE SHOPPING CENTRE (RETAIL SEGMENT)
07/04/2006 Mr Price Group Limited (1672)
7 388 12 352 025 139,33 3,45 33 069 809 131 000 000 12,19%
(HOSPITALITY SEGMENT) Orion Hotel & Resorts
5 200 918 881 14,73
KENSINGTON B (COMMERCIAL SEGMENT)
10/07/2003 Mica Hardware 3 655 1 735 362 39,57 22,82 5 975 000 20 166 481 8,61%
67 – 7th STREET 10/07/2003 Fleet Cube CC 1 410 801 736 47,38 37,73 2 482 000 10 043 883 7,98%
(COMMERCIAL SEGMENT) Tower Architects
SCORE – DELFT (RETAIL SEGMENT)
19/12/2002 Orient Trading/ SPAR The Standard Bank of SA Limited
1 091 825 267 63,04 100,00 3 291 403 4 245 622 19,44%
SCORE – ROOSENDAL (RETAIL SEGMENT)
19/12/2002 Score Supermarkets (Trading) Proprietary LimitedThe Standard Bank of SA Limited
1 091 2 762 276 210,99 100,00 3 305 403 3 610 189 76,51%
SCORE – MACASSAR (RETAIL SEGMENT)
19/12/2002 Rapha Fellowship Church
1 055 1 000 347 79,02 100,00 3 303 403 5 001 735 20,00%
SCORE – WESBANK (RETAIL SEGMENT)
19/12/2002 Score Supermarkets (Trading) Proprietary LimitedThe Standard Bank of SA Limited
1 091 705 693 53,90 0,00 3 303 403 3 592 692 19,64%
DAN PERKINS(COMMERCIAL SEGMENT)
10/07/2003 McCarthy Limited
6 310 1 626 879 21,49 0,00 4 100 000 14 943 157 10,89%
STANDARD BANK BRAMLEY(COMMERCIAL SEGMENT)
10/07/2003 Eastridge School
3 024 1 497 265 41,26 49,60 5 400 000 18 905 878 7,92%
PRIMROSE MALL(RETAIL SEGMENT)
28/02/2008 African Bank FatcakePepkor Retail LimitedOK Furniture
3 322 1 705 191 42,78 2,86 7 400 000 16 700 000 10,21%
MEYERS CORNER (RETAIL SEGMENT)
28/02/2008 SA Post Office Limited City All Street ButcherCash CrusadersLuvland
1 336 893 241 55,72 0,00 3 900 000 9 500 000 9,40%

64
OR
ION
RE
AL
EST
ATE
LTD
A
NN
UA
L R
EP
OR
T 2
015
Property name and operating segment
Acquisition date Major tenants
Rentable area
(m²) by operating segment
Total income
per building
excluding recoveries
Weighted average
rental per month
per square metre
Vacancy %
Purchase price
Valuations 30 June 2014
R
Average annu-alised
property yield
ORION HOUSE (COMMERCIAL SEGMENT)
30/05/2008 EdconCapitec Bank
9 323 56 223 0,50 14,90 27 200 000 90 000 000 7,39%
(RETAIL SEGMENT) Old Mutual FinanceAfrican Bank
1 428 3 146 259 183,61
(HOSPITALITY SEGMENT) Devonshire Hotel
4 487 6 592 313 122,43
MARLBORO ERF 97 (INDUSTRIAL SEGMENT)
30/05/2008 Mag DoctorE Cars
635 263 229 34,54 0,00 1 400 000 2 708 762 9,72%
MARLBORO ERF 161 (INDUSTRIAL SEGMENT)
30/05/2008 SJ Andrews Electronics Proprietary Limited
612 548 797 74,73 0,00 1 100 000 5 346 411 10,26%
MARLBORO ERF 211 & 212 (INDUSTRIAL SEGMENT)
30/05/2008 NJR Steel 1 135 665 314 48,85 0,00 2 800 000 6 920 977 9,61%
ERF 63/64 LYDENBURG (INDUSTRIAL SEGMENT)
15/05/2014 St Pie Properties (Pty) Ltd
6 692 1 109 736 165,83 0,00 9 500 000 10 442 030 10,63%
WENDYWOOD (RETAIL SEGMENT)
30/05/2008 Winnies RestaurantAlly for a KidHiltons Car Sound CCSA Post Office Limited
4 244 4 162 112 81,73 39,11 14 900 000 37 800 000 11,01%
LASER PARK ERF 101 (INDUSTRIAL SEGMENT)
07/07/2008 Lloyds Lounge Proprietary Limited
3 882 2 127 271 45,67 32,20 9 500 000 20 781 922 10,24%
LASER PARK ERF 123 (INDUSTRIAL SEGMENT)
07/07/2008 Packitt and Church
2 123 983 644 38,61 0,00 5 300 000 11 999 033 8,20%
LASER PARK ERF 124 & 126 (INDUSTRIAL SEGMENT)
07/07/2008 GSI Cumberland SA Proprietary Limited
5 359 2 325 051 36,15 0,00 9 200 000 29 697 042 7,83%
WARTBURG (HOSPITALITY SEGMENT)
07/07/2008 Orion Hotels & Resorts Proprietary Limited
6 000 482 500 6,70 0,00 8 100 000 10 400 000 4,64%
NORTHCLIFF ATRIUM – STAND 19 (COMMERCIAL SEGMENT)
25/07/2008 World of Fishing Suzaan HeynsFrans Els
5 739 2 854 513 41,45 18,50 8 200 000 27 000 000 10,57%
ACA KRANS TRUST (COMMERCIAL SEGMENT)
19/06/2009 City of Johannesburg
9 365 14 109 793 125,55 48,05 38 200 000 96 871 776 14,57%
72 VOORTREKKER (COMMERCIAL SEGMENT)
10/07/2003 Ukobona Electrical 200
1 894 1 039 990 45,76 23,18 4 000 000 11 016 896 9,44%
296 KENT(COMMERCIAL SEGMENT)
30/06/2009 Planet Image Productions South African Breweries
6 772 2 369 450 29,16 54,58 30 000 000 40 000 000 5,92%
BUILDINGS NOT OWNED AT 30 JUNE 2015 (SOLD 2015)
N/A N/A N/A 5 486 245 N/A N/A N/A N/A N/A
TOTAL 127 515 80 036 895 61,20 19,84 266 682 145 772 015 611
* ORION CENTRE ERF 195 (RETAIL SEGMENT)
Not included in computation of vacancies percentage because building is udergoing a major redevelopment and the space is not ready for occupation.
27. Segment report – property portfolio information (continued)

65
OR
ION
RE
AL E
STATE LTD
A
NN
UA
L RE
PO
RT 2
015
28. Commitments
The group has an additional contractual capital commitment of R2,100,000 in respect of capital expenditure to acquire the parking lot at Wendywood Shopping Centre.
29. Contingent liabilities
The company has signed surety of R8 400 000 for the obligations of its subsidiaries in respect of mortgage bond finance.
The company is currently in a dispute with Elma Park Body Corporate relating to arrear levies due in respect of the Elma Park sectional title scheme in which the company owns several units. The Elma Park Body Corporate has filed an application for the winding up of the company to which the company will lodge a motion in counter application and a counter claim against the body corporate. The matter is not expected to be heard before the first quarter of 2016. Both the company and our attorney believe the counter claim will be successful.
30. Related party transactions
Related parties
Relationships
Entities controlled by director: Orion Security Services Proprietary Limited
Orion Creative Business Ideas Proprietary Limited t/a Orion Business Solutions
Fargoscene Proprietary Limited
OFM Property Management Proprietary Limited
Orion Hotels & Resorts Proprietary Limited
Orion Hotels & Resorts (SA) Proprietary Limited
Orion Agri Proprietary Limited
Eagle Fleet Solutions Proprietary Limited
Subsidiaries: Refer to note 5 for details on subsidiaries.
Members of key management: The board of directors are considered to be key management. (Refer note 26 for remuneration detail)

66
OR
ION
RE
AL
EST
ATE
LTD
A
NN
UA
L R
EP
OR
T 2
015
30. Related party transactions (continued)
Figures in Rand Note
Group Company
2015 2014 2015 2014
Loan accounts – Owing (to)/by related parties 19 570 195 14 214 378 507 287 777 485 995 631
Holding Trust 14 – – 395 406 600 377 380 925
Subsidiaries 14 – – 48 983 377 50 027 920
Less: Impairment of loans to subsidiaries – – (2 809 526) (2 809 526)
Subsidiaries net of impairment 14 – – 46 173 851 47 218 394
Companies with common directors 13 19 588 443 14 072 815 19 533 475 14 017 847
Loans (from)/to directors 15 (18 248) 141 563 – 160 071
Amounts included in Trade payables 2 035 572 – 571 537 –
Holding Trust – – 526 990 –
Companies with common directors 17 2 035 572 – 44 547 –
Amounts included in Trade receivables
Companies with common directors 7 33 807 569 29 444 689 108 202 –
Related party transactions:
Property related income received
Companies with common directors 6 285 384 7 605 137 6 285 384 8 051 375
Interest received 1 912 554 1 904 135 3 346 362 3 539 746
Companies with common directors - debtors 1 912 554 1 904 135 1 912 554 1 904 135
Subsidiaries - loans receivable – – 1 433 808 1 635 611
Property related expenses paid
Companies with common directors 6 283 846 12 907 340 7 587 959 9 794 127
Administration and management fees received
Subsidiaries – – 10 123 953 –
Profit distribution from controlled trust
Orion Property Holdings Trust – – (43 169 597) (47 477 687)
Elma Park 195 Body Corporate
Share block levies 6 578 134 3 957 013 – –
* Income received and expenses paid by the Orion Property Holding Trust to/(from) related parties and distributed to Orion Real Estate Limited, included in the profit from controlled trust of R43 169 597 (2014: R47 477 687) are disclosed as related party income/expenses of the company.
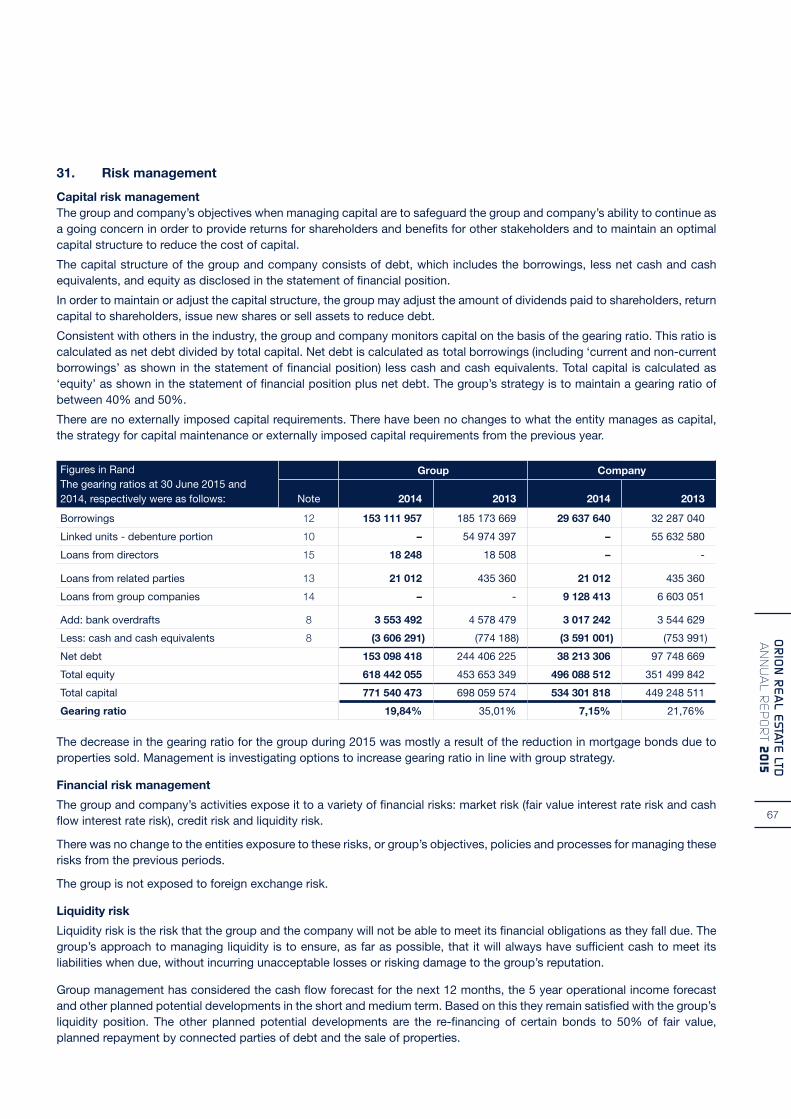
67
OR
ION
RE
AL E
STATE LTD
A
NN
UA
L RE
PO
RT 2
015
31. Risk management
Capital risk management The group and company’s objectives when managing capital are to safeguard the group and company’s ability to continue as a going concern in order to provide returns for shareholders and benefits for other stakeholders and to maintain an optimal capital structure to reduce the cost of capital.
The capital structure of the group and company consists of debt, which includes the borrowings, less net cash and cash equivalents, and equity as disclosed in the statement of financial position.
In order to maintain or adjust the capital structure, the group may adjust the amount of dividends paid to shareholders, return capital to shareholders, issue new shares or sell assets to reduce debt.
Consistent with others in the industry, the group and company monitors capital on the basis of the gearing ratio. This ratio is calculated as net debt divided by total capital. Net debt is calculated as total borrowings (including ‘current and non-current borrowings’ as shown in the statement of financial position) less cash and cash equivalents. Total capital is calculated as ‘equity’ as shown in the statement of financial position plus net debt. The group’s strategy is to maintain a gearing ratio of between 40% and 50%.
There are no externally imposed capital requirements. There have been no changes to what the entity manages as capital, the strategy for capital maintenance or externally imposed capital requirements from the previous year.
Figures in RandThe gearing ratios at 30 June 2015 and 2014, respectively were as follows:
Group Company
Note 2014 2013 2014 2013
Borrowings 12 153 111 957 185 173 669 29 637 640 32 287 040
Linked units - debenture portion 10 – 54 974 397 – 55 632 580
Loans from directors 15 18 248 18 508 – -
Loans from related parties 13 21 012 435 360 21 012 435 360
Loans from group companies 14 – - 9 128 413 6 603 051
Add: bank overdrafts 8 3 553 492 4 578 479 3 017 242 3 544 629
Less: cash and cash equivalents 8 (3 606 291) (774 188) (3 591 001) (753 991)
Net debt 153 098 418 244 406 225 38 213 306 97 748 669
Total equity 618 442 055 453 653 349 496 088 512 351 499 842
Total capital 771 540 473 698 059 574 534 301 818 449 248 511
Gearing ratio 19,84% 35,01% 7,15% 21,76%
The decrease in the gearing ratio for the group during 2015 was mostly a result of the reduction in mortgage bonds due to properties sold. Management is investigating options to increase gearing ratio in line with group strategy.
Financial risk management
The group and company’s activities expose it to a variety of financial risks: market risk (fair value interest rate risk and cash flow interest rate risk), credit risk and liquidity risk.
There was no change to the entities exposure to these risks, or group’s objectives, policies and processes for managing these risks from the previous periods.
The group is not exposed to foreign exchange risk.
Liquidity risk
Liquidity risk is the risk that the group and the company will not be able to meet its financial obligations as they fall due. The group’s approach to managing liquidity is to ensure, as far as possible, that it will always have sufficient cash to meet its liabilities when due, without incurring unacceptable losses or risking damage to the group’s reputation.
Group management has considered the cash flow forecast for the next 12 months, the 5 year operational income forecast and other planned potential developments in the short and medium term. Based on this they remain satisfied with the group’s liquidity position. The other planned potential developments are the re-financing of certain bonds to 50% of fair value, planned repayment by connected parties of debt and the sale of properties.

68
OR
ION
RE
AL
EST
ATE
LTD
A
NN
UA
L R
EP
OR
T 2
015
31. Risk management (continued)
The table below analyses the group and company’s financial liabilities into relevant maturity groupings based on the remaining period at the reporting date to the contractual maturity. The amounts disclosed in the table are the contractual undiscounted cash flows.
Group
At 30 June 2015 Less than 1 year Between 1 and 5 years Over 5 years
Borrowings 29 718 537 144 029 547 –
Loans from directors 18 248 – –
Loans from related parties 21 012 – –
Trade and other payables 47 086 181 – –
Surety in respect of subsidiary mortgage bonds 9 636 364 – –
86 480 342 144 029 547 –
At 30 June 2014 Less than 1 year Between 1 and 5 years Over 5 years
Linked units – debenture portion – – 54 974 397
Borrowings 34 501 035 202 995 752 –
Loans from directors 18 508 – –
Loans from related parties 435 360 – –
Trade and other payables 38 386 691 – –
Surety in respect of subsidiary mortgage bonds 1 453 463 6 946 537 –
74 795 057 209 942 289 54 974 397
Borrowings due within six months are R2 800 126.
Company
At 30 June 2015 Less than 1 year Between 1 and 5 years Over 5 years
Borrowings 3 860 164 24 317 725 –
Loans from related parties 21 012 – –
Trade and other payables 5 516 454 – –
Surety in respect of subsidiary mortgage bonds 1 453 463 6 946 537
10 851 093 31 264 262 –
At 30 June 2014 Less than 1 year Between 1 and 5 years Over 5 years
Linked units – debenture portion – – 55 632 580
Borrowings 3 625 577 28 110 088 –
Loans from related parties 435 360 – –
Trade and other payables 2 691 096 – –
Surety in respect of subsidiary mortgage bonds 1 453 463 6 946 537
8 205 496 35 056 625 55 632 580
Interest rate risk
The group and company’s interest rate risk arises from long-term borrowings, long-term debtors and cash and cash equivalents. Borrowings issued at variable rates expose the group and company to cash flow interest rate risk. Borrowings issued at fixed rates expose the group to fair value interest rate risk.
The scenarios are run only for liabilities that represent the major interest-bearing positions with flexible interest rates (which does not include borrowings with fixed rates). The calculation is based on calculating the effective interest rate of the group and company and adding a 1% escalation to this effective interest rate.
The simulation is done on a yearly basis to verify that the maximum loss potential is within the limit given by the management.

69
OR
ION
RE
AL E
STATE LTD
A
NN
UA
L RE
PO
RT 2
015
31. Risk management (continued)
Based on the simulations performed, the impact on post-tax profit would be:
Group Company
2015 2014 2015 2014
Decrease
A decrease of 1% (2014: 1%) in prime interest rate (1 102 407) (1 043 016) (213 391) (107 570)
Increase
An increase of 1% (2014: 1%) in prime interest rate 1 102 407 1 043 016 213 391 107 570
Cash flow interest rate risk
Group
Financial instrument Current interest rate Less than 1 year Between 1 and 5 years Over 5 years
Accounts receivable Variable 41 356 004 – –
Borrowings 8,50% 1 806 370 5 447 254 –
Borrowings 8,75% 10 805 648 81 357 192 –
Borrowings 9,00% 11 819 281 34 791 512 –
Borrowings 9,25% 360 323 4 769 684 –
Borrowings 9,50% 65 528 189 341 –
Borrowings 9,75% 204 781 587 242 –
Borrowings 10,25% 56 407 257 643 –
Borrowings 10,50% 33 639 65 363 –
Borrowings 11,00% 50 987 47 820 –
Borrowings 25,00% 395 940 – –
Company
Financial instrument Current interest rate Less than 1 year Between 1 and 5 years Over 5 years
Accounts receivable Variable 888 268 – –
Borrowings 8,50% 1 806 370 5 447 254 –
Borrowings 8,75% 1 693 470 14 100 788 –
Borrowings 9,25% 360 323 4 769 684 –
Borrowings 9,50% 65 528 189 341 –
Borrowings 9,75% 204 781 587 242 –
Borrowings 10,25% 56 407 257 643 –
Borrowings 11,00% 50 987 47 820 –

70
OR
ION
RE
AL
EST
ATE
LTD
A
NN
UA
L R
EP
OR
T 2
015
31. Risk management (continued)
Credit risk
Credit risk is managed on a group basis. Credit risk consists mainly of cash deposits and cash equivalents as well as trade receivables and loans to related parties.
The group and company only deposits cash with major banks and limits exposure to any one counter-party.
Trade receivables comprise a widespread customer base except for those with related parties. Management evaluated credit risk relating to customers on an ongoing basis. If customers are independently rated, these ratings are used. Otherwise, if there is no independent rating, risk control assesses the credit quality of the customer, taking into account its financial position, past experience and other factors.
Provision is made on a case by case basis for bad debts at year-end. Deposits are paid by tenants once a rental lease agreement has been finalised which is held by the group and company which minimises the group`s credit risks.
Management does not consider there to be any material credit risk exposure. See below for the credit exposure due to trade receivables:
Group Company
2015 2014 2015 2014
Trade receivables 41 356 004 36 862 254 888 268 280 534
Less: Provision for impairment of trade receivables (3 234 394) (4 589 082) – –
Less: Tenant deposits held (6 961 064) (6 563 381) (349 064) (127 357)
31 160 546 25 709 791 539 204 153 177
32. Financial instruments by category
The carrying value of financial assets and liabilities are approximates of their fair values.
The accounting policies for financial instrument classifications have been applied to the line items below:
Group Company
2015 2014 2015 2014
Financial assetsLoans and
receivablesLoans and
receivablesLoans and
receivablesLoans and
receivables
Loans to related parties 19 923 506 14 508 175 19 868 538 14 453 207
Loans to directors – 160 071 260 160 071
Loans to group companies – – 453 518 391 434 011 896
Trade and other receivables 40 720 741 31 909 909 925 667 358 349
Cash and cash equivalents 3 606 291 774 188 3 591 001 753 991
64 250 538 47 352 343 477 903 857 449 737 514
Financial liabilitiesFinancial liabilities at amortised cost
Financial liabilities at amortised cost
Financial liabilities at amortised cost
Financial liabilities at amortised cost
Linked units – debenture portion – 54 974 397 – 55 632 580
Borrowings – long-term portion 127 353 881 167 250 231 25 399 774 28 553 343
Borrowings – short-term portion 25 758 076 17 923 438 4 237 866 3 733 697
Loans from directors 18 248 18 508 – –
Loans from related parties 21 012 435 360 21 012 435 360
Loans from group companies – – 9 128 413 6 603 051
Trade and other payables 47 086 181 38 386 688 5 516 454 2 691 096
Bank overdraft 3 553 492 4 578 479 3 017 242 3 544 629
203 790 890 283 567 101 47 320 761 101 193 756

71
OR
ION
RE
AL E
STATE LTD
A
NN
UA
L RE
PO
RT 2
015
33. Profit distribution from controlled trust
Orion Real Estate Limited is the sole beneficiary of Orion Property Holding Trust. In terms of the trust deed all profits are distributed annually to Orion Real Estate Limited.
34. Shareholder information at 30 June 2015
Number of shares in issue
Number of shareholders
Percentage of total shareholders
Number of issued shares held
Percentage of issued shares held
Spread of holdings
1 – 1 000 shares 381 65,46 213 109 0,03
1 001 – 10 000 shares 105 18,04 437 337 0,07
10 001 – 100 000 shares 57 9,79 2 577 810 0,41
100 001 – 1 000 000 shares 27 4,64 11 808 625 1,87
1 000 001 shares and over 12 2,06 615 661 807 97,62
582 100,00 630 698 688 100,00
Distribution of shareholders
Banks or nominees 6 1,03 565 762 0,09
Individuals 528 90,72 26 161 111 4,15
Investment trust 23 3,95 592 299 946 93,91
Share trusts 1 0,17 1 705 000 0,27
Other companies 24 4,12 9 966 869 1,58
582 100,00 630 698 688 100,00
Public/non-public spread
Non-public 17 2,92 595 170 014 94,37
Directors and associates 16 2,75 593 465 014 94,10
Share trust 1 0,17 1 705 000 0,27
Public 565 97,08 35 528 674 5,63
582 100,00 630 698 688 100,00
Beneficial holding of more than 5%
Franz Gmeiner Property Trust 586 810 961 93,04

72
OR
ION
RE
AL
EST
ATE
LTD
A
NN
UA
L R
EP
OR
T 2
015
34. Linked unit holder information at 30 June 2015 (continued)
Non-public holdings: Directors’ interest in shares
The interests of directors in the issued share capital of the company as at 30 June 2015 were as follows:
Number of linked units
Direct beneficial Indirect beneficial TotalPercentage of issued
share capital
2015
Managing director
F Gmeiner 2 321 188 588 737 355 591 058 543 93,71%
Non-executive director
AC Gmeiner 2 056 471 – 2 056 471 0,33%
Non-executive chairman of the board
RS Wilkinson 250 000 – 250 000 0,04%
4 627 659 588 737 355 593 365 014 94,08%
2014
Managing director
F Gmeiner 2 321 188 588 737 355 591 058 543 93,70%
Non-executive director
AC Gmeiner 2 056 471 – 2 056 471 0,33%
Non-executive chairman of the board
RS Wilkinson 250 000 – 250 000 0,04%
Non-executive directors
FM Viruly 50 000 – 50 000 0,01%
4 677 659 588 737 355 593 415 014 94,08%
35. Restatement of comparative figures
Borrowings and Loan to Group company
One of the mortgage bonds secured over one of the subsidiaries properties, were incorrectly accounted for in the subsidiary company (Ixia Trading 532 Proprietary Limited) even though the bond agreement was in the Holding company’s name (Orion Real Estate Limited).
Disclosure on investment properties previously reported
In prior years the disclosure on the Statement of financial position indicated the reconciliation from Gross Investment properties to Net Investment properties and the Straight-line lease asset was shown separately and split between the long term and short term portion. There was also a calculation error on the fair value adjustment on properties in 2014 and has been adjusted for accordingly.
The effected figures for the 2015 Statement of Financial Position, Statement of comprehensive income and the Statement of Cash flows, as well as the related notes, have been restated and presented in the financials for 30 June 2015. The effect of the restatement is:
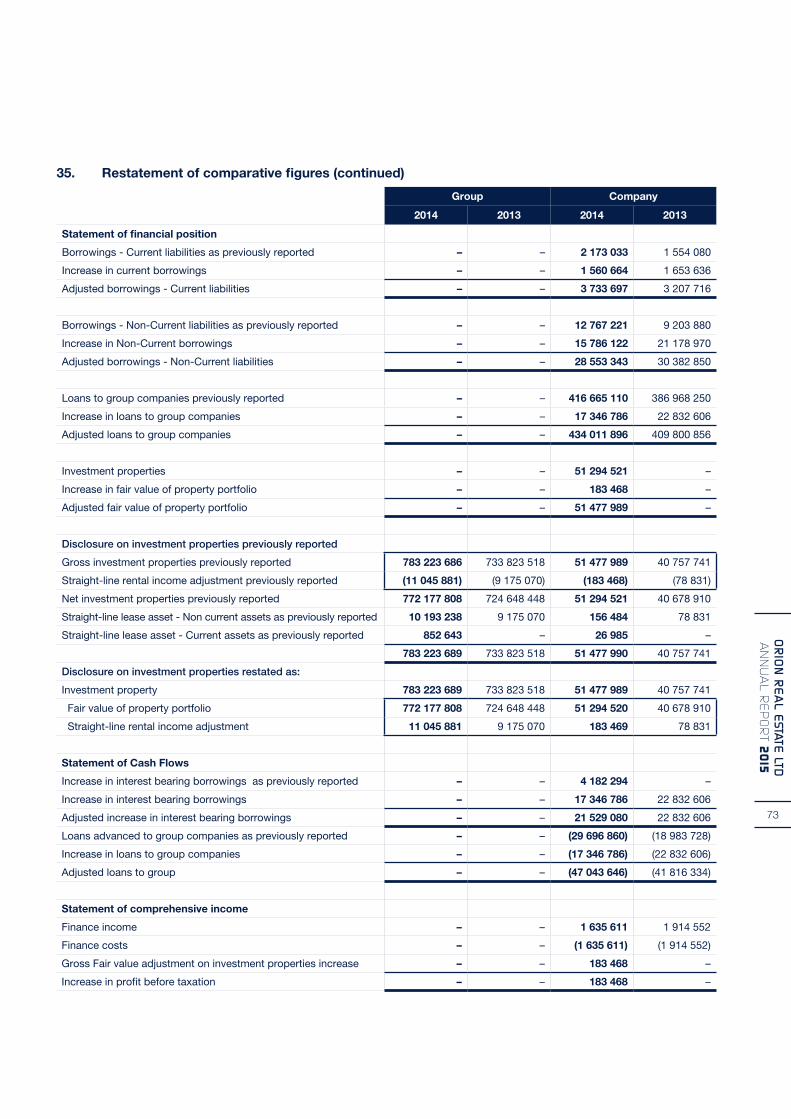
73
OR
ION
RE
AL E
STATE LTD
A
NN
UA
L RE
PO
RT 2
015
Group Company
2014 2013 2014 2013
Statement of financial position
Borrowings - Current liabilities as previously reported – – 2 173 033 1 554 080
Increase in current borrowings – – 1 560 664 1 653 636
Adjusted borrowings - Current liabilities – – 3 733 697 3 207 716
Borrowings - Non-Current liabilities as previously reported – – 12 767 221 9 203 880
Increase in Non-Current borrowings – – 15 786 122 21 178 970
Adjusted borrowings - Non-Current liabilities – – 28 553 343 30 382 850
Loans to group companies previously reported – – 416 665 110 386 968 250
Increase in loans to group companies – – 17 346 786 22 832 606
Adjusted loans to group companies – – 434 011 896 409 800 856
Investment properties – – 51 294 521 –
Increase in fair value of property portfolio – – 183 468 –
Adjusted fair value of property portfolio – – 51 477 989 –
Disclosure on investment properties previously reported
Gross investment properties previously reported 783 223 686 733 823 518 51 477 989 40 757 741
Straight-line rental income adjustment previously reported (11 045 881) (9 175 070) (183 468) (78 831)
Net investment properties previously reported 772 177 808 724 648 448 51 294 521 40 678 910
Straight-line lease asset - Non current assets as previously reported 10 193 238 9 175 070 156 484 78 831
Straight-line lease asset - Current assets as previously reported 852 643 – 26 985 –
783 223 689 733 823 518 51 477 990 40 757 741
Disclosure on investment properties restated as:
Investment property 783 223 689 733 823 518 51 477 989 40 757 741
Fair value of property portfolio 772 177 808 724 648 448 51 294 520 40 678 910
Straight-line rental income adjustment 11 045 881 9 175 070 183 469 78 831
Statement of Cash Flows
Increase in interest bearing borrowings as previously reported – – 4 182 294 –
Increase in interest bearing borrowings – – 17 346 786 22 832 606
Adjusted increase in interest bearing borrowings – – 21 529 080 22 832 606
Loans advanced to group companies as previously reported – – (29 696 860) (18 983 728)
Increase in loans to group companies – – (17 346 786) (22 832 606)
Adjusted loans to group – – (47 043 646) (41 816 334)
Statement of comprehensive income
Finance income – – 1 635 611 1 914 552
Finance costs – – (1 635 611) (1 914 552)
Gross Fair value adjustment on investment properties increase – – 183 468 –
Increase in profit before taxation – – 183 468 –
35. Restatement of comparative figures (continued)
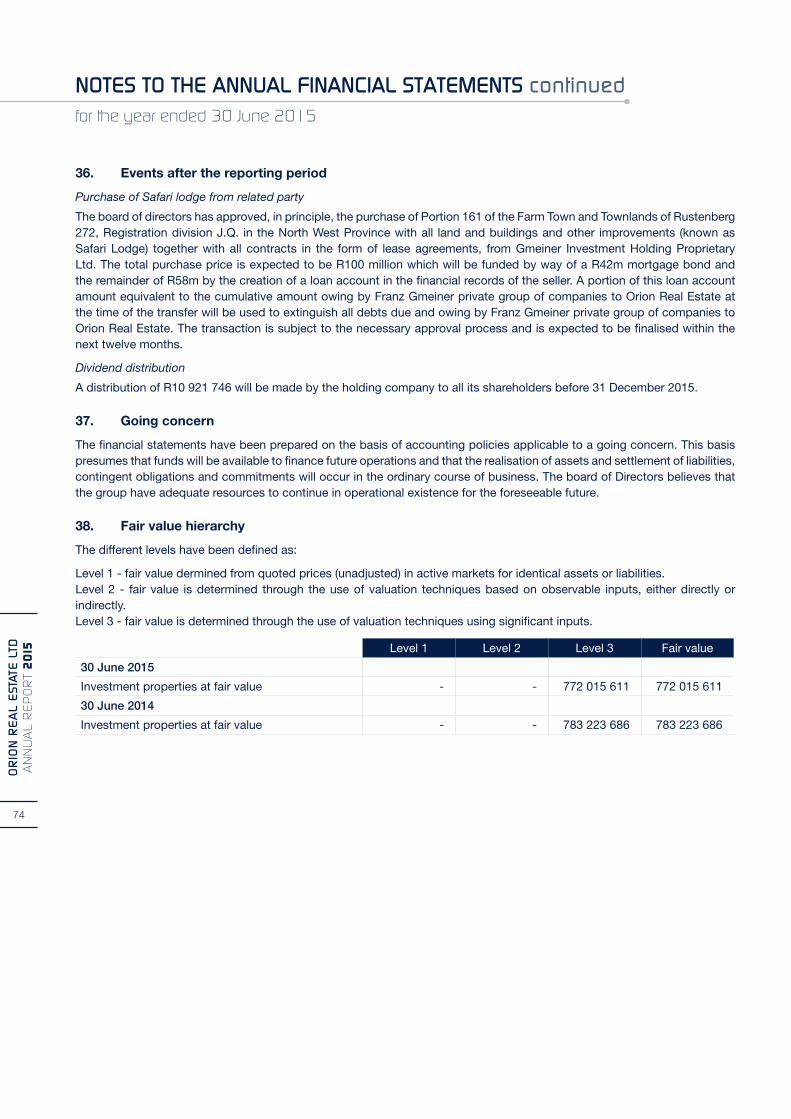
74
OR
ION
RE
AL
EST
ATE
LTD
A
NN
UA
L R
EP
OR
T 2
015
36. Events after the reporting period
Purchase of Safari lodge from related party
The board of directors has approved, in principle, the purchase of Portion 161 of the Farm Town and Townlands of Rustenberg 272, Registration division J.Q. in the North West Province with all land and buildings and other improvements (known as Safari Lodge) together with all contracts in the form of lease agreements, from Gmeiner Investment Holding Proprietary Ltd. The total purchase price is expected to be R100 million which will be funded by way of a R42m mortgage bond and the remainder of R58m by the creation of a loan account in the financial records of the seller. A portion of this loan account amount equivalent to the cumulative amount owing by Franz Gmeiner private group of companies to Orion Real Estate at the time of the transfer will be used to extinguish all debts due and owing by Franz Gmeiner private group of companies to Orion Real Estate. The transaction is subject to the necessary approval process and is expected to be finalised within the next twelve months.
Dividend distribution
A distribution of R10 921 746 will be made by the holding company to all its shareholders before 31 December 2015.
37. Going concern
The financial statements have been prepared on the basis of accounting policies applicable to a going concern. This basis presumes that funds will be available to finance future operations and that the realisation of assets and settlement of liabilities, contingent obligations and commitments will occur in the ordinary course of business. The board of Directors believes that the group have adequate resources to continue in operational existence for the foreseeable future.
38. Fair value hierarchy
The different levels have been defined as:
Level 1 - fair value dermined from quoted prices (unadjusted) in active markets for identical assets or liabilities.Level 2 - fair value is determined through the use of valuation techniques based on observable inputs, either directly or indirectly.Level 3 - fair value is determined through the use of valuation techniques using significant inputs.
Level 1 Level 2 Level 3 Fair value
30 June 2015
Investment properties at fair value - - 772 015 611 772 015 611
30 June 2014
Investment properties at fair value - - 783 223 686 783 223 686

75
OR
ION
RE
AL E
STATE LTD
A
NN
UA
L RE
PO
RT 2
015
Notice is hereby given that the annual general meeting of members of ORION REAL ESTATE will be held in the boardroom, 16th floor, Orion House, 49 Jorissen Street, Braamfontein, Johannesburg on WEDNESDAY 25 NOVEMBER 2015 at 10h00 for the purposes of considering and, if deemed fit, passing with
or without modification, the resolutions set out below:
1. Ordinary resolution number one (Auditors’ report)
To resolve that the auditors’ report be taken as read.
2. Ordinary resolution number two (Adoption of annual
financial statements) To receive the annual financial statements of the company
and the group for the financial year ended 30 June 2015, together with the reports of the directors and auditors.
NOTE: PROCEDURE FOR THE APPOINTMENT OF DIRECTORSIn terms of section 68(2) of the Companies Act of South Africa, the directors shall be individually appointed.
3. Ordinary resolution number three (Re-election of non-executive director: Mr M D K Mthembu):
To re-appoint Mr M D K Mthembu, who retires by rotation but, being eligible, offers himself for re-appointment.
4. Special resolution number one (Remuneration of non-executive directors)
To approve the remuneration for the non-executive directors, with retrospective effect from 1 July 2015 to 30 June 2016, as follows:
Payable
Board meetings
ChairmanDirector
16 2407 090
Each meetingEach meeting
All other meetings*
ChairmanDirector
NilNil
NilNil
In order for Special Resolution number one to be passed the support of at least 75% (seventy-five per cent) of the voting rights exercised on the resolution by shareholders present in person, or represented by proxy, at the annual general meeting is required.
5. Special resolution number two (Financial assistance
in terms of section 45 of the Companies Act) “RESOLVED THAT, in accordance with section 45 of the
Companies Act, the Board, with the specific power to delegate to the Audit & Risk Management Committee, be and is hereby authorised, by way of a general authority, at any time and from time to time during the period of two years commencing on the date of this special resolution, to provide any direct or indirect financial assistance (as contemplated in section 45(1) of the Companies Act) in any form or amount to any company which is related or inter-related to the company (from time to time and for the time being), as defined in the Companies Act, on such terms and conditions as the Board may determine.”
Explanatory note in respect of Special resolution number two
Special resolution number two is required in order to authorise financial assistance by the company to related or inter-related companies. In terms of section 45 of the Companies Act, the Directors may not authorise the company to provide financial assistance by way of loans, guarantees, the provision of security or otherwise, to any company which is related or inter-related to Orion Real Estate Limited, i.e. its subsidiaries, unless such financial assistance is pursuant to a special resolution of shareholders. This special resolution does not authorise the provision of financial assistance to a Director or prescribed officer of the company.
In terms of the treasury management function and policies, Orion Real Estate Limited is required, from time to time, to provide financial assistance to related or inter-related companies to ensure that these entities maintain appropriate liquidity levels.
The authorisation of any such financial assistance will be and remain subject thereto that the Board is satisfied that immediately after granting the financial assistance, the company will satisfy the solvency and liquidity test set out in the Companies Act and that the terms under which the financial assistance is proposed to be given are fair and reasonable to the company.
In accordance with section 45(5) of the Companies Act, the Board and the Audit Committee, to whom the board has delegated its powers in this regard, hereby gives notice to its shareholders of the intention to pass a resolution authorising the Company to provide financial assistance to certain related and/or inter-related companies which Board resolution will take effect on the passing of Special resolution number two set out above.
The percentage of voting rights that will be required for this special resolution to be adopted is 75% of the votes exercised on the resolution.
In order for Special Resolution number two to be passed the support of at least 75% (seventy-five per cent) of the voting rights exercised on the resolution by shareholders present in person, or represented by proxy, at the annual general meeting is required.
6. Ordinary resolution number four (Appointment of auditor)
Subject to the audit committee being satisfied as to the auditors’ independence, to appoint BDO South Africa Inc. as the auditors for the current financial year, ending 30 June 2016. The responsible audit partner is Heemal Bhaga Muljee.
Audit fees In terms of section 94(7)(b) of the Companies Act of South
Africa, as amended, (“the Companies Act”) the audit committee is responsible for determining the audit fees and the auditors’ terms of appointment.

76
OR
ION
RE
AL
EST
ATE
LTD
A
NN
UA
L R
EP
OR
T 2
015
7. Ordinary resolutions numbers five and six (Appointment of Audit Committee)
Section 94 of the Companies Act of South Africa, requires each annual general meeting of a public company to elect an audit committee comprising at least three members.
It is accordingly proposed that the following directors should be elected to serve as members of the audit committee:
7.1 Ordinary resolution number five MRMDKMTHEMBU
7.2 Ordinary resolution number six MR R S WILKINSON
8. Ordinary resolution number seven (Non-binding shareholders vote in favour of the Company’s remuneration policy)
To consider and, if considered appropriate, to approve the non-binding shareholders resolution.
9. Ordinary resolution number eight (Authority to issue shares) Not applicable to issues of shares for cash
Subject to the provisions of the Companies Act of South Africa, as amended, the Memorandum of Incorporation of the Company and the Listings Requirements of JSE Limited, authority be given to the directors to allot and issue, at their discretion, the unissued share capital of the Company for such purposes as they may determine, until the Company’s next Annual General Meeting, provided that such authority be limited to the allotment and issue, in any one financial year, of 15% of the Company’s issued share capital at the time that this authority is given.
The aforementioned resolution does not empower the directors to issue shares for cash.
NOTES TO THE NOTICE OF ANNUAL GENERAL MEETING
Quorum for all resolutions The quorum for all resolutions is sufficient persons being
present to exercise, in aggregate, at least 25% of all of the voting rights, subject to three shareholders being present at the meeting.
Record date The record date for the purpose of determining which
shareholders of the Company are entitled to receive Notice of this Annual General Meeting is Friday, 16 October 2015 and the record date for purposes of determining which shareholders of the Company are entitled to participate in and vote at the Annual General Meeting is Friday, 20 November 2015. Accordingly, only shareholders who are registered in the register of members of the Company on Friday, 13 November 2015 will be entitled to participate in and vote at the Annual General Meeting.
Electronic participation Should any shareholder (or any proxy for a shareholder)
wish to participate in the annual general meeting by way of electronic participation, that shareholder should make application in writing (including details as to how the shareholder or its representative (including its proxy) can be contacted) to so participate to the transfer secretary, Computershare Investor Services (Proprietary) Limited, at its address below, to be received by the transfer secretary at least five business days prior to the annual general meeting in order for the transfer secretary to arrange for the shareholder (or its representative or proxy) to provide reasonably satisfactory identification to the transfer secretary for the purposes of section 63(1) of the Companies Act, and for the transfer secretary to provide the shareholder (or its representative) with details as to how to access any electronic participation to be provided. The company reserves the right to elect not to provide for electronic participation at the annual general meeting in the event that it determines that it is not practical to do so. The costs of accessing any means of electronic participation provided by the company will be borne by the shareholder so accessing the electronic participation.
Voting and proxies Shareholders are reminded that:
• ashareholderentitledtoattendandvoteattheannualgeneral meeting may appoint a proxy (or more than one proxy) to attend, participate in and vote at the annual general meeting in the place of the relevant shareholder.;
• aproxyholderneednotalsobeashareholderofthecompany.
• intermsofsection63(1)oftheCompaniesAct,anyperson attending or participating in a meeting of shareholders must present reasonably satisfactory identification and the person presiding at the meeting must be reasonably satisfied that the right of any person to participate in and vote (whether as shareholder or as proxy for a shareholder) has been reasonably verified.
For the convenience of certificated Shareholders and dematerialised shareholders with “own-name” registration, a form of proxy is attached hereto. Duly completed forms of proxy must be lodged with the transfer secretary at either of the below addresses not less than 48 hours before the commencement of the annual general meeting (or any adjournment of the annual general meeting) or handed to the Chairman of the annual general meeting before the appointed proxy exercises any of the relevant shareholder’s rights at the annual general meeting (or any adjournment of the annual general meeting), provided that should a shareholder lodge a form of proxy with the

77
OR
ION
RE
AL E
STATE LTD
A
NN
UA
L RE
PO
RT 2
015
transfer secretary at either of the below addresses by not later than 48 hours before the annual general meeting, such shareholder will also be required to furnish a copy of such form of proxy to the Chairman of the annual general meeting before the appointed proxy exercises any of such shareholder’s rights at the annual general meeting (or any adjournment of the annual general meeting).
Dematerialised shareholders without “own-name” registration who wish to attend the annual general meeting in person should request their CSDP or Broker to provide them with the necessary letter of representation in terms of their custody agreement with their CSDP or Broker. Dematerialised Shareholders without “own- name” registration who do not wish to attend but wish to be represented at the annual general meeting must advise their CSDP or Broker of their voting instructions. Dematerialised shareholders without “own-name” registration should contact their CSDP or Broker with regard to the cut-off time for their voting instructions.
By order of the Board
CORPORATE GOVERNANCE FACILITATORS CC CHARTERED SECRETARIES
Company Secretary to Orion Real Estate Limited
16 October 2015

78
OR
ION
RE
AL
EST
ATE
LTD
A
NN
UA
L R
EP
OR
T 2
015

79
OR
ION
RE
AL E
STATE LTD
A
NN
UA
L RE
PO
RT 2
015
For the use of members who hold certificated shares and members who have dematerialised their shares in “own name” registrations.
FOR THE ANNUAL GENERAL MEETING TO BE HELD ON WEDNESDAY, 25 NOVEMBER 2015 AT 10:00I/We
of
being a member/members of Orion Real Estate Limited and entitled to votes do hereby appoint or failing him/her, or failing him/her, the chairman of the meeting as my/our proxy to act for me/us at the Annual General Meeting of the company to be held on Wednesday, 25 November 2015 at 10h00 and at any adjournment thereof, in the boardroom, 16th floor, Orion House, 49 Jorissen Street, Braamfontein, Johannesburg, and to vote for me/us in respect of the undermentioned resolutions in accordance with the following instructions.
Number of votes(one vote per share)
For Against Abstain
1. Ordinary resolution number one: Auditor’s report
2. Ordinary resolution number two: Adoption of annual financial statements
3. Ordinary resolution number three: Re-election of director: Mr MDK Mthembu
4. Special Resolution number one: Remuneration of non-executive directors
5. Special resolution number two: financial assistance in terms of section 45 of the Companies Act
6. Ordinary resolution number four: Appointment of auditor
7. Ordinary resolution numbers five and six: By separate resolutions, to appoint the following members to the audit committee
7.1. Ordinary resolution number five: Mr MDK Mthembu
7.2 Ordinary resolution number six: MR RS Wilkinson
8. Ordinary resolution number seven: Non-binding shareholders’ vote in favour of the company’s remuneration policy
9. Ordinary resolution number eight: Authority to issue shares. Not applicable to issues of shares for cash
Signed at on 2015
Signature Assisted by me (where applicable – see note 7)
A member qualified to attend and vote at the meeting is entitled to appoint a person to attend, speak and vote in his/her stead. A proxy holder need not be a member of the company.
ORION REAL ESTATE LIMITED(Incorporated in the Republic of South Africa) (“the company”)Registration Number 1997/021085/06 ISIN: ZAE 000075651 JSE Code: ORE
80
OR
ION
RE
AL
EST
ATE
LTD
A
NN
UA
L R
EP
OR
T 2
015
Members holding certificated shares or dematerialised shares registered in their own name.
1. Only members who hold certificated shares and members who have dematerialised their shares in “own name” registrations may make use of this proxy form.
2. Each such ordinary member is entitled to appoint one or more proxyholders (none of whom needs to be a member of the company) to attend, speak and, on a poll, vote in place of that member at the annual general meeting, by inserting the name of a proxy or the names of two alternate proxies of the ordinary member’s choice in the space provided, with or without deleting “the chairman of the meeting”. The person whose name appears first on the form of proxy and who is present at the annual general meeting will be entitled to act as proxy to the exclusion of those whose names follow.
3. A member’s instructions to the proxyholder must be indicated by the insertion of the relevant number of votes exercisable by that member in the appropriate box/es provided. Failure to comply with the above will be deemed to authorise the chairman of the meeting, if he is the authorised proxyholder, to vote in favour of the resolutions, or any other proxy to vote or to abstain from voting at the annual general meeting, as he deems fit, in respect of all the member’s votes.
4. A member or his or her proxy is not obliged to vote in respect of all the shares held or represented, but the total number of votes for or against the resolutions in respect of which any abstention is recorded may not exceed the total number of votes to which the ordinary member or his proxy is entitled.
5. Any power of attorney and any instrument appointing a proxy or other authority (if any) under which it is signed, or a notarially certified copy of such power of attorney shall be deposited at the office of the transfer secretaries by not less than 48 (forty eight) hours before the time appointed for holding the annual general meeting.
6. The completion and lodging of this form of proxy will not preclude the relevant member from attending the annual general meeting and speaking and voting in person thereat to the exclusion of any proxyholder appointed.
7. Where there are joint holders of ordinary shares any one holder may sign the proxy form. The vote of only one holder in order of seniority (determined by sequence of names on the company register) will be accepted, whether in person or by proxy, to the exclusion of the vote(s) of other joint holders.
8. Members should lodge or post their completed proxy forms to:
Computershare Investor Services (Proprietary) Limited
HAND DELIVERIES: Ground floor, 70 Marshall Street, Johannesburg. 2000
OR POSTAL DELIVERIES: P O Box 61051 MARSHALLTOWN, 2107
by not later than 48 hours before the annual general meeting. Proxies not deposited timeously shall be treated as invalid.
MEMBERS HOLDING DEMATERIALISED SHARES9. Members who have dematerialised their shares through a Central Securities Depository Participant (CSDP) or broker
(except those members who have elected to dematerialise their shares in “own name” registrations) and all beneficial members holding their shares (dematerialised or certificated) through a nominee should provide such CSDP, broker or nominee with their voting instructions in sufficient time to allow them to advise the transfer secretaries of the Company of their voting instructions before the closing time set out in 8 above.
10. All such members wishing to attend the annual general meeting in person may do so only by requesting their CSDP, broker or nominee to issue the member with a letter of representation in terms of the custody agreement. Such letter of representation must also be lodged with the transfer secretaries before the closing time set out in 8 above.


82
OR
ION
RE
AL
EST
ATE
LTD
A
NN
UA
L R
EP
OR
T 2
015
www.oriongroup.co.za
Orion Real Estate LimitedOrion House 49 Jorissen Street
Braamfontein Johannesburg South Africa