orion network performance monitor - tech data · pdf fileorion network performance monitor ......
TRANSCRIPT

Orion Network Performance Monitoravailability & performance management for your data center network
We know that keeping up with all the new
technologies and changes in your IT environment is a
challenge—especially as data center networks move
beyond traditional LAN/WAN switching and routing
to a true network fabric that incorporates physical
devices, virtual networks and proprietary networking.
All the while, virtualized data center and private cloud
initiatives are piling on top of the need to deliver
100% availability of a constantly changing network—
and often with no additional resources to help. How
can you possibly keep up?
We know the challenges you face, because we’re
network engineers and system administrators just like
you. We know what it takes to manage complex, evolving networks and data centers. In fact, we pooled all of
our “what if’s” to design Orion Network Performance Monitor (NPM)— a powerful, yet easy-to-use, network
availability and performance management solution that delivers the critical information you need to stay on
top of your evolving network.
Orion NPM enables you to quickly detect, diagnose, and resolve network performance problems and
outages—before you start getting calls asking if the network is down. And Orion NPM is the easiest product
of its kind to deploy, use, and maintain. That means you can spend your time actually managing your network,
not supporting your network management software. Plus, with one-hour, do-it-yourself deployment, you’ll
be monitoring immediately, instead of filling out statements of work for more consultants. See how easy
network management can be with Orion NPM!
Orion NPM Highlights:• Monitors and analyzes real-time, in-depth, network performance statistics for routers, switches,
wireless access points, servers, and any other SNMP-enabled devices
• Monitors VMware® servers and automatically tracks VM performance through vCenter™
• Monitors virtualized Cisco® Nexus 1000V switches with the same ease as physical servers
• Monitors VSAN and Fibre Channel performance issues with real-time, threshold-based alerting
and reports that show VSAN health
• Simplifies the management of your Cisco Unified Computing System™ (UCS) components by
providing a single unified view of your data center network health
• Allows you to quickly view the status of your core IT services and data center through refined
alerting that dynamically groups related systems and devices
• Delivers alerts on real issues by enabling advanced network alerting dependencies for correlated
events, sustained conditions, and complex combinations of device states
Simplify your Network Performance Monitoring“I have continued to watch this
product evolve since version 7.0 and have always found
the interface and built in tools helpful and well thought out. The
drill downs into more detailed reports on interfaces, nodes and
resources have made this product a mainstay in the network...
Definitely the best NPM product I have ever worked with.”
- eusbreeves posted on solarwinds.com
NetFlow Traffic Analyzer | Orion Module
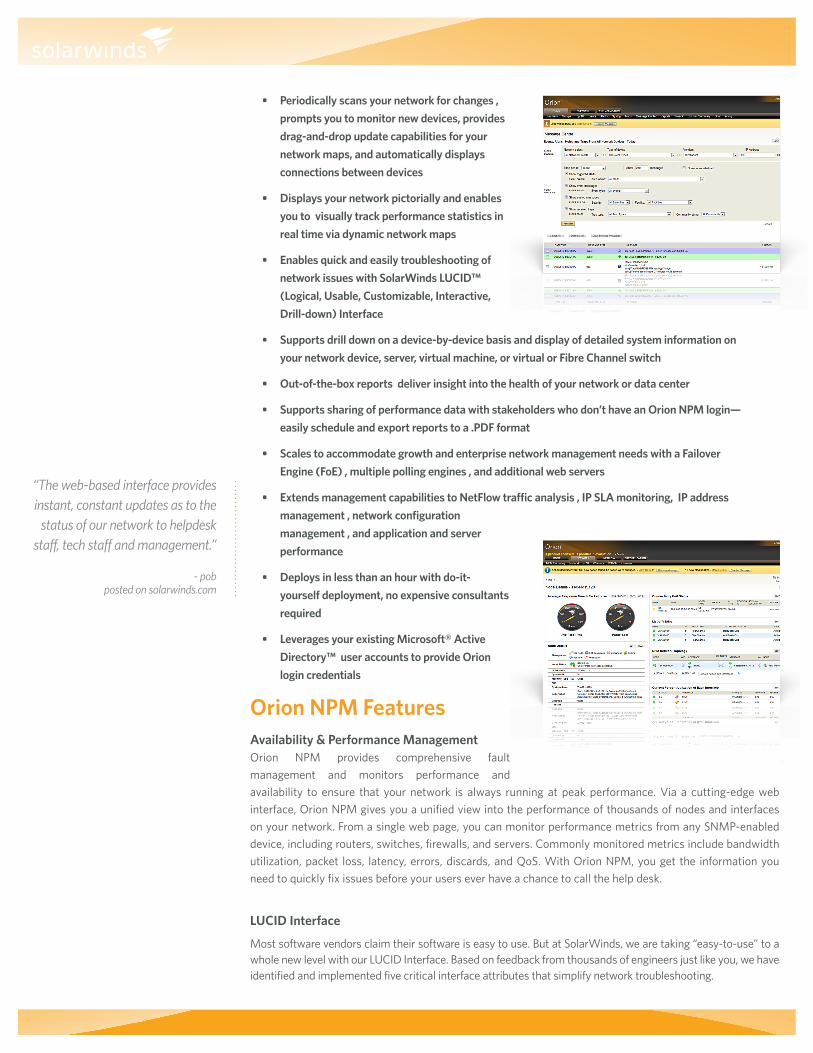
• Periodically scans your network for changes ,
prompts you to monitor new devices, provides
drag-and-drop update capabilities for your
network maps, and automatically displays
connections between devices
• Displays your network pictorially and enables
you to visually track performance statistics in
real time via dynamic network maps
• Enables quick and easily troubleshooting of
network issues with SolarWinds LUCID™
(Logical, Usable, Customizable, Interactive,
Drill-down) Interface
• Supports drill down on a device-by-device basis and display of detailed system information on
your network device, server, virtual machine, or virtual or Fibre Channel switch
• Out-of-the-box reports deliver insight into the health of your network or data center
• Supports sharing of performance data with stakeholders who don’t have an Orion NPM login—
easily schedule and export reports to a .PDF format
• Scales to accommodate growth and enterprise network management needs with a Failover
Engine (FoE) , multiple polling engines , and additional web servers
• Extends management capabilities to NetFlow traffic analysis , IP SLA monitoring, IP address
management , network configuration
management , and application and server
performance
• Deploys in less than an hour with do-it-
yourself deployment, no expensive consultants
required
• Leverages your existing Microsoft® Active
Directory™ user accounts to provide Orion
login credentials
Orion NPM FeaturesAvailability & Performance ManagementOrion NPM provides comprehensive fault
management and monitors performance and
availability to ensure that your network is always running at peak performance. Via a cutting-edge web
interface, Orion NPM gives you a unified view into the performance of thousands of nodes and interfaces
on your network. From a single web page, you can monitor performance metrics from any SNMP-enabled
device, including routers, switches, firewalls, and servers. Commonly monitored metrics include bandwidth
utilization, packet loss, latency, errors, discards, and QoS. With Orion NPM, you get the information you
need to quickly fix issues before your users ever have a chance to call the help desk.
LUCID Interface
Most software vendors claim their software is easy to use. But at SolarWinds, we are taking “easy-to-use” to a whole new level with our LUCID Interface. Based on feedback from thousands of engineers just like you, we have identified and implemented five critical interface attributes that simplify network troubleshooting.
“The web-based interface provides instant, constant updates as to the
status of our network to helpdesk staff, tech staff and management.”
- pob posted on solarwinds.com

model manages:SL100 Up to 100 elements
SL250 Up to 250 elements
SL500 Up to 500 elements
SL2000 Up to 2000 elements
SLX Unlimited elements
“[Orion] just keeps getting better with each release.”
- Psykobmbor posted on solarwinds.com
• Logical – The SolarWinds LUCID interface presents network performance information in a logical and intuitive manner to help you quickly make informed decisions about your network. The interface precisely presents the information you need to quickly determine if your network is suffering from poor performance.
• Useable – Orion NPM provides a tremendous breadth of information in every view, yet the interface is very useable. Administrator tasks have all been designed to allow you to maintain the Orion system with just a few clicks of your mouse.
• Customizable – Rearrange Web resources, Top 10 views, modify time periods, and customize resources to meet your specific network environment. Easily tailor Orion’s maps to match so you can quickly discover any performance related issues.
• Interactive – Orion automatically updates your network’s latest performance indicators to help you quickly determine if any network issues could potentially impact users.
• Drill-down – View detailed information on virtually every device, performance indicator, and status link by simply drilling into respective hot performance indicators.
ConnectNow™ Topology MappingOrion NPM’s Network Atlas™ automatically maps
your network, allowing you to view your network
pictorially and visually track performance statistics
in real time via dynamic network maps. With
our exclusive ConnectNow technology, you can
automatically discover and display the connections
between network devices on your maps. Choose
from several built-in geographic map templates or
import a logical image of your own network based
on floor, building, department, or larger geographic
location. Multiple network maps can also be nested
to provide drill-down capabilities.
Conditional Group DependenciesOrion’s Conditional Group Dependencies allows you to intelligently define relationships between connected
devices and/or interfaces. These dependencies allow you to receive a single critical alert if your core router
goes down instead of an onslaught of hundreds of alerts for each of the connected devices and interfaces
that are also down.
Dynamic Service GroupsSimplify monitoring for large and complex IT environments by logically grouping network devices, interfaces,
servers or volumes. With dynamic service groups, you can monitor and aggregate views of servers, routers,
switches, interfaces and other dynamic groups by service (E-mail), location, department or manufacturer.
Message CenterThe Orion Message Center is your central view for all of the notification messages about your network
performance. This consolidated view allows you to quickly troubleshoot network performance issues by
analyzing SNMP trap and Syslog data from a single interface, instead of by polling various machines. Events
Orion NPM Modules:
• Application Performance Monitor
• IP Address Manager
• NetFlow Traffic Analyzer
• IP SLA Manager
• Network Configuration Manager
Orion NPM modules extend the
capabilities of Orion NPM to network
traffic analysis, VoIP infrastructure
monitoring, IP address management,
application monitoring, network
config management, and server and
application monitoring.
System RequirementsCPU Speed: 3.0 GHz; Hard Drive
Space: 20 GB; Memory: 3 GB;
Operating System: Windows 2003
and 2008 Server (32-bit or 64-
bit) including R2, with IIS installed,
running in 32-bit mode; .NET 3.5
Framework; Database: SQL Server
2005 SP1 / 2008 (Express, Standard,
or Enterprise)
and alerts are also routed to this interface, allowing
you to perform manual event correlation and basic
root cause analysis.
Enterprise ScalabilityOrion NPM ensures that your network will never
outgrow your management solution. As a highly
scalable, enterprise network management platform,
Orion NPM can accommodate network growth
through the addition of multiple polling engines,
additional web servers, and an enterprise operations
console.
Advanced AlertingOrion NPM enables you to quickly and easily configure powerful network alert engines to respond to
hundreds of different network scenarios, including multiple condition checks. These network alerts help you
recognize and correct issues before your users experience performance degradation or availability issues.
With alerting support for correlated events and sustained conditions, Orion NPM ensures that you don’t get
paged at 3am unless there is a critical issue. Additionally, Orion NPM can automatically escalate network
alerts until a problem is resolved.
Integrated Wireless PollerWhile we all love the convenience of wireless, managing this technology can give you a headache like no
other! Trying to monitor, secure, and support the multitude of wireless devices on the market today is a
nearly impossible task… unless, of course, you have Orion NPM. Orion NPM’s Integrated Wireless Poller
enables you to easily manage wireless thin and autonomous access points and their associated clients. Orion
NPM can monitor your wireless devices alongside your wired devices and provide you with alerts, reports,
and Top 10 lists for your wireless infrastructure!
Universal Device PollerOut of the box, Orion NPM ships with a MIB database that covers the vast majority of common network
devices. But for that handful of odd devices that are lurking in your network—or for newer devices that have
MIB tables—you can now collect valuable and highly detailed management data. Orion NPM makes it easy
to create a custom poller to monitor any SNMP-enabled device value that has a MIB, including virtually any
statistic that a network device records. You can also customize how you want the collected data displayed
for graphing, alerting, and reporting purposes. And, using the MIB Transformation Wizard, you can convert
MIB values into the units of measurement that are most useful to you.
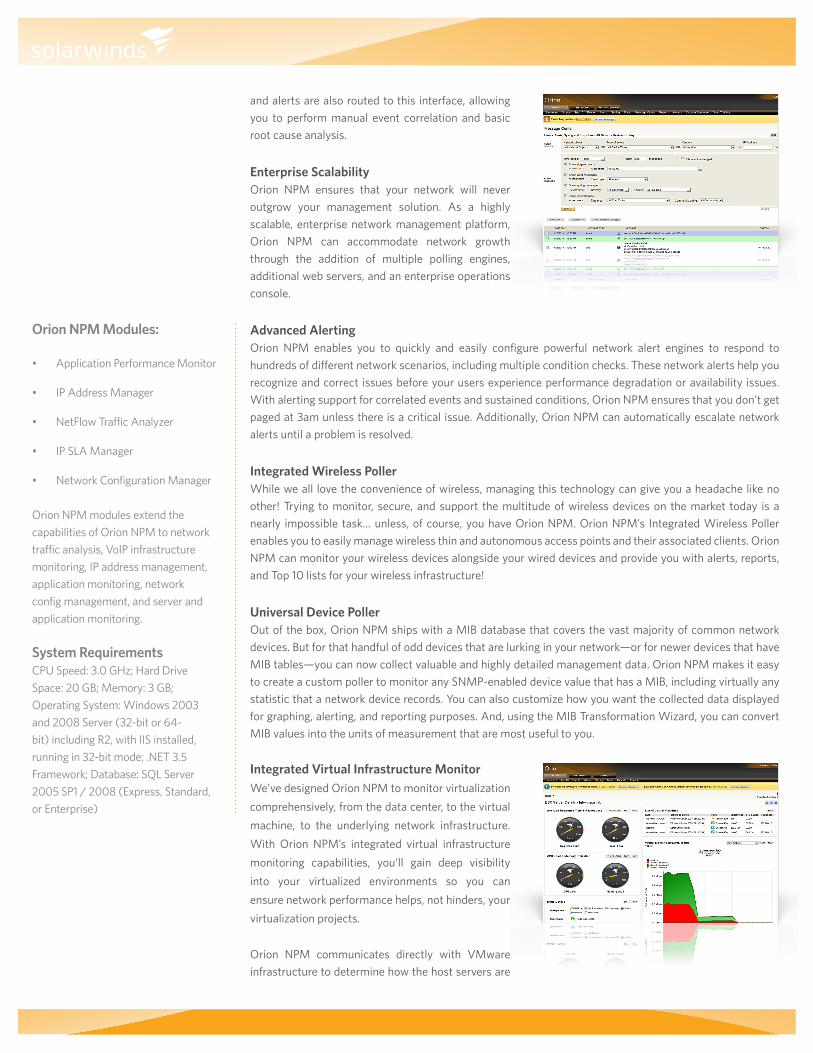
Integrated Virtual Infrastructure MonitorWe’ve designed Orion NPM to monitor virtualization
comprehensively, from the data center, to the virtual
machine, to the underlying network infrastructure.
With Orion NPM’s integrated virtual infrastructure
monitoring capabilities, you’ll gain deep visibility
into your virtualized environments so you can
ensure network performance helps, not hinders, your
virtualization projects.
Orion NPM communicates directly with VMware
infrastructure to determine how the host servers are

performing and to gauge the health of individual virtual machines. Information is rolled up at each of the
hierarchical layers (vCenter -> Data Center -> Clusters -> Hosts -> VMs), so you can quickly determine
if your virtualized infrastructure is performing poorly. You’ll gain insight into statistics such as CPU and
memory utilization, disk usage, guest OS, network usage, effective CPU load, and more—making it easy to
ensure that applications are performing well and that the virtual and physical resources on the server are
optimized.
Mobile ViewsWith Orion NPM’s new Mobile Views, you can monitor your network performance from popular mobile web
browsers including iPhone®, Blackberry®, and Android™ allowing you to unchain yourself from your desk
and work station.
Report WriterOrion NPM’s advanced reporting engine enables you to quickly generate custom network reports that can be
exported to pdf, printed or viewed on the web. Shipping with numerous built-in reports, Orion NPM makes it
easy to report on performance data over specific time periods or by network segment.
Microsoft Active Directory IntegrationLeverage your existing Microsoft Active Directory user accounts and groups to allow users to log into Orion
using custom username/password or optionally use AD pass-through login to bypass the login screens
altogether. As an administrator, you can customize each account or group and specify which types of
information are displayed within the Orion interface for a particular department, group, or user. This ensures
that only the people who need to view specific information have access to it, providing an increased level of
internal security.
VSAN SummaryWith dedicated views into VSAN devices, you’ll
be able to quickly see how much traffic is passing
through each device and interface, which ports
belong to which VSANs, what type of media the
devices are leverage, and much more. Threshold
based alerting allows you to get ahead of any VSAN
performance issues so you’re the first to find out (and
fix) any issues before users start complaining.
Cisco Unified Computing System (UCS) SupportBy uniting computing, networking, storage access and virtualization into a next generation data center
platform, Cisco’s Unified Computing System (UCS) revolutionizes the virtualized environment. Orion
Network Performance Monitor (NPM) simplifies the management of your Cisco Unified Computing System
(UCS) components by providing a single unified view of your data center network health.
Community Content ExchangeHave you discovered thwack, the SolarWinds community for IT pros? The useful information, tools and other
valuable resources on thwack are now directly integrated into Orion NPM’s interface. By deploying Orion
NPM and using thwack, you’ll be joining a community of thousands of network engineers who can help make
your job easier. Having the power of thousands of engineers behind you brings many benefits, especially
when it comes to sharing resources. On thwack, Orion customers share everything from custom reports,
custom alerts, and custom views to application monitoring templates.

© 2010 SolarWinds, Inc. All rights reserved. SolarWinds®, the SolarWinds logo, ipMonitor®, LANsurveyor®, and Orion® are among the trademarks or registered trademarks of the company in the United States and/or other countries. All other trademarks are property of their respective owners.
For additional information, please contact SolarWinds at 866.530.8100 or e-mail [email protected]. To locate an international reseller near you, visit www.solarwinds.com/distributor/locator.html
Automated Network DiscoveryMaintaining a real-time list of network devices is no small task for today’s dynamic networks. It’s hard to
keep track of your multiplying numbers of network devices, which is why we’ve designed Orion NPM’s
Network Sonar to automatically discover new devices that are added to your network. When new devices
are discovered, Network Sonar checks your existing SNMP credentials and prompts you to begin monitoring
the new devices. You can also leverage the built-in Network Atlas to quickly create and update your network
maps and display connections to the new devices, ensuring your network maps are always up to date.
Cisco EnergyWise MonitoringCisco EnergyWise focuses on reducing the energy
consumption of all devices connected to a Cisco
network ranging from Power over Ethernet (PoE)
devices, such as IP phones and wireless access
points, to IP-enabled building and lighting controllers.
EnergyWise technology gives you a framework for
discovering, monitoring, optimizing, advising, and
regulating energy needs for your business. Cisco
EnergyWise encompasses a highly intelligent,
network-based approach to communicate messages
that control energy between network devices and
endpoints.
Role-Based Access ControlOrion NPM allows you to establish unique accounts and specify which types of information are displayed
within the Orion interface for a particular department, group, or user. This ensures that only the people who
need to view specific information have access to it, providing an increased level of internal security. For
example, Orion NPM can be configured so that the server team only sees the servers, while the Texas IT
group has a view limited to the geography for which they are responsible.
Do-it-Yourself DeploymentDeploying Orion NPM is a simple three-step process. First, install and configure Orion NPM using a simple
wizard interface. Next, let Orion NPM automatically discover your network. Finally, begin monitoring your
network for fault and performance issues. You’ll be done in less than an hour. No consultants required. Even
better, with Orion NPM’s intuitive web interface, you won’t need to attend training classes, read books with
large animals on the cover, or pour through manuals to start being productive with Orion NPM from day one.