origination and extinction components of taxonomic
TRANSCRIPT

q 2000 The Paleontological Society. All rights reserved. 0094-8373/00/2604-0003/$1.00
Paleobiology, 26(4), 2000, pp. 578–605
Origination and extinction components of taxonomic diversity:Paleozoic and post-Paleozoic dynamics
Mike Foote
Abstract.—Changes in genus diversity within higher taxa of marine animals on the temporal scaleof a few million years are more strongly correlated with changes in extinction rate than with chang-es in origination rate during the Paleozoic. After the Paleozoic the relative roles of origination andextinction in diversity dynamics are reversed. Metazoa as well as individual higher taxa shift fromone mode of diversity dynamics to the other. The magnitude of taxonomic rates, the relative var-iance of origination and extinction rates, and the presence or absence of a long-term secular in-crease in diversity all fail to account for the shift in importance of origination and extinction indiversity changes. Origination and extinction rates both tend to be diversity-dependent, but dif-ferent modes of diversity-dependence may contribute to the change in diversity dynamics from thePaleozoic to the post-Paleozoic. During the Paleozoic, there is a weak tendency for extinction ratesto be more diversity-dependent than origination rates, whereas after the Paleozoic the two ratesare about equally diversity-dependent on average.
Mike Foote. Department of the Geophysical Sciences, University of Chicago, Chicago, Illinois 60637.E-mail: [email protected]
Accepted: 21 June 2000
Components of Diversity Change duringthe Phanerozoic
How does variation in diversity during thehistory of life depend on variation in origi-nation and extinction rates? Any change intaxonomic diversity necessarily implies a dif-ference between origination and extinctionrates, but by itself it says nothing about themagnitude of the rates or how they may havechanged individually. Although diversity canchange if the underlying taxonomic rates areconstant, these rates in fact appear to havefluctuated considerably over the scope of thePhanerozoic (Raup and Sepkoski 1982; VanValen 1984; Raup 1991; Foote 1994; Sepkoski1998). The central question I will address con-cerns the relationship between these fluctua-tions in origination and extinction rate and thecorresponding changes in diversity. Does di-versity change tend to result more fromchange in origination rate or change in extinc-tion rate, or is there no systematic pattern? Theanswer has obvious implications for diversitydynamics (Alroy 1998). For example, onecould imagine an extreme case in which ex-tinction rate within a clade is approximatelyconstant, perhaps for intrinsic biological rea-sons, while origination rate varies as a result
of evolutionary innovations and ecological op-portunities (Walker and Valentine 1984; Gil-insky and Bambach 1987). In such a case, mostof the variation in diversity within a cladewould be attributable to variation in origina-tion rate. Conversely, if variation in diversityis correlated primarily with variation in ex-tinction rate, this might imply a characteristicrate of origination that is offset by externalperturbations leading to extinction.
Whether temporal variation in diversitymore clearly reflects variation in originationrate or variation in extinction rate is likely tobe related to temporal and taxonomic scale.Some analyses of extant clades that are a fewmillion years old have suggested that recon-structed branching patterns are best explainedby a model in which there is no extinction(Hey 1992), although simulation studies haveshown that it may be difficult to identify pastextinction when only living representatives ofthe clade are studied (Hey et al. 1998; cf. Raup1983; Nee et al. 1995; Harvey and Rambaut1998). At the scale of animals as a whole overthe Phanerozoic, there has been a net diversityincrease since the Paleozoic, implying an in-crease in the difference between originationand extinction rates, but this increase has beenaccompanied by a decline in both rates (Raup
579DIVERSITY DYNAMICS
and Sepkoski 1982; Van Valen 1984). At thelevel of classes and orders over hundreds ofmillions of years, these higher taxa tend to ex-perience a secular decline in family origina-tion rate, but extinction rate may be relativelystationary (Van Valen 1985a; Van Valen andMaiorana 1985; Gilinsky and Bambach 1987).Thus, the long-term diversity history of manygroups seems to be attributable to changes inorigination rate rather than extinction rate.There is considerable variation in rate super-imposed on these secular trends, however. Itis this finer-scale variation on which I will fo-cus. Analysis of genera and families withinhigher taxa suggests that variation in extinc-tion rate was more important than variation inorigination rate in determining diversitychanges during the Paleozoic and that the rel-ative importance of extinction and originationreversed from the Paleozoic to the Mesozoic.
Note that the question of temporal variationwhich I address is distinct from that of vari-ation among biologic groups. A few studieshave attempted to factor differential diversi-fication of related taxa into origination and ex-tinction components. For example, Cheethamand Jackson (1996) suggested that two coevalgenera of cheilostome bryozoans have hadsimilar histories of origination, and that thedifference in their respective species richnessis therefore due to a difference in extinctionrate. Conversely, Van Valen (1973) comparedartiodactyl and perissodactyl mammals andfound similar extinction rates, suggesting thatthe greater diversity of artiodactyls is attrib-utable to a higher origination rate. Another re-lated question concerns the relative impor-tance of stages of allopatric speciation in netrates of origination. Allmon (1992) has co-gently argued that differences in speciationrate may be better understood mechanisticallyif one investigates differences in rates of iso-late formation, isolate persistence, and isolatedivergence.
Data and Methods
I analyzed stratigraphic range data fromSepkoski’s unpublished compendium ofPhanerozoic marine animal genera (see Sep-koski 1996b, 1997, 1998 for a description of thedata). By dividing and combining standard
stratigraphic stages and series, I split thePhanerozoic into 107 intervals in an attempt tominimize the variance in estimated intervallength; the mean interval duration is 5.1 m.y.,with a standard deviation of 1.7 m.y. I alsoused an alternative subdivision of the Phan-erozoic (see Sepkoski 1996b; Foote and Sep-koski 1999) and found the results to be con-sistent. The timescale is mainly that of Har-land et al. (1990), with some modifications forthe lower Paleozoic based on the timescales ofTucker and McKerrow (1995) and Bowringand Erwin (1998). I will argue that inaccura-cies in absolute dating are not responsible forthe results presented here. All told, I included25,049 fossil genera whose first and last oc-currences could both be fully resolved to oneof the 107 intervals. Of these, 13,302 (53.1%)have ranges that span more than one intervaland thus could be used for analysis, as ex-plained below. I included extant genera thathave a fossil record. I will show that excludingthem to remove potential biases resultingfrom nearly complete knowledge of the livingfauna has a relatively small effect on the re-sults. In addition to analyzing the data as awhole, I analyzed subsets corresponding tothe more diverse phyla, classes, and orders.
I measured diversity as the number of gen-era known to cross interval boundaries (Ray-mond and Metz 1995; Alroy 1996, 1998; Bam-bach 1999). This provides an estimate of in-stantaneous standing diversity that does notincrease systematically with interval lengthand that, by ignoring single-interval genera, isnot expected to be as sensitive to variation inpreservation rate as is the total number of gen-era known from an interval (Pease 1985; Sep-koski 1990, 1993, 1996b, 1997, 1998; Buzas andCulver 1994, 1998; Raymond and Metz 1995;Harper 1996; Alroy 1996, 1998; Bambach 1999;Foote 2000). Diversity was measured on a log-arithmic scale in order to monitor proportion-al change (Sepkoski 1991), but results are sim-ilar if an arithmetic scale is used.
For each interval, I estimated extinction rate(q i) per lineage-million-years (Lmy) based onthe proportion of genera present at the start ofan interval that survived at least to the end ofthe interval. Similarly, I estimated originationrate (pi) per Lmy based on the proportion of

580 MIKE FOOTE
genera present at the end of an interval thathad already originated by the start of the in-terval. Thus, q̂i 5 2ln[(Nbt)/Nb]/Dt and p̂i 52ln[(Nbt)/Nt]/Dt, where Nb is the total num-ber of genera that cross the bottom intervalboundary, Nt is the total number of genera thatcross the top interval boundary, Nbt is thenumber of genera that cross both boundaries,and Dt is the duration of the interval (Foote1999: Appendix 7; Foote 2000). Although p̂i
and q̂i are estimates of the true values pi andqi, for simplicity I will hereinafter refer tothese estimates as pi and qi. These rate esti-mates satisfy the requirements of branchingtheory that Nbt 5 , Nbt 5 and2q Dt 2p Dti iN e N e ,b t
Nt 5 (Kendall 1948; Raup 1985). A(p 2q )Dti iN eb
temporal sequence of rates therefore fully de-termines the temporal sequence of diversity.Note that the estimates are for average ratesthrough an interval; the method of estimationdoes not assume that rates are constant withinan interval.
The diversity measure and rate estimatesignore single-interval genera, a procedure thathas been advocated by a number of paleon-tologists as a means of reducing the effects ofincomplete and variable preservation (Pease1985; Sepkoski 1990, 1993, 1996b, 1997, 1998;Alroy 1996, 1998; Harper 1996; Foote andRaup 1996; Foote 1997). The metrics I use arenot simply ad hoc corrections, however. Theyderive from explicit, if simplified, modeling ofevolution and preservation, and can be shownto be relatively insensitive to incomplete pres-ervation under a range of conditions (Foote2000). The rationale behind developing diver-sity and rate measures that ignore single-in-terval taxa is not that such taxa must be arti-facts; surely some were truly restricted to sin-gle intervals. Rather, it is that the relative fre-quency of single-interval taxa is affecteddisproportionately by incomplete preserva-tion (Sepkoski 1993; Foote and Raup 1996;Foote 1997, 2000). (Although the term singletonhas been used to refer to species known froma single specimen [Buzas and Culver 1994,1998], hereinafter I will use the term to referto any taxon confined to a single stratigraphicor temporal interval [Alroy 1998].)
One potential result of the observed over-abundance of singletons is of special concern
in this study. Rate metrics that include single-tons assign these taxa to both the originationand extinction tabulations for a given interval.If the number of singletons fluctuates artifi-cially as a result of varying quality of preser-vation, then a spurious correlation betweenorigination and extinction rates may result.This can be shown theoretically (Foote 2000);it has also been shown empirically for Ceno-zoic mammals (Alroy 1996, 1998). Such a spu-rious correlation could make it difficult to sep-arate diversity changes into their originationand extinction components. Singletons wouldnot present such a problem if origination andextinction rates were equal within a given in-terval, since estimates of both rates would beaffected equally. If the rates differ, however,the lower rate estimate is affected dispropor-tionately. Rate estimates can be artificially cor-related even with metrics that ignore single-tons (Holland 1995; Holland and Patzkowsky1999), but the effect is stronger when single-tons are included (Foote 2000). Although var-iable preservation may obscure patterns ofcorrelation between change in diversity andchange in origination and extinction rates, itaffects both rate metrics, and there is no ob-vious reason to think that it would act in a bi-ased way to produce the Paleozoic/post-Pa-leozoic difference documented herein.
Because there are long-term secular trendsin diversity and taxonomic rates, it is useful toanalyze the short-term variation in the datawith first differences. For each interval, thechange in diversity DDi was calculated as thelogarithm of standing diversity at the end ofthe interval minus the log of standing diver-sity at the start of the interval. Intervals inwhich diversity did not change were exclud-ed, but, because relatively few intervals lack adiversity change, the results are similar if theyare included. The change in origination rateDpi was calculated as , provided thatp 2 pi i21
and are both defined. (Rate estimates arep pi i21
undefined in the few cases where no genera ofa given group range through the entire inter-val, usually the first interval of a group’s ex-istence or the last interval for an extinctgroup.) Likewise, Dqi was calculated as q 2i
.qi21
To reduce the effect of outliers and other

581DIVERSITY DYNAMICS
FIGURE 1. Comparison between change in diversityand change in per-capita origination rate (A) and ex-tinction rate (B) for Phanerozoic marine animal genera.Partial correlation between change in diversity andchange in origination rate is positive but weak (t(DD,Dp)·Dq
5 0.190), while the correlation is negative for extinctionrate (t(DD,Dq)·Dp 5 20.264). Overall, the extinction corre-lation is stronger, suggesting that more of the variationin diversity changes is attributable to variation in ex-tinction rate than origination rate. Intervals labeled inthis and the next four figures are those that fall morethan two standard deviations from the mean. Abbrevi-ation: UMCm, Upper Middle Cambrian (sensu Sepkoski1978). Other abbreviations are for standard stages andseries.
problematic aspects of data distribution, Iused a nonparametric correlation coefficient,Kendall’s t. There is often a correlation (some-times positive, sometimes negative) betweenDp and Dq in the data analyzed here. It is notclear to what extent this is noise, to what ex-tent it is a biological signal (Webb 1969; Markand Flessa 1977), and to what extent it couldreflect an artifact of variable preservation, er-rors in absolute dating, or pseudoextinctionand pseudo-origination, nuisances that affectboth rates similarly. Whatever the cause, it hasthe potential to affect patterns of correlation.I therefore measured the strength of the as-sociation between DD and Dp and between DDand Dq using partial correlations, t(DD,Dp)·Dq andt(DD,Dq)·Dp. In some cases partial correlations re-veal structure in the data that may not be ev-ident otherwise (Figs. 1A, 2A). The use of par-tial correlations is not without its own risks,however. If the two correlations that one is at-tempting to factor out are nonexistent, so thattheir estimates represent noise distributedaround zero, then it is possible for the corre-lation of interest to be inflated when the othersare partialed out. In this study, however, theresults are consistent if raw correlations areused. Moreover, if there were no difference be-tween the Paleozoic and post-Paleozoic, theartificial inflation of apparent correlationsshould affect both broad intervals of time inthe same way.
Relative Importance of Origination andExtinction
Changes in diversity, origination, and ex-tinction are shown in Fig. 1 for all data overthe entire Phanerozoic. The partial correlationbetween DD and Dp is positive as one wouldexpect, although it is weak. Larger increasesin origination rate tend to be associated withlarger increases in diversity, and larger de-creases in origination rate with larger decreas-es in diversity. Similarly, the partial correla-tion between DD and Dq is negative. Larger in-creases in extinction rate are associated withlarger drops in diversity, and larger decreasesin extinction rate with larger rises in diversity.The stronger correlation between DD and Dqsuggests that, for animals as a whole over thePhanerozoic, variation in extinction rate may
be more important than variation in origina-tion rate in producing short-term variation indiversity. This difference is consistent withprevious observations that extinction rates aremore variable than origination rates (see New-
582 MIKE FOOTE
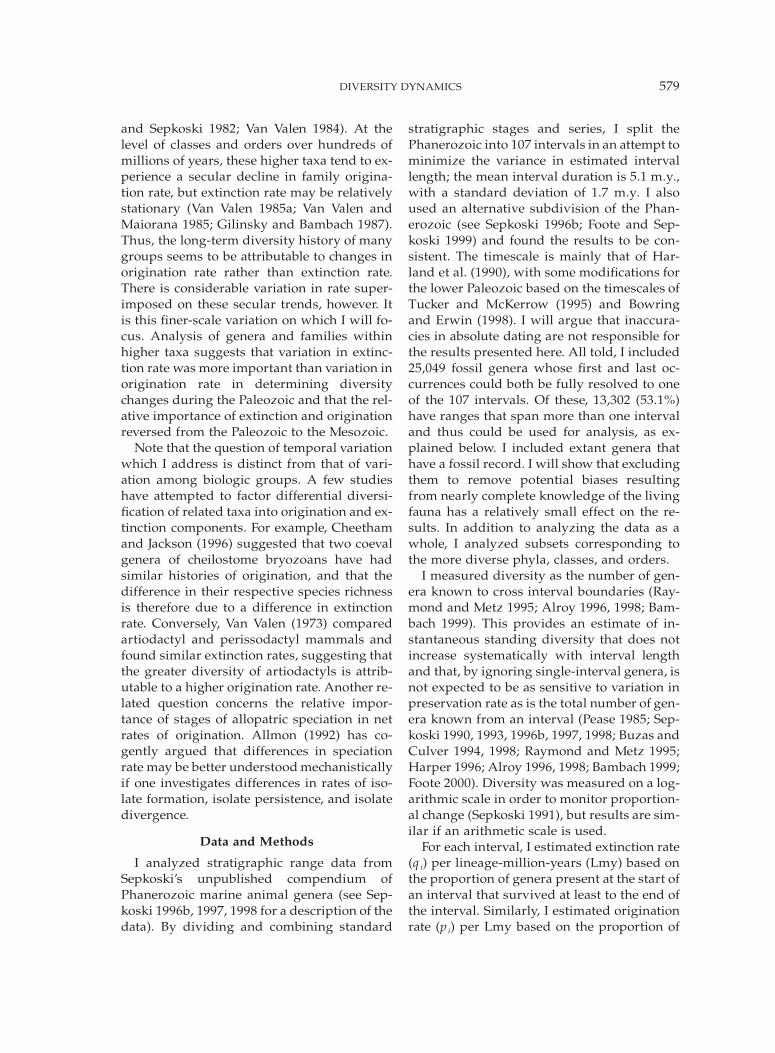
FIGURE 2. Comparison between change in diversityand change in per-capita origination rate (A) and ex-tinction rate (B) for trilobite genera. As for the data as awhole, the extinction correlation is stronger (t(DD,Dp)·Dq 50.228; t(DD,Dq)·Dp 5 20.420).
ell 1967; Foote 1994; Sepkoski 1998). Never-theless, differential variability of rates is un-likely to be the sole explanation for such dif-ferences (see below).
The comparison between origination andextinction correlations in Figure 1 may notseem very impressive. In fact, this portrayalrepresents something of a worst possible casefor detecting variation in diversity dynamics.This is because the Phanerozoic data are quiteheterogeneous. They are composed of taxawith very different characteristic rates (VanValen 1973, 1985a; Stanley 1979, 1985, 1990;
Van Valen and Maiorana 1985; Sepkoski 1987,1998), which are averaged together over a longspan of time during which rates declinedthrough the Paleozoic, rose again in the earlyMesozoic, then declined again through thepost-Paleozoic (Raup and Sepkoski 1982; VanValen 1984; Sepkoski 1998). It is thereforeworth exploring the relationships between di-versity, origination, and extinction for morehomogeneous subsets of data. The differencebetween origination and extinction correla-tions will then be assessed statistically by wayof consistent patterns exhibited by varioussubsets of the data.
Trilobites provide an example of a majorgroup that is restricted to the Paleozoic. Likethe data as a whole, trilobites show a weakpositive correlation between DD and Dp and astronger, negative correlation between DDand Dq (Table 1, Fig. 2). The directions of cor-relation are unsurprising and nearly univer-sal, so they will not be discussed further. Ofmore interest here is that, as for the Phanero-zoic data as a whole, the extinction correlationis stronger than the origination correlation(Table 1). There is nevertheless substantialnoise in the data; the effects of outliers andother potential artifacts will therefore be ex-plored below.
An important post-Paleozoic group, theEchinoidea (Table 1, Fig. 3), shows the oppo-site pattern: the origination correlation isstronger than the extinction correlation. Ceph-alopods, a group with characteristically hightaxonomic rates that spans both the Paleozoicand post-Paleozoic, show higher extinctioncorrelations in the Paleozoic and higher orig-ination correlations in the post-Paleozoic (Ta-ble 1, Fig. 4). The same difference is found forgastropods, a group with characteristicallylow taxonomic rates (Table 1, Fig. 5).
The partial correlations between DD and Dpand between DD and Dq are succinctly por-trayed in the format of Figure 6, which showsthe entire space of possible results. We wouldexpect correlations to fall in the lower rightquadrant, corresponding to a positive associ-ation between DD and Dp and a negative as-sociation between DD and Dq. A few resultsfall outside this quadrant. These are difficultto interpret, but they may reflect noise in the
583DIVERSITY DYNAMICS
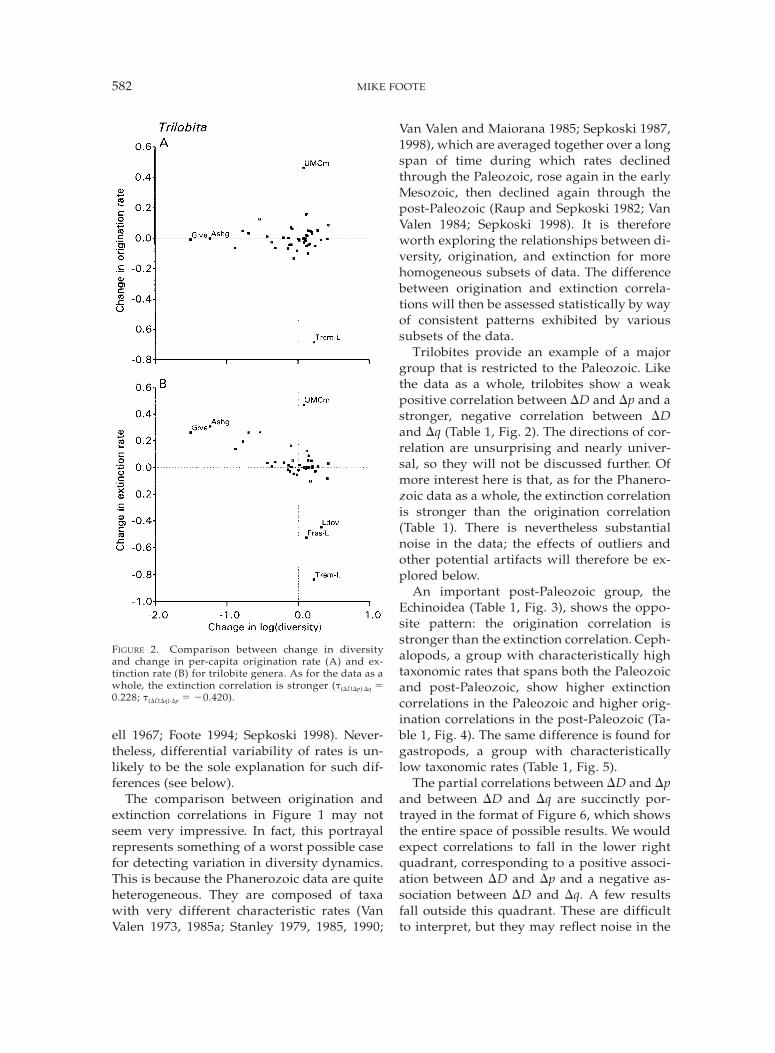
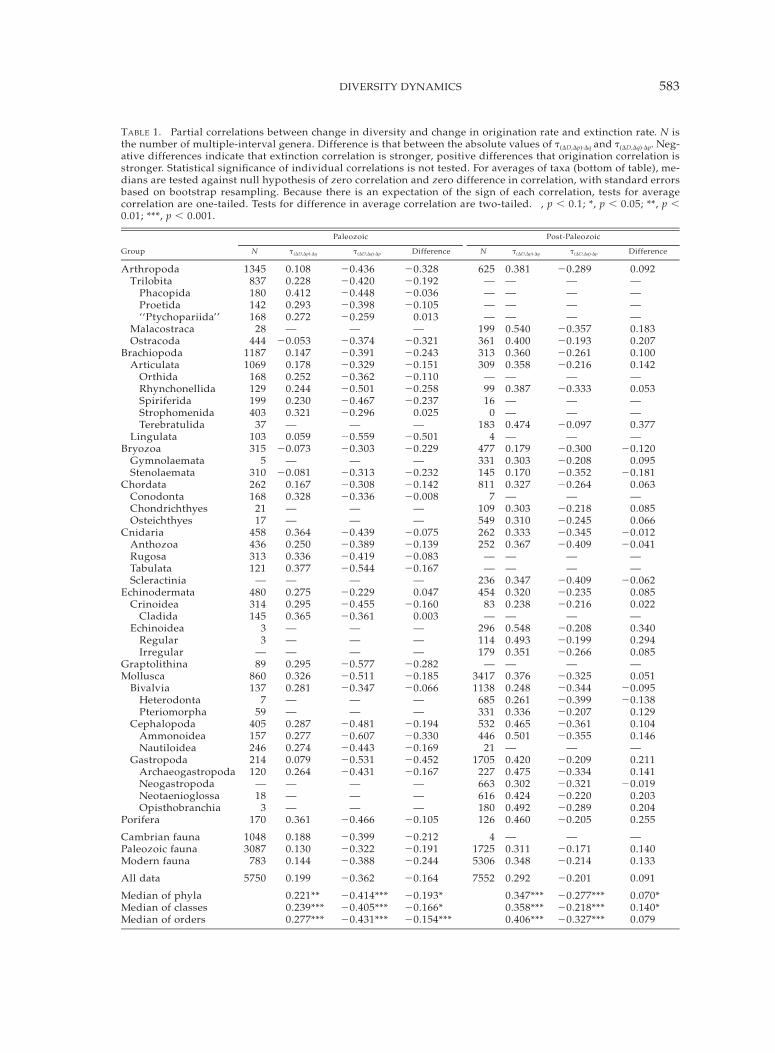
TABLE 1. Partial correlations between change in diversity and change in origination rate and extinction rate. N isthe number of multiple-interval genera. Difference is that between the absolute values of t(DD,Dp)·Dq and t(DD,Dq)·Dp. Neg-ative differences indicate that extinction correlation is stronger, positive differences that origination correlation isstronger. Statistical significance of individual correlations is not tested. For averages of taxa (bottom of table), me-dians are tested against null hypothesis of zero correlation and zero difference in correlation, with standard errorsbased on bootstrap resampling. Because there is an expectation of the sign of each correlation, tests for averagecorrelation are one-tailed. Tests for difference in average correlation are two-tailed. †, p , 0.1; *, p , 0.05; **, p ,0.01; ***, p , 0.001.
Group
Paleozoic
N t(DD,Dp)·Dq t(DD,Dq)·Dp Difference
Post-Paleozoic
N t(DD,Dp)·Dq t(DD,Dq)·Dp Difference
ArthropodaTrilobita
PhacopidaProetida‘‘Ptychopariida’’
MalacostracaOstracoda
1345837180142168
28444
0.1080.2280.4120.2930.272—
20.053
20.43620.42020.44820.39820.259
—20.374
20.32820.19220.03620.105
0.013—
20.321
625————
199361
0.381————0.5400.400
20.289————
20.35720.193
0.092————0.1830.207
BrachiopodaArticulata
OrthidaRhynchonellidaSpiriferidaStrophomenidaTerebratulida
Lingulata
11871069
168129199403
37103
0.1470.1780.2520.2440.2300.321—0.059
20.39120.32920.36220.50120.46720.296
—20.559
20.24320.15120.11020.25820.237
0.025—
20.501
313309
—9916
0183
4
0.3600.358—0.387——0.474—
20.26120.216
—20.333
——
20.097—
0.1000.142—0.053——0.377—
BryozoaGymnolaemataStenolaemata
ChordataConodontaChondrichthyesOsteichthyes
CnidariaAnthozoa
3155
310262168
2117
458436
20.073—
20.0810.1670.328——0.3640.250
20.303—
20.31320.30820.336
——
20.43920.389
20.229—
20.23220.14220.008
——
20.07520.139
477331145811
7109549262252
0.1790.3030.1700.327—0.3030.3100.3330.367
20.30020.20820.35220.264
—20.21820.24520.34520.409
20.1200.095
20.1810.063—0.0850.066
20.01220.041
RugosaTabulataScleractinia
EchinodermataCrinoidea
CladidaEchinoidea
RegularIrregular
GraptolithinaMollusca
BivalviaHeterodontaPteriomorpha
Cephalopoda
313121
—480314145
33
—89
860137
759
405
0.3360.377—0.2750.2950.365———0.2950.3260.281——0.287
20.41920.544
—20.22920.45520.361
———
20.57720.51120.347
——
20.481
20.08320.167
—0.047
20.1600.003———
20.28220.18520.066
——
20.194
——
236454
83—
296114179
—34171138
685331532
——0.3470.3200.238—0.5480.4930.351—0.3760.2480.2610.3360.465
——
20.40920.23520.216
—20.20820.19920.266
—20.32520.34420.39920.20720.361
——
20.0620.0850.022—0.3400.2940.085—0.051
20.09520.138
0.1290.104
AmmonoideaNautiloidea
GastropodaArchaeogastropodaNeogastropodaNeotaenioglossaOpisthobranchia
Porifera
157246214120
—18
3170
0.2770.2740.0790.264———0.361
20.60720.44320.53120.431
———
20.466
20.33020.16920.45220.167
———
20.105
44621
1705227663616180126
0.501—0.4200.4750.3020.4240.4920.460
20.355—
20.20920.33420.32120.22020.28920.205
0.146—0.2110.141
20.0190.2030.2040.255
Cambrian faunaPaleozoic faunaModern fauna
10483087
783
0.1880.1300.144
20.39920.32220.388
20.21220.19120.244
417255306
—0.3110.348
—20.17120.214
—0.1400.133
All data 5750 0.199 20.362 20.164 7552 0.292 20.201 0.091
Median of phylaMedian of classesMedian of orders
0.221**0.239***0.277***
20.414***20.405***20.431***
20.193*20.166*20.154***
0.347***0.358***0.406***
20.277***20.218***20.327***
0.070*0.140*0.079

584 MIKE FOOTE
FIGURE 3. Comparison between change in diversityand change in per-capita origination rate (A) and ex-tinction rate (B) for post-Paleozoic echinoids. In contrastto the data as a whole, the origination correlation isstronger (t(DD,Dp)·Dq 5 0.548; t(DD,Dq)·Dp 5 20.208).
data. The dotted line of slope 21 is a line ofisometry, or equal strength of the two corre-lations. The Paleozoic falls below this linewhile the post-Paleozoic is above it. The anglebetween a pair of correlations and the line ofisometry will be used below to measure thedeviation from isometry.
Figures 7–9 and Table 1 show results forphyla, classes, and orders. Since all three lev-els show the same pattern, they will be pre-sented together in subsequent figures. Forseparate Paleozoic and post-Paleozoic analy-ses, each higher taxon was analyzed if it had
at least 100 multiple-interval genera first ap-pearing in the given time span. In addition, Ianalyzed three groups that fell short of thiscriterion: Graptolithina, because of its pale-ontological importance in the Paleozoic, andpost-Paleozoic Crinoidea and Rhynchonelli-da, to enable comparison with the Paleozoic(Table 1). In general, a higher taxon was notbroken down into subtaxa if most of the Pa-leozoic genera belong to a single subtaxon andmost of the post-Paleozoic genera belong to adifferent subtaxon. Thus, for example, Ostra-coda was not divided into Paleozoic Palaeo-copida and post-Paleozoic Podocopida. Anumber of higher taxa are confined to eitherthe Paleozoic or the post-Paleozoic (e.g., tri-lobites in the Paleozoic, scleractinian corals af-ter the Paleozoic) or have sufficient diversityto allow analysis in only one of these two ma-jor time intervals (e.g., lingulate brachiopodsin the Paleozoic, gymnolaemate bryozoans af-ter the Paleozoic). Those taxa that are diversethroughout much of the Phanerozoic, howev-er, tend to shift toward greater strength of cor-relation between changes in diversity andchanges in origination rate (Table 1).
The pattern can be compared against thenull hypothesis that time (Paleozoic vs. post-Paleozoic) does not predict the side of the lineof isometry to which a higher taxon falls. Theresults are generally inconsistent with thisnull hypothesis, based on a two-tailed Fisherexact test: for phyla p 5 0.041; for classes p 50.00011; and for orders p 5 0.079. (It shouldbe noted that, with only 16 phylum-level ob-servations contributing to this first test [8 Pa-leozoic and 8 post-Paleozoic], the probabilitydistribution is rather discontinuous. The onlyprobabilities that could have been obtained inthe immediate neighborhood of p 5 0.041 arep 5 0.13, p 5 0.12, p 5 0.077, p 5 0.041, p 50.026, p 5 0.010, and p 5 0.0070. It is thereforepossible that the shift of a small number ofpoints from one side of the line to the othercould substantially affect our perception ofthe significance of this result.)
Although the relative roles of originationand extinction are opposite in the Paleozoicand post-Paleozoic, the post-Paleozoic is not asimple reflection of the Paleozoic. The pre-dominance of Paleozoic extinction correla-

585DIVERSITY DYNAMICS
FIGURE 4. Comparison between change in diversity and change in per-capita origination rate and extinction ratefor Paleozoic (A and B) and post-Paleozoic (C and D) cephalopods. In the Paleozoic, the extinction correlation isstronger (t(DD,Dp)·Dq 5 0.287; t(DD,Dq)·Dp 5 20.481), while the origination correlation is stronger in the post-Paleozoic(t(DD,Dp)·Dq 5 0.465; t(DD,Dq)·Dp 5 20.361).
tions over origination correlations is greaterthan the subsequent predominance of origi-nation correlations over extinction correla-tions. This can be seen in the differences be-tween t(DD,Dp)·Dq and t(DD,Dq)·Dp (Table 1) and inthe angular deviation from the line of isome-try (Figs. 7–9). Moreover, Paleozoic extinctioncorrelations tend to be greater than post-Pa-leozoic origination correlations, and post-Pa-leozoic extinction correlations tend to begreater than Paleozoic origination correlations(Table 1). This suggests that the overall ten-dency for animals during the Phanerozoic is
toward greater importance of extinction. Thisof course is the same pattern shown in Figure 1.
We see the same shift from extinction- toorigination-dominance if the data are decom-posed into sets of higher taxa constituting thethree ‘‘evolutionary faunas’’ (Sepkoski 1981,1984). Since each fauna represents a number oftaxa showing similar diversity histories, andsince the faunas are distinct in their diversitypatterns and evolutionary rates, one might ex-pect that they would show characteristicallydifferent correlations between diversitychange and change in taxonomic rates. In-

586 MIKE FOOTE
FIGURE 5. Comparison between change in diversity and change in per-capita origination rate and extinction ratefor Paleozoic (A and B) and post-Paleozoic (C and D) gastropods. In the Paleozoic, the extinction correlation isstronger (t(DD,Dp)·Dq 5 0.079; t(DD,Dq)·Dp 5 20.531), while the origination correlation isstronger in the post-Paleozoic(t(DD,Dp)·Dq 5 0.420; t(DD,Dq)·Dp 5 20.209).
stead, the evolutionary faunas behave likeMetazoa and like individual higher taxa (Ta-ble 1, Fig. 10).
These results suggest a striking direction-ality in the history of animal life. Changes indiversity are more strongly determined bychanges in extinction rate than by changes inorigination rate during the Paleozoic. Afterthe Paleozoic the relative importance of orig-ination and extinction is reversed. There are anumber of biological explanations that couldplausibly contribute to this transition. Before
they are explored, however, some potential bi-ases need to be considered.
Potential Biases
Choice of Rate Metric. The extinction andorigination metrics I have used incorporate in-terval length in an attempt to estimate per-ca-pita rates, and they ignore singletons in an at-tempt to correct for incomplete preservation.Although the rate metric chosen can be justi-fied theoretically, we can also explore the sen-sitivity of the results empirically. For example,

587DIVERSITY DYNAMICS
FIGURE 6. Correlation between diversity change andorigination change (abscissa) versus correlation be-tween diversity change and extinction change (ordinate)for all Paleozoic genera and all post-Paleozoic genera.Error bars show 61 standard error, based on the normalapproximation (Siegel and Castellan 1988). The lowerright quadrant is where correlations are generally ex-pected to lie (positive for origination and negative forextinction). The dotted line with slope 21 shows the ex-pected relationship if origination correlations and ex-tinction correlations are equally strong. Below this line,extinction correlations are stronger; above the line, orig-ination correlations are stronger. Direction and magni-tude of deviation from equal strength (isometry) can bemeasured by the angle between the line of isometry andthe vector to the pair of correlations.
FIGURE 7. Extinction and origination correlations for phyla in the Paleozoic and post-Paleozoic. Scale is differentfrom that of Figure 6; lower right quadrant is outlined by a bold line. Extinction correlations tend to be stronger inthe Paleozoic, while origination correlations tend to be stronger in the post-Paleozoic. See Table 1 for list of phyla.
tabulating percent origination and extinction(number of origination and extinction eventsnormalized by total diversity) is quite differ-ent from the approach used here, as it does notnormalize for interval length and it includessingletons. The results are nevertheless con-sistent even if this very different metric is used(Fig. 11). Results (not presented) are also con-sistent for a number of other metrics, includ-ing percent origination and extinction nor-malized by interval length, number of eventsnormalized by interval length and by estimat-ed average standing diversity (Van Valen1984), and a variation on this last metric(Harper 1996) in which singletons are omit-ted. Thus, the major Paleozoic/post-Paleozoicasymmetry is unlikely to be an artifact of therate metric chosen.
Edge Effects, Mass Extinctions, and Other Out-liers in the Data. The distributions of DD, Dp,and Dq (Figs. 1–5) suggest the possibility thatthe results could be unduly influenced by ex-treme rates at the start or end of the time series(Van Valen 1984, 1985a; Van Valen and Maior-ana 1985; Gilinsky and Bambach 1987; Foote1999: Appendix 7; Foote 2000), by a few largeorigination or extinction episodes, or by a fewanomalous points that result from error in ab-solute dating. There are a number of reasons

588 MIKE FOOTE
FIGURE 8. Extinction and origination correlations for classes in the Paleozoic and post-Paleozoic. As for phyla,extinction correlations tend to be stronger in the Paleozoic, and origination correlations tend to be stronger in thepost-Paleozoic. See Table 1 for list of classes.
FIGURE 9. Extinction and origination correlations for orders in the Paleozoic and post-Paleozoic. Orders show thesame pattern as phyla and classes. See Table 1 for list of orders.
to think that the Paleozoic/post-Paleozoicasymmetry is not an artifact, however:
1. The correlations between change in di-versity and change in rate are measured witha rank-order statistic. Thus, for example, theend-Ordovician and late-Permian increases inextinction rate, which sit well above the bulkof the data in Figure 1B, have the same influ-
ence on the correlation coefficients that theywould have if they were just slightly above therest of the data.
2. Analyses were repeated with the first andlast four intervals of each time series omitted.The results (Fig. 12) are largely consistentwith those in which all intervals are included.
3. Extremes in the origination and extinc-

589DIVERSITY DYNAMICS
FIGURE 10. Extinction and origination correlations for the Paleozoic and post-Paleozoic, with genera sorted intothe three Evolutionary Faunas: Cambrian (Cm), Paleozoic (Pz), and Modern (Md). Classes were assigned to thefaunas according to Sepkoski (1984); classes not assigned by Sepkoski to any of the faunas were omitted. Extinctioncorrelations are stronger during the Paleozoic, and origination correlations are stronger after the Paleozoic. Cam-brian fauna is omitted from the post-Paleozoic analysis since it has very low diversity (Table 1).
FIGURE 11. Extinction and origination correlations for phyla, classes, and orders in the Paleozoic and post-Paleo-zoic, using percent origination and extinction (number of events normalized by total diversity) rather than per-capita rates. The pattern of stronger extinction correlations in the Paleozoic and stronger origination correlationsin the post-Paleozoic persists. Similar results are found for other origination and extinction metrics as well.
tion data were identified in two ways and re-moved. In one approach, extremes were iden-tified as those intervals in each time serieswith the highest ratios of origination or ex-tinction rate to the average rate of the two ad-jacent intervals. In the other approach, ex-
tremes were identified as those intervals withthe largest absolute increase in rate relative tothe previous interval. The second approach isrelevant to the ‘‘outliers’’ labeled on Figures1–5. The number of extremes culled was var-ied; up to five origination peaks and five ex-

590 MIKE FOOTE
FIGURE 12. Extinction and origination correlations for all taxonomic levels, with first and last four intervals omittedfrom the time series for each taxon. There is still a tendency for stronger extinction correlations in the Paleozoicand stronger origination correlations in the post-Paleozoic, suggesting that this pattern is not an artifact of edgeeffects.
FIGURE 13. Extinction and origination correlations for all taxonomic levels, omitting intervals in which the fivelargest increases in origination rate and extinction rate occur. There is still a tendency for stronger extinction cor-relations in the Paleozoic and stronger origination correlations in the post-Paleozoic, suggesting that this patternis not determined by extreme events only.
tinction peaks were removed. When an inter-val was removed, the change from the preced-ing interval and the change to the succeedinginterval were both ignored. Thus, up to tenchanges (or about 20% of each time series)were removed. Figure 13 shows the results of
an extreme culling procedure. The correla-tions clearly tend to fall closer to the line ofisometry than they do in the analysis of rawdata, showing that extremes have an influence.The Paleozoic points are nevertheless concen-trated below this line and the post-Paleozoic

591DIVERSITY DYNAMICS
FIGURE 14. Extinction and origination correlations for all taxonomic levels, with diversity changes and averagerates tabulated across four successive intervals. Sets of four intervals are nonoverlapping. There is still a tendencyfor stronger extinction correlations in the Paleozoic and stronger origination correlations in the post-Paleozoic, butthis tendency is damped. See text for discussion.
points above it. Results of less extreme cullingprocedures are consistent with these.
4. To reduce the influence of absolute datingerror, which affects estimates of originationand extinction rate similarly, the rates for non-overlapping sets of n successive intervals wereaveraged as
n n
p̄ 5 p Dt Dt ,O Oi i i@i51 i51
and similarly for q̄, where Dti is the estimatedinterval duration and n is varied up to 4. Notethat these are not moving averages. With thismethod of averaging, only the errors in thebase of the first interval and the top of the lastinterval are relevant (Foote 1999: Appendix 7).For each set of intervals, DD was calculated asthe log of diversity at the end of the last in-terval minus the log of diversity at the start ofthe first interval, and Dp and Dq were calcu-lated as the average rate for the set of intervalsminus the average rate for the previous set ofintervals. If four successive intervals are av-eraged together, the results are much noisiersince fewer changes contribute to each esti-mated correlation (Fig. 14). Nevertheless,there is still a tendency for Paleozoic data to
be concentrated below the line of isometryand post-Paleozoic data above this line.
While the foregoing procedure representsan attempt to compensate for dating error, italso results in an analysis of diversity changesat a coarser temporal scale. Thus, the differ-ence between these analyses and analyses ofraw data does not simply reflect dating error.In fact, the results based on percent origina-tion and extinction (Fig. 11), to which datingerror does not contribute, are substantially inagreement with the analyses of raw data.Moreover, dating error affects origination andextinction rates similarly, so it should tend toblur rather than create distinctions betweenthem. Thus, error in absolute dating does notseem to have a major influence on the ob-served Paleozoic/post-Paleozoic asymmetry.
Taxonomic Level. Although many large-scale patterns of diversity, origination, and ex-tinction are similar across taxonomic levels(Sepkoski et al. 1981; Bambach and Sepkoski1992; Sepkoski 1997), there are often conspic-uous differences. For example, the average tra-jectory of diversity over the Phanerozoic issimilar at the genus and family levels, butthere is much more variation around this av-erage at the genus level (Sepkoski 1997). One

592 MIKE FOOTE
FIGURE 15. Extinction and origination correlations for phyla and classes, based on families within higher taxa. Dataare from Sepkoski (1992) with updates (J. J. Sepkoski Jr. personal communication 1998). Higher taxa analyzed are:Arthropoda, Trilobita, Ostracoda, Brachiopoda, Articulata, Bryozoa, Chordata, Cnidaria, Anthozoa, Echinoder-mata, Crinoidea, Echinoidea, Mollusca, Bivalvia, Cephalopoda, Gastropoda, and Porifera. Orders generally havetoo few families to permit analysis. Families show the same tendency as genera toward stronger extinction corre-lations in the Paleozoic and stronger origination correlations in the post-Paleozoic.
might expect this difference in volatility to in-fluence the dynamics of diversification (Gil-insky 1994, 1998). We find, however, that thePaleozoic/post-Paleozoic asymmetry is alsopresent when diversity, origination, and ex-tinction are measured at the level of familieswithin higher taxa (Fig. 15).
Pull of the Recent. There are a number ofreasons to suspect that the Pull of the Recent(Raup 1972, 1979) and related factors could in-fluence the results documented here. Averagetaxonomic rates decline toward the Recent(Raup and Sepkoski 1982; Van Valen 1984),and quality of preservation may have in-creased (Raup 1976b, 1979). Both factors tendto reduce the number of singletons, which areexcluded from analysis, as we approach theRecent. Inclusion of singletons, however, didnot affect the results of this study materially(Fig. 11). An additional problem relates to ouressentially complete knowledge of the livingfauna. Because of this, (1) the nearly monoton-ic increase in diversity through the Cenozoicmay be partly an artifact (Sepkoski 1997;Foote 2000). Moreover, (2) a genus that isknown only from its first fossil appearanceand the Recent will be a singleton as far as the
fossil record is concerned, but it will not be ex-cluded from analysis. It will therefore contrib-ute positively to the origination rate for its in-terval of first fossil appearance. The number ofthese fossil singletons that artificially contrib-ute to the origination rate should increase to-ward the Recent. These two factors suggestthe potential for a spurious correlation be-tween increases in diversity and increases inorigination rate.
The nature of the origination and extinctionmetrics used here suggests that the post-Pa-leozoic pattern is not an artifact of completeknowledge of the living fauna. Mathematicalmodeling of cladogenesis and incompletepreservation suggests that the estimate oforigination rate should be unaffected whilethe estimate of extinction rate should declineartificially (Foote 2000). It is neverthelessworth exploring this potential bias empirical-ly. Sepkoski’s genus data systematically in-clude only first and last appearances. As ameans of compensating for the Pull of the Re-cent, Sepkoski (personal communication 1998;see Sepkoski 1993, 1997) had begun to notewhich of the extant genera in his compendiumhave Plio-Pleistocene fossil occurrences. To

593DIVERSITY DYNAMICS
←
FIGURE 16. Extinction and origination correlations forpost-Paleozoic data at all taxonomic levels. Comparewith Figures 7–9. Results are similar whether extantgenera are included or excluded and whether the Ce-nozoic is included or excluded. Stronger origination cor-relations in the post-Paleozoic are therefore not likely tobe artifacts of the Pull of the Recent.
the best of my knowledge, this task was notcompleted. I have therefore taken two otherapproaches (Raup 1991; Foote and Sepkoski1999): (1) to exclude extant genera from anal-ysis of the post-Paleozoic, and (2) to excludethe Cenozoic altogether. (There are very fewPaleozoic genera still extant. Although Paleo-zoic data were reanalyzed without extant gen-era, the results barely differ from those inwhich extant genera are included and aretherefore not presented here.) Both approach-es yield results largely in agreement withthose based on the raw data (Fig. 16).
Potential Biological Explanations
Having ruled out plausible artifacts thatmay contribute to the apparent Paleozoic/post-Paleozoic difference in diversity dynam-ics, we can consider some likely biological ex-planations. It is possible to rule out some can-didates, but I have been unable to produce re-sults that would conclusively point to oneexplanation.
Stationary versus Increasing Diversity. Oneof the most conspicuous differences betweenthe Paleozoic and post-Paleozoic is that thereis little trend in diversity from the Silurianthrough the Permian, while there is a sus-tained increase in diversity through much ofthe post-Paleozoic (Sepkoski 1997). It seemsobvious to suppose that this increase in di-versity, marked by the exploitation of newadaptive zones (Bambach 1985), might under-lie the difference in diversity-rate correlations.There are, however, at least three reasons tobelieve that whether changes in diversity aremore strongly extinction- or origination-dom-inated is not simply a function of whether di-versity is stable or increasing. (1) Several Pa-leozoic taxa show a stronger extinction cor-relation even though they increase in diversityafter the early Paleozoic (e.g., bivalves, cri-noids), while a number of post-Paleozoic taxa

594 MIKE FOOTE
FIGURE 17. Extinction and origination correlations forPaleozoic data at all taxonomic levels. Compare withFigures 7–9. Extinction correlations tend to be strongerduring the Cambro-Ordovician radiation as well as dur-ing the rest of the Paleozoic. Thus, stronger originationcorrelations, such as those seen in the post-Paleozoic,are not a necessary consequence of increasing diversity.
show a stronger origination correlation eventhough they do not diversify steadily throughthe post-Paleozoic (e.g., ammonoids, brachio-pods). (2) If increasing diversity itself were theexplanation for the stronger origination cor-relations seen in the post-Paleozoic, we wouldexpect the Cambro-Ordovician data to showthis pattern. A comparison between the Cam-bro-Ordovician, a time of general diversity in-crease and ecological expansion, and the Si-lurian–Permian, a time of relatively stationarydiversity for animals as a whole, neverthelessshows that extinction correlations tend to bestronger than origination correlations for bothsegments of the Paleozoic (Fig. 17). (3) Simu-lation of an idealized diversification process(Raup et al. 1973) in which origination rateand extinction rate are stationary and equallyvariable, and in which origination rate exceedsextinction rate, yields diversity histories that,on average, have equal correlation betweenDD and Dp and between DD and Dq (resultsnot presented).
Average Rates, Volatility, and the Loss of Ex-tinction-Dominated Taxa. The Phanerozoicdecline in average taxonomic rates within ma-rine animals partly reflects the loss of taxawith higher characteristic rates (Van Valen andBoyajian 1987; Van Valen 1994). It is conceiv-able that the greater volatility of high-rategroups (Gilinsky 1994, 1998), many of whichwere filtered at the Permian/Triassic bound-ary, caused Paleozoic diversity to be morestrongly regulated by extinction pulses thanwas post-Paleozoic diversity. There are at leasttwo reasons to suspect that this is not the case,however. (1) Whether a group has strongercorrelations between diversity and extinctionor origination appears not to be an intrinsicproperty of that group. Taxa that persistthrough the Permian/Triassic bottleneck shiftfrom stronger extinction correlations to stron-ger origination correlations (Table 1, Figs. 7–9). Of course, it is still possible that the rele-vant filtering is at the level of subtaxa withinorders, but the number of genera within sub-orders and families is generally not adequateto test this. (2) Average rates of originationand extinction are not very good predictors ofhow far and in what direction a taxon deviatesfrom the null expectation that changes in di-
versity should be equally influenced by chang-es in origination rate and changes in extinc-tion rate (Fig. 18).
Temporal Variation in Origination and Extinc-tion Rates. Imagine constructing a diversityhistory by drawing origination and extinctionrates independently and randomly from twodistributions differing only in their variance.In this case, changes in diversity would cor-relate more strongly with changes in which-

595DIVERSITY DYNAMICS
FIGURE 18. Median taxonomic rates versus deviation of origination and extinction correlations from equal mag-nitude. Deviation is measured as the angle between the line of 21 slope and the vector from the origin to the pairof correlations (see Fig. 6). Deviation is negative in the clockwise direction from isometry and positive in the coun-terclockwise direction; negative values indicate stronger extinction correlations. For post-Paleozoic taxa, there issome indication of a positive correlation between origination rate and deviation from isometry at lower rates, but,in general, the magnitude of a taxon’s deviation from isometry is not well predicted by the magnitude of its orig-ination and extinction rates.
ever rate had the higher variance. Could sucha simple mechanism as differences in rate var-iance underlie the results documented here?Although this may be a contributing factor, itdoes not appear sufficient. Most Paleozoictaxa show higher variance in extinction ratethan in origination rate, but post-Paleozoichigher taxa are about equally divided betweenthose in which extinction is more variable and
those in which origination is more variable(Fig. 19). Moreover, in neither the Paleozoicnor the post-Paleozoic is the ratio of variancesa good predictor of how much a higher taxondeviates from the null expectation of equal ex-tinction- and origination-correlation of diver-sity changes (Fig. 19). In fact, the trend in thePaleozoic data is opposite to that expected ifthe relative variability of rates were the expla-

596 MIKE FOOTE
FIGURE 19. Relative variance of origination and extinction rates versus deviation of origination and extinction cor-relations from equal magnitude. The direction and magnitude of deviations from isometry are not predicted wellby the ratio of variances.
nation for asymmetric origination and extinc-tion correlations.
Diversity-Dependence of Rates. Neither av-erage rate nor variance in rate seems adequateto account for the Paleozoic/post-Paleozoicasymmetry. It seems probable that an impor-tant component of the relationship betweenchanges in diversity and changes in taxonom-ic rates may involve nonrandom structure inthe temporal sequence of rates. In a differentcontext, Kirchner and Weil (2000) have shownthat there is a statistical lag between the ex-tinction and origination curves for Phanero-zoic marine animals, a specific case of whichis the well-known delay between mass extinc-tions and recoveries (Hallam 1991; Erwin1996, 1998; Sepkoski 1998). A potential mech-anism with clear relevance in the present caseis diversity-dependence of rates, which hasbeen offered as an explanation for the lack oftrend in diversity through much of the Paleo-zoic (Sepkoski 1979; Jablonski and Sepkoski1996) and for the apparent fit of a number ofdiversity curves to logistic growth models(Sepkoski 1978, 1979, 1984; Miller and Sep-koski 1988). The difference between the Paleo-zoic ‘‘plateau’’ in diversity and the post-Paleo-zoic rise suggests that there may have been
different patterns of diversity-dependence ineffect.
Testing for diversity-dependence is compli-cated by secular trends in diversity and taxo-nomic rates. During the post-Paleozoic, for ex-ample, origination rate and extinction rate de-clined while diversity increased. Calculatingsimple correlations between diversity and tax-onomic rate, while appropriate when diversityand rates are stationary (Alroy 1998), could inthis case falsely make it appear as though bothrates were negatively correlated with diversi-ty. One solution to this problem is to calculatepartial correlations in order to remove the ef-fects of time. The variables of interest, how-ever, have different secular patterns, makingit difficult to factor out time. In the post-Pa-leozoic data as a whole, for example, there is arather steady rise in diversity, whereas therates drop off quickly up to about the MiddleJurassic and then fluctuate with relatively littletrend (Sepkoski 1998).
To test for diversity-dependence of rateswith time factored out, I calculated correla-tions between diversity at the start of each in-terval and the change in rate relative to theprevious interval. In this way, the detrendingof rates is accomplished by differencing; the

597DIVERSITY DYNAMICS
FIGURE 20. Estimated diversity-dependence of origination and extinction rates within phyla. Diversity-dependenceis measured as the partial correlation between diversity at the start of an interval and the change in rate relative tothe previous interval, with time held constant. Solid line outlines the upper left quadrant, where data are expectedto lie if both rates are diversity-dependent. Most points fall in this expected quadrant. Dotted line is the line ofisometry or equal strength of the two correlations. In the Paleozoic, extinction rate tends to be slightly more di-versity-dependent than origination rate. In the post-Paleozoic, origination and extinction rates tend to have similarmagnitudes of diversity-dependence. See Table 2.
resulting correlations between rate differencesand time are rather weak. It is therefore pri-marily long-term trends in diversity that needto be factored out. This is accomplished by us-ing correlations with time, t, partialed out:t(D,Dp)·t and t(D,Dq)·t. In some cases, diversitywithin a higher taxon is constant and there isno observed origination or extinction for anumber of successive intervals. This happensalmost exclusively when taxa are at low di-versity. Including such intervals could biastests for diversity-dependence of rates, as lowdiversity and low rates would necessarily becorrelated. I have therefore excluded intervalsin which estimated taxonomic rates are zero.To reduce the effect of the steep, initial declinein taxonomic rates, I have omitted the Cam-brian and Ordovician and the Triassic throughearly Jurassic (see Alroy 1998, which used asimilar convention for Cenozoic mammals).Results are similar, however, if the early ra-diations are retained.
If per-capita origination rate depends on di-versity, then one should expect negative cor-relations between D and Dp; lower levels of di-versity lead to an increase in origination rate
while higher diversity leads to a decrease inorigination rate (MacArthur and Wilson 1967;Sepkoski 1978, 1979, 1991; Carr and Kitchell1980; Walker and Valentine 1984). Conversely,one should expect correlations between D andDq to be positive. This test is more direct thanthat based on correlations between originationand extinction rates (Webb 1969; Mark andFlessa 1977). There is substantial noise in thedata and many of the correlations are not sta-tistically significant, but the majority of phylashow the direction expected under the hy-pothesis of diversity-dependence (Fig. 20).This is true even for post-Paleozoic phyla,most of which increase in diversity. These re-sults support logistic rather than exponentialmodeling of biological diversification (Sepko-ski 1978, 1979, 1984, 1996a; Alroy 1996, 1998;Miller 1998; Miller and Sepkoski 1988; cf. Ben-ton 1995, 1997).
Although there are a number of exceptions,Figure 20 and Table 2 show a hint of a possibleasymmetry in diversity-dependence betweenthe Paleozoic and post-Paleozoic. During thePaleozoic, it appears as though extinctionrates depend on diversity more strongly than

598 MIKE FOOTE
TA
BL
E2.
Est
imat
edd
iver
sity
-dep
end
ence
ofta
xon
omic
rate
s,m
easu
red
asp
arti
alco
rrel
atio
nb
etw
een
div
ersi
tyan
dch
ang
ein
orig
inat
ion
rate
and
exti
nct
ion
rate
.See
Tabl
e1
for
des
crip
tion
ofst
atis
tica
lte
sts.
Gro
up
Silu
rian
thro
ugh
Per
mia
n
All
inte
rval
s
t (D
,Dp)
·tt (
D,D
q)·t
Dif
fere
nce
Low
-div
ersi
tyin
terv
als
omit
ted
t (D
,Dp)
·tt (
D,D
q)·t
Dif
fere
nce
Hig
h-d
iver
sity
inte
rval
som
itte
d
t (D
,Dp)
·tt (
D,D
q)·t
Dif
fere
nce
Mid
-Ju
rass
icth
rou
ghC
eno
zoic
t (D
,Dp)
·tt (
D,D
q)·t
Dif
fere
nce
Art
hro
pod
aB
rach
iop
oda
Bry
ozoa
Ch
ord
ata
Cn
idar
iaE
chin
oder
mat
aM
ollu
sca
Por
ifer
a
20.
078
20.
069
20.
364*
0.00
72
0.21
5*2
0.25
0†2
0.03
62
0.04
6
0.19
0†0.
305*
*0.
005
0.17
00.
231*
0.24
0*0.
214*
0.08
2
20.
112
20.
236
0.35
92
0.16
22
0.01
60.
010
20.
177
20.
036
20.
031
20.
028
20.
227
0.10
02
0.08
82
0.45
3**
20.
100
20.
005
0.27
9*0.
284*
0.03
90.
147
0.27
3*2
0.00
00.
200†
0.11
6
20.
249
20.
256
0.18
82
0.04
72
0.18
50.
453*
20.
100
20.
111
20.
121
0.00
12
0.30
5†0.
043
20.
234†
20.
096
0.05
20.
155
0.10
40.
265*
20.
021
0.14
00.
167
0.36
7*0.
092
0.23
6
0.01
72
0.26
40.
284
20.
097
0.06
62
0.27
02
0.04
12
0.08
1
20.
135
20.
141
0.01
02
0.21
8†2
0.25
1*2
0.04
22
0.17
7†2
0.30
6†
0.17
5†0.
247*
0.11
00.
112
0.16
50.
071
0.19
4†0.
481*
20.
041
20.
106
20.
101
0.10
60.
086
20.
029
20.
017
20.
175
All
dat
aP
hy
lum
med
ian
0.05
42
0.07
40.
249*
0.20
2***
20.
196
20.
128†
0.01
82
0.06
60.
180†
0.17
4**
20.
162
20.
108
0.14
42
0.04
80.
175
0.15
4**
20.
031
20.
106
20.
170†
20.
159*
**0.
026
0.17
0***
0.14
32
0.01
1 do origination rates; Paleozoic phyla tendweakly to fall above the line of isometry inFigure 20. In the post-Paleozoic, however, thetwo dependencies are closer to the same mag-nitude on average. For classes, there is notsuch a clear difference between the Paleozoicand post-Paleozoic (Fig. 21), although mostcorrelations still show the direction expectedunder diversity-dependence. These results arenot a simple restatement of the earlier analy-ses regarding change in diversity and changein taxonomic rates. Rather, to the extent thatthe correlations reflect causation, they indicatea different causal direction. The first set ofanalyses tested how the change in rates rela-tive to the preceding interval contributes sta-tistically to the change in diversity within theinterval in question. The analysis of diversity-dependence tests how the absolute level of di-versity at the start of an interval contributesstatistically to a suppression or enhancementof rates relative to the preceding interval.
There are at least three possible explana-tions for the discrepancy between the resultsfor phyla and those for classes: (1) The dis-crepancy reflects greater sampling error at theclass level. (2) There is a meaningful, hierar-chical effect of taxonomic level. It has beennoted, for example, that orders tend not toshow diversity equilibria to the same extent aslarger composites (Jablonski and Sepkoski1996). A hierarchical distinction between phy-la and classes cannot be ruled out, but, if itwere the case, one might also expect a differ-ence between phyla and classes in correlationsinvolving DD, Dp, and Dq. No such differenceis evident (Table 1, Figs. 7–9). (3) There is infact no asymmetry in diversity-dependence oforigination versus extinction rates in the Pa-leozoic, and the apparent pattern for phyla isspurious. This is certainly the most conserva-tive conclusion, but one fact suggests that itmay be worth retaining this asymmetry as aviable hypothesis: the combined Paleozoicdata show diversity-rate correlations consis-tent with the hypothesis (Table 2).
To the extent that extinction is more diver-sity-dependent than origination in the Paleo-zoic, this asymmetry may help to explain whyPaleozoic changes in diversity are dominatedby changes in extinction rate rather than orig-

599DIVERSITY DYNAMICS
FIGURE 21. Estimated diversity-dependence of origination and extinction rates within classes. Compare with Fig-ure 20. Although most rates still show the direction of correlation expected under diversity-dependence, the dis-tinction between the Paleozoic and post-Paleozoic is not evident. See text for discussion.
ination rate. Lower diversity may lead to a re-duction in extinction rate that is more pro-nounced than the corresponding increase inorigination rate, while higher diversity maypromote extinction more than it inhibits orig-ination. In the post-Paleozoic, however, itwould appear that diversity-dependence, be-ing rather symmetrical, is simply superim-posed on whatever causes contribute to thedominance of diversity changes by variationin origination rate. The nature of these causesremains uncertain.
Discussion and Conclusions
This study initially sought to test whethervariation in taxonomic diversity is controlledpredominantly by origination or by extinction.In fact, no consistent pattern exists throughoutthe Phanerozoic. Rather, a pronounced shift inthe dynamics of animal diversification accom-panies the biotic transition from the Paleozoicto the Mesozoic. The magnitude of changes indiversity at the scale of several million yearsis determined during the Paleozoic more bythe magnitude of change in extinction rate, butafter the Paleozoic more by the magnitude ofchange in origination rate. Although the dif-ference between the Paleozoic and post-Paleo-zoic is statistically significant, the size of the
effect is a different matter. The magnitude ofthe correlations (Table 1) shows that the shiftfrom extinction- to origination-dominatedchanges in diversity must not be the single,dominant factor in Phanerozoic diversity dy-namics. All plausible sources of artifact can beruled out, however; thus, the effect is real, andthe pattern demands explanation.
It is reasonable to suggest that an ecologicaldecomposition of data might be more mean-ingful than a taxonomic one. Although itwould be desirable to divide all genera into asmall number of ecological categories thattranscend taxonomic lines, such a large task isbeyond the scope of this work. The analysespresented here nevertheless fail to show anyobvious effects of the major aspects of aut-ecology (Table 1). For example, primarily ben-thic groups do not show results consistentlydifferent from those of primarily pelagicgroups. The predominantly infaunal irregularechinoids are similar to the predominantlyepifaunal regulars. And many higher taxachange in diversity dynamics from the Paleo-zoic to the post-Paleozoic despite maintainingessentially the same general way of life.
The extent to which changes in diversity areorigination- or extinction-dominated does notappear to be a simple consequence of the mag-
600 MIKE FOOTE
nitude of taxonomic rates or of the relativevariability of origination and extinction rates.Origination- or extinction-dominance is notan intrinsic property of higher taxa. The ob-served shift in diversity dynamics tends to oc-cur within individual higher taxa, suggestingthat the world itself changed in a fundamentalway. It is still possible that the Paleozoic con-tained a mixture of extinction-dominated andorigination-dominated taxa, with the lattersurviving preferentially. For such a cullingprocess to explain the Paleozoic/post-Paleo-zoic shift, it would have to have taken placebelow the level of taxonomic resolution of thisstudy. In other words, the Paleozoic wouldhave to have been marked by a mixture of rel-atively few origination-dominated familiesand many more extinction-dominated fami-lies, and the former would have to have sur-vived preferentially into the Mesozoic. In theabsence of adequate data to test this hypoth-esis, it seems reasonable to take the shift ofmost phyla and classes, as well as the few or-ders for which data are adequate in both thePaleozoic and post-Paleozoic, as prima facieevidence that the evolutionary milieu in whichtaxa find themselves changed substantially.
One of the most salient differences betweenthe Paleozoic and post-Paleozoic marine fossilrecords is that the majority of the known Pa-leozoic record is tropical in origin, while ex-tratropical environments are represented to agreater extent after the Paleozoic (Raup 1976a;Allison and Briggs 1993; Hallam 1994; Taylorand Allison 1998). This partly reflects concen-tration of sampling in Europe and NorthAmerica (Raup 1976a), but it also reflects thetrue past positions of continents (Scotese andMcKerrow 1990; Hallam 1994) and the extentto which different continents were inundated(Ronov 1994).
A number of empirical observations suggeststriking evolutionary differences between thetropical and extratropical realms that are rel-evant to diversity dynamics. Extinction eventsare often thought to affect tropical speciesmore than temperate species (Stanley 1984,1988a,b; Jablonski 1991; Raup and Jablonski1993; Copper 1994; Smith and Jeffery 1998), al-though it is possible that geographic patternsof selectivity are sometimes driven by extinc-
tion in a taxonomically limited subset of spe-cies (e.g., Late Cretaceous rudist bivalves rath-er than bivalves as a whole [Jablonski 1991;Raup and Jablonski 1993]). Major morpholog-ical innovations (operationally defined asthose that characterize new orders) have beenfound to originate preferentially in the Tropics(Jablonski 1993). One possible explanation forthis pattern is that innovations occur as re-sponses to opportunities in the wake of ex-tinction events that preferentially affect theTropics (Jablonski 1993). There is some evi-dence that taxonomic rates of evolution maybe higher in the Tropics than elsewhere (Stehliand Wells 1971; Flessa and Jablonski 1996; butsee Van Valen 1969). There is also a tendencyfor diversity to be higher in the Tropics thanelsewhere (Rosenzweig 1992, 1995; Roy et al.1998), although this pattern is not without ex-ception (Crame 1997; Rutherford et al. 1999).
Despite these differences between the Trop-ics and higher latitudes, it is not obvious thattropical versus extratropical setting explainsthe Paleozoic/post-Paleozoic difference in di-versity dynamics. One difficulty is that otherenvironmental factors, which are also knownempirically to influence evolutionary patterns,covary with latitude and with each other. Mostconspicuously, there is a well-known generaltendency for carbonate production to be con-centrated in environments that are shallowand tropical (Wilson 1975; Wilkinson 1979;James 1981; Ziegler et al. 1984), although ofcourse this tendency is not without importantexceptions (Wilson 1975; James 1981, 1997;James and Clarke 1997; Taylor and Allison1998). This environmental correlation is im-portant because cratons were evidently flood-ed to a greater extent during the Paleozoic(Ronov 1994), and because evolutionary pat-terns are also known to vary with bathymetryand with carbonate versus terrigenous setting.For example, genus origination and extinctionrates are higher in shallower (nearshore) en-vironments (Sepkoski 1987), and higher taxa,major morphological novelties, and character-istic associations of higher taxa tend to appearfirst in nearshore settings (Sepkoski and Shee-han 1983; Sepkoski and Miller 1985; Bottjerand Jablonski 1988; Jablonski and Bottjer1990a,b, 1991). It has also been found that, at

601DIVERSITY DYNAMICS
least during the Ordovician, diversity tends tobe higher in predominantly terrigenous set-tings (foreland basins and transition zones)than on carbonate platforms (Miller and Mao1995; see Boucot 1999). Moreover, Smith andJeffery (1998) suggested selective extinction ofcertain Late Cretaceous and early Tertiaryechinoids that prefer carbonate (chalk) envi-ronments. The hypothesis that geographicand environmental setting play a role in thestyle of diversity dynamics is potentially test-able with extensive data on genus occurrencesthat include lithologic and paleogeographicinformation (Sepkoski and Sheehan 1983; Sep-koski and Miller 1985; Bottjer and Jablonski1988; Jablonski and Bottjer 1990a,b, 1991; Mill-er and Mao 1995,1998; Miller 1997a,b).
Taxonomic rates tend to be diversity-depen-dent, and there is some evidence, albeit weak,that the nature of this dependence changesfrom the Paleozoic to the post-Paleozoic. Dur-ing the Paleozoic, specifically the long intervalof approximately stationary diversity fromthe Silurian through the Permian, diversityappears to influence extinction rate somewhatmore than origination rate. This pattern is notoverwhelming, however, and should be ac-cepted only tentatively. After the Paleozoic,the diversity-dependence of both rates is clos-er to the same magnitude.
Whether or not the apparent asymmetry indiversity-dependence within the Paleozoic isrobust, i.e., whether extinction rates are morediversity-dependent than origination rates orequally dependent, the results of this studydiffer from previous suggestions that most ofthe diversity-dependence of taxonomic rateslies in the origination component. This conclu-sion has been based mainly on two lines of ev-idence: (1) Within higher taxa, originationrates tend to decline over time while extinc-tion rates are relatively stationary (Van Valen1985a,b; Van Valen and Maiorana 1985; Gil-insky and Bambach 1987; Jablonski and Sep-koski 1996). This pattern is at a very coarsetemporal scale, and so it may not be relevantto processes of diversity-dependence that pre-sumably act on shorter temporal scales. (2)More to the point, origination rates have beenshown to fit a diversity-dependent model bet-ter than do extinction rates. Sepkoski (1978,
1979) found this for Phanerozoic orders andfamilies (although, for the Cambrian alone,family-level extinction rates show a better fit),as did Alroy (1998) for genera and species ofCenozoic mammals. (The results of Eble[1999] are not obviously pertinent to this is-sue. Although he inferred diversity-depen-dence of genus origination rates for two ofthree higher taxa of marine animals studied,he did not test for diversity-dependence of ex-tinction rates.)
It is unclear why the present results differfrom those of Sepkoski and Alroy. The expla-nation for the discrepancy does not lie in mycomparing diversity with first differences inrate where previous authors have compareddiversity with the rates themselves. I also es-timated diversity-dependence in a more con-ventional way, using the partial correlation,with time held constant, between diversity atthe start of an interval and the taxonomic ratefor that same interval (rather than the changein rate from the previous interval). Such ananalysis does not yield systematically stron-ger origination correlations such as thosefound by Sepkoski and Alroy. Although Stan-ley (1999) suggested that high rates of extinc-tion were largely responsible for the failure ofPaleozoic animals to show a long-term in-crease in diversity after the Ordovician, his ar-gument that diversity-dependence of rateswas not strong during the Paleozoic seems tohave been based on analysis of rates of diver-sification, i.e., the difference between origina-tion and extinction rates, rather than the com-ponent rates individually.
To the extent that the Paleozoic asymmetryin diversity-dependence is robust, it could im-ply at least two constituent patterns: (1) Lowdiversity levels following extinction pulses areaccompanied by a lowering of extinction ratemore than an increase in origination rate. (2)The lack of long-term increase in diversityduring the mid–late Paleozoic is attributablemore to increases in extinction rate than to de-creases in origination rate when diversity ishigh. That the pattern reflects regulation oftaxonomic rates at both high and low diver-sities is suggested by a simple analysis of sub-sets of Paleozoic data (Table 2). When the 25%of the intervals with the lowest or highest di-

602 MIKE FOOTE
versity are omitted, the pattern of diversity-rate correlations is largely similar to that forthe data as a whole. The most conspicuous ex-ception is the echinoderms, for which I can of-fer no reasonable explanation. The results re-garding diversity-dependence of rates arenoisy. Regulation of rates by diversity is there-fore unlikely to be the principal explanationfor the results of this study. It may neverthe-less prove to play a role.
It has been suggested that extinction pulsesand diversity change in general are often trig-gered by physical perturbations (Newell 1967;Bretsky and Lorenz 1970; Bretsky 1973; Raupand Boyajian 1988; Stanley 1988a,b; Raup1991, 1992; Brett and Baird 1995, 1997; Hallamand Wignall 1997; Brett 1998; Miller 1998;Patzkowsky and Holland 1999). This is consis-tent with the general tendency over the Phan-erozoic for variation in extinction rate to havea stronger influence on diversity than doesvariation in origination rate. More to the point,it would seem that these perturbations extend-ed further in their impact during the Paleozoicthan afterwards. Assuming that physical per-turbations did not sharply decrease in mag-nitude or frequency from the Paleozoic to theMesozoic, the observed difference in diversitydynamics seems to suggest a change in theway ecosystem structure allowed shocks topercolate through the biota. Large-scale, eco-system-level changes are thought to includeincreasing niche specialization and greater en-ergy flow (Valentine 1969, 1973; Bambach1985, 1993, 1999). How these and other aspectsof ecosystem evolution have contributed to theevolution of diversity dynamics is yet to be de-termined.
Acknowledgments
I am especially grateful to the late J. JohnSepkoski Jr. for generously providing the datafor this study and for laying much of the in-tellectual foundation on which it rests. A. I.Miller helped clarify the potential importanceof geographic and environmental setting indiversity dynamics. I am thankful for discus-sions with A. Barnosky, R. H. Foote, D. Jablon-ski, A. I. Miller, D. M. Raup, J. J. Sepkoski Jr.,and J. W. Valentine. R. H. Foote, L. C. Hayek,M. L. McKinney, and A. I. Miller provided
helpful reviews. This work was supported bythe National Science Foundation (grant EAR95-06568).
Literature Cited
Allison, P. A., and D. E. G. Briggs. 1993. Paleolatitudinal sam-pling bias, Phanerozoic species diversity, and the end-Perm-ian extinction. Geology 21:65–68.
Allmon, W. D. 1992. A causal analysis of stages in allopatric spe-ciation. Oxford Surveys in Evolutionary Biology 8:219–257.
Alroy, J. 1996. Constant extinction, constrained diversification,and uncoordinated stasis in North American mammals. Pa-laeogeography, Palaeoclimatology, Palaeoecology 127:285–311.
———. 1998. Equilibrial diversity dynamics in North Americanmammals. Pp. 233–287 in McKinney and Drake 1998.
Bambach, R. K. 1985. Classes and adaptive variety: the ecologyof diversification in marine faunas through the Phanerozoic.Pp. 191–243 in J. W. Valentine, ed. Phanerozoic diversity pat-terns: profiles in macroevolution. Princeton University Press,Princeton, N.J.
———. 1993. Seafood through time: changes in biomass, ener-getics, and productivity in the marine ecosystem. Paleobiol-ogy 19:372–387.
———. 1999. Energetics in the global marine fauna: a connec-tion between terrestrial diversification and change in the ma-rine biosphere. Geobios 32:131–144.
Bambach, R. K., and J. J. Sepkoski Jr. 1992. Historical evolution-ary information in the traditional Linnean hierarchy. Pale-ontological Society Special Publication 6:16.
Benton, M. J. 1995. Diversification and extinction in the historyof life. Science 268:52–58.
———. 1997. Models for the diversification of life. Trends inEcology and Evolution 12:490–495.
Bottjer, D. J., and D. Jablonski. 1988. Paleoenvironmental pat-terns in the evolution of post-Paleozoic benthic marine inver-tebrates. Palaios 3:540–560.
Boucot, A. J. 1999. Introductory concerns. Pp. 13–17 in A. J. Bou-cot and J. D. Lawson, eds. Paleocommunities: a case studyfrom the Silurian and Lower Devonian. Cambridge UniversityPress, Cambridge.
Bowring, S. A., and D. H. Erwin. 1998. A new look at evolution-ary rates in deep time: uniting paleontology and high-preci-sion geochronology. GSA Today 8(9):1–8.
Bretsky, P. W. 1973. Evolutionary patterns in the Paleozoic Biv-alvia: documentation and some theoretical considerations.Geological Society of America Bulletin 84:2079–2096.
Bretsky, P. W., and D. M. Lorenz. 1970. Essay on genetic-adap-tive strategies and mass extinctions. Geological Society ofAmerica Bulletin 81:2449–2456.
Brett, C. E. 1998. Sequence stratigraphy, paleoecology, and evo-lution: biotic clues and responses to sea-level fluctuation. Pa-laios 13:241–262.
Brett, C. E., and G. C. Baird. 1995. Coordinated stasis and evo-lutionary ecology of Silurian to Middle Devonian faunas inthe Appalachian basin. Pp. 285–315 in D. H. Erwin and R. L.Anstey, eds. New approaches to speciation in the fossil re-cord. Columbia University Press, New York.
———. 1997. Epiboles, outages, and ecological evolutionarybioevents: taphonomic, ecological, and biogeographic factors.Pp. 249–284 in C. E. Brett and G. C. Baird, eds. Paleontologicalevents: stratigraphic, ecological, and evolutionary implica-tions. Columbia University Press, New York.
Buzas, M. A., and S. J. Culver. 1994. Species pool and dynamicsof marine paleocommunities. Science 246:1439–1441.

603DIVERSITY DYNAMICS
———. 1998. Assembly, disassembly, and balance in marinecommunities. Palaios 13:263–275.
Carr, T. R., and J. A. Kitchell. 1980. Dynamics of taxonomic di-versity. Paleobiology 6:427–443.
Cheetham, A. H., and J. B. C. Jackson. 1996. Speciation, extinc-tion, and the decline of arborescent growth in Neogene andQuaternary cheilostome Bryozoa of tropical America. Pp.205–233 in J. B. C. Jackson, A. F. Budd, and A. G. Coates, eds.Evolution and environment in tropical America. University ofChicago Press, Chicago.
Copper, P. 1994. Reefs under stress: the fossil record. CourierForschungsinstitut Senckenberg 172:87–94.
Crame, J. A. 1997. An evolutionary framework for the polar re-gions. Journal of Biogeography 24:1–9.
Eble, G. J. 1999. Originations: land and sea compared. Geobios32:223–234.
Erwin, D. H. 1996. Understanding biotic recoveries: extinction,survival, and preservation during the end-Permian mass ex-tinction. Pp. 398–418 in Jablonski et al. 1996.
———. 1998. The end and the beginning: recoveries from massextinctions. Trends in Ecology and Evolution 13:344–349.
Flessa, K. W., and D. Jablonski. 1996. The geography of evolu-tionary turnover: a global analysis of extant bivalves. Pp. 376–397 in Jablonski et al. 1996.
Foote. 1994. Temporal variation in extinction risk and temporalscaling of extinction metrics. Paleobiology 20:424–444.
———. 1997. Estimating taxonomic durations and preservationprobability. Paleobiology 23:278–300.
———. 1999. Morphological diversity in the evolutionary radi-ation of Paleozoic and post-Paleozoic crinoids. PaleobiologyMemoirs No. 1. Paleobiology 25(Suppl. to No. 2).
———. 2000. Origination and extinction components of taxo-nomic diversity: general problems. In D. H. Erwin and S. L.Wing, eds. Deep time: Paleobiology‘s perspective. Paleobiology26(Suppl. to No. 4):74–102.
Foote, M., and D. M. Raup. 1996. Fossil preservation and thestratigraphic ranges of taxa. Paleobiology 22:121–140.
Foote, M., and J. J. Sepkoski Jr. 1999. Absolute measures of thecompleteness of the fossil record. Nature 398:415–417.
Gilinsky, N. L. 1994. Volatility and the Phanerozoic decline ofbackground extinction intensity. Paleobiology 20:445–458.
———. 1998. Evolutionary turnover and volatility in highertaxa. Pp. 162–184 in McKinney and Drake 1998.
Gilinsky, N. L., and R. K. Bambach. 1987. Asymmetrical patternsof origination and extinction in higher taxa. Paleobiology 13:427–445.
Hallam, A. 1991. Why was there a delayed radiation after theend-Palaeozoic extinctions? Historical Biology 5:257–262.
———. 1994. An outline of Phanerozoic biogeography. OxfordUniversity Press, Oxford.
Hallam, A., and P. B. Wignall. 1997. Mass extinctions and theiraftermath. Oxford University Press, Oxford.
Harland, W. B., R. L. Armstrong, A. V. Cox, L. E. Craig, A. G.Smith, and D. G. Smith. 1990. A geologic time scale 1989.Cambridge University Press, Cambridge.
Harper, C. W., Jr. 1996. Patterns of diversity, extinction, and orig-ination in the Ordovician-Devonian Stropheodontacea. His-torical Biology 11:267–288.
Harvey, P. H., and A. Rambaut. 1998. Phylogenetic extinctionrates and comparative methodology. Proceedings of the Roy-al Society of London B 265:1691–1696.
Hey, J. 1992. Using phylogenetic trees to study speciation andextinction. Evolution 46:627–640.
Hey, J., H. Hilton, N. Leahy, and R.-L. Wang. 1998. Testing mod-els of speciation and extinction with phylogenetic trees of ex-tant taxa. Pp. 70–90 in McKinney and Drake 1998.
Holland, S. M. 1995. The stratigraphic distribution of fossils. Pa-leobiology 21:92–109.
Holland, S. M., and M. E. Patzkowsky. 1999. Models for simu-lating the fossil record. Geology 27:491–494.
Jablonski, D. 1991. Extinctions: a paleontological perspective.Science 253:754–757.
———. 1993. The tropics as a source of novelty through geolog-ical time. Nature 362:142–144.
Jablonski, D., and D. J. Bottjer. 1990a. The ecology of evolution-ary innovation: the fossil record. Pp. 253–288 in M. H. Nitecki,ed. Evolutionary innovations. University of Chicago Press,Chicago.
———. 1990b. The origin and diversification of major groups:environmental patterns and macroevolutionary lags. Pp. 17–57 in P. D. Taylor and G. P. Larwood, eds. Major evolutionaryradiations. Clarendon, Oxford.
———. 1991. Environmental patterns in the origins of highertaxa: the post-Paleozoic fossil record. Science 252:1831–1833.
Jablonski, D., and J. J. Sepkoski Jr. 1996. Paleobiology, commu-nity ecology, and scales of ecological pattern. Ecology 77:1367–1378.
Jablonski, D., D. H. Erwin, and J. H. Lipps, eds. 1996. Evolu-tionary paleobiology. University of Chicago Press, Chicago.
James, N. P. 1981. Introduction to carbonate facies models. Pp.209–211 in R. G. Walker, ed. Facies models, 2d ed. GeologicalAssociation of Canada, Toronto.
———. 1997. The cool-water carbonate depositional realm. Pp.1–20 in James and Clarke 1997.
James, N. P., and J. A. D. Clarke, eds. 1997. Cool-water carbon-ates. SEPM (Society for Sedimentary Geology) Special Publi-cation No. 56.
Kendall, D. G. 1948. On the generalized ‘‘birth-and-death’’ pro-cess. Annals of Mathematical Statistics 19:1–15.
Kirchner, J. W., and A. Weil. 2000. Delayed biological recoveryfrom extinctions throughout the fossil record. Nature 404:177–180.
MacArthur, R. H., and E. O. Wilson. 1967. The theory of islandbiogeography. Princeton University Press, Princeton, N.J.
Mark, G. A., and K. W. Flessa. 1977. A test for evolutionary equi-libria: Phanerozoic brachiopods and Cenozoic mammals. Pa-leobiology 3:17–22.
McKinney, M. L., and J. A. Drake, eds. 1998. Biodiversity dy-namics: turnover of populations, taxa, and communities. Co-lumbia University Press, New York.
Miller, A. I. 1997a. Dissecting global diversity patterns: exam-ples from the Ordovician Radiation. Annual Review of Ecol-ogy and Systematics 28:85–104.
———. 1997b. A new look at age and area: the geographic andenvironmental expansion of genera during the OrdovicianRadiation. Paleobiology 23:410–419.
———. 1998. Biotic transitions in global marine diversity. Sci-ence 281:1157–1160.
Miller, A. I., and S. G. Mao. 1995. Association of orogenic activ-ity with the Ordovician Radiation of marine life. Geology 23:305–308.
———. 1998. Scales of diversification and the Ordovician Ra-diation. Pp. 288–310 in McKinney and Drake 1998.
Miller, A. I., and J. J. Sepkoski Jr. 1988. Modeling bivalve diver-sification: the effect of interaction on a macroevolutionarysystem. Paleobiology 14:364–369.
Nee, S., E. C. Holmes, R. M. May, and P. H. Harvey. 1995. Ex-tinction rates can be estimated from molecular phylogenies.Philosophical Transactions of the Royal Society of London B344:77–82.
Newell, N. D. 1967. Revolutions in the history of life. GeologicalSociety of America Special Paper 89:63–91.
Patzkowsky, M. E., and S. M. Holland. 1999. Biofacies replace-ment in a sequence stratigraphic framework: Middle and Up-per Ordovician of the Nashville Dome, Tennessee, USA. Pa-laios 14:301–323.

604 MIKE FOOTE
Pease, C. M. 1985. Biases in the durations and diversities of fos-sil taxa. Paleobiology 11:272–292.
Raup, D. M. 1972. Taxonomic diversity during the Phanerozoic.Science 117:1065–1071.
———. 1976a. Species diversity in the Phanerozoic: a tabula-tion. Paleobiology 2:279–288.
———. 1976b. Species diversity in the Phanerozoic: an inter-pretation. Paleobiology 2:289–297.
———. 1979. Biases in the fossil record of species and genera.Bulletin of the Carnegie Museum of Natural History 13:85–91.
———. 1983. On the early origins of major biologic groups. Pa-leobiology 9:107–115.
———. 1985. Mathematical models of cladogenesis. Paleobiol-ogy 11:42–52.
———. 1991. A kill curve for Phanerozoic marine species. Pa-leobiology 17:37–48.
———. 1992. Large-body impact and extinction in the Phaner-ozoic. Paleobiology 18:80–88.
Raup, D. M., and G. E. Boyajian. 1988. Patterns of generic ex-tinction in the fossil record. Paleobiology 14:109–125.
Raup, D. M., and D. Jablonski. 1993. Geography of end-Creta-ceous marine bivalve extinctions. Science 260:971–973.
Raup, D. M., and J. J. Sepkoski Jr. 1982. Mass extinctions in themarine fossil record. Science 215:1501–1503.
Raup, D. M., S. J. Gould, T. J. M. Schopf, and D. S. Simberloff.1973. Stochastic models of phylogeny and the evolution of di-versity. Journal of Geology 81:525–542.
Raymond, A., and C. Metz. 1995. Laurussian land-plant diver-sity during the Silurian and Devonian: mass extinction, sam-pling bias, or both? Paleobiology 21:74–91.
Ronov, A. B. 1994. Phanerozoic transgressions and regressionson the continents: a quantitative approach based on areasflooded by the sea and areas of marine and continental de-position. American Journal of Science 294:777–801.
Rosenzweig, M. L. 1992. Species diversity gradients: we knowmore and less than we thought. Journal of Mammalogy 73:715–730.
———. 1995. Species diversity in space and time. CambridgeUniversity Press, Cambridge.
Roy, K., D. Jablonski, J. W. Valentine, and G. Rosenberg. 1998.Marine latitudinal diversity gradients: tests of causal hypoth-eses. Proceedings of the National Academy of Sciences USA95:3699–3702.
Rutherford, S., S. D’Hondt, and W. Prell. 1999. Environmentalcontrols on the geographic distribution of zooplankton di-versity. Nature 400:749–753.
Scotese, C. R., and W. S. McKerrow. 1990. Revised World mapsand introduction. Pp. 1–21 in W. S. McKerrow and C. R. Sco-tese, eds. Palaeozoic palaeogeography and biogeography.Geological Society Memoir 12. Geological Society of London.
Sepkoski, J. J., Jr. 1978. A kinetic model of Phanerozoic taxonom-ic diversity I. Analysis of marine orders. Paleobiology 4:223–251.
———. 1979. A kinetic model of Phanerozoic taxonomic diver-sity II. Early Phanerozoic families and multiple equilibria. Pa-leobiology 5:222–251.
———. 1981. A factor analytic description of the Phanerozoicmarine fossil record. Paleobiology 7:36–53.
———. 1984. A kinetic model of Phanerozoic taxonomic diver-sity. III. Post-Paleozoic families and mass extinctions. Paleo-biology 10:246–267.
———. 1987. Environmental trends in extinction during the Pa-leozoic. Science 235:64–66.
———. 1990. The taxonomic structure of periodic extinction.Geological Society of America Special Paper 247:33–44.
———. 1991. Population biology models in macroevolution. InN. L. Gilinsky and P. W. Signor, eds. Analytical paleobiology.
Short Courses in Paleontology 4:136–156. Paleontological So-ciety, Knoxville, Tenn.
———. 1992. A compendium of fossil marine animal families,2d ed. Milwaukee Public Museum Contributions in Biologyand Geology 83:1–156.
———. 1993. Phanerozoic diversity at the genus level: problemsand prospects. Geological Society of America Abstracts withPrograms 25:A50.
———. 1996a. Competition in macroevolution: the doublewedge revisited. Pp. 211–255 in Jablonski et al. 1996.
———. 1996b. Patterns of Phanerozoic extinction: a perspectivefrom global databases. Pp. 35–52 in O. H. Walliser, ed. Globalevents and event stratigraphy. Springer, Berlin.
———. 1997. Biodiversity: past, present, and future. Journal ofPaleontology 71:533–539.
———. 1998. Rates of speciation in the fossil record. Philosoph-ical Transactions of the Royal Society of London B 353:315–326.
Sepkoski, J. J., Jr., and A. I. Miller. 1985. Evolutionary faunas andthe distribution of Paleozoic marine communities in spaceand time. Pp. 153–190 in J. W. Valentine, ed. Phanerozoic di-versity patterns: profiles in macroevolution. Princeton Uni-versity Press, Princeton, N.J.
Sepkoski, J. J., Jr., and P. M. Sheehan. 1983. Diversification, fau-nal change, and community replacement during the Ordovi-cian radiations. Pp. 673–717 in M. J. S. Tevesz and P. L. McCall,eds. Biotic interactions in recent and fossil benthic commu-nities. Plenum, New York.
Sepkoski, J. J., Jr., R. K. Bambach, D. M. Raup, and J. W. Valentine.1981. Phanerozoic marine diversity and the fossil record. Na-ture 293:435–437.
Siegel, S., and N. J. Castellan Jr. 1988. Nonparametric statisticsfor the behavioral sciences, 2d ed. McGraw-Hill, New York.
Smith, A. B., and C. H. Jeffery. 1998. Selectivity of extinctionamong sea urchins at the end of the Cretaceous period. Nature392:69–71.
Stanley, S. M. 1979. Macroevolution, pattern and process. W. H.Freeman, San Francisco.
———. 1984. Temperature and biotic crises in the marine realm.Geology 12:205–208.
———. 1985. Rates of evolution. Paleobiology 11:13–26.———. 1988a. Paleozoic mass extinctions: shared patterns sug-
gest global cooling as a common cause. American Journal ofScience 288:334–352.
———. 1988b. Climatic cooling and mass extinction of Paleo-zoic reef communities. Palaios 3:228–232.
———. 1990. The general correlation between rate of speciationand extinction: fortuitous causal linkages. Pp. 103–127 in R.M. Ross and W. D. Allmon, eds. Causes of evolution. Univer-sity of Chicago Press, Chicago.
———. 1999. The myth of the diversity plateau: high extinctionrates, not ecological saturation, stifled the diversification ofPaleozoic marine life. Geological Society of America Ab-stracts with Programs 31:A337.
Stehli, F. G., and J. W. Wells. 1971. Diversity and age gradientsin hermatypic corals. Systematic Zoology 20:115–126.
Taylor, P. D., and P. A. Allison. 1998. Bryozoan carbonatesthrough time and space. Geology 26:459–462.
Tucker, R. D., and W. S. McKerrow. 1995. Early Paleozoic chro-nology: a review in light of new U-Pb zircon ages from New-foundland and Britain. Canadian Journal of Earth Sciences 32:368–379.
Valentine, J. W. 1969. Patterns of taxonomic and ecological struc-ture of the shelf benthos during Phanerozoic time. Palaeon-tology 12:684–709.
———. 1973. Evolutionary paleoecology of the marine bio-sphere. Prentice-Hall, Englewood Cliffs, N.J.

605DIVERSITY DYNAMICS
Van Valen, L. 1969. Climate and evolutionary rate. Science 166:1656–1658.
———. 1973. A new evolutionary law. Evolutionary Theory 1:1–30.
———. 1984. A resetting of Phanerozoic community evolution.Nature 307:50–52.
———. 1985a. How constant is extinction? Evolutionary Theory7:93–106.
———. 1985b. A theory of origination and extinction. Evolu-tionary Theory 7:133–142.
———. 1994. Concepts and the nature of selection by extinction:is generalization possible? Pp. 200–216 in W. Glen, ed. Themass extinction debates: how science works in a crisis. Stan-ford University Press, Stanford, Calif.
Van Valen, L., and G. E. Boyajian. 1987. Comment and reply on‘‘Phanerozoic trends in background extinction: consequenceof an aging fauna. ’’ Geology 15:875–876.
Van Valen, L., and V. C. Maiorana. 1985. Patterns of origination.Evolutionary Theory 7:107–125.
Walker, T. D., and J. W. Valentine. 1984. Equilibrium models ofevolutionary species diversity and the number of empty nich-es. American Naturalist 124:887–899.
Webb, S. D. 1969. Extinction-origination equilibria in late Ce-nozoic land mammals of North America. Evolution 23:688–702.
Wilkinson, B. H. 1979. Biomineralization, paleoceanography,and the evolution of calcareous marine organisms. Geology 7:524–527.
Wilson, J. L. 1975. Carbonate facies in geologic history. Springer,New York.
Ziegler, A. M., M. L. Hulver, A. L. Lottes, and W. F. Schmach-tenberg. 1984. Uniformitarianism and paleoclimates: infer-ences from the distribution of carbonate rocks. Pp. 3–25 in P.Brenchley, ed. Fossils and climate. Wiley, New York.