original demineralization and remineralization phenomena
TRANSCRIPT
Oki Hayashi et al.: Demineralization and Remineralization Phenomena of Enamel
OriginalDemineralization and Remineralization Phenomena of Human Enamel
in Acid Erosion Model
Oki Hayashi1), Toshie Chiba2), Shinji Shimoda2) and Yasuko Momoi1)
1) Department of Operative Dentistry, Tsurumi University School of Dental Medicine, Yokohama, Japan2) Department of Oral Anatomy, Tsurumi University School of Dental Medicine, Yokohama, Japan(Accepted for publication, November 13, 2015)
Abstract: In this study, in vitro experiments were conducted using an acid erosion model to investigate andcompare changes in enamel demineralization over time in different age groups. A total of 34 human extractedteeth with no caries were used, 17 of which came from subjects in their 20s at the time of extraction and 17 fromsubjects in their 60s. To measure the depth and the volume of enamel demineralization, the teeth were immersedin demineralization solution (0.1 N HCl) for durations of 30 seconds, two minutes, one hour and five hours. Interms of the results, one important finding was that on the outermost layer of the enamel exposed to the acidicsolution, an acid resistance layer was observed after only 30 seconds of exposure and after up to five hours ofexposure. Detailed investigation of this hypermineralized layer revealed that the molar ratio for Ca/P was 1.16± 0.02, the width of the layer was 0.9 ± 0.2 m, and dense depositions of large and small quadrilateral crystalswere observed. Another important result is that the volume of enamel lost per second of exposure to thedemineralization solution initially declined exponentially over time, with the largest rate of loss observed at 30seconds of demineralization, after which the demineralization time increased and a tendency was seen for astate of equilibrium to be reached. Based on the results of this study using an acid erosion model, we concludethat while the demineralization solution penetrated into the interior of the enamel even after only a few secondsof exposure, minerals eluted from the crystals were confirmed to have been remineralized. In terms of age,enamel demineralization was not considerably influenced by age since no statistically significant differences indemineralization depth or volume were observed between the 20s and 60s age groups.
Key words: Human enamel, Acid erosion, Demineralization, High-mineralization layer, Enamel loss
Correspondence to: Dr. Oki Hayashi, Department of Operative Dentistry,Tsurumi University School of Dental Medicine, 2-1-3 Tsurumi, Tsurumi-ku, Yokohama, Kanagawa, 230-8501 Japan; Tel: +81-45-580-8429; Fax:+81-45-584-7997; E-mail: [email protected]
Introduction
Caries and acid erosion are two of the primary conditions thatcause human enamel to dissolve. Keyes1) identified three factorsin caries lesions; host and teeth, microorganisms, and substrate.Later, Newbrun2) added a fourth factor, that of time. Currently,cariogenesis is thought to occur when these four factors areconcurrent. Two dynamic mechanisms that cause onset andprogression of enamel caries have been identified in the interfacebetween enamel surface and saliva; demineralization andremineralization3). Acid erosion4), however, rather than involvingmicroorganisms, is understood to be a progressive condition inwhich acids introduced from outside the human body, such asfoods and beverages, and acids present in the stomach, such asgastric acids, act directly on tooth enamel to cause erosion. Withrespect to acid erosion, numerous studies have examined variousaspects, from in vivo studies to in situ assessment of the erosionof human enamel caused by acidic foods and beverages. Imfeld5)
has reported an increase in the incidence of acid erosion in stepwith increases in consumption of acidic beverages such as softdrinks and fruit juices. Owens6) et al. evaluated the pH levels ofsoft drinks and reported that the pH of carbohydrate drinks wasbetween 2.4 and 3.1, and that of sports drinks was between 3.1and 3.4. Enamel was then exposed to various beverages and thetooth surfaces were examined morphologically, using a scanningelectron microscope. Bartlett7) et al. examined the teeth of 3,187patients between the ages of 18 and 35 years and found signs ofacid erosion in 29 %, thus showing a relationship between aciderosion and the amount of fruits and juices consumed. Many ofthe studies performed to date, however, did not quantitativelyevaluate acid and the volume of enamel lost, or the time involved,and none of them evaluated the phenomenon of tooth enameldemineralization at the crystal level. In our study, we used humanenamel of a known age and conducted in vitro studies using theacid erosion model in a detailed investigation that also compareddifferent age groups to track changes in enamel demineralizationover time. The aims of the study were: 1) to examine therelationship between enamel demineralization time and the volume
27
Journal of Hard Tissue Biology 25[1] (2016) 27- 34© 2016 The Hard Tissue Biology Network Association
Printed in Japan, All rights reserved.CODEN-JHTBFF, ISSN 1341-7649
J.Hard Tissue Biology Vol. 25(1):27 -34, 2016
of demineralization; 2) to observe changes in the microstructureof the area in which enamel demineralization occurred; and 3) toinvestigate the interaction between sound enamel and acid. As aresult, we hoped to clarify the process of enamel demineralizationand remineralization caused by acid erosion.
Materials and MethodsTeeth used for experiment
From human extracted teeth with no caries owned by theDepartment of Oral Anatomy of the Tsurumi University Schoolof Dental Medicine, we used a total of 34 teeth; 17 from subjectsin their 20s at the time of extraction and 17 from subjects in their60s. The teeth, which had been preserved in a 10 % formalinsolution, were taken out of the formalin solution prior to theexperiment and were washed for 24 hours under running water.Use of the teeth in this study was approved by the EthicsCommittee of the Tsurumi University School of Dental Medicine(approval No.: 1306).
Demineralization solutionThe demineralization solution used was 0.1 N HCl (pH 1.8).
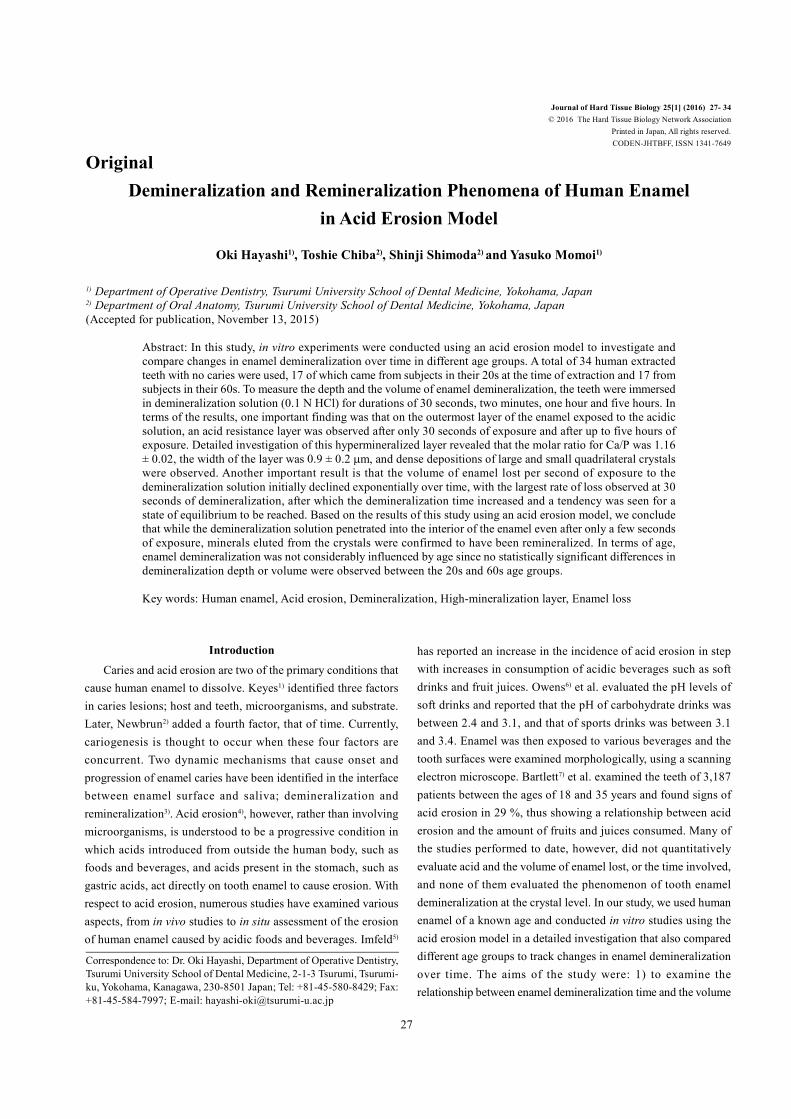
Demineralization times were 30 seconds, two minutes, one hourand five hours. As shown in Fig.1, a peristaltic pump was used tomaintain the volume of supplied demineralization solution at 800ml in a 1000-ml beaker. The demineralization solution in the beakerat room temperature was stirred using a magnetic stirrer, and theenamel specimens were suspended in such a way that they wereconstantly in contact with fresh demineralization solution.
Measurement of demineralization depth of enamelSpecimen preparation
A total of 18 teeth were used, nine from subjects in their 20sand nine from subjects in their 60s. Prior to the experiment, enamelsurfaces of the crowns were cleaned using a rubber cup and pouringwater over the surfaces. After teeth were dried, whole surfaces ofthe tooth roots were coated using various colors of nail varnish,and demineralization time of the enamel surface coated with nail
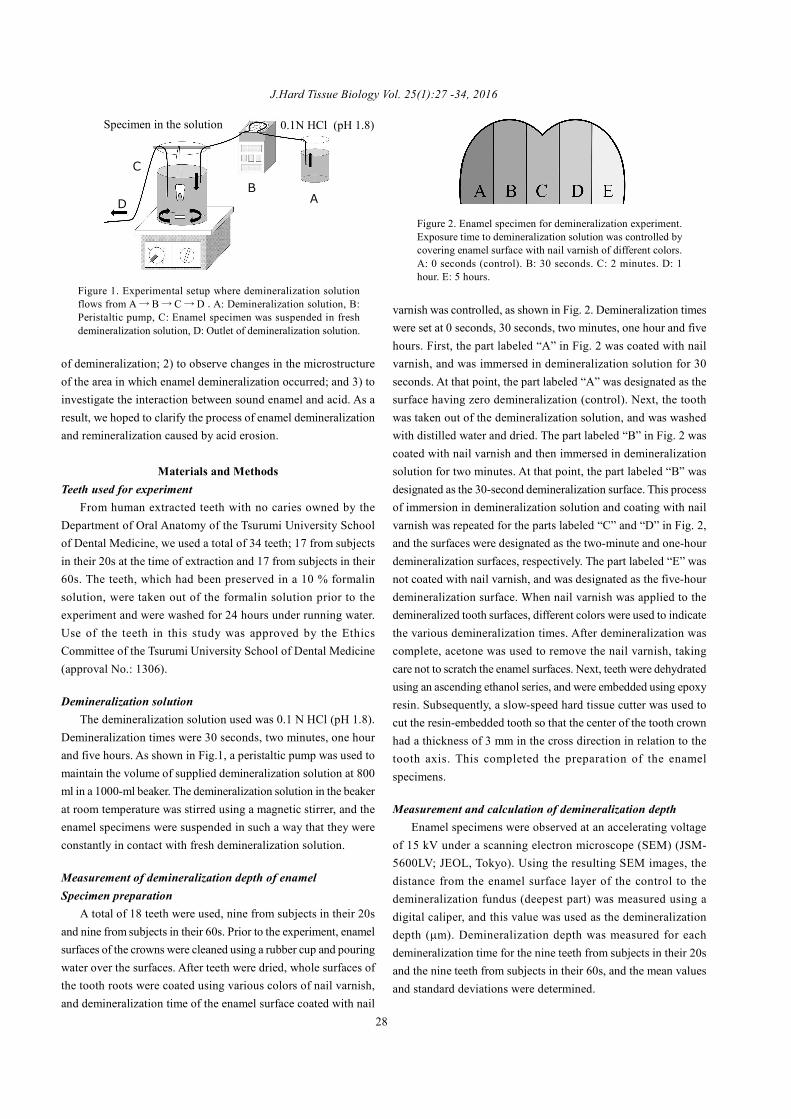
varnish was controlled, as shown in Fig. 2. Demineralization timeswere set at 0 seconds, 30 seconds, two minutes, one hour and fivehours. First, the part labeled “A” in Fig. 2 was coated with nailvarnish, and was immersed in demineralization solution for 30seconds. At that point, the part labeled “A” was designated as thesurface having zero demineralization (control). Next, the toothwas taken out of the demineralization solution, and was washedwith distilled water and dried. The part labeled “B” in Fig. 2 wascoated with nail varnish and then immersed in demineralizationsolution for two minutes. At that point, the part labeled “B” wasdesignated as the 30-second demineralization surface. This processof immersion in demineralization solution and coating with nailvarnish was repeated for the parts labeled “C” and “D” in Fig. 2,and the surfaces were designated as the two-minute and one-hourdemineralization surfaces, respectively. The part labeled “E” wasnot coated with nail varnish, and was designated as the five-hourdemineralization surface. When nail varnish was applied to thedemineralized tooth surfaces, different colors were used to indicatethe various demineralization times. After demineralization wascomplete, acetone was used to remove the nail varnish, takingcare not to scratch the enamel surfaces. Next, teeth were dehydratedusing an ascending ethanol series, and were embedded using epoxyresin. Subsequently, a slow-speed hard tissue cutter was used tocut the resin-embedded tooth so that the center of the tooth crownhad a thickness of 3 mm in the cross direction in relation to thetooth axis. This completed the preparation of the enamelspecimens.
Measurement and calculation of demineralization depthEnamel specimens were observed at an accelerating voltage
of 15 kV under a scanning electron microscope (SEM) (JSM-5600LV; JEOL, Tokyo). Using the resulting SEM images, thedistance from the enamel surface layer of the control to thedemineralization fundus (deepest part) was measured using adigital caliper, and this value was used as the demineralizationdepth ( m). Demineralization depth was measured for eachdemineralization time for the nine teeth from subjects in their 20sand the nine teeth from subjects in their 60s, and the mean valuesand standard deviations were determined.
Figure 1. Experimental setup where demineralization solutionflows from A→ B→ C→D .A: Demineralization solution, B:Peristaltic pump, C: Enamel specimen was suspended in freshdemineralization solution, D: Outlet of demineralization solution.
Figure 2. Enamel specimen for demineralization experiment.Exposure time to demineralization solution was controlled bycovering enamel surface with nail varnish of different colors.A: 0 seconds (control). B: 30 seconds. C: 2 minutes. D: 1hour. E: 5 hours.
28
AB
C
D
Specimen in the solution 0.1N HCl (pH 1.8)
Oki Hayashi et al.: Demineralization and Remineralization Phenomena of EnamelStatistical processing of results
Assays of the differences in demineralization depth amongthe teeth from subjects in their 20s and in their 60s were analyzedusing SPSS (Statistics Ver. 19, IBM Japan), with 5% as the levelof significance, using two-way ANOVA and Mann-Whitney.
Backscattered electron image observation of the enamel surfacelayer
In order to verify the state of mineralization of the enamelsurface layer, one representative tooth from those from a subjectin his/her 20s and one typical tooth from a subject in his/her 60swere taken from among the specimens used for demineralizationdepth measurement, and backscattered electron images (BEI;accelerating voltage: 20 kV) were captured for 30-seconddemineralization and five-hour demineralization.
Element (Ca, P) analysis of the enamel surface layerIn order to identify the Ca and P element concentrations of
the enamel surface layer, we used specimens on which BEIobservation of the enamel surface layer had been carried out andperformed quantitative measurement using linear analysis on five-hour demineralization portions of teeth from subjects in their 20s,using an electron probe microanalyzer (EPMA) (JXA-8900R;JEOL, Tokyo, Japan). Elemental analysis using EPMA wasperformed at an accelerating voltage of 20 kV, with an irradiationelectron current of 2.5e-8 mA. Measurement was performed atthree sites on the specimen, and mean values were taken as Caand P concentrations (CPS: counts per second). From these values,the Ca/P ratio obtained using chemical analysis of the naturalfluoroapatite crystals, which will be described later, was used asthe calibration standard, and the Ca/P ratio of the specimen wascalculated.
Chemical analysis of fluoroapatite single crystalsThe natural fluoroapatite single crystals used as a reference
sample weighed 0.5 g and were dissolved at 3.75 N in 100 ml ofHCl. Ca was measured using the OCPC method (o-cresolphthaleincomplexone), and P was measured using the p-(methylamino)phenol reduction method (Phospho-C test, Wako, Osaka) by meansof absorptiometry. Ca/P ratio was determined from themeasurement results. The Ca/P ratio of 1.63 obtained fromchemical analysis performed in this manner was used as thereference value for calibration.
Measurement of cubic volume of enamel lossSpecimen preparation
A total of 16 teeth were used, eight each from subjects in their20s and their 60s. Prior to the start of the experiment, the enamelsurface was washed using a rubber cup under running water. Afterthe tooth had been dried, the root surface was coated with nailvarnish, and the tooth was made available for subsequent
experiments.
Measurement of cubic volumeIn order to compare the volumes of enamel before and after
demineralization, an x-ray micro-CT (MCT-CB100MFZ; Hitachi,Tokyo, Japan) was used and x-ray micro-CT images of thespecimens were captured at an accelerating voltage of 50 kV, anirradiation current of 100 mA, and a slice thickness of 0.064 mm.Images were taken of the specimens, which had been immersedin demineralization solution for 30 seconds, two minutes, onehour and five hours, and bone morphometry measurement software(TRI/3DBone; RATOC, Tokyo, Japan) was used to perform 3-dimensional reconstruction from the CT image slice data andevaluate the cubic volume (mm3) of the enamel beforedemineralization and after demineralization had been carried outfor the various lengths of time. The volume of enamel lost eachsecond (mm3/s) was calculated by taking the difference betweenthe cubic volume of the enamel before demineralization and thecubic volume of the enamel after each of the variousdemineralization times, and dividing by the time (seconds) thatthe enamel had been immersed in demineralization solution.
Statistical processing of resultsAssays of the differences in the volume of enamel lost each
second (mm3/s) among the teeth from subjects in their 20s and intheir 60s were analyzed using SPSS with 5% as the level ofsignificance, using two-way ANOVA and Mann-Whitney.
Transmission electron microscope observation of demineralizedsurfaces
Of the specimens used to measure cubic volume, representativespecimens extracted from subjects in their 20s that had beenimmersed in demineralization solution for five hours underwentascending alcohol dehydration using conventional methods, andwere then embedded in epoxy resin. Subsequently, ultra-thinsections were prepared and unstained demineralized surfaces wereexamined under a transmission electron microscope (JEM-1400;accelerating voltage, 80 kV).
ResultsDemineralization depth of enamel
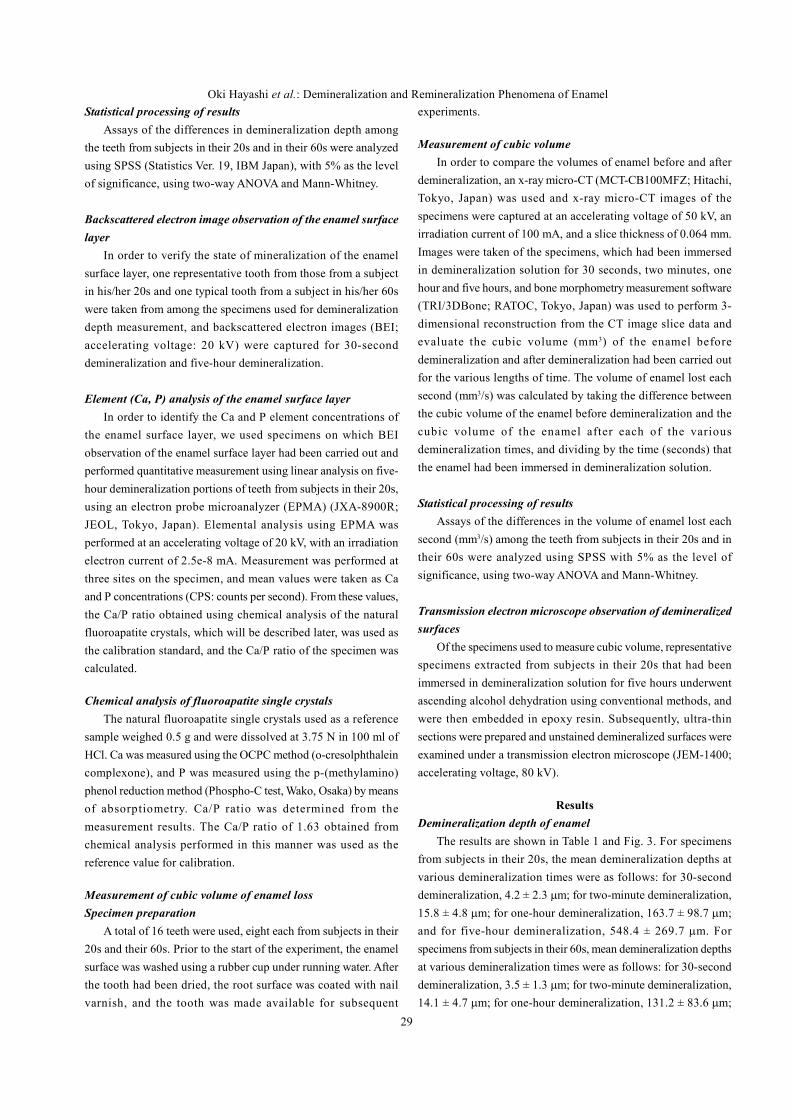
The results are shown in Table 1 and Fig. 3. For specimensfrom subjects in their 20s, the mean demineralization depths atvarious demineralization times were as follows: for 30-seconddemineralization, 4.2 ± 2.3 m; for two-minute demineralization,15.8 ± 4.8 m; for one-hour demineralization, 163.7 ± 98.7 m;and for five-hour demineralization, 548.4 ± 269.7 m. Forspecimens from subjects in their 60s, mean demineralization depthsat various demineralization times were as follows: for 30-seconddemineralization, 3.5 ± 1.3 m; for two-minute demineralization,14.1 ± 4.7 m; for one-hour demineralization, 131.2 ± 83.6 m;
29
J.Hard Tissue Biology Vol. 25(1):27 -34, 2016
age group* demineralized time µm (S.D)30sec 2min 1h 5h
20' s 4.2 (2.3) 15.8 (4.8) 163.7 (98.7) 548.4 (269.7)60' s 3.5 (1.3) 14.1 (4.7) 131.2 (83.6) 448.7 (172.6)
Table 1. Means of Demineralization Depth of Enamel
Figure 3. Change of demineralization depth ( m) with immersiontime in demineralization solution. n=9 each age group.
demineralization depth between the two age groups, but at onehour and five hours of demineralization, there was a tendency fordemineralization depth to be larger in the teeth taken from subjectsin their 20s than those in their 60s. Moreover, calculations of thepercentage of standard deviation in relation to the mean value(CV: coefficient of variation) showed no statistically significantdifferences between the teeth from subjects in their 20s and thosein their 60s.
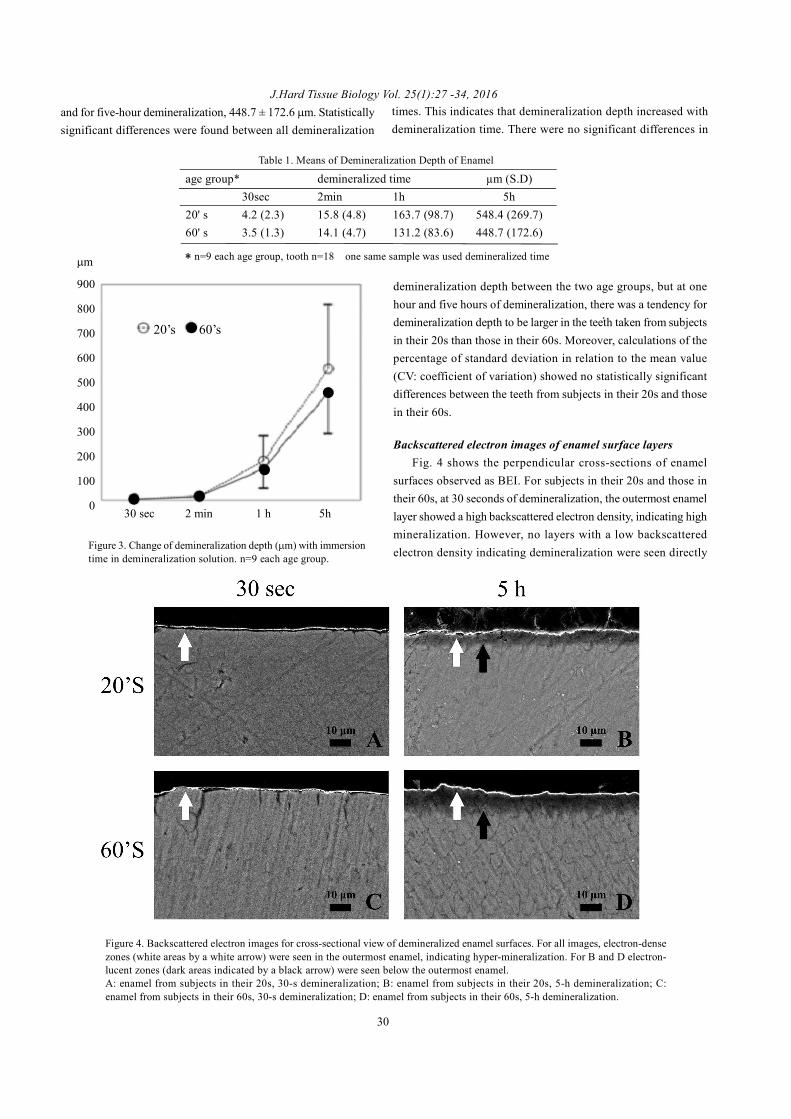
Backscattered electron images of enamel surface layersFig. 4 shows the perpendicular cross-sections of enamel
surfaces observed as BEI. For subjects in their 20s and those intheir 60s, at 30 seconds of demineralization, the outermost enamellayer showed a high backscattered electron density, indicating highmineralization. However, no layers with a low backscatteredelectron density indicating demineralization were seen directly
Figure 4. Backscattered electron images for cross-sectional view of demineralized enamel surfaces. For all images, electron-densezones (white areas by a white arrow) were seen in the outermost enamel, indicating hyper-mineralization. For B and D electron-lucent zones (dark areas indicated by a black arrow) were seen below the outermost enamel.A: enamel from subjects in their 20s, 30-s demineralization; B: enamel from subjects in their 20s, 5-h demineralization; C:enamel from subjects in their 60s, 30-s demineralization; D: enamel from subjects in their 60s, 5-h demineralization.
and for five-hour demineralization, 448.7 ± 172.6 m. Statisticallysignificant differences were found between all demineralization
times. This indicates that demineralization depth increased withdemineralization time. There were no significant differences in
30
* n=9 each age group, tooth n=18 one same sample was used demineralized time
30 sec 2 min 1 h 5h
m
900
800
700
600
500
400
300
200
100
0
20’s 60’s
● ●
●
●
●
Oki Hayashi et al.: Demineralization and Remineralization Phenomena of Enamel
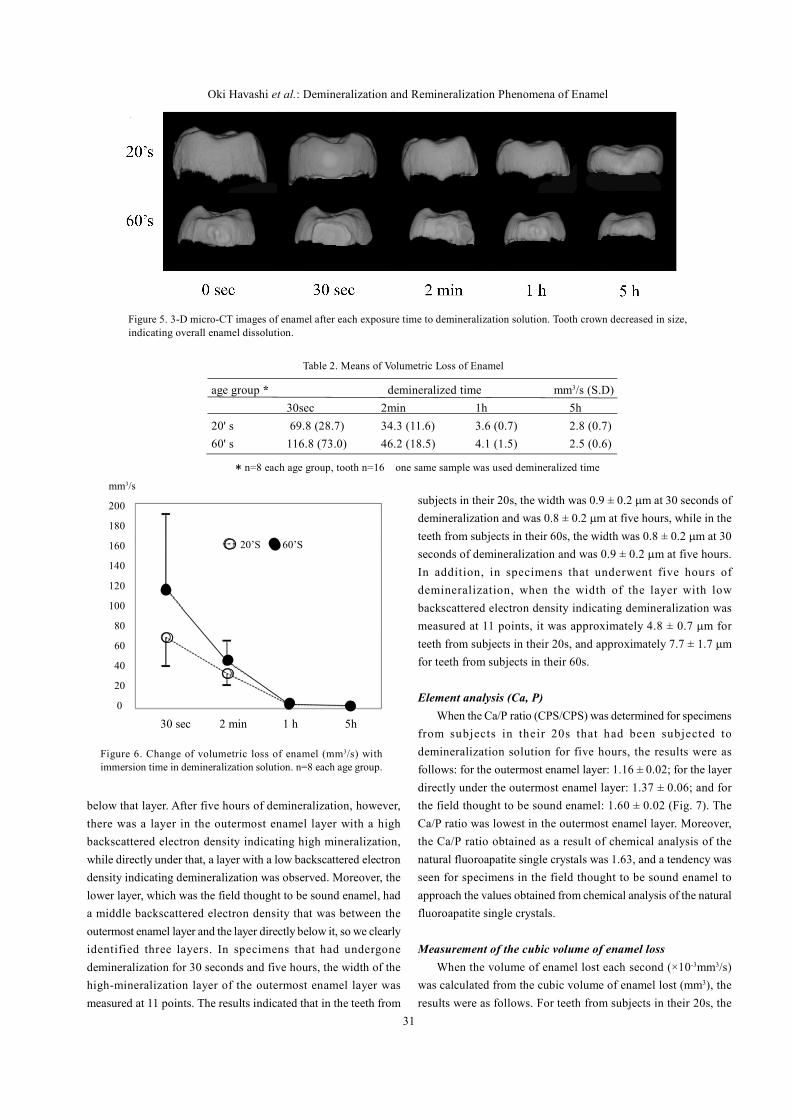
Figure 5. 3-D micro-CT images of enamel after each exposure time to demineralization solution. Tooth crown decreased in size,indicating overall enamel dissolution.
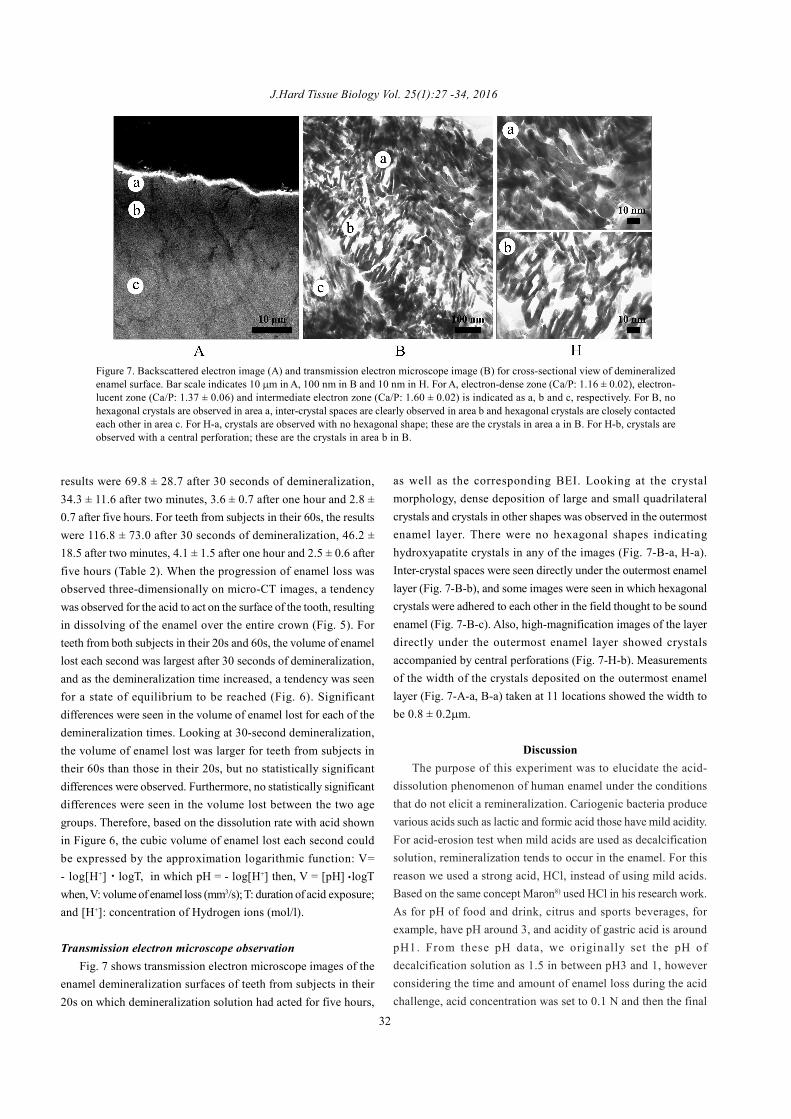
Figure 6. Change of volumetric loss of enamel (mm3/s) withimmersion time in demineralization solution. n=8 each age group.
below that layer. After five hours of demineralization, however,there was a layer in the outermost enamel layer with a highbackscattered electron density indicating high mineralization,while directly under that, a layer with a low backscattered electrondensity indicating demineralization was observed. Moreover, thelower layer, which was the field thought to be sound enamel, hada middle backscattered electron density that was between theoutermost enamel layer and the layer directly below it, so we clearlyidentified three layers. In specimens that had undergonedemineralization for 30 seconds and five hours, the width of thehigh-mineralization layer of the outermost enamel layer wasmeasured at 11 points. The results indicated that in the teeth from
subjects in their 20s, the width was 0.9 ± 0.2 m at 30 seconds ofdemineralization and was 0.8 ± 0.2 m at five hours, while in theteeth from subjects in their 60s, the width was 0.8 ± 0.2 m at 30seconds of demineralization and was 0.9 ± 0.2 m at five hours.In addition, in specimens that underwent five hours ofdemineralization, when the width of the layer with lowbackscattered electron density indicating demineralization wasmeasured at 11 points, it was approximately 4.8 ± 0.7 m forteeth from subjects in their 20s, and approximately 7.7 ± 1.7 mfor teeth from subjects in their 60s.
Element analysis (Ca, P)When the Ca/P ratio (CPS/CPS) was determined for specimens
from subjects in their 20s that had been subjected todemineralization solution for five hours, the results were asfollows: for the outermost enamel layer: 1.16 ± 0.02; for the layerdirectly under the outermost enamel layer: 1.37 ± 0.06; and forthe field thought to be sound enamel: 1.60 ± 0.02 (Fig. 7). TheCa/P ratio was lowest in the outermost enamel layer. Moreover,the Ca/P ratio obtained as a result of chemical analysis of thenatural fluoroapatite single crystals was 1.63, and a tendency wasseen for specimens in the field thought to be sound enamel toapproach the values obtained from chemical analysis of the naturalfluoroapatite single crystals.
Measurement of the cubic volume of enamel lossWhen the volume of enamel lost each second (×10-3mm3/s)
was calculated from the cubic volume of enamel lost (mm3), theresults were as follows. For teeth from subjects in their 20s, the
31
Table 2. Means of Volumetric Loss of Enamel
age group * demineralized time mm3/s (S.D)30sec 2min 1h 5h
20' s 69.8 (28.7) 34.3 (11.6) 3.6 (0.7) 2.8 (0.7)60' s 116.8 (73.0) 46.2 (18.5) 4.1 (1.5) 2.5 (0.6)
* n=8 each age group, tooth n=16 one same sample was used demineralized time
mm3/s
200
180
160
140
120
100
80
60
40
20
0
30 sec 2 min 1 h 5h
20’S 60’S●
●
●
● ●
〇
〇
〇
J.Hard Tissue Biology Vol. 25(1):27 -34, 2016
results were 69.8 ± 28.7 after 30 seconds of demineralization,34.3 ± 11.6 after two minutes, 3.6 ± 0.7 after one hour and 2.8 ±0.7 after five hours. For teeth from subjects in their 60s, the resultswere 116.8 ± 73.0 after 30 seconds of demineralization, 46.2 ±18.5 after two minutes, 4.1 ± 1.5 after one hour and 2.5 ± 0.6 afterfive hours (Table 2). When the progression of enamel loss wasobserved three-dimensionally on micro-CT images, a tendencywas observed for the acid to act on the surface of the tooth, resultingin dissolving of the enamel over the entire crown (Fig. 5). Forteeth from both subjects in their 20s and 60s, the volume of enamellost each second was largest after 30 seconds of demineralization,and as the demineralization time increased, a tendency was seenfor a state of equilibrium to be reached (Fig. 6). Significantdifferences were seen in the volume of enamel lost for each of thedemineralization times. Looking at 30-second demineralization,the volume of enamel lost was larger for teeth from subjects intheir 60s than those in their 20s, but no statistically significantdifferences were observed. Furthermore, no statistically significantdifferences were seen in the volume lost between the two agegroups. Therefore, based on the dissolution rate with acid shownin Figure 6, the cubic volume of enamel lost each second couldbe expressed by the approximation logarithmic function: V=- log[H+]・logT, in which pH = - log[H+] then, V = [pH] logTwhen, V: volume of enamel loss (mm3/s); T: duration of acid exposure;and [H+]: concentration of Hydrogen ions (mol/l).
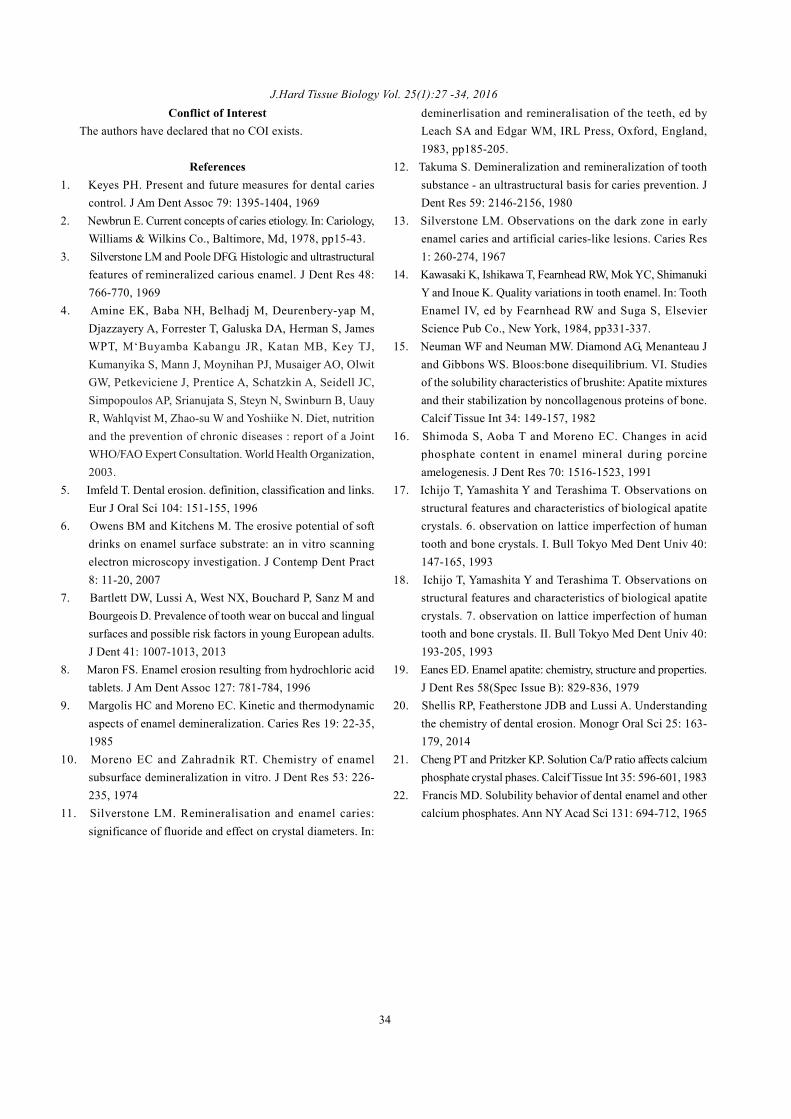
Transmission electron microscope observationFig. 7 shows transmission electron microscope images of the
enamel demineralization surfaces of teeth from subjects in their20s on which demineralization solution had acted for five hours,
as well as the corresponding BEI. Looking at the crystalmorphology, dense deposition of large and small quadrilateralcrystals and crystals in other shapes was observed in the outermostenamel layer. There were no hexagonal shapes indicatinghydroxyapatite crystals in any of the images (Fig. 7-B-a, H-a).Inter-crystal spaces were seen directly under the outermost enamellayer (Fig. 7-B-b), and some images were seen in which hexagonalcrystals were adhered to each other in the field thought to be soundenamel (Fig. 7-B-c). Also, high-magnification images of the layerdirectly under the outermost enamel layer showed crystalsaccompanied by central perforations (Fig. 7-H-b). Measurementsof the width of the crystals deposited on the outermost enamellayer (Fig. 7-A-a, B-a) taken at 11 locations showed the width tobe 0.8 ± 0.2 m.
DiscussionThe purpose of this experiment was to elucidate the acid-
dissolution phenomenon of human enamel under the conditionsthat do not elicit a remineralization. Cariogenic bacteria producevarious acids such as lactic and formic acid those have mild acidity.For acid-erosion test when mild acids are used as decalcificationsolution, remineralization tends to occur in the enamel. For thisreason we used a strong acid, HCl, instead of using mild acids.Based on the same concept Maron8) used HCl in his research work.As for pH of food and drink, citrus and sports beverages, forexample, have pH around 3, and acidity of gastric acid is aroundpH1. From these pH data, we originally set the pH ofdecalcification solution as 1.5 in between pH3 and 1, howeverconsidering the time and amount of enamel loss during the acidchallenge, acid concentration was set to 0.1 N and then the final
Figure 7. Backscattered electron image (A) and transmission electron microscope image (B) for cross-sectional view of demineralizedenamel surface. Bar scale indicates 10 m in A, 100 nm in B and 10 nm in H. For A, electron-dense zone (Ca/P: 1.16 ± 0.02), electron-lucent zone (Ca/P: 1.37 ± 0.06) and intermediate electron zone (Ca/P: 1.60 ± 0.02) is indicated as a, b and c, respectively. For B, nohexagonal crystals are observed in area a, inter-crystal spaces are clearly observed in area b and hexagonal crystals are closely contactedeach other in area c. For H-a, crystals are observed with no hexagonal shape; these are the crystals in area a in B. For H-b, crystals areobserved with a central perforation; these are the crystals in area b in B.
32
・

Oki Hayashi et al.: Demineralization and Remineralization Phenomena of EnamelpH resulted in 1.8. The most interesting finding from this studywas that although the enamel was exposed to the strong acid (HCl,pH1.8) for very short time (30 seconds), we found the hyper-mineralization layer, that is, the remineralization phenomenon,occurred on the outermost surface of the enamel. These unexpectedphenomenon was confirmed by SEM and TEM observation.Relationship between enamel demineralization time and volumeof demineralization; With respect to the relationship between timeand amount of demineralization, both the demineralization depthand volumetric loss tended to increase over time. There were nosignificant differences in demineralization depth between the twoage groups, but at one hour and five hours of demineralization,there was a tendency for the demineralization depth to be largerin the teeth taken from subjects in their 20s than those in their60s. For teeth from both subjects in their 20s and 60s, the volumeof enamel lost each second was largest after 30 seconds ofdemineralization, and as the demineralization time increased, atendency was seen for a state of equilibrium to be reached. Thesefindings indicated that while the demineralization solutionpenetrated into the interior of the enamel, and minerals elutedfrom the crystals were confirmed to have been remineralized inthe outermost layer of enamel. The remineralized crystals do notdissolve easily in acid, and function as acid-resistant crystals inthe surface layer of the enamel. Because of this, the amount ofdemineralization is thought to reach a state of equilibrium after aconsiderable amount of time has passed. For the outermost enamelthat reached a state of equilibrium, acid calcium phosphate crystalswere morphologically confirmed by TEM, and Ca/P ratio wasevaluated by EPMA. Changes in microstructure in areas whereenamel demineralization occurred; To date, there have been noreports describing detailed studies, such as BEI, on the degree ofmineralization after human teeth are exposed to acid for periodsof less than 30 seconds. The outcomes of numerous in vitroexperiments pertaining to chronic caries have given rise to thetheory that penetration of demineralization solution into the enamelcauses reflux of H+ inside the enamel, and as Ca2+, (PO4)
3-, OH-
and the other ions perfuse the enamel, the demineralization ofapatite crystals progresses9,10). In the present study, a layer withhigh electron density could be confirmed on the outermost enamellayer even after only 30 seconds of demineralization (Fig. 4-A,C), and possibly, a phenomenon similar to the typical white spotlesion described above is taking place, even in shallow fields, asa result of a demineralization time of 30 seconds. In other words,even in a very short time period of demineralization, H+ acts onapatite crystals and demineralization progresses, with the resultthat eluted inorganic ions such as Ca2+, (PO4)
3- and OH- areremineralized on the outermost enamel layer, forming an electron-dense layer. After five hours of demineralization, the H + hadpenetrated to a deeper area than after 30 seconds. Thisphenomenon, in which inorganic ions from a deeper area possibly
perfuse the outermost enamel layer, is similar to findings describedin earlier reports10-14) in which chronic caries was used as a model.Interestingly, with respect to the width in the depth direction ofthe high-mineralization layer that was seen in the outermostenamel, in specimens that had undergone demineralization for 30seconds and five hours, the width did not differ, ranging from 0.8~ 0.9 μm (Fig. 4), and this was confirmed for both BEI (Fig. 4)and TEM (Fig. 7) observation. Therefore, there appears to be nocorrelation between the action time of the acid and the width inthe depth direction. This could be explained by pH in thelogarithmic function as described in the result. We assume thatwidth of the high-mineralization layer is influenced by the type ofacid. The Ca/P ratio of the layer formed on the outermost surfaceenamel was calculated to be 1.16. Generally, hydroxyapatite isthe only stable calcium phosphate crystal15) in the neutralenvironment, and its theoretical Ca/P ratio is 1.67 as calculatedwith molar ratio of apatite. Based on earlier studies16), the Ca/Pratio of human enamel is largely taken as 1.60. The reason thatthe Ca/P ratio of human hydroxyapatite crystals is not the 1.67 isthought to be that there are various lattice defects17,18) in humanenamel apatite crystals, as well as impurities19,20) such as CO3,while stable calcium phosphate crystals in the acid environmentare crystals such as di-calcium phosphate dehydrate (DCPD, Ca/P ratio: 1.0), octa calcium phosphate (OCP, Ca/P ratio: 1.3) andtri-calcium phosphate (TCP, Ca/P ratio: 1.5)21,22). Based on theresults of the present study, a relationship between the Ca/P ratioand the deposited crystal morphology is speculated as follows.The Ca/P ratio of the outermost layer of the enamel is 1.16, whichis similar to that of DCPD, 1.0. We believe that the reason is thepresence of crystals other than DCPD, TCP, OCP and/or HAPbetween the crystals of the outermost enamel layer. In thisoutermost enamel layer, cross-sections of quadrilateral andpolygonal crystals were observed by transmission electronmicroscopy (Fig. 7-B-a, H-a). For the Ca/P ratio of the layerdirectly under the outermost layer of the enamel, which is 1.37,the value is similar to the theoretical molar ratio of OCP, 1.30.This could be because apatite crystals with central perforationswere observed, and other low molecular weight acid calciumphosphate crystals may be present in this field (Fig. 7-B-b, andH-b), while in layers not yet reached by ongoing demineralization,crystals that exhibited hexagonal shapes were confirmed (Fig. 7B-c).With respect to the fact that 1.60 was indicated in deep areasof the enamel (Fig. 7 A-c), this was thought to be because, asnoted above, hydroxyapatite contains various impurities.
AcknowledgementThe authors are deeply grateful for the technical support and
advice from all the staff in the Department of Oral Anatomy. Ourspecial thanks go to Mr. Koji Inoue for his generous help. Wealso thank our colleagues in the Department of Operative Dentistry.
33
J.Hard Tissue Biology Vol. 25(1):27 -34, 2016Conflict of Interest
The authors have declared that no COI exists.
References1. Keyes PH. Present and future measures for dental caries
control. J Am Dent Assoc 79: 1395-1404, 19692. Newbrun E. Current concepts of caries etiology. In: Cariology,
Williams & Wilkins Co., Baltimore, Md, 1978, pp15-43.3. Silverstone LM and Poole DFG. Histologic and ultrastructural
features of remineralized carious enamel. J Dent Res 48:766-770, 1969
4. Amine EK, Baba NH, Belhadj M, Deurenbery-yap M,Djazzayery A, Forrester T, Galuska DA, Herman S, JamesWPT, M‘Buyamba Kabangu JR, Katan MB, Key TJ,Kumanyika S, Mann J, Moynihan PJ, Musaiger AO, OlwitGW, Petkeviciene J, Prentice A, Schatzkin A, Seidell JC,Simpopoulos AP, Srianujata S, Steyn N, Swinburn B, UauyR, Wahlqvist M, Zhao-su W and Yoshiike N. Diet, nutritionand the prevention of chronic diseases : report of a JointWHO/FAO Expert Consultation. World Health Organization,2003.
5. Imfeld T. Dental erosion. definition, classification and links.Eur J Oral Sci 104: 151-155, 1996
6. Owens BM and Kitchens M. The erosive potential of softdrinks on enamel surface substrate: an in vitro scanningelectron microscopy investigation. J Contemp Dent Pract8: 11-20, 2007
7. Bartlett DW, Lussi A, West NX, Bouchard P, Sanz M andBourgeois D. Prevalence of tooth wear on buccal and lingualsurfaces and possible risk factors in young European adults.J Dent 41: 1007-1013, 2013
8. Maron FS. Enamel erosion resulting from hydrochloric acidtablets. J Am Dent Assoc 127: 781-784, 1996
9. Margolis HC and Moreno EC. Kinetic and thermodynamicaspects of enamel demineralization. Caries Res 19: 22-35,1985
10. Moreno EC and Zahradnik RT. Chemistry of enamelsubsurface demineralization in vitro. J Dent Res 53: 226-235, 1974
11. Silverstone LM. Remineralisation and enamel caries:significance of fluoride and effect on crystal diameters. In:
deminerlisation and remineralisation of the teeth, ed byLeach SA and Edgar WM, IRL Press, Oxford, England,1983, pp185-205.
12. Takuma S. Demineralization and remineralization of toothsubstance - an ultrastructural basis for caries prevention. JDent Res 59: 2146-2156, 1980
13. Silverstone LM. Observations on the dark zone in earlyenamel caries and artificial caries-like lesions. Caries Res1: 260-274, 1967
14. Kawasaki K, Ishikawa T, Fearnhead RW, Mok YC, ShimanukiY and Inoue K. Quality variations in tooth enamel. In: ToothEnamel IV, ed by Fearnhead RW and Suga S, ElsevierScience Pub Co., New York, 1984, pp331-337.
15. Neuman WF and Neuman MW. Diamond AG, Menanteau Jand Gibbons WS. Bloos:bone disequilibrium. VI. Studiesof the solubility characteristics of brushite: Apatite mixturesand their stabilization by noncollagenous proteins of bone.Calcif Tissue Int 34: 149-157, 1982
16. Shimoda S, Aoba T and Moreno EC. Changes in acidphosphate content in enamel mineral during porcineamelogenesis. J Dent Res 70: 1516-1523, 1991
17. Ichijo T, Yamashita Y and Terashima T. Observations onstructural features and characteristics of biological apatitecrystals. 6. observation on lattice imperfection of humantooth and bone crystals. I. Bull Tokyo Med Dent Univ 40:147-165, 1993
18. Ichijo T, Yamashita Y and Terashima T. Observations onstructural features and characteristics of biological apatitecrystals. 7. observation on lattice imperfection of humantooth and bone crystals. II. Bull Tokyo Med Dent Univ 40:193-205, 1993
19. Eanes ED. Enamel apatite: chemistry, structure and properties.J Dent Res 58(Spec Issue B): 829-836, 1979
20. Shellis RP, Featherstone JDB and Lussi A. Understandingthe chemistry of dental erosion. Monogr Oral Sci 25: 163-179, 2014
21. Cheng PT and Pritzker KP. Solution Ca/P ratio affects calciumphosphate crystal phases. Calcif Tissue Int 35: 596-601, 1983
22. Francis MD. Solubility behavior of dental enamel and othercalcium phosphates. Ann NY Acad Sci 131: 694-712, 1965
34