original citation - wrap: warwick research archive...
TRANSCRIPT

http://wrap.warwick.ac.uk
Original citation: Armond, Jonathan W., Saha, Krishanu, Rana, Anas A., Oates, Chris J., Jaenisch, Rudolf, Nicodemi, Mario and Mukherjee, Sach. (2014) A stochastic model dissects cell states in biological transition processes. Scientific Reports, Volume 4 . Article number 3692. ISSN 2045-2322 Permanent WRAP url: http://wrap.warwick.ac.uk/59107 Copyright and reuse: The Warwick Research Archive Portal (WRAP) makes this work of researchers of the University of Warwick available open access under the following conditions. This article is made available under the Creative Commons Attribution-NonCommercial-ShareAlike 3.0 (CC BY-NC-SA 3.0) license and may be reused according to the conditions of the license. For more details see: http://creativecommons.org/licenses/by-nc-sa/3.0/ A note on versions: The version presented in WRAP is the published version, or, version of record, and may be cited as it appears here. For more information, please contact the WRAP Team at: [email protected]

A stochastic model dissects cell states inbiological transition processesJonathan W. Armond1, Krishanu Saha2, Anas A. Rana1,4, Chris J. Oates1,4,5, Rudolf Jaenisch3,6,Mario Nicodemi7 & Sach Mukherjee4
1Centre for Complexity Science, University of Warwick, Coventry, UK, 2Department of Biomedical Engineering, University ofWisconsin-Madison, Madison, WI, USA, 3The Whitehead Institute for Biomedical Research, Massachusetts Institute of Technology,Cambridge, MA, USA, 4Division of Biochemistry, The Netherlands Cancer Institute, Amsterdam, The Netherlands, 5Department ofStatistics, University of Warwick, Coventry, UK, 6Department of Biology, Massachusetts Institute of Technology, Cambridge, MA,USA, 7Dip.to di Scienze Fisiche, Univ. di Napoli ‘‘Federico II’’, INFN Napoli, Italy.
Many biological processes, including differentiation, reprogramming, and disease transformations, involvetransitions of cells through distinct states. Direct, unbiased investigation of cell states and their transitions ischallenging due to several factors, including limitations of single-cell assays. Here we present a stochasticmodel of cellular transitions that allows underlying single-cell information, including cell-state-specificparameters and rates governing transitions between states, to be estimated from genome-wide,population-averaged time-course data. The key novelty of our approach lies in specifying latent stochasticmodels at the single-cell level, and then aggregating these models to give a likelihood that links parameters atthe single-cell level to observables at the population level. We apply our approach in the context ofreprogramming to pluripotency. This yields new insights, including profiles of two intermediate cell states,that are supported by independent single-cell studies. Our model provides a general conceptual frameworkfor the study of cell transitions, including epigenetic transformations.
Anumber of biologically important processes involve transitions through distinct cell states.Differentiation1–9, reprogramming10,11 and disease initiation and progression12–14 are among the manyexamples of this kind. State changes in such processes are in general stochastic, as reflected in experi-
mentally observed variation in transition latency even in the setting where transitions arise in homogenous cellcultures subjected to defined driving events (e.g. Hanna et al.17).
Stochasticity of transitions at the single-cell level (Fig. 1a) imply that during such a process a cell population is amixture of cells in different states, with the state composition of the cell population itself time-varying (Fig. 1b).Studying single-cell events in heterogenous, time-varying populations is challenging and the global changes insingle-cell transcriptional, metabolic, and epigenetic state that are involved in these processes remain incomple-tely understood. High-throughput assays based on homogenates provide only population-averaged data; intransition processes such data represent averages over heterogenous states (Fig. 1c). Genome-wide single-cellprotocols are now emerging2,4, but their efficiency, availability and depth remain limited. Furthermore, these arenot live cell assays, so cannot be used to directly track genome-wide molecular profiles of single cells undergoingstate transitions.
Here we present a general stochastic model of transition processes that links parameters at the single cell level totime-course data at the cell population level, as obtained for example in conventional expression, proteomic orepigenetic assays based on homogenates. The key novelty of our approach is to specify latent stochastic models atthe single-cell level and then (mathematically) aggregate the models to give a likelihood at the level of homogenatedata. As we show below, this allows parameters specific to single-cell states and transitions between them to beestimated from homogenate, time-course data. To facilitate analysis of data collected at non-uniform time pointswe use continuous-time Markov processes as the single-cell models.
Estimation of model parameters from population-averaged time-course data then gives information on severalaspects of the single-cell states and transitions, including:
. Single-cell state profiles (e.g. state-specific expression, protein or epigenetic profiles);
. State markers (e.g. genes, proteins or marks that are highly specific to individual states); and,
. Dynamical information concerning transition rates, cell residence times, and population composition throughtime.
OPEN
SUBJECT AREAS:STATISTICAL METHODS
COMPUTATIONAL MODELS
STATISTICS
REPROGRAMMING
Received28 June 2013
Accepted3 December 2013
Published17 January 2014
Correspondence andrequests for materials
should be addressed toM.N. (nicodem@na.
infn.it) orS.M. (s.mukherjee@
nki.nl)
SCIENTIFIC REPORTS | 4 : 3692 | DOI: 10.1038/srep03692 1

To fix ideas and illustrate our approach, we develop and apply ourmodel in the context of reprogramming of mouse embryonic fibro-blasts (MEFs) to a state of pluripotency10,15,16. This is a process thathas been widely studied in recent years, and where a number ofadvanced experimental approaches have been brought to bear.Recent studies have shown that reprogramming has a substantialstochastic component. Subclones derived from the same transducedsomatic cells activate pluripotency markers, such as Nanog-GFP, atvery different times, over a range of a few weeks10,15,16. Further, thereis evidence that the entire cell population has the potential to give riseto pluripotent cells during direct reprogramming, i.e., there is not an‘‘elite’’ group of cells that are uniquely able to do so17. Thus, currentevidence suggests reprogramming is an inherently stochastic pro-cess17 in which individual cells change from an initial differentiatedstate to an induced pluripotent stem cell (iPSC) state. Single-cellstudies using pre-selected sets of genes have begun to elucidate cel-lular events in reprogramming19–22. However, at the genome-widelevel many questions remain open and our understanding of the statetransitions, including the number of traversed states, their markergenes and transition rates, remains limited.
In our model, we suppose that a cell can stochastically visit a set ofn states during the transition process (Fig. 1d). Transitions between
these states are described by a latent continuous-time Markov pro-cess whose discrete state space is identified with cell states (seeMethods and SI for details). The model parameters are (i) the trans-ition rates wi,i9 between states i and i9 and (ii) state-specific para-meters bij that represent the mean expression level for gene j in state i(we focus on transcriptomic data here, but the analysis could bereadily applied to e.g. proteomic or epigenomic data). We refer tothe b’s as state-specific signatures (Fig. 1e). The population dynamicsare characterized solely by the transition rates: given the rates wi,i9,the Markov model yields the probability pi(t) of being in state i attime t. For a large number of cells, the population-averaged express-ion xj(t) of gene j at time t is then a combination of state-specificexpression levels weighted by the probability of being in each state(Fig. 1f):
xj tð Þ~b1jp1 tð Þzb2jp2 tð Þz � � �zbnjpn tð Þ ð1Þ
Both wi,i9 and bij can be estimated from time-course data. Com-plicated transition networks may require ancillary data to ensureidentifiability. Here, for simplicity, here we limit ourselves to con-sider only linear forward-transition models (i.e., no reverse arrows inFig. 1d); this constraint allows direct application to conventional,time-course data. In the reprogramming context, we note that recent
Figure 1 | Stochastic cell state transitions and population-averaged molecular data (illustrated, without loss of generality, with reference toreprogramming and gene expression data). (a), Coarse schematic showing a cell changing state (to a pluripotent state) via intermediate single-cell states.
(b), Since cells stochastically change state during the transition process (horizontal lines), at any given time the population is heterogeneous. (c), Gene
expression levels, as measured in mainstream high-throughput assays based on homogenates, represent averages over cells that may be in different states.
(d), Our model specifies a latent stochastic process that describes state transitions at the single-cell level. Aggregation of these latent processes gives a
likelihood (i.e. a data model) at the level of population-averaged data as depicted in part c. Estimation of model parameters gives information regarding
state-to-state transition rates, wi,i11 as well as molecular profiles that are specific to cell states (part e). Here, estimated state-specific expression profiles bij
(where j indexes genes and i indexes states) are represented as an illustrative, genome-wide heat map (with genes in columns and states in rows).
(f), Estimated transition rates w give information on the cell population dynamics, specifically the fraction of cells pi(t) in each state i as a function of time t.
www.nature.com/scientificreports
SCIENTIFIC REPORTS | 4 : 3692 | DOI: 10.1038/srep03692 2
data17 support the idea that almost all donor cells eventually give riseto iPS cells. These results were determined from single cell assays thatobserved the appearance of one marker for the final state, expressionof the Nanog pluripotency gene, and indicated an irreversible switchto pluripotency during reprogramming11. For the reprogrammingapplication we present, as discussed in detail below, we furtherassume that all cells in the starting population are in an initial (dif-ferentiated) state.
We put forward a computationally efficient approach for estima-tion, as implemented in software called STAMM (State Transitionsusing Aggregated Markov Models; see Methods and SI for details).As we illustrate below, STAMM can be readily applied to full-gen-ome studies. Furthermore, since STAMM is rooted in a probabilisticmodel, model selection methods allow exploration of the likely num-ber of single-cell states in a transition process of interest.
Hidden Markov models (HMMs) are widely used to describelatent processes in biological applications and have previously beenused to describe cell populations26 and model the cell cycle27,28. It isinteresting to contrast our model with a classical HMM. The keydifferences are twofold. First, our model involves aggregation ofsingle-cell level Markov chains, thus it deals with states that arenot only hidden, but whose connection to population-level observa-bles necessarily involves averaging over multiple instances of thelatent process. In contrast, a HMM applied to time-course data froma transition process does not provide a model at the single-cell level.Second, our model operates in continuous time and applies naturallyto non-uniformly sampled data. In contrast, in a HMM the under-lying Markov process operates in discrete time, such that the prob-ability of a state transition is the same between successive time pointsregardless of the intervening time period. This assumption generallywill not hold at all under uneven time sampling of a heterogenouspopulation. Due to these reasons, in our view HMMs are intrinsicallyill-suited to the study of transition processes of the type we considerhere.
An alternative approach to using HMMs is to attempt directdeconvolution based on a model of single-cell expression profiles,e.g.29–31. These approaches have greater deconvolution power but arehindered by the upfront requirement for an expression model. Forexample, Siegal-Gaskins et al.29 established a model for the progres-sion of Caulobacter cells through their own cell cycle. Similarly,Rowicka et al.31 measured the distribution of cell cycle time-shiftsbased on well-known cell cycle regulated genes. While these methodscan in principle be adapted for other organisms and systems, theSTAMM method presented here is immediately and directly
applicable to time-course data from general transition processes. Inparticular, it is not necessary to find genes following regular express-ion profiles, nor is it necessary to have an a priori knowledge of thephases of the process of interest, which in many applications,including reprogramming as considered here, remain incompletelyunderstood.
Differential expression analysis is widely used to highlight poten-tially important players in high-throughput studies. Approacheshave also been proposed for time course data that rank genes(or proteins) according to whether they show evidence of changeover time or relative to a control time course23,24,32 or that clustertogether genes that show similar temporal profiles25. However, theseapproaches do not attempt to model single-cell state transitions noraccount for cellular heterogeneity.
ResultsOur main results were obtained by application of STAMM to gen-ome-wide gene expression time-course data due to Samavarchi-Tehrani et al.18 (hereafter referred to as ‘‘the Samavarchi-Tehranidata’’). These data were obtained during reprogramming of a ‘‘sec-ondary’’ mouse embryonic fibroblast (MEF) system that expressesOct4, Sox2, Klf4, and cMyc for 30 days. The starting MEF culture wasisolated from chimeric mice and maintained for less than 5 passages;under these conditions the simplifying assumption of an initiallyhomogeneous cell population is arguably a reasonable one, sincesubstantial long-term changes are unlikely. Below we describe theresults we obtained from analysis of these data, including detailedprofiles of intermediate states, and insights regarding transition ratesand population dynamics. Furthermore, we compare these resultswith recent single-cell data19–22 from related secondary MEF repro-gramming systems.
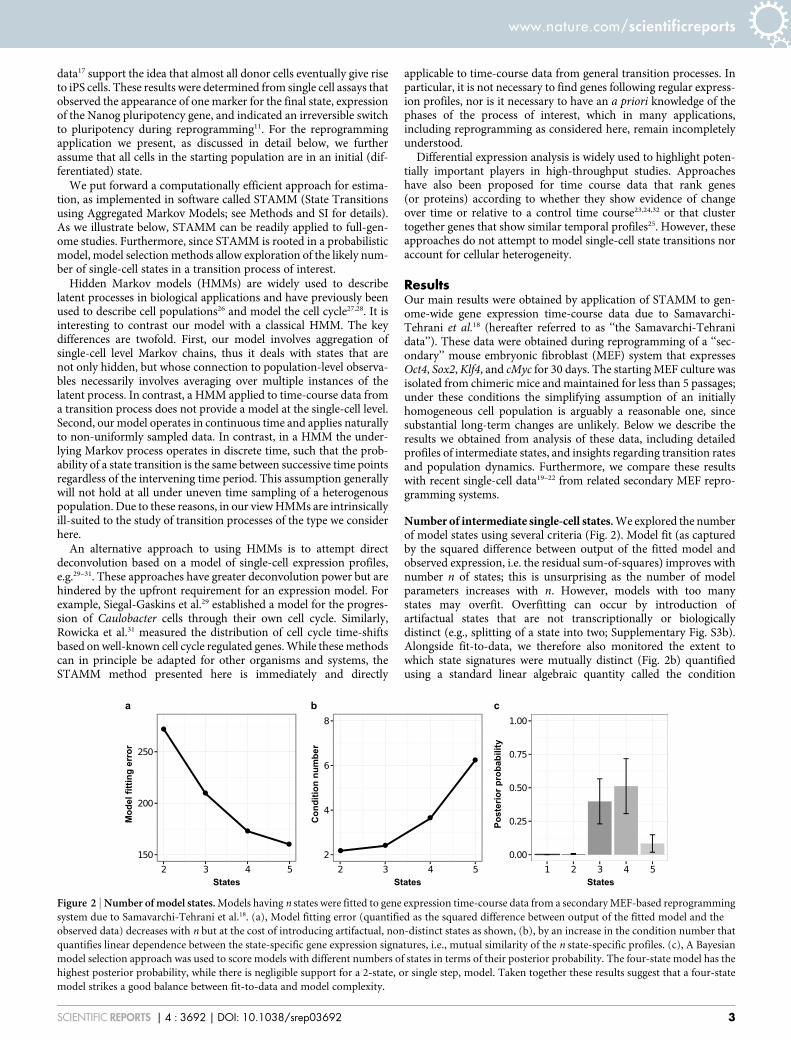
Number of intermediate single-cell states. We explored the numberof model states using several criteria (Fig. 2). Model fit (as capturedby the squared difference between output of the fitted model andobserved expression, i.e. the residual sum-of-squares) improves withnumber n of states; this is unsurprising as the number of modelparameters increases with n. However, models with too manystates may overfit. Overfitting can occur by introduction ofartifactual states that are not transcriptionally or biologicallydistinct (e.g., splitting of a state into two; Supplementary Fig. S3b).Alongside fit-to-data, we therefore also monitored the extent towhich state signatures were mutually distinct (Fig. 2b) quantifiedusing a standard linear algebraic quantity called the condition
Figure 2 | Number of model states. Models having n states were fitted to gene expression time-course data from a secondary MEF-based reprogramming
system due to Samavarchi-Tehrani et al.18. (a), Model fitting error (quantified as the squared difference between output of the fitted model and the
observed data) decreases with n but at the cost of introducing artifactual, non-distinct states as shown, (b), by an increase in the condition number that
quantifies linear dependence between the state-specific gene expression signatures, i.e., mutual similarity of the n state-specific profiles. (c), A Bayesian
model selection approach was used to score models with different numbers of states in terms of their posterior probability. The four-state model has the
highest posterior probability, while there is negligible support for a 2-state, or single step, model. Taken together these results suggest that a four-state
model strikes a good balance between fit-to-data and model complexity.
www.nature.com/scientificreports
SCIENTIFIC REPORTS | 4 : 3692 | DOI: 10.1038/srep03692 3

number (see SI). We find that already with just five states thecondition number is sharply increased and signatures are nolonger distinct (Fig. 2b), suggesting that the improved fit is simplydue to artifactual splitting of states. In addition, we carried out aBayesian model selection, computing a probability score overnumber of states that takes account of both fit-to-data and modelcomplexity in a principled way (see Methods and SI for details anddiscussion). This analysis supports the existence of intermediatestates, with highest posterior probability associated with a four-state model (Fig. 2c).
Thus, a four-state model appears to strike a good balance betweenparsimony and fit-to-data. The model shows clearly distinct statesignatures (Fig. 2b and Fig. 3e and f) yet, despite having only threedynamical parameters, fits diverse time-courses well (see, e.g., Fig. 3dwhere some of the genes considered by Samavarchi-Tehrani et al.18
are shown). Taken together, these results suggest that a total of foursingle-cell states with distinct expression profiles, including two, newintermediate states, are visited during reprogramming of secondaryMEFs to pluripotency. Below we explore the four-state model indetail.
Cell state-specific transcriptional profiles. We identify a total offour cell states as visited in the transition from MEF to iPSC.Genome-wide transcriptional profiles for these four states areshown in Figure 3e (full list in Supplementary Table S2; genes werefiltered as described in Methods and SI and a total of 4383 genes werefit; parameter estimation and checks of robustness appear inMethods and SI). Figure 3f shows signatures for a subset of corereprogramming-related genes (listed in Supplementary Table S1).The sets of genes that characterize individual states broadlyrecapitulate known functional groups and the order in which thestates appear are consistent with specific roles. The initial state (S1,triangle) is marked by high expression of MEF marker genes such as
Cdh2 and Thy1 and mesenchymal genes including Snai2 (also knownas Slug) and Zeb1. Many of these genes remain on in the firstintermediate state (S2, square), but Jag1, Notch1 and Cdh2 havebeen switched off. Correspondingly, expression of proliferationgenes, such as Ccnd1, start increasing. The second intermediatestate (S3, diamond) is marked by epithelial-associated genes suchas Epcam, Ocln, Cdh1, and the loss of the MEF markers. Thus, ourmodel identifies a mesenchymal-to-epithethial transition (MET) of agroup of genes from state S2 to S3 that is consistent with previousobservations18. However, our results reveal that the MET is just oneaspect of a much broader change of state involving a dramatic, globalreconfiguration of the transcriptional program of a substantialfraction of genes (more than 70% of the genes show two-fold orgreater change in state-resolved expression between successivestates, as illustrated by the heat-map of Fig. 3e). The final state (S4,star) is negative for genes such as Tgfb1, and positive for ESC markerssuch as Nanog, Zfp42 (also known as Rex1), Esrrb, Dppa5a, Utf1,Dppa3, consistent with its iPSC nature.
Functional enrichment in individual states. To further characterizethe functional nature of the states identified by STAMM we carriedout a Gene Ontology (GO) analysis using the estimated state-specificexpression profiles. Specifically, we identified GO terms that areover-represented among genes up- or down-regulated in indivi-dual states: the over-representation p-values are shown in Supple-mentary Figure S4 (see Supplementary Methods for details). Thebroad categories highlighted reveal the progression of reprogram-ming seen in the single-cell states identified by STAMM. Overall, GOanalysis of the states traversed during reprogramming of secondaryMEF into iPSC in the Samavarchi-Tehrani system illustrates thatafter the typical MEF signature of state S1, in state S2 reprogram-ming factors seem to trigger a broad range of cell activities includ-ing signaling, morphogenesis, differentiation and transcription
0
Figure 3 | A stochastic, multi-state model for reprogramming. (a), We fitted a four-state model to gene expression time-course data from a secondary
MEF-based reprogramming system due to Samavarchi-Tehrani et al.18. (b), Estimated rates for each transition. (c), The probability of a cell to be in a
particular state as a function of time during reprogramming. (d), Observed time-course data (blue with crosses) and output of the fitted model (green) for
selected genes. (e), Genome-wide, state-specific gene expression signatures. The cell states have markedly different global transcriptional profiles.
(f), Gene expression signatures for selected genes that are discussed in the text. Red genes have state-specific expression that is below and green genes above
the state average (dotted vertical lines). Genes are shown by category, from top to bottom: pluripotency, epithelial, signaling, mesenchymal, and growth.
The model highlights major transcriptional changes between states, including a mesenchymal-to-epithelial transition from state 2 to 3, and the
establishment of pluripotency marker genes in the transition from state 3 to 4.
www.nature.com/scientificreports
SCIENTIFIC REPORTS | 4 : 3692 | DOI: 10.1038/srep03692 4

regulation; in S3 a narrowing seems to occur around fewer keyactivities in preparation for state S4 where convergence towards theiPSC state occurs. The latter state is high in activities related, amongother processes, with cycle regulation and chromatin organization.
Cell population dynamics. STAMM gives estimates of transitionrates in the latent stochastic process (that describes changes in cellstate) that give information on the dynamics of the changing cellpopulation. Figure 3c shows the distribution of the cell populationacross states as a function of time; the changing fraction of cells ineach state result from single cell transitions between states (Fig. 3b).The transition from S1 to S2 takes on average about 4 days, and thetransition between S2 and S3 has a similar timescale. We find, how-ever, that the final step of the process, from second intermediate (S3)to final state (S4), is the slowest to occur, taking on average 15 days.Our model predicts therefore that the last transition is the processbottleneck, implying that it would be natural to act on it to try toincrease reprogramming speed and efficiency. The average transitionrates that we determine shed light on the strong stochasticity ofreprogramming, whereby even identical subclones reach the iPSCstate with very different latency times16. In fact, each intermediate
transition is a Poisson process and the variance of its transition timeis proportional to its transition rate. Since the overall processcomprises multiple steps, its overall variance is roughly the sum ofthe single step variances. Thus, our model predicts a variance of thetotal reprogramming time of the order of 3 weeks, a value consistentwith experimental findings16.
Cell state markers and the molecular circuitry of reprogramming.STAMM allows ranking of genes according to state-specific expres-sion, and can be used to provide insights and hypotheses concerninghow specific genes are modulated during state transitions. We focus,in particular, on:
. Switch genes, which are expressed in a particular state and persistat moderate-to-high expression levels in subsequent states; and
. Pulse genes, which are switched on in a particular state, but turnedoff in all other states (see also Methods; full ranked lists of stategenes are reported in Supplementary Table S2).
Gene lists for each pulse and switch were further analyzed usingthe Gene Set Enrichment Analysis tool (GSEA; www.broadinstitute.
Figure 4 | Cell state markers and the molecular circuitry of reprogramming. Application of our model to data from the the reprogramming system of
Samavarchi-Tehrani et al.18 yields a gene ranking that, unlike conventional differential expression and related analyses, is based on cell state-specific
estimates. We used our approach to identify state marker genes and to explore the molecular circuitry underpinning reprogramming. Five state-resolved
expression profiles are shown: ‘‘switches’’ occur when a gene is expressed in a particular cell state and remains on in subsequent states, while ‘‘pulses’’
occur when a gene is switched on in only one state, and is off in all other states. Estimated state-specific expression levels were used to rank genes in each
profile; genes shown are selected from the top 5%, genome-wide, under each profile. Highlighted are transcription factors whose DNA binding motifs and
known occupancy of promoters through ChIP data show targeting of genes in each switch or pulse, as well as micro-RNAs (MIRs) targeting the genes.
www.nature.com/scientificreports
SCIENTIFIC REPORTS | 4 : 3692 | DOI: 10.1038/srep03692 5

org/gsea/msigdb/; see also Methods and SI) to investigate overlapwith published gene sets (Supplementary Table S4).
We sought to investigate whether STAMM is able to identify genesthat are known to play a role in reprogramming and further toidentify new insights, including potentially novel players in the pro-cess, from our genome-wide analysis. We focused on a selected groupof the top-5% high ranked switch and pulse genes (see Supplemen-tary Fig. S7); these are shown in Figure 4, which also highlightsmicro-RNAs (MIRs) and transcription factors whose DNA bindingmotifs and known occupancy of promoters through ChIP data showtargeting of those genes. Switches identify genes which can be turnedon to drive reprogramming via the induced factors (OSKM), andgenes which can serve as reprogramming factors. The histonedemethylase Utx, for instance, turns on quickly in S2 and remainsactive: it has been recently shown to be indispensable for reprogram-ming33. The S3 switch contains Wdr5, which mediates repro-gramming34. Expression of Gnl3 is specific to the S4 switch andpromotes reprogramming35. Myc and MIR-302 regulate subsets ofgenes in these switches and are have been shown to promotereprogramming36.
Intriguingly, several commonly accepted pluripotent markergenes, such as Nanog and Sall4 are already activated in the S3 switch,despite the fact that cells in S3 are on average 15 days away from thefinal state. In contrast, Klf5 and Sox2 are highly specific to S4 alone(Fig. 4). These observations are supported by recent independentsingle-cell experiments that indicate activation of Klf5 and Sox2 arelate steps in reprogramming19. Other factors specifically marking iPScells in these single-cell studies were Dppa4, Utf1 and Esrrb; all ofthese genes are highly specific to S4 in our analysis. The single cellanalysis also indicated that Gdf3 was activated in partially repro-grammed cells while Sox2 was not, consistent with the putativepre-pluripotent nature of that state and with our observation thatGdf3 is switched on in S3. Other poor markers of iPS cells in thesingle-cell assays were Sall4 and Kdm1 which are promiscuouslyturned on in S3 or earlier.
Pulses identify genes that we hypothesize must be tightly con-trolled during reprogramming, as they are turned on in only onestate. Indeed, constitutive over-expression of these factors has a com-plex relationship with reprogramming. Notably the Tcf3 bindingmotif is highly represented in the S3 pulse group (p 5 1.83 3
10212, hypergeometric test), and expression of these genes is lost inS4. Tcf3 forms an interconnected autoregulatory loop with Oct4,Sox2, and Nanog in pluripotent stem cells, and is mainly in a repress-ive complex promoting differentiation, although some Tcf3associates with b-catenin to activate target genes and promote plur-ipotency37. Tcf3 deletion increases reprogramming38 and Wnt signal-ing is known to accelerate reprogramming39. Our results suggest thatTcf3 needs to be recruited to form a repressive complex on the dif-ferentiation genes in S3, so that proper programming of the pluripo-tent state can occur. The S3 pulse further reveals that other masterregulators of differentiated lineages - Pax4, Zeb1, Foxo4, and Sox11 -also need to be turned off during this final transition. Several anno-tated sets of known pluripotency genes have significant overlap withthe top 5% genes of the S4 switch (p , 10215; see Methods andSupplementary Table S4 for gene lists). The top 5% genes of the S3
switch also have significant overlap with pluripotency gene lists (p #
1.35 3 1026) indicating that S3 may represent a pre-pluripotent state.STAMM differs fundamentally from existing gene-ranking
approaches because it estimates expression profiles that are specificto cell states. Thus, although existing gene ranking approaches basedon differential expression are certainly informative, STAMM offerscomplementary insights, rooted in a state-specific view. Indeed,genes highly ranked under STAMM that are implicated in repro-gramming and shown in Figure 4 are not highly ranked under con-ventional differential expression or temporal change criteria(Supplementary Fig. S7). STAMM can also be extended to identify
pairs of genes that can jointly act as state markers (see SI andSupplementary Fig. S9).
Testing model predictions against single-cell data. The foregoingresults were obtained from analysis of homogenate time-course dataonly (the microarray data due to Samavarchi-Tehrani et al.18). To testthe ability of our approach to uncover information on cell states wecompared results with recent independent single-cell datasets onreprogramming.
We focused first on a single-cell mRNA expression dataset due toBuganim et al.19 that considered a different secondary MEF systemunder reprogramming by the transduction of Oct4, Sox2, Klf4, andcMyc. The data were obtained using the Fluidigm assay, and includedsingle-cell gene expression data for 48 genes in up to 96 cells, in avariety of populations, ranging from starting MEFs, to cells at the 2-to-6 days stage of reprogramming, to iPS cells (see Fig. 5).
Since these data are single-cell readouts, clustering of the data canbe used to identify cell states that are distinct with respect to express-ion patterns, as individual cells belonging to the same state withsimilar single-cell expression profiles should lie close to each otherin gene expression space. We carried out a cluster analysis of the data(using a widely-used multi-variate clustering tool called mclust, seeSI) and selected the number of clusters using a score known as theBayesian Information Criterion (BIC). Although single cell technolo-gies are still not fully mature and remain affected by relevant experi-mental errors, we find that the BIC from the single-cell data (seeFig. 5a) has a large increase above two clusters but plateaus abovethree clusters. This does not support a single-step (two clusters)model but is consistent with the existence of one or two intermediatestates, in line with our predictions using independent microarraydata.
Next, we asked whether the state-specific expression profiles weidentified in the four-state model (as estimated from microarraytime-course data only) were consistent with single-cell expressionprofiles. To this end, we computed the distance of the gene express-ion profile of each single cell in the Buganim et al. data from each ofthe four state signatures that we estimated, and assigned each indi-vidual cell to the state that was closest to it in expression space. Thefraction of single cells assigned to each state in the various experi-mental populations is shown in Figure 5b. In contrast to a randomassignment that would populate each state roughly equally, we findthat specific states are highly represented in specific cell populations.The MEFs show a clear population peak in state 1, while MEFs at the2-to-6 days stage of reprogramming have an heterogeneous popu-lation spread over the first three states, with a peak at state 3. Finally,dox-independent colonies and iPS cells have a population distributedover state 3 and 4, peaking respectively at 3 and 4. The state assign-ment is consistent with the nature of the states and the progressionthrough the reprogramming process. Thus we find that individualcells from an independent single-cell study of a different secondaryMEF system project consistently onto the four states we identifiedusing microarray time-course data only.
We also briefly discuss three very recent comprehensive single-cellstudies of secondary reprogramming systems20–22. A key result inthose studies is the discovery of two intermediate ‘‘transcriptionalwaves’’ that occur in the first 12 days of reprogramming and mark thetransition from initial MEF to two subsequent ‘‘stages’’, which arelater followed by a ‘‘DNA methylation wave’’ when cells acquirestable pluripotency. These observations strongly support our inde-pendent, model-based prediction of two intermediate states and theirappearance within the first 10 days of reprogramming, followed bythe establishment of a fourth (iPSC-like) state. Thus, several recentsingle-cell studies appear to support the results we obtain fromapplication of STAMM to homogenate time-course data.
Application to other systems. While note must be taken of thediversity of different reprogramming systems, a four-state model
www.nature.com/scientificreports
SCIENTIFIC REPORTS | 4 : 3692 | DOI: 10.1038/srep03692 6

also fits data from the primary Mikkelsen et al.40 system (seeSupplementary Methods and Supplementary Fig. S8 for results),with severals genes, including Cdh1, Cdh2, Zeb1 and Nanog havingsimilar state profiles, although others are dissimilar, such as Zeb2,Epcam, Gata4 and Thy1. This highlights the possible existence ofcommon reprogramming mechanisms between primary andsecondary systems. However, the small number of time points inthe Mikkelsen data currently preclude a fuller comparison ofcommonalities and differences between state transitions anddynamics in the two systems. The model proposed in Hanna et al.for a B-cell based system17 can be recovered as a simpler case of themodel presented here, with exactly two states (one transition). Such atwo-state model does not give a good fit to the Samavarchi-Tehranidata (see Supplementary Fig. S3a), indicating that intermediate statesare needed to explain the dynamics seen in the secondary MEFsystem. Also in a single-cell mRNA-seq dataset due to Tang et al.2
obtained during the derivation of embryonic stem cells from theinner cell mass, we found that the number of states seen for genepairs in the single-cell data mirrors the corresponding discriminatoryscores obtained from our analysis of the Samavarchi-Tehranireprogramming data (see Supplementary Methods and Supple-mentary Fig. S9).
DiscussionWe put forward a new stochastic model for the investigation ofcellular transition processes. We showed how the model can be usedto explore transition processes in a genome-wide fashion using con-ventional, population-averaged time-course data, in this way provid-ing new insights as well as detailed guidance for single-cell studieswith smaller, selected sets of genes (or other molecular readouts).Application of our approach to stem-cell reprogramming recapitu-lated a wealth of known biology. Furthermore, the analysis shed newlight on the process, including several insights that we found to beconsistent with recent single-cell studies and novel hypotheses that
could be tested in future experiments. The approach could be simi-larly applied to differentiation, development or oncogenic trans-formation, to provide insights and hypotheses concerning cellstates visited during these processes.
Our model provides a bioinformatics tool as well as a conceptualframework that should be useful in helping to better understand cellstates and their transitions. However, several questions concerningthe meaning and interpretation of cell states remain open and werenot addressed in our analysis. Our model seeks to identify states thatare distinct with respect to the molecular data type used for analysis(here gene expression), but cannot itself determine whether suchdifferences correspond to states that are distinct in a deeper sense,for example in terms of a specific, discrete phenotype of interest. Thislimitation is analogous to that faced by cluster analysis: identifyinggroups of samples (e.g. cells, genes or patients) that are distinct withrespect to certain measured variables may or may not correspond to aspecific functional difference of interest. Our approach providesdetailed information regarding putative cell states; such informationshould be regarded as providing testable hypotheses and guidance forthe design of follow-up experiments.
In the case of stem-cell reprogramming we concluded that a fourstate model can be used to explain transcriptional dynamics observedduring reprogramming of MEFs into iPSCs in a secondary system18
(see Fig. 2). This led to detailed molecular profiles of two new, inter-mediate single-cell states. Our results suggested that the transitionbetween the second intermediate (S3) to the final reprogrammedstate (S4) is the process bottleneck. This multiple-state model alsoexplains the variance (over weeks) of subclone reprogrammingtimes, consistent with experimental observations16.
Our results show how state transitions in reprogramming involveglobal transcriptional changes (see Fig. 3). As one part of these globalchanges, we observed a mesenchymal-to-epithelial transition thattakes place between states S2 and S3, in agreement with previousexperimental observations18. Interestingly, our analysis contradicts
Figure 5 | Testing model predictions against independent single-cell data. Results obtained from application of our model to the microarray time-
course data were tested against independent single-cell gene expression data from a secondary reprogramming system due to Buganim et al.19. (a),
Number of clusters in the single-cell data. A score called the Bayesian Information Criterion (BIC) is shown as a function of number of clusters (see text for
details). (b), Matching individual cells to predicted states. Single cells within different experimental populations in Buganim et al. were assigned to each of
the four states in our model (all parameters were estimated using the microarray data only). Matching was done by similarity between single-cell
expression profiles and the state signatures. The heatmap shows the fraction of cells in each experimental population that were assigned to each state.
Assignments for different experiments show clear preference for certain states, in a manner consistent with the nature of the states, and in line with a
progression towards iPS via the intermediate states defined by our model. For example, the MEF populations have a marked peak in state 1, while cell lines
at the 2-to-6 days stage of reprogramming have an heterogeneous population spread over the first three states, with a peak at state 3. Finally, the
populations of dox-independent colonies and iPS cells belong to state 3 and 4, peaking respectively at 3 and 4.
www.nature.com/scientificreports
SCIENTIFIC REPORTS | 4 : 3692 | DOI: 10.1038/srep03692 7

the view that genes such as Nanog and Sall4 are true markers ofpluripotency, since these genes are already expressed in the pen-ultimate state S3 which is 15 days away from the final state S4.Strikingly, this observation is supported by recent single-cell data19.
Output from our model provides immediate and detailed guid-ance for the design of future single-cell experiments. We showed howstate-resolved analysis using STAMM complements and extendsavailable analyses and tools, providing new insights into the molecu-lar circuitry of reprogramming, including lists of single-cell statespecific ‘‘switch’’ and ‘‘pulse’’ genes (see Fig. 4). Since the STAMMgene lists and markers were obtained via an unbiased, genome-wideanalysis, highly-ranked genes may represent important candidatesfor future investigation. Moreover, since the model yields meantransition times between states, our results suggest specific times atwhich to optimally isolate intermediate states. In the reprogrammingcontext, such insights can also help to design strategies to optimallyaccelerate the transitions.
We tested our model predictions against recent single cell datafrom a different secondary MEF system19. This analysis suggests thata four state model is consistent with such data, and moreover thatindividual cells project in a consistent manner onto the states that weidentified using the Samavarchi-Tehrani microarray time-coursedata18 (see Fig. 5). Our predictions are also consistent with, and allowthe interpretion of, a number of very recent comprehensive stud-ies20–22 which revealed intermediate transcriptional waves in iPSCreprogramming. Overall, the available single-cell experimental datasupport the picture of the structure of reprogramming that emergesfrom our genome-wide analysis.
Large-scale epigenetic changes are also observed upon reprogram-ming11,41. The method we propose should be applicable to time-vary-ing epigenetic data42 to directly identify state-specific epigeneticsignatures along with expression patterns. The model we proposeand its future extensions can provide a starting point for a compre-hensive interpretation of the next-generation of single-cell data onreprogramming and other cellular transition processes in develop-ment, differentiation and disease.
MethodsHere, we briefly describe Methods used in the paper. Further information, includingfull technical details, appear in SI.
The model. Our model describes state changes at the single-cell level using alatent continuous-time Markov process. Here, we restricted attention toforward-only state transitions, such that transitions between n states indexed byi are parameterized by (n 2 1) transition rates wi,i11 (collectively denoted byw). Our general approach could in principle be extended to more generaltransition topologies, but depending on the specific application and modelconstraints further data could be required to ensure identifiability. The rateswi,i11 fully determine the dynamics (assuming rates of cell division and deathare independent of state). We assume that the initial population ishomogeneous (all cells in an initial state). Under these model assumptions, themaster equation for the latent Markov process can be solved fully (see SI fordetails) to give the probabilities pi(t) that an individual cell is in state i at time t(Fig. 3c).
Each state in the model has state-specific parameters bij that represent the meanexpression level for gene j in single-cell state i (‘‘state-specific signatures’’). Eachcell in the population is associated with its own latent Markov process; we assumethe cell-specific processes are stochastically independent. We link the single-celllatent processes to population-level observables by aggregating over individualcells. At any given time t each individual cell in the population is in one of the nstates, with the probability of being in state i given by the solution pi(t) to themaster equation. For a large number of cells, the fraction of cells in each state i attime t is therefore given by pi(t). Population average expression of gene j at time tcan now be written in terms of expression per state weighted by the fraction ofcells in each state at the given time; this yields the expression shown in theIntroduction and reproduced below
xj tð Þ~b1jp1 t; wð Þzb2jp2 t; wð Þz � � �zbnjpn t; wð Þ: ð2Þ
where the dependence of pi(t) on transition rates w is made explicit. The aboveexpression links the parameters of the latent processes at the single-cell level topopulation-level observables xj(t). Making the noise model explicit we arrive at
log xj tð Þ� �
~logX
i
bijpi t; wð Þ !
z jt , jt*N 0,s2j
� �ð3Þ
where N denotes a Normal density and s2j denotes gene-specific variance. This
latter expression gives the likelihood. We estimated the parameters bij and wi,i11
using a ‘1-penalized estimator related to the maximum a posteriori estimator forthe Bayesian formulation below (see SI for details).
For complex models with many parameters, it is important to check stability ofestimation to guard against artifactual results. To check stability of the penalizedestimator, we re-estimated parameters following perturbation of the data and com-pared with estimates obtained from the original data. We perturbed the data in twoways: a) adding Gaussian noise and b) removing an entire time point (seeSupplementary Fig. S5 and below). We found that results reported were robust tosuch perturbations, suggesting that overall estimator variance is well controlled. Wealso carried out a re-analysis under permutation of the temporal order of the data(Supplementary Fig. S6). We found that both model fit and distinctness of statesignatures were systematically worse under such temporal permutation, suggestingthat our simple model of transition dynamics captures real temporal structure in thedata.
STAMM software, implementing the above model and associated estimators andgene ranking tools (see below) is provided as part of the Supplementary Informationand at mukherjeelab.nki.nl/CODE/STAMM.zip.
Model selection. We used a Bayesian model selection procedure to complement themodel selection heuristics reported in the Main Text. A full description of theBayesian formulation, including details of the Markov chain Monte Carlo (MCMC)appear in SI. Let Mn denote the model with n states and y 5 {yj} denote observed datafor all genes. Taking a flat prior over models P(Mn) / 1, the posterior probability overmodels is P(Mnjy) / p(yjMn). The marginal likelihood, p(yjMn), is obtained byintegrating out all model parameters (b’s, w’s and s’s) from the likelihoodcorresponding to the noise model in Eq. (3) above. This gives a score for each modelthat takes account of both fit-to-data and model complexity that is then normalized togive the posterior probability over number of states. We further investigated modelselection by applying it to the data with time points permuted (Supplementary Fig.S6); while application to the original data showed clear evidence of intermediatestates, this is completely lost under temporal permutation, suggesting that theevidence for intermediate states is rooted in real temporal structure in the data.
Gene ranking. STAMM ranks genes by using estimated state-specific signatures b.
For each state i and gene j we call the score sij~nbij
.Xn
k~1bkj the ‘‘state-specific
score’’, since it indicates state-specific expression relative to all states for that gene(up-regulated genes in a given state are the top scoring genes while down-regulatedgenes are the lowest scoring). Gene lists for Fig. 4 were then obtained as follows. Forprofiles with expression switched on in one state only (S2 pulse, S3 pulse and S4 switch)genes were ranked under the respective state-specific scores sij. For the S2 and S3
switch profiles, in which genes are switched on in multiple states, rankings werecarried out with respect to fold change in state-specific expression b before and after aswitch: this was done using the minimum fold change between b’s for any state afterthe switch with respect to any state before the switch.
Gene ontology (GO) analysis. State-specific gene lists were obtained from STAMMrankings as described above. To form a list of genes up-regulated in state i, we retainedthose genes j with pulse score sij $ 2, and to form a list of genes down-regulated weretained those genes j having sij # 0.5. GO analysis was performed using theCytoscape plugin BINGO43. In Supplementary Fig. S4, for clarity, only the significantGO terms with number of descendants between 200 and 800 are shown.
1. Evans, M. J. & Kaufman, M. H. Establishment in culture of pluripotential cellsfrom mouse embryos. Nature 292, 154–156 (1981).
2. Tang, F. et al. Tracing the derivation of embryonic stem cells from the inner cellmass by single-cell RNA-seq analysis. Cell Stem Cell 6, 468–478 (2010).
3. Vierbuchen, T. et al. Direct conversion of fibroblasts to functional neurons bydefined factors. Nature 463, 1035–1041 (2010).
4. Pang, Z. P. et al. Induction of human neuronal cells by defined transcriptionfactors. Nature 476, 220–223 (2011).
5. Caiazzo, M. et al. Direct generation of functional dopaminergic neurons frommouse and human fibroblasts. Nature 476, 224–227 (2011).
6. Ieda, M. et al. Direct reprogramming of fibroblasts into functional cardiomyocytesby defined factors. Cell 142, 375–386 (2010).
7. Efe, J. A. et al. Conversion of mouse fibroblasts into cardiomyocytes using a directreprogramming strategy. Nat. Cell Biol. 13, 215–222 (2011).
8. Huang, P. et al. Induction of functional hepatocyte-like cells from mousefibroblasts by defined factors. Nature 475, 386–389 (2011).
9. Sekiya, S. & Suzuki, A. Direct conversion of mouse fibroblasts to hepatocyte-likecells by defined factors. Nature 475, 390–393 (2011).
10. Takahashi, K. & Yamanaka, S. Induction of pluripotent stem cells from mouseembryonic and adult fibroblast cultures by defined factors. Cell 126, 663–676(2006).
www.nature.com/scientificreports
SCIENTIFIC REPORTS | 4 : 3692 | DOI: 10.1038/srep03692 8
11. Hanna, J. H., Saha, K. & Jaenisch, R. Pluripotency and cellular reprogramming:Facts, hypotheses, unresolved issues. Cell 143, 508–525 (2010).
12. Okita, K. & Yamanaka, S. Induced pluripotent stem cells: opportunities andchallenges. Philos. Trans. R. Soc. Lond. B Biol. Sci. 366, 2198–2207 (2011).
13. Wilmut, I., Sullivan, G. & Chambers, I. The evolving biology of cellreprogramming. Philos. Trans. R. Soc. Lond. B Biol. Sci. 366, 2183–2197 (2011).
14. Vogel, G. Diseases in a dish take off. Science 330, 1172–1173 (2010).15. Wernig, M. et al. In vitro reprogramming of fibroblasts into a pluripotent ES-cell-
like state. Nature 448, 318–324 (2007).16. Jaenisch, R. & Young, R. Stem cells, the molecular circuitry of pluripotency and
nuclear reprogramming. Cell 132, 567–582 (2008).17. Hanna, J. et al. Direct cell reprogramming is a stochastic process amenable to
acceleration. Nature 462, 595–601 (2009).18. Samavarchi-Tehrani, P. et al. Functional genomics reveals a BMP-driven
mesenchymal-to-epithelial transition in the initiation of somatic cellreprogramming. Cell Stem Cell 7, 64–77 (2010).
19. Buganim, Y. et al. Single-cell expression analyses during cellular reprogrammingreveal an early stochastic and a late hierarchic phase. Cell 150, 1209–1222 (2012).
20. Polo, J. et al. A molecular roadmap of reprogramming somatic cells into iPS cells.Cell 151, 1617–32 (2012).
21. Hansson, J. et al. Highly coordinated proteome dynamics during reprogrammingof somatic cells to pluripotency. Cell Report 2, 1579–92 (2012).
22. O’Malley, J. et al. High-resolution analysis with novel cell-surface markersidentifies routes to iPS cells. Nature 499, 88–91 (2013).
23. Tai, Y. & Speed, T. A multivariate empirical Bayes statistic for replicatedmicroarray time course data. Ann. Stat. 34, 2387–2412 (2006).
24. Kalaitzis, A. & Lawrence, N. A simple approach to ranking differentially expressedgene expression time courses through gaussian process regression. BMC Bioinf.12, 180 (2011).
25. Heard, N., Holmes, C., Stephens, D., Hand, D. & Dimopoulos, G. Bayesiancoclustering of Anopheles gene expression time series: study of immune defenseresponse to multiple experimental challenges. Proc. Natl. Acad. Sc. USA 102,16939–16944 (2005).
26. Roy, S., Lane, T., Allen, C., Aragon, A. & Werner-Washburne, M. A hidden-stateMarkov model for cell population deconvolution. J. Comp. Bio. 13, 1749–74(2006).
27. Bar-Joseph, Z., Farkash, S., Gifford, D., Simon, I. & Rosenfeld, R. Deconvolvingcell cycle expression data with complementary information. Bioinformatics 20,i23–i30 (2004).
28. Bar-Joseph, Z. et al. Genome-wide transcriptional analysis of the human cell cycleidentifies genes differentially regulated in normal and cancer cells. Proc. Natl.Acad. Sci. USA 105, 955–60 (2009).
29. Siegal-Gaskins, D., Ash, J. & Crosson, S. Model-based deconvolution of cell cycletime-series data reveals gene expression details at high resolution. PLoS Comput.Biol. 5, e1000460 (2009).
30. Orlando, D. et al. A probabilistic model for cell cycle distributions in synchronyexperiments. Cell Cycle 6, 478–488 (2007).
31. Rowicka, M., Kudlicki, A., Tu, B. P. & Otwinowski, Z. High-resolution timing ofcell cycle-regulated gene expression. Proc. Natl. Acad. Sci. USA 104, 16892–16897(2007).
32. Costa, I., Roepcke, S., Hafemeister, C. & Schliep, A. Inferring differentiationpathways from gene expression. Bioinformatics 24, i156–64 (2008).
33. Mansour, A. et al. The H3K27 demethylase Utx regulates somatic and germ cellepigenetic reprogramming. Nature 488, 409–413 (2012).
34. Ang, Y. et al. Wdr5 mediates self-renewal and reprogramming via the embryonicstem cell core transcriptional network. Cell 145, 183–197 (2011).
35. Qu, J. & Bishop, J. M. Nucleostemin maintains self-renewal of embryonic stemcells and promotes reprogramming of somatic cells to pluripotency. J. Cell Biol.197, 731–745 (2012).
36. Subramanyam, D. et al. Multiple targets of miR-302 and miR-372 promotereprogramming of human fibroblasts to induced pluripotent stem cells. Nat.Biotechnol. 29, 443–448 (2011).
37. Cole, M., Johnstone, S., Newman, J., Kagey, M. & Young, R. Tcf3 is an integralcomponent of the core regulatory circuitry of embryonic stem cells. Genes Dev. 22,746–755 (2008).
38. Lluis, F. et al. T-cell factor 3 (Tcf3) deletion increases somatic cell reprogrammingby inducing epigenome modifications. Proc. Natl. Acad. Sc. USA 108, 11912–917(2011).
39. Marson, A. et al. Wnt signaling promotes reprogramming of somatic cells topluripotency. Cell Stem Cell 3, 132–135 (2008).
40. Mikkelsen, T. S. et al. Dissecting direct reprogramming through integrativegenomic analysis. Nature 454, 49–55 (2008).
41. Koche, R. P. et al. Reprogramming factor expression initiates widespread targetedchromatin remodeling. Cell Stem Cell 8, 96–105 (2011).
42. Deal, R. B., Henikoff, J. G. & Henikoff, S. Genome-wide kinetics of nucleosometurnover determined by metabolic labeling of histones. Science 328, 1161–1164(2010).
43. Maere, S., Heymans, K. & Kuiper, M. BiNGO: a Cytoscape plugin to assessoverrepresentation of Gene Ontology categories in biological networks.Bioinformatics 21, 3448–3449 (2005).
AcknowledgmentsThis work was supported by UK EPSRC EP/E501311/1 and the Cancer Systems BiologyCenter grant from the Netherlands Organisation for Scientific Research.
Author contributionsJ.W.A., A.A.R. and C.J.O. did computational analyses; they and K.S. performed research;J.W.A., K.S., C.J.O., R.J., M.N. and S.M. wrote the manuscript; M.N. and S.M. conceived andled the project.
Additional informationSupplementary information accompanies this paper at http://www.nature.com/scientificreports
Competing financial interests: The authors declare no competing financial interests.
How to cite this article: Armond, J.W. et al. A stochastic model dissects cell states inbiological transition processes. Sci. Rep. 4, 3692; DOI:10.1038/srep03692 (2014).
This work is licensed under a Creative Commons Attribution-NonCommercial-ShareAlike 3.0 Unported license. To view a copy of this license,
visit http://creativecommons.org/licenses/by-nc-sa/3.0
www.nature.com/scientificreports
SCIENTIFIC REPORTS | 4 : 3692 | DOI: 10.1038/srep03692 9