original article different biological pathways are up
TRANSCRIPT

104https://e-aair.org
ABSTRACTBackground: Elderly asthma (EA) is increasing, but the pathogenesis is unclear. This study aimed to identify EA-related biological pathways by analyzing genome-wide gene expression profiles in sputum cells.Methods: A total of 3,156 gene probes with significantly differential expressions between EA and healthy elderly controls were used for a hierarchical clustering of genes to identify gene clusters. Gene set enrichment analysis provided biological information, with replication from Gene Expression Omnibus expression profiles.Results: Fifty-five EA patients and 10 elderly control subjects were enrolled. Two distinct gene clusters were found. Cluster 1 (n = 35) showed a lower eosinophil proportion in sputum and less severe airway obstruction compared to cluster 2 (n = 20). The replication data set also identified 2 gene clusters (clusters 1' and 2'). Among 5 gene sets significantly enriched in cluster 1 and 3 gene sets significantly enriched in cluster 2, we confirmed that 2 were significantly enriched in the replication data set (OXIDATIVE_PHOSPHORYLATION gene set in cluster 1 and EPITHELIAL MESENCHYMAL TRANSITION gene set in cluster 2').Conclusions: The findings of 2 distinct gene clusters in EA and different biological pathways in each gene cluster suggest 2 different pathogenesis mechanisms underlying EA.
Keywords: Asthma; Cluster analysis; Elderly; Gene expression
INTRODUCTION
Global society is aging.1 Accordingly, elderly asthma (EA) involving asthma in people aged 65 years and over is expected to increase. The estimated prevalence of EA in developed countries is 6%-10%.2 Previous reports suggest that EA is phenotypically different from non-elderly asthma (NEA).3-5 However, the pathogenesis underlying EA has not been clearly elucidated.
Induced sputum is a reliable non-invasive assessment of bronchial inflammation in asthma.6 The evaluation of gene expression profiles of sputum cells has been successfully applied to understand asthma pathogenesis.7,8 The present study searched biological pathways related to EA using genome-wide gene expression profiles of sputum cells from EA. We selected genes showing
Allergy Asthma Immunol Res. 2019 Jan;11(1):104-115https://doi.org/10.4168/aair.2019.11.1.104pISSN 2092-7355·eISSN 2092-7363
Original Article
Received: Aug 27, 2018Revised: Sep 11, 2018Accepted: Sep 14, 2018
Correspondence toHeung-Woo Park, MD, PhDDepartment of Internal Medicine, Seoul National University College of Medicine, Seoul, Republic of Korea. Tel: +82-2-2072-0699 Fax: +82-2-742-3291E-mail: [email protected]
Copyright © 2019 The Korean Academy of Asthma, Allergy and Clinical Immunology • The Korean Academy of Pediatric Allergy and Respiratory DiseaseThis is an Open Access article distributed under the terms of the Creative Commons Attribution Non-Commercial License (https://creativecommons.org/licenses/by-nc/4.0/) which permits unrestricted non-commercial use, distribution, and reproduction in any medium, provided the original work is properly cited.
ORCID iDsByung-Keun Kim https://orcid.org/0000-0001-5147-6306Hyun-Seung Lee https://orcid.org/0000-0002-4599-8527Kyoung-Hee Sohn https://orcid.org/0000-0001-8407-8080Sang-Heon Cho https://orcid.org/0000-0002-7644-6469Heung-Woo Park https://orcid.org/0000-0002-6970-3228
Byung-Keun Kim ,1 Hyun-Seung Lee ,2,3 Kyoung-Hee Sohn ,4 Suh-young Lee,2,3 Sang-Heon Cho ,2,3 Heung-Woo Park 2,3*
1Department of Internal Medicine, Korea University Medical Center Anam Hospital, Seoul, Korea2Department of Internal Medicine, Seoul National University College of Medicine, Seoul, Korea3 Institute of Allergy and Clinical Immunology, Seoul National University Medical Research Center, Seoul, Korea4Department of Internal Medicine, KyungHee University Medical center, Seoul, Korea
Different Biological Pathways Are Up-regulated in the Elderly With Asthma: Sputum Transcriptomic Analysis

significantly differential expressions between EA and healthy elderly controls and identified 2 distinct clusters by hierarchical clustering of these genes. We performed gene set enrichment analysis (GSEA) to gain further biological insights of each cluster. Finally, we confirmed that our findings were replicated in a dependent gene expression profile of sputum cells obtained from Gene Expression Omnibus (GEO), a publicly available database of gene expression profiles. To the best of our knowledge, this is the first study to identify peculiar biological pathways contributing to the EA pathogenesis based on sputum gene expression profiles.
MATERIALS AND METHODS
Discovery data setParticipants aged 65 years or older were recruited from the Seoul National University Hospital (Seoul, Korea). Asthma was diagnosed according to the Global Initiative for Asthma guideline on the basis of current (past 12 months) episodic respiratory symptoms and demonstrated evidence of airway hyperresponsiveness to methacholine or positive bronchodilator (BD) response.9 Healthy elderly controls without asthma (n = 10) were recruited by advertisement. None of them had respiratory symptoms, sputum eosinophilia, abnormality on chest radiography and obstructive pulmonary function test results. Three of them were smokers (1 current smoker and 2 ex-smokers). Exclusion criteria included recent (past month) respiratory tract infection, change in maintenance therapy and asthma exacerbation. However, to reflect real situations, a smoking status was not considered an exclusion criteria. Sputum induction and processing were performed as previously described.10
Gene expression arraysRNA was extracted from induced sputum samples by using the RNeasy Mini Kit (Qiagen, Hilden, Germany). Gene expression levels were measured using the GeneChip Human Gene 2.0 ST (Affymetrix, Santa Clara, CA, USA). We removed probes with bad chromosome annotation and probes in X or Y chromosome. We then did variance stabilizing transformation and quantile normalization, respectively, to reduce the effects of technical noises and to make the distribution of expression level for each array closer to a normal distribution.
Statistical analysisA total of 3,156 gene probes showing significantly different expressions between EA and healthy elderly controls (P < 0.05) were used to further analysis. To search for meaningful information patterns and dependencies in gene expression data, we performed hierarchical clustering using the pvclust package in R version 3.4.3 (www.r-project.org; R Foundation for Statistical Computing, Vienna, Austria). This package provides an approximately unbiased P value generated by multi-scale bootstrap resampling. The P value indicates how strong the cluster is supported by the data.11 An approximately unbiased P value greater than 95% was used to define a cluster. We next performed GSEA using the GSEA software (version 3.0) provided by the Broad Institute (Boston, MA, USA).12 We used the hallmark gene sets (H collection) from the Molecular Signatures Database (MSigDB, version 6.0) and defined a significantly enriched gene set when a false discovery rate threshold was less than 0.05.
Ethics approvalThis study was approved by the Seoul National University Hospital Review Board (1608-101-786), and informed consent was obtained from all study participants.
105https://e-aair.org https://doi.org/10.4168/aair.2019.11.1.104
Sputum Transcriptomic Analysis in Eldery Asthma
DisclosureThere are no financial or other issues that might lead to conflict of interest.

Replication data setA dependent gene expression profile of sputum cells (GSE41863) obtained from GEO (https://www.ncbi.nlm.nih.gov/geo/query/acc.cgi?acc=GSE41863) was used to replicate our results. To identify markers associated with various asthma subtypes, sputum samples were collected from asthmatics and healthy controls and were subjected to expression profiling using Affymetrix HG-U133Plus2.0. From this profile, we selected 20 subjects aged 65 years or older (15 asthmatics and 5 healthy controls) and identified 3,264 gene probes showing significantly (P < 0.05) different expressions. Hierarchical clustering and GSEA were performed using these gene probes.
RESULTS
Fifty-five patients with EA were enrolled. Based on the differential gene expression patterns of sputum cells, 2 distinct clusters were identified (Fig. 1A and Supplementary Fig. S1). Cluster 1 consisted of 35 patients with EA. Cluster 1 featured a significantly lower proportion of eosinophils in the sputum and less severe airway obstruction as measured by the post-BD ratio of the forced expiratory volume in 1 second and forced vital capacity (FEV1/FVC) compared to cluster 2. Detailed characteristics of the 2 clusters are provided in Table 1.
GSEA results (Table 2A and Fig. 2) revealed the significant enrichment of 5 gene sets in cluster 1 (OXIDATIVE_PHOSPHORYLATION [OXPHOS], UNFOLDED_PROTEIN_RESPONSE [UPR], MYC_TARGETS_V1, DNA_REPAIR, and ADIPOGENESIS) and 3 gene sets in cluster 2 (EPITHELIAL_MESENCHYMAL_TRANSITION [EMT], MYOGENESIS, and KRAS_SIGNALING_DN). In the replication analysis, hierarchical clustering of gene expression patterns also revealed 2 clusters (cluster 1' with 8 EA patients and cluster 2' with 7 EA patients, Fig. 1B). Clinical characteristics of each cluster are shown in Supplementary Table S1. GSEA identified 8 gene sets (OXPHOS, ESTROGEN_RESPONSE_EARLY, E2F_TARGETS, MYC_TARGETS_V1, FATTY_ACID_METABOLISM, MYC_TARGETS_V2, ESTROGEN_RESPONSE_LATE, and DNA_REPAIR) were significantly enriched in cluster 1' and 3 gene sets (TNFA_SIGNALING_VIA_NFKB, INFLAMMATORY_RESPONSE, and EMT) in cluster 2' (Table 2B and Supplementary Fig. S2). The OXPHOS gene set was significantly enriched in clusters 1 and 1' and the EMT gene set in both clusters 2 and 2'. To assess the potential functional relevance of the replicated gene sets, the leading edge genes of gene sets enriched in both discovery and replication datasets (Supplementary Table S2) were summarized into a single metagene metric using a principal component (PC) analysis. Then, the correlations between PC1, and serum uric acid levels and post-BD FEV1/FVC values were measured in each cluster. Circulating uric acid is a major antioxidant that might help protect against oxidative stress.13 The post-BD FEV1/FVC value is an indirect indicator of airway remodeling.14 Levels of serum uric acid were lower in cluster 1 with a borderline significance (P = 0.083) compared to cluster 2, whereas post-BD FEV1/FVC values were significantly higher in cluster 1 (P = 0.008) (Supplementary Fig. S3). PC1 of leading edge genes in the OXPHOS gene set showed a negative correlation with serum uric acid levels (P = 0.075) only in cluster 1 (Fig. 3). Meanwhile, PC1 of leading edge genes in the EMT gene set showed a significantly negative correlation with post-BD FEV1/FVC values (P = 0.005) only in cluster 2 (Fig. 3). For individual gene, we found 4 genes (MRPS11, HSPA9, NDUFB4, and ACAT1) in the leading edge genes of the OXPHOS gene set and 2 genes (SNTB1 and FUCA1) in leading edge genes of the EMT gene set belonged to genes which showed more than 1.5 log 2-fold expression difference between clusters 1 and 2 with P values less than 0.01 (Fig. 4).
106https://e-aair.org https://doi.org/10.4168/aair.2019.11.e14
Sputum Transcriptomic Analysis in Eldery Asthma

DISCUSSION
Using gene expression profiles on sputum cells, we could identify 2 molecular clusters. Cluster 1 showed a significantly lower proportion of eosinophils in sputum and less severe airway obstruction compared to cluster 2. GSEA revealed that different biologic pathways were enriched in each cluster, implying that peculiar and discriminative pathogenesis mechanisms might exist. In replication analysis, we also identified 2 distinct molecular clusters. In addition, similar to the discovery dataset, the OXPHOS gene set was significantly enriched in one cluster and the EMT gene set was significantly enriched in the other cluster.
Approximately 70% of EA enrolled in the present study displayed symptom onset after 65 years old and the mean symptom duration was 5 years. These findings suggest that EA is not merely a prolongation of NEA but rather that aging itself may pose susceptibility to
107https://e-aair.org https://doi.org/10.4168/aair.2019.11.e14
Sputum Transcriptomic Analysis in Eldery Asthma
Pt4
Pt
47
Pt6
Pt
17
Pt16
Pt
51 Pt
33
Pt40
Pt
44
Pt41
Pt
43
Pt49
Pt
50
Pt56
Pt
58
Pt29
Pt
30
Pt22
Pt
25
Pt24
Pt
23 Pt
31
Pt48
Pt35
Pt
53
Pt54
Pt42
Pt55
Pt46
Pt7
Pt39
Pt1
Pt32
Pt8
Pt
14 Pt
10
Pt11
Pt
52
Pt3
Pt
12 Pt19
Pt36
Pt
37
Pt9
Pt
15
Pt2
Pt
26
Pt13
Pt
20
Pt18
Pt
34
Pt27
Pt
5
Pt21
Pt57
Pt38
Pt45
Pt28
Hei
ght
0.08
0.07
0.06
0.05
0.04
0.03
0.02
0.01
Cluster 1 Cluster 2
Pt9
Pt14
Pt8
Pt10
Pt7
Pt13
Pt15
Pt5
Pt2
Pt11
Pt1 Pt
4
Pt3
Pt6
Pt12
Hei
ght
0.045
0.040
0.035
0.030
0.025
0.020
0.015
0.010
Cluster 1′ Cluster 2′
A
B
Fig. 1. Two gene clusters identified in the discovery and replication dataset. (A) Discovery dataset. Three outliers (Pt5, Pt21, and Pt28) were excluded from analysis. (B) Replication dataset. Pt, Patient.

the development of asthma, as discussed elsewhere.15 In addition to anatomical changes, repetitive and long-standing exposures to environmental noxious stimuli cause the pro-inflammatory state in elderly subjects which results in aging-associated diseases in
108https://e-aair.org https://doi.org/10.4168/aair.2019.11.e14
Sputum Transcriptomic Analysis in Eldery Asthma
Table 1. Baseline characteristics (discovery dataset)Characteristics Cluster 1 (n = 35) Cluster 2 (n = 20) P valueMale, No. (%) 16 (45.7) 9 (45) 0.959Age (yr) 72.6 (5.4) 75.1 (5.4) 0.103BMI (kg/m2) 24.9 (3.7) 26.4 (4.1) 0.205Smoking status 0.841
Current smoker, No. (%) 4 (11.4) 2 (10)Ex-smoker, No. (%) 12 (34.3) 8 (40)Never-smoker, No. (%) 19 (54.3) 10 (50)
Age of symptom onset (yr) 67.6 (6.8) 69.1 (6.9) 0.430Age of symptom onset < 65 yr, No. (%) 11 (31.4) 6 (30) 0.912Symptom duration (yr) 4.9 (6.0) 5.9 (4.7) 0.524Chronic rhinosinusitis, No. (%) 18 (51.7) 8 (40) 0.514Atopy, No. (%) 4 (44.4) 2 (22.2%) 0.620Sputum eosinophil (%) 2.8 (4.3) 5.9 (8.2) 0.033Sputum neutrophil (%) 35.9 (14.3) 37.9 (14.8) 0.580Serum uric acid (mg/L) 5.2 (1.2) 6.1 (2.3) 0.083Peripheral eosinophil count 209.6 (192.3) 197.2 (193.7) 0.819Serum total IgE 91.0 (143.1) 130.0 (226.7) 0.616Post-BD FVC (L) 2.75 (0.80) 2.74 (0.93) 0.974Post-BD FVC (% pred.) 96.4 (16.0) 104.8 (15.8) 0.068Post-BD FEV1 (L) 1.80 (0.44) 1.51 (0.37) 0.011Post-BD FEV1 (% pred.) 91.0 (18.7) 82.0 (15.9) 0.065Post-BD FEV1/FVC (%) 66.3 (11.8) 56.3 (13.0) 0.007Data were presented as mean ± standard deviation except those indicated otherwise.BD, bronchodilator; BMI, body mass index; FEV1, forced expiratory volume in 1 second; FVC, forced vital capacity.
Table 2. Gene sets enriched significantly in each clusterGene set name No. of overlapped genes Normalized enrichment score FDR P valueDiscovery dataset
Cluster 1OXPHOS 28 2.99 <0.001UPR 16 2.55 <0.001MYC_TARGETS_V1 22 1.83 0.027DNA_REPAIR 15 1.81 0.025ADIPOGENESIS 31 1.80 0.021
Cluster 2EMT 31 −3.29 <0.001MYOGENESIS 27 −2.67 <0.001KRAS_SIGNALING_DN 29 −1.81 0.24
Replication datasetCluster 1'
OXPHOS 85 1.96 0.005ESTROGEN_RESPONSE_EARLY 24 1.89 0.005E2F_TARGETS 37 1.75 0.019MYC_TARGETS_V1 67 1.65 0.048FATTY_ACID_METABOLISM 38 1.64 0.041MYC_TARGETS_V2 28 1.64 0.034ESTROGEN_RESPONSE_LATE 26 1.64 0.031DNA_REPAIR 39 1.61 0.038
Cluster 2'TNFA_SIGNALING_VIA_NFKB 27 −2.59 <0.001INFLAMMATORY_RESPONSE 36 −2.05 0.002EMT 28 −1.74 0.019
Data are shown as number (%).FDR, false discovery rate; OXPHOS, OXIDATIVE_PHOSPHORYLATION; UPR, UNFOLDED_PROTEIN_RESPONSE; EMT, EPITHELIAL_MESENCHYMAL_TRANSITION.

combination with oxidative stress.16,17 The OXPHOS system embedded in mitochondria is the final biochemical pathway to produce adenosine triphosphate. A defect in the coupling between oxidation and phosphorylation causes various pathologic conditions including airway disorders.18-20 At least 70 of the OXPHOS subunits are encoded by the nuclear genes whose expressions were measured in the present study and some defects of these genes were related with many diseases.21 The OXPHOS system is an important source of reactive oxygen species (ROS) within cells. ROS production contributes to mitochondrial damage in a range of pathologies and is also important in redox from the organelle to the rest of the cell.22,23 Oxidative stress has also been linked to endoplasmic reticulum (ER) stress and to the activation of the UPR, leading to the activation of different inflammatory responses and dysregulation of the innate immune functions in the airways.24,25 These prior observations
109https://e-aair.org https://doi.org/10.4168/aair.2019.11.e14
Sputum Transcriptomic Analysis in Eldery Asthma
Rank in ordered dataset
−0.25
0
0.25
0.8
Rank
ed li
st m
etric
(Sig
nal2
Noi
se)
Enric
hmen
t sco
re
OXPHOS
Cluster 1 (positively correlated)
Cluster 2 (negatively correlated)
Zero cross at 1813
P < 0.001
0
0.70.60.50.40.30.20.10
−0.50
1,000 1,500500 2,000 2,500 3,000
ARank in ordered dataset
−0.25
0
0.25
0.8
Rank
ed li
st m
etric
(Sig
nal2
Noi
se)
Enric
hmen
t sco
re
UPR
Cluster 1 (positively correlated)
Cluster 2 (negatively correlated)
Zero cross at 1813
P < 0.001
0
0.70.60.50.40.30.20.10
−0.50
1,000 1,500500 2,000 2,500 3,000
EMT MYOGENESIS
BRank in ordered dataset
−0.25
0
0.25
0
Rank
ed li
st m
etric
(Sig
nal2
Noi
se)
Enric
hmen
t sco
re
Cluster 1 (positively correlated)
Cluster 2 (negatively correlated)
Zero cross at 1813
P < 0.001
0
−0.1−0.2−0.3−0.4−0.5−0.6−0.7−0.8
−0.50
1,000 1,500500 2,000 2,500 3,000Rank in ordered dataset
−0.25
0
0.25
Rank
ed li
st m
etric
(Sig
nal2
Noi
se)
Enric
hmen
t sco
re
Cluster 1 (positively correlated)
Cluster 2 (negatively correlated)
Zero cross at 1813
P < 0.001
0
−0.1−0.2−0.3−0.4−0.5−0.6
−0.50
1,000 1,500500 2,000 2,500 3,000
Enrichment profileHitsRanking metric scores
Enrichment profileHitsRanking metric scores
Enrichment profileHitsRanking metric scores
Enrichment profileHitsRanking metric scores
Fig. 2. Gene sets enriched in each cluster identified in the discovery dataset with FDR P values less than 0.001. (A) Cluster 1, (B) Cluster 2. FDR, false discovery rate; OXPHOS, OXIDATIVE_PHOSPHORYLATION; UPR, UNFOLDED_PROTEIN_RESPONSE, EMT, EPITHELIAL_MESENCHYMAL_TRANSITION.
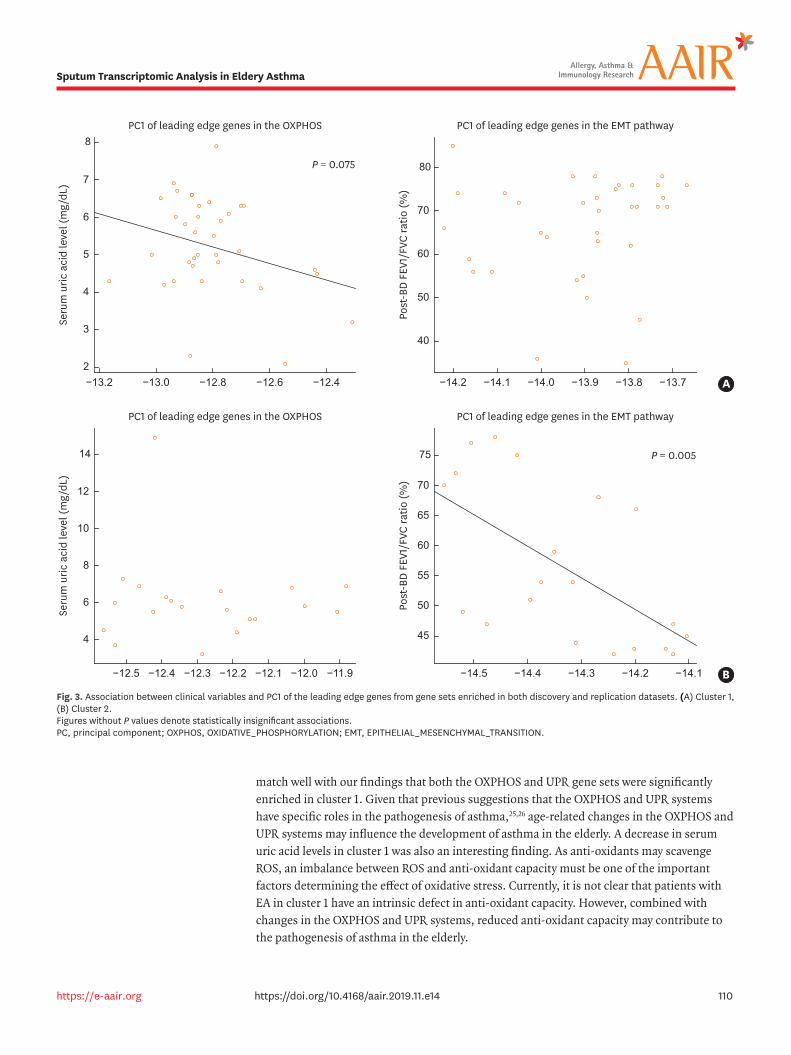
match well with our findings that both the OXPHOS and UPR gene sets were significantly enriched in cluster 1. Given that previous suggestions that the OXPHOS and UPR systems have specific roles in the pathogenesis of asthma,25,26 age-related changes in the OXPHOS and UPR systems may influence the development of asthma in the elderly. A decrease in serum uric acid levels in cluster 1 was also an interesting finding. As anti-oxidants may scavenge ROS, an imbalance between ROS and anti-oxidant capacity must be one of the important factors determining the effect of oxidative stress. Currently, it is not clear that patients with EA in cluster 1 have an intrinsic defect in anti-oxidant capacity. However, combined with changes in the OXPHOS and UPR systems, reduced anti-oxidant capacity may contribute to the pathogenesis of asthma in the elderly.
110https://e-aair.org https://doi.org/10.4168/aair.2019.11.e14
Sputum Transcriptomic Analysis in Eldery Asthma
4
−12.5
8
14
Seru
m u
ric a
cid
leve
l (m
g/dL
)
PC1 of leading edge genes in the OXPHOS PC1 of leading edge genes in the EMT pathway
P = 0.005
6
12
10
−12.4 −12.3 −12.2 −12.1 −12.0 −11.9
45
−14.5
60
75
Post
-BD
FEV1
/FVC
ratio
(%)
55
70
65
50
−14.4 −14.3 −14.2 −14.1 B
3
−13.2
5
8
Seru
m u
ric a
cid
leve
l (m
g/dL
)
PC1 of leading edge genes in the OXPHOS PC1 of leading edge genes in the EMT pathway
P = 0.075
4
7
6
2−13.0 −12.8 −12.6 −12.4
40
−14.2
60
80
Post
-BD
FEV1
/FVC
ratio
(%)
70
50
−14.1 −14.0 −13.9 −13.8 −13.7 A
Fig. 3. Association between clinical variables and PC1 of the leading edge genes from gene sets enriched in both discovery and replication datasets. (A) Cluster 1, (B) Cluster 2. Figures without P values denote statistically insignificant associations. PC, principal component; OXPHOS, OXIDATIVE_PHOSPHORYLATION; EMT, EPITHELIAL_MESENCHYMAL_TRANSITION.

Cluster 2 as characterized by the enrichment of EMT gene sets. EMT describes a situation that epithelial and mesenchymal cells can, under certain conditions, switch their phenotypes27 and emerging evidence suggests that EMT is an important mechanism contributing to airway remodeling in asthma,28 which can explain lower post-BD FEV1 and post-BD FEV1/FVC ratios in cluster 2 compared to those in cluster 1. Senescent cells secrete a variety of proteins collectively known as the senescence-associated secretory phenotype (SASP), which can induce cellular plasticity and tissue change in a paracrine manner.29 Recently, it has been reported that SASP might play a causal role in the pathogenesis of chronic obstructive pulmonary disease.30,31 The role of SASP in the pathogenesis of asthma in the elderly has been totally unknown. However, cellular senescence is believed to contribute to cancer progression via EMT.32,33 Cellular senescence observed in the airway may induce EMT and increase the severity of asthma in the elderly.
Interestingly, we did not find any specific pathway directly related with eosinophil biology, although a significantly higher sputum eosinophil proportion was observed in cluster 2. However, given that a previous report showed that eosinophil promoted EMT of bronchial epithelial cells,34 airway eosinophilia might be complicated in the pathogenesis underlying cluster 2.
We aimed to identify biological pathways explaining a whole feature of EA, and thus we did not consider asthma-COPD overlap (ACO) as a subtype of EA in this study. If we define ACO as 1) post-BD FEV1/FVC < 0.7 and 2) classic symptoms of chronic bronchitis or suggesting signs of emphysema with chest radiography or pulmonary function test,35 the proportion of ACO is higher in cluster 2 (28.6% vs 55.5%). Although the difference showed a borderline significance (P = 0.083), the present study raised new insight in understanding ACO in the elderly. As is known, ACO is a common clinical problem in the elderly.36 Therefore, large scale studies to exam possible associations between biological pathways enriched in cluster 2 and ACO are necessary.
111https://e-aair.org https://doi.org/10.4168/aair.2019.11.e14
Sputum Transcriptomic Analysis in Eldery Asthma
Log2Fold
0
4
−3 −2 −1 0 1 2
8
14
−Log
10(P
val
ue)
6
12
10
2
MRPS11HSPA9NUDF4
ACTA1
SNTB1FUCA1
Fig. 4. Volcano plot displaying differential expressed genes. The 4 genes (MRPS11, HSPA9, NUDF4, and ACTA1) belong to the leading edge genes of the OXPHOS gene set and 2 genes (SNTB1 and FUCA1) belong to the leading edge genes of the EMT gene set. OXPHOS, OXIDATIVE_PHOSPHORYLATION; EMT, EPITHELIAL_MESENCHYMAL_TRANSITION.

There are a few limitations to generalize our findings. One is the small number of participants. However, our results were replicated in an independent data set. This was a cross-sectional study, and thus we cannot know whether that the pathways identified were the primary cause or the secondary effect of asthma. Secondly, we used the uric acid level as an indirect biomarker to reflect oxidative stress status as it was easily available from routine laboratory examinations. Additional biomarkers need to be measure to confirm our observations. Finally, studies to elucidate mechanisms need to be followed.
Among leading genes identified in this study, NUDFB4 and FUCA1 are of special interest. NUDFB4 is a subunit of NADH dehydrogenase and its expression increases in smoking associated severe asthmatics.37,38 Similar to the present study, it has been reported that a considerable portion of elderly asthmatics were former or current smokers.4,5 FUCA1 codes α-L-fucosidase that can block wound repair of primary airway epithelium.39 As well known, a delay in airway epithelial damage is associated with airway remodeling.40
In this study, we identified 2 distinct molecular clusters using gene expression profiles in sputum cells from patients with EA. The OXOPHOS and UPR gene sets were significantly enriched in one cluster with lower serum levels of uric acid. The EMT gene sets were significantly enriched in one cluster with airway remodeling defined by lower post-BD FEV/FVC ratios. This is the first study to show biologic pathways possibly related to EA pathogenesis. We postulate that oxidative stress and cellular senescence-associated with aging may be important in the development or progress of EA.
ACKNOWLEDGMENTS
This research was supported by a fund (code: 2016-ER6702-00) by Research of Korea Centers for Disease Control and Prevention, Korea University Anam Hospital, Seoul, Republic of Korea (Grant No. O1700381).
SUPPLEMENTARY MATERIALS
Supplementary Table S1Clinical characteristics of replication data set
Click here to view
Supplementary Table S2Leading edge genes of gene sets enriched in both discovery and replication datasets
Click here to view
Supplementary Fig. S1Heat map of 2 gene clusters identified in the discovery dataset.
Click here to view
112https://e-aair.org https://doi.org/10.4168/aair.2019.11.e14
Sputum Transcriptomic Analysis in Eldery Asthma

Supplementary Fig. S2Gene sets enriched in each cluster identified in the replication dataset with FDR P values less than 0.001. Only 2 gene sets were presented which were also significantly enriched in the discovery dataset.
Click here to view
Supplementary Fig. S3Differences of serum uric acid levels and post-BD FEV1/FVC values between cluster 1 and cluster 2 in the discovery dataset.
Click here to view
REFERENCES
1. He W, Goodkind D, Kowal P. An aging world: 2015 [Internet]. Suitland (MD): United States Census Bureau; 2016 [cited 2018 Aug 15]. Available from: https://www.census.gov/content/dam/Census/library/publications/2016/demo/p95-16-1.pdf.
2. Gibson PG, McDonald VM, Marks GB. Asthma in older adults. Lancet 2010;376:803-13. PUBMED | CROSSREF
3. Park HW, Kwon HS, Kim TB, Kim SH, Chang YS, Jang AS, et al. Differences between asthma in young and elderly: results from the COREA study. Respir Med 2013;107:1509-14. PUBMED | CROSSREF
4. Sano H, Iwanaga T, Nishiyama O, Sano A, Higashimoto Y, Tomita K, et al. Characteristics of phenotypes of elderly patients with asthma. Allergol Int 2016;65:204-9. PUBMED | CROSSREF
5. Inoue H, Niimi A, Takeda T, Matsumoto H, Ito I, Matsuoka H, et al. Pathophysiological characteristics of asthma in the elderly: a comprehensive study. Ann Allergy Asthma Immunol 2014;113:527-33. PUBMED | CROSSREF
6. Nicholas B, Djukanović R. Induced sputum: a window to lung pathology. Biochem Soc Trans 2009;37:868-72. PUBMED | CROSSREF
7. Baines KJ, Simpson JL, Wood LG, Scott RJ, Gibson PG. Transcriptional phenotypes of asthma defined by gene expression profiling of induced sputum samples. J Allergy Clin Immunol 2011;127:153-60, 160.e1-60.e9.
8. Hekking PP, Loza MJ, Pavlidis S, De Meulder B, Lefaudeux D, Baribaud F, et al. Transcriptomic gene signatures associated with persistent airflow limitation in patients with severe asthma. Eur Respir J 2017;50:1602298. PUBMED | CROSSREF
9. Global Initiative for Asthma (GINA). Global strategy for asthma management and prevention [Internet]. Walworth (WI): Global Initiative for Asthma; 2018 [cited 2018 Aug 15]. Available from: https://www.ginasthma.org.
10. Sohn SW, Lee HS, Park HW, Chang YS, Kim YK, Cho SH, et al. Evaluation of cytokine mRNA in induced sputum from patients with allergic rhinitis: relationship to airway hyperresponsiveness. Allergy 2008;63:268-73. PUBMED | CROSSREF
11. Suzuki R, Shimodaira H. Pvclust: an R package for assessing the uncertainty in hierarchical clustering. Bioinformatics 2006;22:1540-2. PUBMED | CROSSREF
12. Subramanian A, Tamayo P, Mootha VK, Mukherjee S, Ebert BL, Gillette MA, et al. Gene set enrichment analysis: a knowledge-based approach for interpreting genome-wide expression profiles. Proc Natl Acad Sci U S A 2005;102:15545-50. PUBMED | CROSSREF
13. Fabbrini E, Serafini M, Colic Baric I, Hazen SL, Klein S. Effect of plasma uric acid on antioxidant capacity, oxidative stress, and insulin sensitivity in obese subjects. Diabetes 2014;63:976-81. PUBMED | CROSSREF
113https://e-aair.org https://doi.org/10.4168/aair.2019.11.e14
Sputum Transcriptomic Analysis in Eldery Asthma

14. Rasmussen F, Taylor DR, Flannery EM, Cowan JO, Greene JM, Herbison GP, et al. Risk factors for airway remodeling in asthma manifested by a low postbronchodilator FEV1/vital capacity ratio: a longitudinal population study from childhood to adulthood. Am J Respir Crit Care Med 2002;165:1480-8. PUBMED | CROSSREF
15. Dunn RM, Busse PJ, Wechsler ME. Asthma in the elderly and late-onset adult asthma. Allergy 2018;73:284-94. PUBMED | CROSSREF
16. De la Fuente M, Miquel J. An update of the oxidation-inflammation theory of aging: the involvement of the immune system in oxi-inflamm-aging. Curr Pharm Des 2009;15:3003-26. PUBMED | CROSSREF
17. Bullone M, Lavoie JP. The contribution of oxidative stress and inflamm-aging in human and equine asthma. Int J Mol Sci 2017;18:E2612. PUBMED | CROSSREF
18. DiMauro S, Bonilla E, Davidson M, Hirano M, Schon EA. Mitochondria in neuromuscular disorders. Biochim Biophys Acta 1998;1366:199-210. CROSSREF
19. Shoubridge EA. Mitochondrial encephalomyopathies. Curr Opin Neurol 1998;11:491-6. PUBMED | CROSSREF
20. Prakash YS, Pabelick CM, Sieck GC. Mitochondrial dysfunction in airway disease. Chest 2017;152:618-26. PUBMED | CROSSREF
21. Smeitink J, van den Heuvel L, DiMauro S. The genetics and pathology of oxidative phosphorylation. Nat Rev Genet 2001;2:342-52. PUBMED | CROSSREF
22. Balaban RS, Nemoto S, Finkel T. Mitochondria, oxidants, and aging. Cell 2005;120:483-95. PUBMED | CROSSREF
23. Dröge W. Free radicals in the physiological control of cell function. Physiol Rev 2002;82:47-95. PUBMED | CROSSREF
24. Malhotra JD, Kaufman RJ. Endoplasmic reticulum stress and oxidative stress: a vicious cycle or a double-edged sword? Antioxid Redox Signal 2007;9:2277-93. PUBMED | CROSSREF
25. Pathinayake PS, Hsu AC, Waters DW, Hansbro PM, Wood LG, Wark PA. Understanding the unfolded protein response in the pathogenesis of asthma. Front Immunol 2018;9:175. PUBMED | CROSSREF
26. Reddy PH. Mitochondrial dysfunction and oxidative stress in asthma: implications for mitochondria-targeted antioxidant therapeutics. Pharmaceuticals (Basel) 2011;4:429-56. PUBMED | CROSSREF
27. Micalizzi DS, Farabaugh SM, Ford HL. Epithelial-mesenchymal transition in cancer: parallels between normal development and tumor progression. J Mammary Gland Biol Neoplasia 2010;15:117-34. PUBMED | CROSSREF
28. Hackett TL. Epithelial-mesenchymal transition in the pathophysiology of airway remodelling in asthma. Curr Opin Allergy Clin Immunol 2012;12:53-9. PUBMED | CROSSREF
29. Ritschka B, Storer M, Mas A, Heinzmann F, Ortells MC, Morton JP, et al. The senescence-associated secretory phenotype induces cellular plasticity and tissue regeneration. Genes Dev 2017;31:172-83. PUBMED | CROSSREF
30. Dagouassat M, Gagliolo JM, Chrusciel S, Bourin MC, Duprez C, Caramelle P, et al. The cyclooxygenase-2-prostaglandin E2 pathway maintains senescence of chronic obstructive pulmonary disease fibroblasts. Am J Respir Crit Care Med 2013;187:703-14. PUBMED | CROSSREF
31. Houssaini A, Breau M, Kebe K, Abid S, Marcos E, Lipskaia L, et al. mTOR pathway activation drives lung cell senescence and emphysema. JCI Insight 2018;3:93203.
32. Smit MA, Peeper DS. Epithelial-mesenchymal transition and senescence: two cancer-related processes are crossing paths. Aging (Albany NY) 2010;2:735-41. PUBMED | CROSSREF
33. Laberge RM, Awad P, Campisi J, Desprez PY. Epithelial-mesenchymal transition induced by senescent fibroblasts. Cancer Microenviron 2012;5:39-44. PUBMED | CROSSREF
114https://e-aair.org https://doi.org/10.4168/aair.2019.11.e14
Sputum Transcriptomic Analysis in Eldery Asthma

34. Yasukawa A, Hosoki K, Toda M, Miyake Y, Matsushima Y, Matsumoto T, et al. Eosinophils promote epithelial to mesenchymal transition of bronchial epithelial cells. PLoS One 2013;8:e64281. PUBMED | CROSSREF
35. Lee H, Tho NV, Nakano Y, Lee BJ, Park HY. A diagnostic approach and natural course of a patient with asthma-COPD overlap syndrome. Respirol Case Rep 2015;3:119-21. PUBMED | CROSSREF
36. Zeki AA, Schivo M, Chan A, Albertson TE, Louie S. The asthma-COPD overlap syndrome: a common clinical problem in the elderly. J Allergy (Cairo) 2011;2011:861926. PUBMED | CROSSREF
37. Bigler J, Boedigheimer M, Schofield JP, Skipp PJ, Corfield J, Rowe A, et al. A severe asthma disease signature from gene expression profiling of peripheral blood from U-BIOPRED cohorts. Am J Respir Crit Care Med 2017;195:1311-20. PUBMED | CROSSREF
38. Takahashi K, Pavlidis S, Ng Kee Kwong F, Hoda U, Rossios C, Sun K, et al. Sputum proteomics and airway cell transcripts of current and ex-smokers with severe asthma in U-BIOPRED: an exploratory analysis. Eur Respir J 2018;51:1702173. PUBMED | CROSSREF
39. Dorscheid DR, Wojcik KR, Yule K, White SR. Role of cell surface glycosylation in mediating repair of human airway epithelial cell monolayers. Am J Physiol Lung Cell Mol Physiol 2001;281:L982-92. PUBMED | CROSSREF
40. Holgate ST, Davies DE, Puddicombe S, Richter A, Lackie P, Lordan J, et al. Mechanisms of airway epithelial damage: epithelial-mesenchymal interactions in the pathogenesis of asthma. Eur Respir J Suppl 2003;44:24s-29s. PUBMED | CROSSREF
115https://e-aair.org https://doi.org/10.4168/aair.2019.11.e14
Sputum Transcriptomic Analysis in Eldery Asthma