original article / artigo original development of a food ... · resumo: objetivo: apresentar e...
TRANSCRIPT
479Rev BRas epidemiol apR-jun 2014; 479-494
AbstrAct: Objective: To present and discuss the process of the development of a Quantitative Food Frequency Questionnaire (QFFQ) aimed at 7-10 year-old children. Methods: A methodological study was performed based on the application of a Food Diary (FD) fulfilled by 85 children. Based on registered food, the diet composition in relation to energy and macronutrients was calculated. Food was grouped into items and the percentage of the contribution of each item to the diet in terms of calories and macronutrients was calculated. Results: The QFFQ consisted of 92 food items, 76 were selected by Block’s method and 16 were identified from other instruments from literature developed for children and adolescents. The food items were grouped in 17 food groups with 3 serving sizes and 7 categories to measure food frequency. Conclusion: Among the food items, rice was the one that showed the biggest percentage of contribution for energy and carbohydrates. For other nutrients, meat and milk were the ones that contributed most to the consumption of proteins and lipids, respectively.
Keywords: Food consumption. Child. Questionnaires. Diet surveys. Macronutrients. Usual intake.
Development of a food frequency questionnaire for children from 7 to 10 years oldConstrução de questionário de frequência alimentar para crianças de 7 a 10 anos
Patrícia de Fragas HinnigI, Aline Brandão MariathI, Silvia Rafaela Mascarenhas FreazaI, Ana Maria Dianezi GambardellaI, Denise Pimentel BergamaschiI
ISchool of Public Health of the Universidade de São Paulo – São Paulo (SP), Brazil.Corresponding author: Denise Pimentel Bergamaschi. Departamento de Epidemiologia da Faculdade de Saúde Pública da Universidade de São Paulo. Avenida Doutor Arnaldo, 715, Cerqueira César, CEP: 01246-904, São Paulo, SP, Brazil. E-mail: [email protected] of interests: nothing to declare – Financing source: Ministry of Health/Conselho Nacional de Desenvolvimento Científico e Tecnológico (CNPq) – Edital 30, Processo nº 506162/04-4 – e Coordenação de Aperfeiçoamento de Pessoal de Nível Superior (CAPES).
OriginAl Article / Artigo originAl
DOI: 10.1590/1809-4503201400020015enG
Hinnig, P.F. et al.
480Rev BRas epidemiol apR-jun 2014; 479-494
IntroductIon
It is an interest the individual and collective health to monitor dietary indicators in childhood, since scientific evidence suggest that many diseases typical of adults, such as obesity, heart disease, some cancers, osteoporosis and hypertension are associated to eating habits in the early stages of life1.
The Food Frequency Questionnaire (FFQ), used to assess the usual dietary intake, is an instrument which can provide good reproducibility and validity, especially for energy and macronutrients, being practical to fill out if compared to the detailed description required by other methods, like the Food Diary (FD). This last one provides detailed information, being highly valued as a reference in validity studies, especially for depending less on the participant’s memory. Ideally, the FD must be filled out for more than one day, including the weekend, and, since it requires large investment in data collection by the researcher and the participant, it has limited usage in epidemiological studies1.
In Brazil, there are FFQs developed to estimate dietary intake in children from 2 to 5 years of age2 and adolescents3-5, not covering the age group of 7 to 10 years of age. Usually, publications do not present the list of selected food to compose the Quantitative Food Frequency Questionnaire (QFFQ) with servings normally consumed by children. It is found in the literature the study by Fumagalli et al.6, who validated, for children from 5 to 10 years of age, in Mirandópolis (SP), FFQ originally developed for adults. However, in the validation process, there was observed an overestimation of the food intake, suggesting that the food portions of the instrument should be adjusted prior to its application in this population group.
resumO: Objetivo: Apresentar e discutir o processo de construção de um Questionário de Frequência Alimentar Quantitativo (QFAQ) para crianças de 7 a 10 anos. Métodos: Para a construção do QFAQ realizou-se estudo metodológico com aplicação de três Diários Alimentares (DA) a uma população de 85 escolares de 7 a 10 anos. A partir dos alimentos registrados quantificou-se a composição da dieta em energia e macronutrientes e procedeu-se ao agrupamento dos alimentos em itens, com posterior cálculo do percentual de contribuição de cada item no consumo alimentar de energia e nutrientes. Resultados: Construiu-se um QFAQ com 92 itens alimentares, sendo 76 incluídos pelo método de Block e 16 selecionados de outros instrumentos já publicados, desenvolvidos para crianças e adolescentes. Os itens alimentares foram organizados em 17 grupos de alimentos e 3 opções de porções e 7 categorias de frequência alimentar. Conclusão: Entre os itens alimentares, o arroz foi o que apresentou maior contribuição percentual para energia e carboidratos. Para os demais macronutrientes, a carne bovina e o leite integral foram os que mais contribuíram para o consumo de proteínas e lipídios, respectivamente.
Palavras-chave: Consumo de alimentos. Criança. Questionários. Inquéritos sobre dietas. Macronutrientes. Dieta habitual.
Food Frequency questionnaire For children
481Rev BRas epidemiol apR-jun 2014; 479-494
Considering the cognitive characteristics of children aged 7 to 10 years, it becomes challenging to assess the dietary intake, as this group may experience limitations as to their ability to describe and quantify the servings, as to the knowledge about food and its preparation, as difficulty recognizing food and the time of consumption, due to the low attention, being also described difficulties in distinguishing between real and imaginary events7,8.
However, literature indicates that if skills for the identification of food and for the servings consumed are developed by training, then children from 7 to 10 years of age may be able to provide with quality information on their food intake7,9. It is possible that children are the best reporters, once that the reporting by parents or guardians may imply inaccuracies, since they do not follow their children at all times, especially in meals eaten outside their home8.
It is then justified the building of a QFFQ directed at children from 7 to10 years of age, and for this it is first necessary to identify accurately the food in this population group’s usual diet, following a selecting method of the most representative food items, proposing a tool that, in a second moment, should have their reliability and validity properties assessed1.
This study is presented in a detailed way and it discusses the process of building a QFFQ in order to estimate the average food consumption within the last three months in matters of energy and macronutrients of children aged 7 to 10.
Methodology
Studied population and data collection
This is a methodological study, conducted at the School of Application at the Universidade de São Paulo (USP), which includes children of servers of the Faculty of Education of USP, children of servers from institutes or agencies of USP and also from the community outside the University. The survey was conducted in the period from May to July 2008 and from March to June 2009, with random sample selection of 115 students from 2nd to 5th grade of elementary school, out of a total of 240 ones. This study is related to a cohort study which assesses the evolution of the growth of children from 7 to 10 years of age.
In order to identify the food items and servings that would be included in the QFFQ, it was requested the filling out of three FDs, being one at the weekend. The students were previously trained in two sessions of 30 minutes each, to strengthen their skills in the recording of their food intake. Children of the same school year were divided into groups of no more than seven members, to facilitate solving doubts and to consider the reading, writing and understanding skills of each age group.
The first session aimed at the presentation of the FD and providing information on how to the items should be filled out, including the characteristics and servings of each food consumed. Utensils for the recording of information on household-like measures, replicas of servings for the recording in small, medium or large units and packaging units and for developing skills on identifying the brand, type, flavor, quantity and volume of the food in
Hinnig, P.F. et al.
482Rev BRas epidemiol apR-jun 2014; 479-494
grams or ml were presented. Children were asked to fill out a FD regarding the subsequent day which served as an activity to use and reinforce the information learned. Aspects of the training are covered in a more detailed way in the article by Consolmagno et al.9.
The second training session aimed at reviewing the concepts learned in the first session. To do so, a checking of the FDs was performed, emphasizing the correct way to record the food of greatest difficulty. The instruments used to record the information are detailed by Hinnig et al.7. Since the study was in interest of identifying the largest possible number of food, it was chosen not to exclude children who completed less than three diaries.
The data from the FDs were transcribed into an auxiliary document in an attempt to standardize their insertion in the NutWin program, version 2.510, for the determination of energy and macronutrients quantities. National tables of food composition11-14 and labeling of processed food were also consulted. The energy and macronutrients data were transferred to an Excel spreadsheet and analyzed using the Stata software, version 9.015.
development of the Quantitative food freQuency QueStionnaire
To identify the food which would be part of the QFFQ, four steps were performed:• drawing up of the initial list of food and their amounts in grams, with their respective
calculations of energy and macronutrients based on the data of the FD;• encoding of different food and preparation methods;• grouping the food items according to their similarity in conceptual terms, in physical
characteristics and in the amount of the nutrient per serving16. This first group was reviewed by two other nutritionists, with the objective of making the grouping process more consistent;
• identification of the most representative food items and which represented up to 95% of the energy and macronutrient consumption, as proposed by Block et al.16.
The method provides with a relative percentage of contribution of each food item in the diet, to the nutrient of interest, given by the formula:
Relative contribution of the item (%) =total nutrient of the item I
total nutrient of all the foodx100
For i = 1, 2...k, where i represents the food item.
Other criteria for the inclusion of food items were used: to be quoted in FFQs developed for children from 2 to 5 years of age by Colucci et al.2 or adolescents by Slater et al.5. In case any food item considered to be important in the diet of children, by professional experience and through observation of consumption, were not selected by the previously mentioned methods, it was chosen to have them included in the questionnaire.
Food Frequency questionnaire For children
483Rev BRas epidemiol apR-jun 2014; 479-494
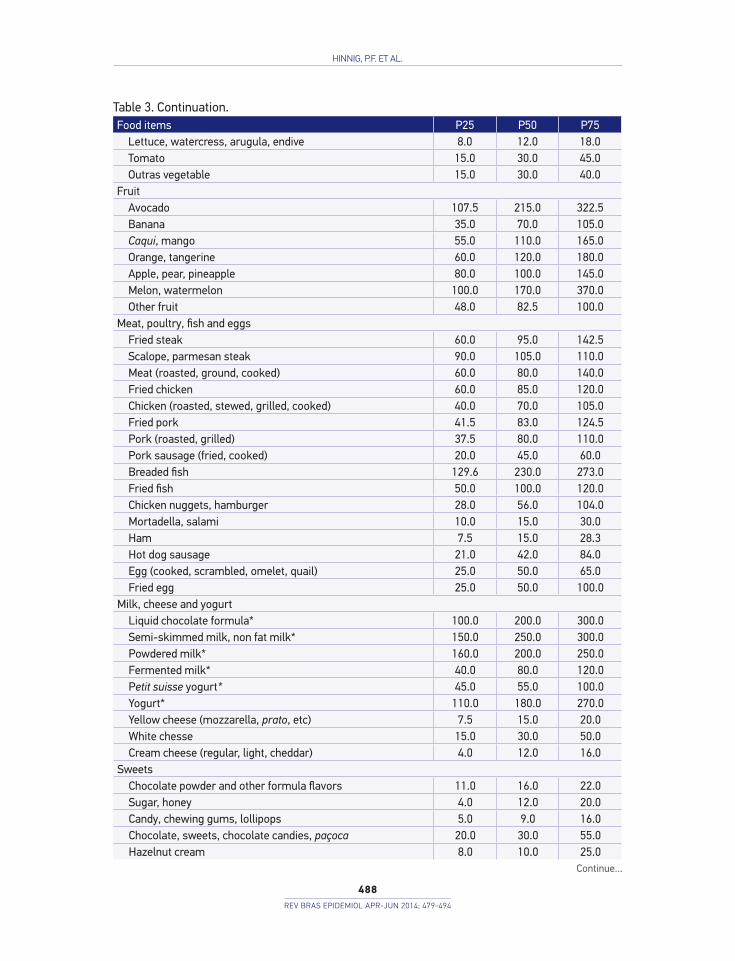
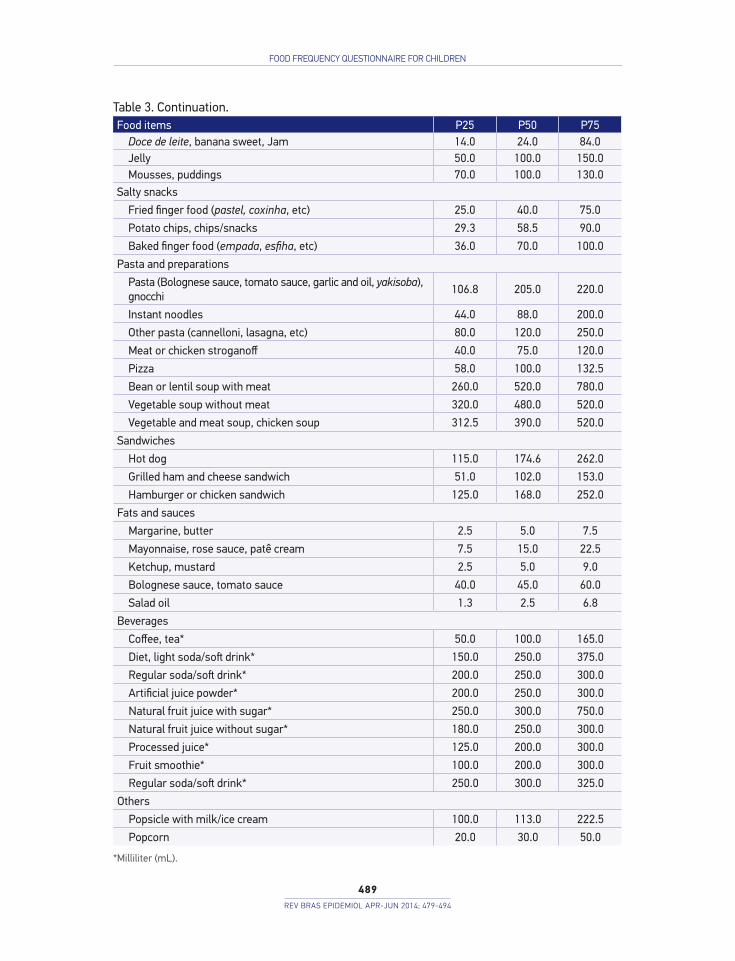
Three sizes of food portions for each food item were defined according to the percentage distribution of the weights in grams of the consumed food: 25 percentile (P25), 50 (median) (P50) and 75 (P75). The amount in grams was converted into household measures using the table for evaluation of food consumption of Pinheiro et al.13.
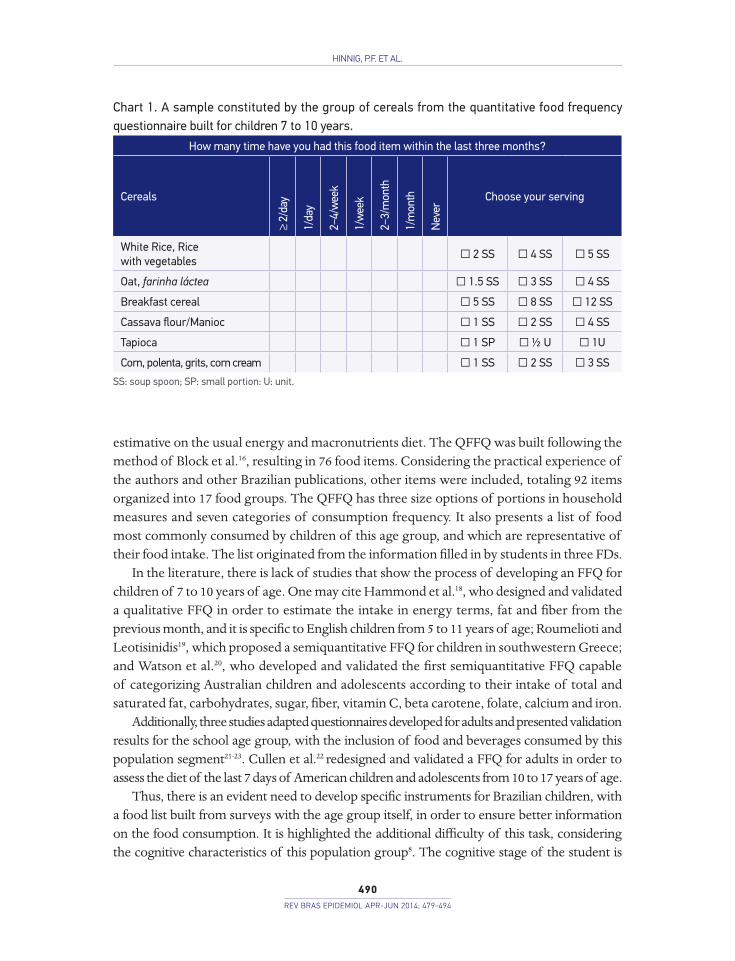
The systematization of the consumption frequency was set in seven categories: two or more times a day, once a day, two to four times a week, once a week, twice to three times a month, once a month and never, according to the adapted propose by Slater et al.5.
It is noteworthy that the questionnaire refers back to the habitual consumption over the last three months prior to its application and it was designed to be applied by interview, after training the interviewers.
This study was approved by the Research Ethics Committee of the School of Public Health of USP. The parents or guardians received a term of free and informed consent (IC) to be signed, which authorizes or not the child’s participation in the research.
results
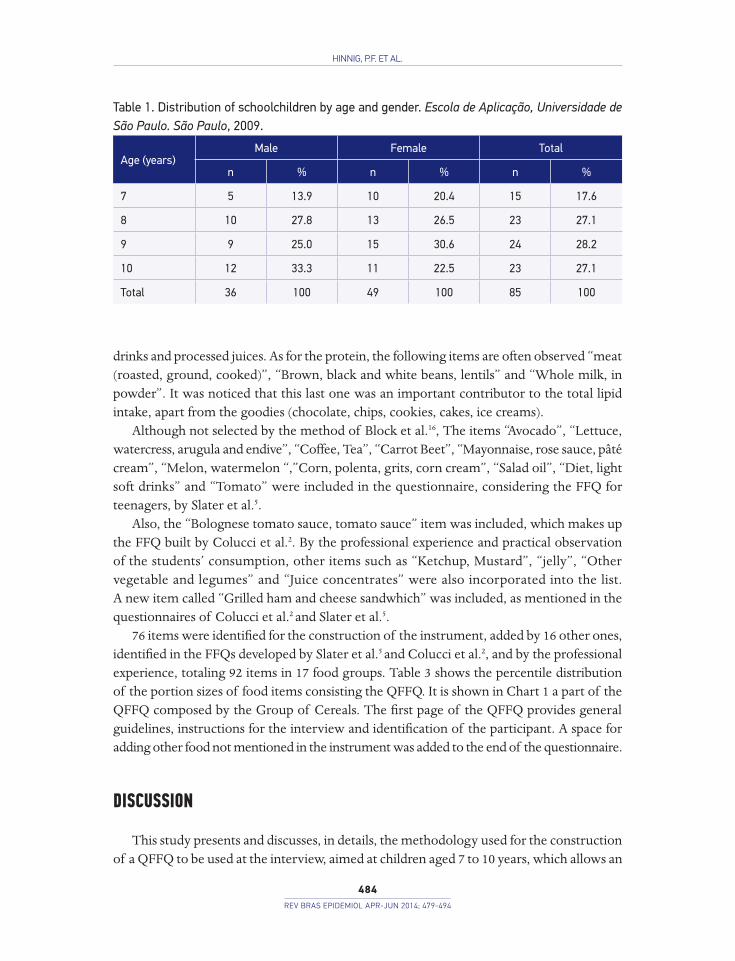
The study included 85 students, representing 74% of the total initially included, ages between 7 and 10, being 57.7% (n = 49) were female and 42.3% (n = 36) were male (Table 1). Among children who did not participate (26%), 14.7% (n = 17) of them did not deliver the IC, 5.2% (n = 6) did not complete the FD, 3.5% (n = 4) were younger than 7 or older than 10 years of age and 2.6% (n = 3) were excluded, by request of the parents, due to accumulation of school homework.
Among the participating students, 82 completed 3 FDs, 1 student filled out 2 FDs and 2 students completed 4 FDs, totalizing 256 FDs. To achieve a balance in the days of the week with similar representation in all days, it was necessary that two students would fill out four FDs.
In order to characterize the study population, data published by Bispo17 were used, which showed that 59% of students aged between 7 and 10 years were placed in families of 4 to 6 people; more than 60% of fathers had completed high school or higher education levels, 50% of the families earned between 3.1 and 10 times the minimum wage. Nearly 50% of parents of students in elementary and high school were part of the community outside the University.
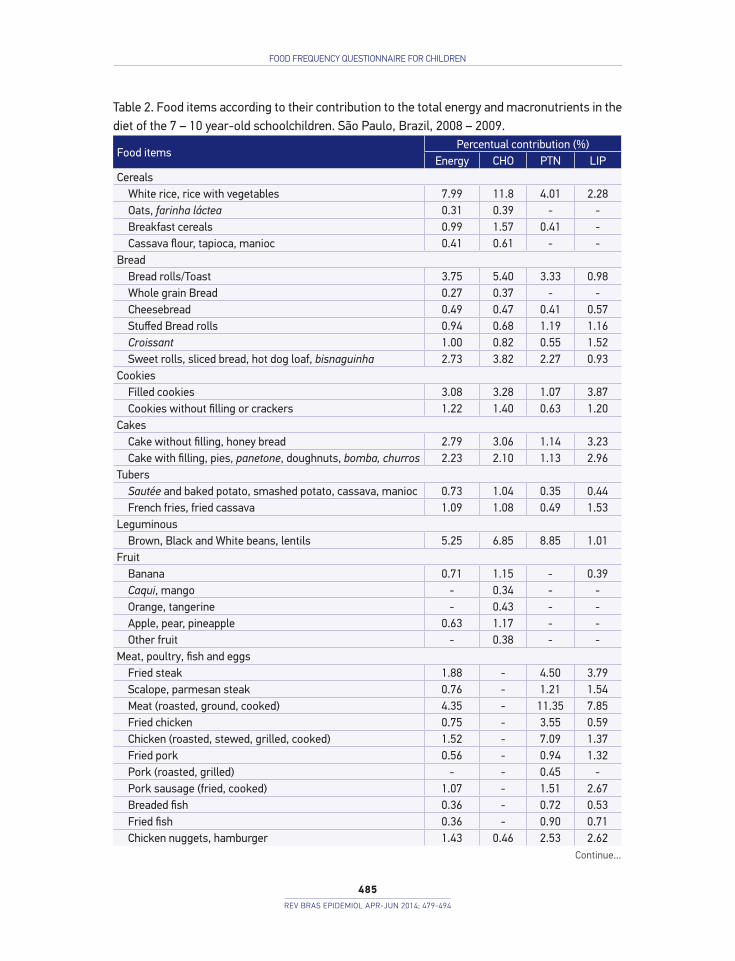
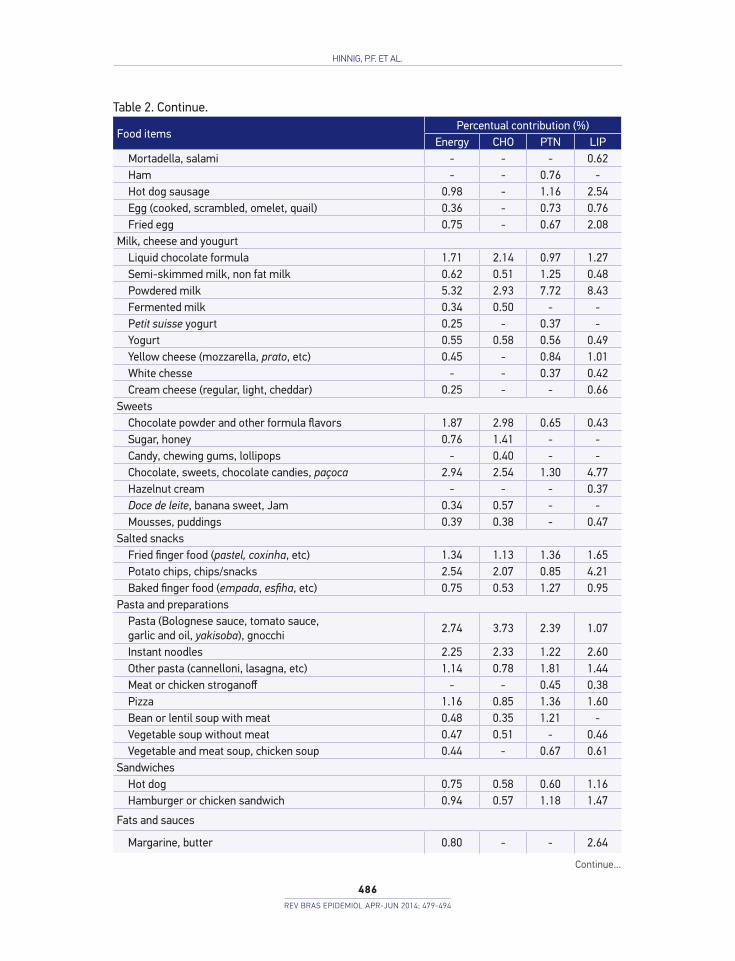
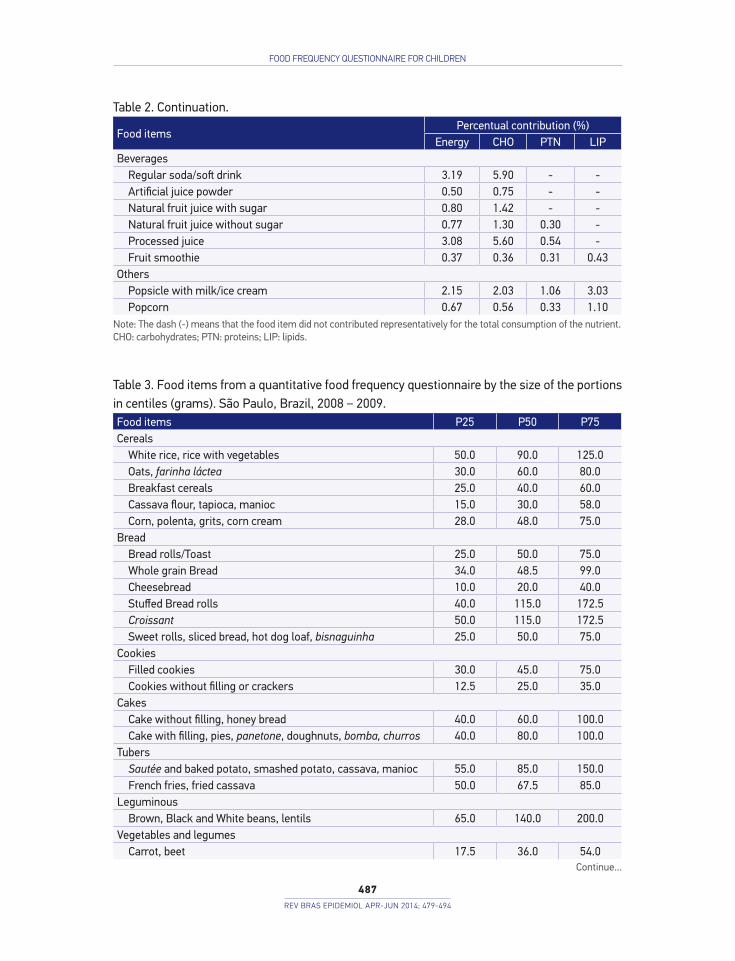
Based on 256 FDs filled out, 393 food and various forms of preparation have been identified. The grouping of these resulted in 129 food items, divided into 17 groups: Cereals; Bread; Cookies; Cakes; Tubers; Leguminous; Vegetable and Legumes; Fruit; Meat, poultry, fish and eggs; Milk, cheese and yogurt; Sweets; Salted snacks; Pasta/masses and preparations; sandwiches; Fats, sauces and condiments; Beverages and others. The percentage contribution16 to 129 food items, in total energy consumption, carbohydrates (CHO), proteins (NTP) and lipids (LIP), allowed the identification of 76 items, representing approximately 95% of the food consumption (Table 2).
Among the most representative food for the total energy and carbohydrates consumption, the food traditionally consumed by the Brazilian population is noteworthy, such as rice and beans, as well as goodies represented by cookies, chocolates and cakes, as well as soft
Hinnig, P.F. et al.
484Rev BRas epidemiol apR-jun 2014; 479-494
drinks and processed juices. As for the protein, the following items are often observed “meat (roasted, ground, cooked)”, “Brown, black and white beans, lentils” and “Whole milk, in powder”. It was noticed that this last one was an important contributor to the total lipid intake, apart from the goodies (chocolate, chips, cookies, cakes, ice creams).
Although not selected by the method of Block et al.16, The items “Avocado”, “Lettuce, watercress, arugula and endive”, “Coffee, Tea”, “Carrot Beet”, “Mayonnaise, rose sauce, pâté cream”, “Melon, watermelon “,”Corn, polenta, grits, corn cream”, “Salad oil”, “Diet, light soft drinks” and “Tomato” were included in the questionnaire, considering the FFQ for teenagers, by Slater et al.5.
Also, the “Bolognese tomato sauce, tomato sauce” item was included, which makes up the FFQ built by Colucci et al.2. By the professional experience and practical observation of the students’ consumption, other items such as “Ketchup, Mustard”, “jelly”, “Other vegetable and legumes” and “Juice concentrates” were also incorporated into the list. A new item called “Grilled ham and cheese sandwhich” was included, as mentioned in the questionnaires of Colucci et al.2 and Slater et al.5.
76 items were identified for the construction of the instrument, added by 16 other ones, identified in the FFQs developed by Slater et al.5 and Colucci et al.2, and by the professional experience, totaling 92 items in 17 food groups. Table 3 shows the percentile distribution of the portion sizes of food items consisting the QFFQ. It is shown in Chart 1 a part of the QFFQ composed by the Group of Cereals. The first page of the QFFQ provides general guidelines, instructions for the interview and identification of the participant. A space for adding other food not mentioned in the instrument was added to the end of the questionnaire.
dIscussIon
This study presents and discusses, in details, the methodology used for the construction of a QFFQ to be used at the interview, aimed at children aged 7 to 10 years, which allows an
Table 1. Distribution of schoolchildren by age and gender. Escola de Aplicação, Universidade de São Paulo. São Paulo, 2009.
Age (years)Male Female Total
n % n % n %
7 5 13.9 10 20.4 15 17.6
8 10 27.8 13 26.5 23 27.1
9 9 25.0 15 30.6 24 28.2
10 12 33.3 11 22.5 23 27.1
Total 36 100 49 100 85 100
Food Frequency questionnaire For children
485Rev BRas epidemiol apR-jun 2014; 479-494
Table 2. Food items according to their contribution to the total energy and macronutrients in the diet of the 7 – 10 year-old schoolchildren. São Paulo, Brazil, 2008 – 2009.
Food itemsPercentual contribution (%)
Energy CHO PTN LIPCereals
White rice, rice with vegetables 7.99 11.8 4.01 2.28Oats, farinha láctea 0.31 0.39 - -Breakfast cereals 0.99 1.57 0.41 -Cassava flour, tapioca, manioc 0.41 0.61 - -
BreadBread rolls/Toast 3.75 5.40 3.33 0.98Whole grain Bread 0.27 0.37 - -Cheesebread 0.49 0.47 0.41 0.57Stuffed Bread rolls 0.94 0.68 1.19 1.16Croissant 1.00 0.82 0.55 1.52Sweet rolls, sliced bread, hot dog loaf, bisnaguinha 2.73 3.82 2.27 0.93
CookiesFilled cookies 3.08 3.28 1.07 3.87Cookies without filling or crackers 1.22 1.40 0.63 1.20
CakesCake without filling, honey bread 2.79 3.06 1.14 3.23Cake with filling, pies, panetone, doughnuts, bomba, churros 2.23 2.10 1.13 2.96
TubersSautée and baked potato, smashed potato, cassava, manioc 0.73 1.04 0.35 0.44French fries, fried cassava 1.09 1.08 0.49 1.53
LeguminousBrown, Black and White beans, lentils 5.25 6.85 8.85 1.01
FruitBanana 0.71 1.15 - 0.39Caqui, mango - 0.34 - -Orange, tangerine - 0.43 - -Apple, pear, pineapple 0.63 1.17 - -Other fruit - 0.38 - -
Meat, poultry, fish and eggsFried steak 1.88 - 4.50 3.79Scalope, parmesan steak 0.76 - 1.21 1.54Meat (roasted, ground, cooked) 4.35 - 11.35 7.85Fried chicken 0.75 - 3.55 0.59Chicken (roasted, stewed, grilled, cooked) 1.52 - 7.09 1.37Fried pork 0.56 - 0.94 1.32Pork (roasted, grilled) - - 0.45 -Pork sausage (fried, cooked) 1.07 - 1.51 2.67Breaded fish 0.36 - 0.72 0.53Fried fish 0.36 - 0.90 0.71Chicken nuggets, hamburger 1.43 0.46 2.53 2.62
Continue...
Hinnig, P.F. et al.
486Rev BRas epidemiol apR-jun 2014; 479-494
Food itemsPercentual contribution (%)
Energy CHO PTN LIPMortadella, salami - - - 0.62Ham - - 0.76 -Hot dog sausage 0.98 - 1.16 2.54Egg (cooked, scrambled, omelet, quail) 0.36 - 0.73 0.76Fried egg 0.75 - 0.67 2.08
Milk, cheese and yougurtLiquid chocolate formula 1.71 2.14 0.97 1.27Semi-skimmed milk, non fat milk 0.62 0.51 1.25 0.48Powdered milk 5.32 2.93 7.72 8.43Fermented milk 0.34 0.50 - -Petit suisse yogurt 0.25 - 0.37 -Yogurt 0.55 0.58 0.56 0.49Yellow cheese (mozzarella, prato, etc) 0.45 - 0.84 1.01White chesse - - 0.37 0.42Cream cheese (regular, light, cheddar) 0.25 - - 0.66
SweetsChocolate powder and other formula flavors 1.87 2.98 0.65 0.43Sugar, honey 0.76 1.41 - -Candy, chewing gums, lollipops - 0.40 - -Chocolate, sweets, chocolate candies, paçoca 2.94 2.54 1.30 4.77Hazelnut cream - - - 0.37Doce de leite, banana sweet, Jam 0.34 0.57 - -Mousses, puddings 0.39 0.38 - 0.47
Salted snacksFried finger food (pastel, coxinha, etc) 1.34 1.13 1.36 1.65Potato chips, chips/snacks 2.54 2.07 0.85 4.21Baked finger food (empada, esfiha, etc) 0.75 0.53 1.27 0.95
Pasta and preparationsPasta (Bolognese sauce, tomato sauce, garlic and oil, yakisoba), gnocchi
2.74 3.73 2.39 1.07
Instant noodles 2.25 2.33 1.22 2.60Other pasta (cannelloni, lasagna, etc) 1.14 0.78 1.81 1.44Meat or chicken stroganoff - - 0.45 0.38Pizza 1.16 0.85 1.36 1.60Bean or lentil soup with meat 0.48 0.35 1.21 -Vegetable soup without meat 0.47 0.51 - 0.46Vegetable and meat soup, chicken soup 0.44 - 0.67 0.61
SandwichesHot dog 0.75 0.58 0.60 1.16Hamburger or chicken sandwich 0.94 0.57 1.18 1.47
Fats and sauces
Margarine, butter 0.80 - - 2.64
Table 2. Continue.
Continue...
Food Frequency questionnaire For children
487Rev BRas epidemiol apR-jun 2014; 479-494
Note: The dash (-) means that the food item did not contributed representatively for the total consumption of the nutrient. CHO: carbohydrates; PTN: proteins; LIP: lipids.
Food itemsPercentual contribution (%)
Energy CHO PTN LIPBeverages
Regular soda/soft drink 3.19 5.90 - -Artificial juice powder 0.50 0.75 - -Natural fruit juice with sugar 0.80 1.42 - -Natural fruit juice without sugar 0.77 1.30 0.30 -Processed juice 3.08 5.60 0.54 -Fruit smoothie 0.37 0.36 0.31 0.43
OthersPopsicle with milk/ice cream 2.15 2.03 1.06 3.03Popcorn 0.67 0.56 0.33 1.10
Table 2. Continuation.
Table 3. Food items from a quantitative food frequency questionnaire by the size of the portions in centiles (grams). São Paulo, Brazil, 2008 − 2009.Food items P25 P50 P75Cereals
White rice, rice with vegetables 50.0 90.0 125.0Oats, farinha láctea 30.0 60.0 80.0Breakfast cereals 25.0 40.0 60.0Cassava flour, tapioca, manioc 15.0 30.0 58.0Corn, polenta, grits, corn cream 28.0 48.0 75.0
BreadBread rolls/Toast 25.0 50.0 75.0Whole grain Bread 34.0 48.5 99.0Cheesebread 10.0 20.0 40.0Stuffed Bread rolls 40.0 115.0 172.5Croissant 50.0 115.0 172.5Sweet rolls, sliced bread, hot dog loaf, bisnaguinha 25.0 50.0 75.0
CookiesFilled cookies 30.0 45.0 75.0Cookies without filling or crackers 12.5 25.0 35.0
CakesCake without filling, honey bread 40.0 60.0 100.0Cake with filling, pies, panetone, doughnuts, bomba, churros 40.0 80.0 100.0
TubersSautée and baked potato, smashed potato, cassava, manioc 55.0 85.0 150.0French fries, fried cassava 50.0 67.5 85.0
LeguminousBrown, Black and White beans, lentils 65.0 140.0 200.0
Vegetables and legumesCarrot, beet 17.5 36.0 54.0
Continue...
Hinnig, P.F. et al.
488Rev BRas epidemiol apR-jun 2014; 479-494
Food items P25 P50 P75Lettuce, watercress, arugula, endive 8.0 12.0 18.0Tomato 15.0 30.0 45.0Outras vegetable 15.0 30.0 40.0
FruitAvocado 107.5 215.0 322.5Banana 35.0 70.0 105.0Caqui, mango 55.0 110.0 165.0Orange, tangerine 60.0 120.0 180.0Apple, pear, pineapple 80.0 100.0 145.0Melon, watermelon 100.0 170.0 370.0Other fruit 48.0 82.5 100.0
Meat, poultry, fish and eggsFried steak 60.0 95.0 142.5Scalope, parmesan steak 90.0 105.0 110.0Meat (roasted, ground, cooked) 60.0 80.0 140.0Fried chicken 60.0 85.0 120.0Chicken (roasted, stewed, grilled, cooked) 40.0 70.0 105.0Fried pork 41.5 83.0 124.5Pork (roasted, grilled) 37.5 80.0 110.0Pork sausage (fried, cooked) 20.0 45.0 60.0Breaded fish 129.6 230.0 273.0Fried fish 50.0 100.0 120.0Chicken nuggets, hamburger 28.0 56.0 104.0Mortadella, salami 10.0 15.0 30.0Ham 7.5 15.0 28.3Hot dog sausage 21.0 42.0 84.0Egg (cooked, scrambled, omelet, quail) 25.0 50.0 65.0Fried egg 25.0 50.0 100.0
Milk, cheese and yogurtLiquid chocolate formula* 100.0 200.0 300.0Semi-skimmed milk, non fat milk* 150.0 250.0 300.0Powdered milk* 160.0 200.0 250.0Fermented milk* 40.0 80.0 120.0Petit suisse yogurt* 45.0 55.0 100.0Yogurt* 110.0 180.0 270.0Yellow cheese (mozzarella, prato, etc) 7.5 15.0 20.0White chesse 15.0 30.0 50.0Cream cheese (regular, light, cheddar) 4.0 12.0 16.0
SweetsChocolate powder and other formula flavors 11.0 16.0 22.0Sugar, honey 4.0 12.0 20.0Candy, chewing gums, lollipops 5.0 9.0 16.0Chocolate, sweets, chocolate candies, paçoca 20.0 30.0 55.0Hazelnut cream 8.0 10.0 25.0
Table 3. Continuation.
Continue...
Food Frequency questionnaire For children
489Rev BRas epidemiol apR-jun 2014; 479-494
*Milliliter (mL).
Food items P25 P50 P75Doce de leite, banana sweet, Jam 14.0 24.0 84.0Jelly 50.0 100.0 150.0Mousses, puddings 70.0 100.0 130.0
Salty snacks
Fried finger food (pastel, coxinha, etc) 25.0 40.0 75.0
Potato chips, chips/snacks 29.3 58.5 90.0
Baked finger food (empada, esfiha, etc) 36.0 70.0 100.0
Pasta and preparations
Pasta (Bolognese sauce, tomato sauce, garlic and oil, yakisoba), gnocchi
106.8 205.0 220.0
Instant noodles 44.0 88.0 200.0
Other pasta (cannelloni, lasagna, etc) 80.0 120.0 250.0
Meat or chicken stroganoff 40.0 75.0 120.0
Pizza 58.0 100.0 132.5
Bean or lentil soup with meat 260.0 520.0 780.0
Vegetable soup without meat 320.0 480.0 520.0
Vegetable and meat soup, chicken soup 312.5 390.0 520.0
Sandwiches
Hot dog 115.0 174.6 262.0
Grilled ham and cheese sandwich 51.0 102.0 153.0
Hamburger or chicken sandwich 125.0 168.0 252.0
Fats and sauces
Margarine, butter 2.5 5.0 7.5
Mayonnaise, rose sauce, patê cream 7.5 15.0 22.5
Ketchup, mustard 2.5 5.0 9.0
Bolognese sauce, tomato sauce 40.0 45.0 60.0
Salad oil 1.3 2.5 6.8
Beverages
Coffee, tea* 50.0 100.0 165.0
Diet, light soda/soft drink* 150.0 250.0 375.0
Regular soda/soft drink* 200.0 250.0 300.0
Artificial juice powder* 200.0 250.0 300.0
Natural fruit juice with sugar* 250.0 300.0 750.0
Natural fruit juice without sugar* 180.0 250.0 300.0
Processed juice* 125.0 200.0 300.0
Fruit smoothie* 100.0 200.0 300.0
Regular soda/soft drink* 250.0 300.0 325.0
Others
Popsicle with milk/ice cream 100.0 113.0 222.5
Popcorn 20.0 30.0 50.0
Table 3. Continuation.
Hinnig, P.F. et al.
490Rev BRas epidemiol apR-jun 2014; 479-494
estimative on the usual energy and macronutrients diet. The QFFQ was built following the method of Block et al.16, resulting in 76 food items. Considering the practical experience of the authors and other Brazilian publications, other items were included, totaling 92 items organized into 17 food groups. The QFFQ has three size options of portions in household measures and seven categories of consumption frequency. It also presents a list of food most commonly consumed by children of this age group, and which are representative of their food intake. The list originated from the information filled in by students in three FDs.
In the literature, there is lack of studies that show the process of developing an FFQ for children of 7 to 10 years of age. One may cite Hammond et al.18, who designed and validated a qualitative FFQ in order to estimate the intake in energy terms, fat and fiber from the previous month, and it is specific to English children from 5 to 11 years of age; Roumelioti and Leotisinidis19, which proposed a semiquantitative FFQ for children in southwestern Greece; and Watson et al.20, who developed and validated the first semiquantitative FFQ capable of categorizing Australian children and adolescents according to their intake of total and saturated fat, carbohydrates, sugar, fiber, vitamin C, beta carotene, folate, calcium and iron.
Additionally, three studies adapted questionnaires developed for adults and presented validation results for the school age group, with the inclusion of food and beverages consumed by this population segment21-23. Cullen et al.22 redesigned and validated a FFQ for adults in order to assess the diet of the last 7 days of American children and adolescents from 10 to 17 years of age.
Thus, there is an evident need to develop specific instruments for Brazilian children, with a food list built from surveys with the age group itself, in order to ensure better information on the food consumption. It is highlighted the additional difficulty of this task, considering the cognitive characteristics of this population group8. The cognitive stage of the student is
Chart 1. A sample constituted by the group of cereals from the quantitative food frequency questionnaire built for children 7 to 10 years.
How many time have you had this food item within the last three months?
Cereals
≥ 2/
day
1/da
y
2−4/
wee
k
1/w
eek
2−3/
mon
th
1/m
onth
Nev
er
Choose your serving
White Rice, Rice with vegetables
☐ 2 SS ☐ 4 SS ☐ 5 SS
Oat, farinha láctea ☐ 1.5 SS ☐ 3 SS ☐ 4 SS
Breakfast cereal ☐ 5 SS ☐ 8 SS ☐ 12 SS
Cassava flour/Manioc ☐ 1 SS ☐ 2 SS ☐ 4 SS
Tapioca ☐ 1 SP ☐ ½ U ☐ 1U
Corn, polenta, grits, corn cream ☐ 1 SS ☐ 2 SS ☐ 3 SS
SS: soup spoon; SP: small portion: U: unit.
Food Frequency questionnaire For children
491Rev BRas epidemiol apR-jun 2014; 479-494
reflected when recording the consumption, justifying the exclusion of some students (n = 3) of 7 years of age who had not completed the FD with proper quality. It was also observed a difficulty in children from 7 to 8 years of age in specifying exactly the food consumed and the proper cooking measures, requiring, at times, the help of the parents or guardians.
The literature suggests that limitations in filling out the information can be minimized if methodological steps are adopted, such as: the training of evaluators and participants before filling out the FD; checking the FDs one day after its completion; showcasing replicas, utensils and food packaging in order to properly estimate the food and the amount consumed; and constant communication with the parents7,9,24.
The use of the method of Block et al.16 in order to identify the representative food revealed the applicability and the consistency of this methodology, which has been used for more than two decades by national and international researchers2,5,25. Such method allows some foods, which could be overlooked for not being good enough in the means of representing a certain nutrient, to be included in the questionnaire, because their high frequency of consumption compensates its low content of the nutrient of interest.
After the construction of the lists, it was observed that some food, considered as important in children’s diet, were not selected by the method of Block et al.16. Therefore, it was necessary to consider other FFQs developed for teens and pre-school students in Brazil, for being population studies close to this one, in order to include these food in the list2,5.
The standardization of three portion sizes for composing the questionnaire approaches the dietary behavior of the population group, as described by Block et al. 16. As to the frequency of consumption, the study opted for an adaptation of Slater et al.5, which covers options according to a gradient of high to low consumption. According to Willett1, for a FFQ, 5 to 10 frequency options are enough, since a smaller number would most likely result in loss of information.
The conversion of food into nutrients is an important step in the investigation of food intake, however, the tables available have limitations, such as lack of updated information and scope of food choices. The software packages used for this conversion are useful, because they facilitate this complex stage, but they also depend on these tables.
Studies show differences between the food composition data calculated using different computer programs, indicating the existence of an additional difficulty in comparing studies. For the not available food, one option is to use nutritional information from food labels. However, this strategy also has important limitations, since the information may not be reliable. The problems caused by the use of data labels can be higher, especially if the goal of the study is to identify micronutrient intake26. At the face of this problem, one possibility would be to use similar food available in the tables, but it also does not ensure the validity of the estimation process of food consumption.
In the present study, from the 393 identified food, 79 of them (20.1%) had their nutritional information taken from food labels, whereas 15 of them were not selected for the QFFQ list. The remaining 64 food items are included in 33 (35.9%) food items out of the 92 consisting the list. Among the food, some specific types of treats or goodies stand out (candy, chewing gum, lollipops,
Hinnig, P.F. et al.
492Rev BRas epidemiol apR-jun 2014; 479-494
cakes, cookies, chocolates, ice cream and sweets); breakfast cereal; cream cheese; sauces and pâté cream; special flours; nuggets, hamburgers; yogurts; some kinds of milk; bread; pizza; canned food; yellow cheeses; sandwiches; processed, concentrated or powdered juice; pasta/masses.
Thus, by the use of labels, it is possible that the true percentage contribution of a particular item regarding its energy and macronutrients was has not been identified. However, the strategy of Block et al.16 identifies 95% of the representative items and, this way, such estimation error may not have an important impact. More specific studies involving centesimal analysis may be used to verify the validity of the nutritional information obtained by the methods currently available.
It is stressed that the proposed QFFQ allows estimating the consumption of energy and macronutrients, being limited to the assessment of vitamins and minerals. The proposed list includes a number of food that it is not too high, so that the data collection instrument is viable, nor that it is excessively low as to hinder the estimation of the dietary intake by excessive clustering of the items1.
It is noteworthy that this QFFQ should be administered by interview, considering that the child may, as experienced in the research, answer it without the help of parents or guardians. The involvement of the children was surprising, who faced the completion of the FD as a school activity, even though it is a laborious method.
The information presented here are based on a sample of children from 7 to 10 years of age of a public school in the city of São Paulo that, for being an Application School, differs from the others, at least in the composition of its students, consisting of three segments: sons of servers, children of professors at USP and from the community outside the University. This feature assures heterogeneity to the sample. According to Willett1, as the change in food consumption may be related to cultural, gender and age factors, as well as socioeconomic differences, the relative importance of food may vary in different populations or cultures.
Once the data collection occurred during fall and winter, it is possible that food more often consumed in other seasons have not been mentioned due to seasonality1. Changes in the preparations can also occur; thus there is a blank space at the end of the instrument, to include food, which imparts flexibility to QFFQ.
It is understood that a version of the QFFQ built from the presented list will need to be tested as for its reliability, validity and scope, understood as the ability of the instrument to capture the usual diet of children from 7 to 10 years of age. After its construction, a QFFQ needs to be revised periodically, as food items previously not included may become important in the percentage contribution of the nutrient of interest at another time and, in this case, be included in the questionnaire.
FInal consIderatIons
A list of food items that contributed most to the total energy and macronutrients consumption by children from 7 to 10 years of age is presented, serving as basis for the building of a QFFQ to estimate the usual intake of energy, carbohydrates, proteins and lipids
Food Frequency questionnaire For children
493Rev BRas epidemiol apR-jun 2014; 479-494
in the previous three months. The QFFQ was built from the application of a FD, during three days, filled out by previously trained children and following the method of Block et al.16.
To analyze the performance of this QFFQ, the averiguation of reliability and validity, which comprise the psychometric study of the instrument, is required.
acknowledgeMents
We acknowledge the Ministry of Health and the National Council for Scientific and Technological Development (CNPq) for financial support. We thank the parents and students who participated in this research, as well as teachers and the Principal of the School in 2008, Professor Vanderlei Pinheiro Bishop, and to the Pedagogical and Educational Counselor of the Elementary I course in 2008, Professor Luciana Sedano de Souza. We also thank the nutritionist Thaysa Laudari Giovannetti, for her assistance in data collection, and Giovanny Vinicius Araujo de France, for reviewing the grouping of food items.
reFerences
1. Willett WC. Nutritional Epidemiology. New York: Oxford University Press; 1998.
2. Colucci ACA, Philippi ST, Slater B. Desenvolvimento de um questionário de freqüência alimentar para avaliação do consumo alimentar de crianças de 2 a 5 anos de idade. Rev Bras Epidemiol 2004; 7(4): 393-401.
3. Araújo MC, Ferreira DM, Pereira RA. Reprodutibilidade de questionário semiquantitativo de freqüência alimentar elaborado para adolescentes da Região Metropolitana do Rio de Janeiro, Brasil. Cad Saúde Pública 2008; 24(12): 2775-86.
4. Henn RL, Fuchs SC, Moreira LB, Fuchs FD. Development and validation of a food frequency questionnaire (FFQ – Porto Alegre) for adolescent, adult and elderly populations from Southern Brazil. Cad Saúde Pública 2010; 26(11): 2068-79.
5. Slater B, Philippi ST, Fisberg RM, Latorre MRDO. Validation of a semi-quantitative adolescent food frequency questionnaire applied at a public school in São Paulo, Brazil. Eur J Clin Nutr 2003; 57(5): 629-35.
6. Fumagalli F, Monteiro JP, Sartorelli DS, Vieira MNCM, Bianchi MLP. Validation of a food frequency questionnaire for assessing dietary nutrients in Brazilian children 5 to 10 years of age. Nutrition 2008; 24(5): 427-32.
7. Hinnig PF, Mariath AB, Freaza SRM, Consolmagno DC, Giovannetti TL, Assunção NA, et al. Preenchimento de Registro Alimentar por escolares de 7 a 10 anos. Nutrire 2010; 35(1): 47-57.
8. Livingstone MBE, Robson PJ. Measurement of dietary intake in children. Proc Nutr Soc 2000; 59(2): 279-93.
9. Consolmagno DC, Assunção NA, Giovannetti TL, Zeraib DP, Hinnig PF, Freaza SRM, et al. Treinamento de escolares de 7 a 10 anos para o preenchimento de um Diário Alimentar. Rev Bras Epidemiol 2009; 12(3): 404-12.
10. Programa de Apoio à Nutrição – NutWin (software), versão 2.5. São Paulo: Departamento de Informática em Saúde da Universidade Federal de São Paulo; 2005.
11. Instituto Brasileiro de Geografia e Estatística. Estudo nacional da despesa familiar: tabela de composição de alimentos. 5ª ed. Rio de Janeiro: IBGE; 1999.
12. Philippi ST. Tabela de composição de alimentos: suporte para decisão nutricional. 2ª ed. São Paulo: Coronário; 2002.
13. Pinheiro ABV, Lacerda EMA, Benzecry EH, Gomes MCS, Costa VM. Tabela para avaliação de Consumo Alimentar em medidas caseiras. 3ª ed. Rio de Janeiro; 1996.
14. Tabela brasileira de composição de alimentos – TACO/NEPA-UNICAMP. Versão II. 2ª ed. Campinas: NEPA-UNICAMP; 2006.
Hinnig, P.F. et al.
494Rev BRas epidemiol apR-jun 2014; 479-494
15. StataCorp. Stata Statistical Software: Release 9.0. Texas: Stata Corporation LP; 2005.
16. Block G, Dresser Cm, Hartman Am, Carroll Md. Nutrient sources in the American diet: quantitative data from the NHANES II survey. I. Vitamins and minerals. Am J Epidemiol 1985; 122(1): 13-26.
17. Bispo VP. Aspectos da heterogeneidade e as expectativas das famílias na Escola de Aplicação da Faculdade de Educação da Universidade de São Paulo [dissertação de mestrado]. São Paulo: Faculdade de Educação da USP; 2005.
18. Hammond J, Nelson M, Chinn S, Rona RJ. Validation of a food frequency questionnaire for assessing dietary intake in a study of coronary heart disease risk factors in children. Eur J Clin Nutr 1993; 47(4): 242-50.
19. Roumelioti M, Leotsinidis M. Relative validity of a semiquantitative food frequency questionnaire designed for schoolchildren in western Greece. Nutr J 2009; 8(8): 1-5.
20. Watson JF, Collins CE, Sibbritt DW, Dibley MJ, Garg ML. Reproducibility and comparative validity of a food frequency questionnaire for Australian children and adolescents. Int J Behav Nutr Phys Act 2009; 6: 62.
21. Bertoli S, Petroni ML, Pagliato E, Mora S, Weber G, Chiumello G, et al. Validation of Food Frequency Questionnaire for assessing dietary macronutrients and calcium intake in italian children and adolescents. J Pediatr Gastroenterol Nutr 2005; 40(5): 555-60.
22. Cullen KW, Watson K, Zakeri I. Relative Reliability and Validity of the Block Kids Questionnaire among Youth Aged 10 to 17 Years. J Am Diet Assoc 2008; 108(5): 862-66.
23. Zemel BS, Carey LB, Paulhamus DR, Stallings VA, Ittenbach RF. Quantifying calcium intake in school age children: development and validation on the Calcium Counts! Food Frequency Questionnaire. Am J Hum Biol 2010; 22(2): 180-6.
24.Weber JL, Cunningham-Sabo L, Skipper B, Lytle L, Stevens J, Gittelsohn J, et al. Portion-size estimation training in second-and third-grade American Indian children. Am J Clin Nutr 1999; 69(4 Suppl): 782S-787S.
25. Kobayashi T, Tanaka S, Toji C, Shinohara H, Kamimura M, Okamoto N, et al. Development of a food frequency questionnaire to estimate habitual dietary intake in Japanese children. Nutr J 2010; 9: 17.
26. Anjos LA, Souza DR, Rossato SL. Desafios na medição quantitativa da ingestão alimentar em estudos populacionais. Rev Nutr 2009; 22(1): 151-61.
Receivedon:09/20/2011 Finalversionpresentedon:05/23/2012 Acceptedon:07/10/2012