origin of water that discharges from calf creek spring ... · pdf filefrom calf creek spring,...
TRANSCRIPT

Origin of water that discharges from Calf Creek Spring, Garfield County, UtahU.S. CEOLOCICAL SURVEY Open-File Report 95-340

ORIGIN OF WATER THAT DISCHARGES FROM CALF CREEK SPRING, GARFIELD COUNTY, UTAH
By Dale E. Wilberg
U.S. GEOLOGICAL SURVEY ____________
Open-File Report 95-340
Prepared in cooperation with the BUREAU OF LAND MANAGEMENT
Salt Lake City, Utah 1995
U.S. DEPARTMENT OF THE INTERIOR
BRUCE BABBITT, Secretary
U.S. GEOLOGICAL SURVEY
Gordon P. Eaton, Director
The use of trade, product, industry, or firm names is for descriptive purposes only and does not imply endorsement by the U.S. Government.
For additional information write to: Copies of this report can be purchased from:
District Chief U.S. Geological Survey U.S. Geological Survey Earth Science Information Center Room 1016 Administration Building Open-File Reports Section 1745 West 1700 South Box 25286, MS 517 Salt Lake City, Utah 84104 Denver Federal Center
Denver, Colorado 80225

CONTENTS
Abstract............................................................................................................^ 1
Introduction.................................................................................................................................... 1
Purpose and scope............................................................................".................................................... 1
Study methods ....................................................................................................................................... 3
Evidence for origin of water that discharges from Calf Creek Spring............................................................. 3
Biological properties of the water.......................................................................................................... 4
Chemical properties of the water........................................................................................................... 6
Physical properties of the water............................................................................................................. 6
Surface-water hydrology........................................................................................................................ 7
Ground-water hydrology........................................................................................................................ 7
Susceptibility of spring collection box to surface-water contamination.......................................................... 8
Possibilities for future studies.......................................................................................................................... 9
Summary.......................................................................................................................................................... 9
References cited............................................................................................................................................... 10
FIGURE
1. Location of Calf Creek study area, Utah............................................................................................ 2
TABLES
1. Results of Microscopic Particulate Analysis (MPA) of water collected June 1,1994, from the
point of discharge of Calf Creek Spring, Utah................................................................................... 4
2. Sample volumes and bacteria colony counts for water samples collected June 1, 1994, at four
selected sites in Calf Creek Spring and Calf Creek, Utah................................................................. 5
3. Results of laboratory chemical analyses of water from Calf Creek Spring and Calf Creek, Utah.... 6
4. Selected on-site physical and chemical properties of water from Calf Creek Spring and Calf
Creek, Utah........................................................................................................................................ 8
Hi

CONVERSION FACTORS AND ABBREVIATED WATER-QUALITY UNITS
Multiply
inch
foot
gallon per minute
mile
square mile
By
25.4
0.3048
0.063
1.609
2.590
To obtain
millimeter
meter
liter per second
kilometer
square kilometer
Degree Celsius (°C) may be converted to degree Fahrenheit (°F) by using the following equation:
°F = 9/5(°C) + 32.
Chemical concentration and water temperature are reported in metric units. Chemical concentration is reported
in milligrams per liter (mg/L). Milligrams per liter is a unit expressing the solute mass per unit volume (liter) of
water. For concentrations less than 7,000 milligrams per liter, the numerical value is about the same as for
concentrations in parts per million. Specific conductance is reported in microsiemens per centimeter at 25 degrees
Celsius (|XS/cm).
IV

ORIGIN OF WATER THAT DISCHARGES FROM CALF CREEK SPRING, GARFIELD COUNTY, UTAH
By Dale E. Wilberg
ABSTRACT
Calf Creek Spring provides drinking water to users of Calf Creek Campground, which is oper ated by the Bureau of Land Management in south- central Utah. Use of all methods and tools avail able indicates that surface water from Calf Creek does not contribute to the discharge of Calf Creek Spring.
Microscopic Paniculate Analysis of spring water indicates that the spring has a low risk of sur face-water contamination, which is substantiated by a bacterial test of water from the point of dis charge of Calf Creek Spring, the Calf Creek Spring collection box, a tap from the water distribution system, and Calf Creek near the picnic area. Bac teria colonies were found in Calf Creek near the picnic area.
Calf Creek Spring discharges from frac tured Navajo Sandstone where the potential for contamination by animal or human microbes is slight. Calf Creek probably gains water along its entire length from the aquifer in the Navajo Sand stone. Once at the surface, water in Calf Creek is exposed to animal- and human-borne microbes. If the water level in the Navajo aquifer at the spring remains higher than the water level of the creek, mixing is unlikely to occur and contamination is unlikely. The water level of Calf Creek Spring in June 1994 was at least 4 feet above the water level of Calf Creek.
Water from Calf Creek Spring is a mixed type composed of magnesium, calcium, sodium, bicarbonate, and sulfate ions, and water from Calf Creek is a mixed type composed of calcium, mag nesium, bicarbonate, sulfate, and chloride ions. Compositional similarity is not unusual if both water sources are derived from the Navajo aquifer.
Discharge and temperature measurements at the spring and in the creek in May and June 1994 vary independently and do not indicate a hydraulic connection. Turbidity measurements, though not conclusive, indicate that no direct hydraulic con
nection exists between Calf Creek and Calf Creek Spring.
Hydrologic characteristics of Calf Creek provide evidence that the probable long-term, sus- tainable source of water is the Navajo aquifer and not precipitation-derived runoff. Ground-water leakage from adjacent drainages could contribute to perennial flow in Calf Creek. Fractures modify the movement of ground water to discharge areas, such as Calf Creek Spring.
INTRODUCTION
Calf Creek is a perennial stream in Garfield County in south-central Utah that flows into the Escal- ante River where State Highway 12 crosses the river (fig. 1). Calf Creek Campground, between the towns of Boulder and Escalante, was developed and is main tained by the Bureau of Land Management (BLM) to accommodate visitors to the area. Drinking water for the campground users is obtained from Calf Creek Spring. Calf Creek Spring discharges from the east side of Calf Creek Canyon near the contact of the Navajo Sandstone with the underlying Kayenta Formation, indicating a ground-water source, but some of the spring water could originate from Calf Creek. Because State of Utah regulations require treatment of surface water before use as a public drinking-water supply, the BLM needs to know if water from Calf Creek Spring contains surface water from Calf Creek. To address this concern, the U.S. Geological Survey (USGS), in coop eration with the BLM, studied the hydrology of the Calf Creek area to determine the origin of water that dis charges from Calf Creek Spring.
Purpose and Scope
This report describes the results of a study to determine the origin of water that discharges from Calf Creek Spring. Biological, chemical, and physical prop erties of water from Calf Creek Spring and Calf Creek were determined from samples collected for laboratory analysis and on-site measurements. Hydrologic char-

UTAH
38°00'
37°45'
Calf Creek area111°22'30"
Calf Creek Campground area
10 MILESJ~
15 KILOMETERS
EXPLANATIONSample site Number indicates:
Bacterial sample sites:1 Point of discharge of
Calf Creek Spring2 Calf Creek Spring collection
box3 Tap from water distribution
system4 Calf Creek near
picnic areaWater-chemistry sample sites:
1 Point of discharge ofCalf Creek Spring
5 Calf Creek justupstream from CalfCreek Springoverflow pipe
Calf Creek Canyon
100 200 300 METERS
Figure 1. Location of Calf Creek study area, Utah.

acteristics of Calf Creek and the aquifer in the Navajo Sandstone (referred to as the Navajo aquifer) were obtained from published reports. Evaluation of geohy- drologic setting and orientation of fractures in the vicinity of the spring was done on-site and from aerial photographs. The susceptibility of the collection box to inundation by floodwater or other geologic hazards that could allow entry of surface-water-borne microbes was cursorily assessed.
Study Methods
To determine if water from Calf Creek Spring contains surface water from Calf Creek, information about the biological, chemical, and physical properties of water from the spring and the creek was collected and evaluated. A laboratory Microscopic Paniculate Analysis (MPA) was used to determine if surface-water indicator organisms were present on a filter that was immersed in a continuous stream of pumped spring water for a recommended period of time (8 hours) and volume of water (500 gallons)(David Barrett, Utah Department of Health, written commun., 1994). Asep tic polyethylene tubing was positioned at the bottom of the collection box at one of several spring discharge points in the fractured bedrock. An attached pump was used to draw water to the surface and through the sam pling apparatus and filter.
The MPA is a consensus method that quantita tively equates the occurrence of surface-water indicator organisms with a weighted relative risk factor that scores some organisms, such as Giardia and coccidia, much higher than others (Russ Topham, Utah Depart ment of Environmental Quality, written commun., 1994). For example, the presence of only one Giardia or one coccidia paniculate in a sample automatically scores a relative risk factor of 20 and constitutes a high risk that the sample contains contaminated surface water. By contrast, the presence of as many as 10 dia toms scores a relative risk factor of 6 and constitutes a low risk of surface-water contamination. Summation of the relative risk-factor scores for each of seven cate gories of paniculate-indicator organisms provides a risk assessment that the water tested contains contami nated surface water. A low risk is assessed if the score is 9 or less, moderate if between 10 and 19, or high if 20 or greater. In decreasing order of relative risk factor, the indicator organisms are Giardia, coccidia, diatoms, other algae, insects and insect larvae, rotifers, and plant debris.
Water samples for on-site bacterial tests were collected at four sites. The sites are (1) point of dis charge of Calf Creek Spring, (2) Calf Creek Spring col lection box, (3) tap from water distribution system, and (4) Calf Creek near picnic area (fig. 1). Bacteria sam ples were processed and incubated on June 1,1994, and counted either 24 or 48 hours later using standard USGS procedures (Britton and Greeson, 1989, p. 1-50).
Water samples for laboratory determination of major anions and cations and for on-site determination of chemical properties were collected from Calf Creek Spring (fig. 1, site 1) and Calf Creek just upstream of the spring overflow discharge pipe (fig. 1, site 5). Water samples were collected on June 1,1994, and approved USGS techniques were used (Brown and others, 1970).
Physical and chemical properties of water were measured during on-site visits in May and June 1994 to determine if a hydraulic connection exists between the creek and the spring. Approved USGS techniques were used to measure the on-site physical (Rantz and others, 1982) and chemical (Sylvester and others, 1990) prop erties.
Hydrologic characteristics of Calf Creek were compared with estimates of streamflow characteristics of natural flow for streams in the Colorado River Basin in Utah (Christensen and others, 1986; Christensen and others, 1987) and with estimates of peak discharge and flood boundaries of streams in Utah (Thomas and Lind- skov, 1983). Hydrogeologic characteristics of the Navajo aquifer were obtained from maps (Freethey and others, 1988), reports (Blanchard, 1986), aerial photo graphs, and on-site observations.
EVIDENCE FOR ORIGIN OF WATER THAT DISCHARGES FROM CALF CREEK SPRING
An absolute determination is not possible, but use of all methods and tools available indicates that sur face water from Calf Creek does not contribute to the discharge of Calf Creek Spring. Some of the tech niques used to determine if Calf Creek Spring is influ enced by Calf Creek include testing of the water for indicator microbes and bacteria, chemical analyses of water, comparison of physical properties measured on- site, hydrologic characterization of surface- and ground-water resources, and susceptibility of the spring collection box to microbial contamination by surface water.

Table 1. Results of Microscopic Particulate Analysis (MPA) of water collected June 1,1994, from the point of discharge of Calf Creek Spring, Utah
[<, less than; =, equals; NS, not a significant indicator of surface water, which equates to a score of 0 on the Relative Risk Factor; R, rare indicator of surface water, which equates to a score of 3 on the Relative Risk Factor for insect and larvae and a score of 0 on the Relative Risk Factor for plant debris. Risk of surface-water contamination determined by summation of all relative risk-factor scores. The total relative risk factor score of 3 constitutes a low risk of surface-water contamination. Categories of surface-water contamination risk are: Low, if total score is 9 or less; Moderate, if total score is between 10 and 19; and High, if total score is 20 or greater]
Primarysurface-water
particulateindicators
GiardiaCoccidiaDiatomsOther algaeInsect/larvaeRotifersPlant debris
Slide 1
0000101
Slide 2
0000002
Slide 3
0000006
Indicators per100 gallons
of water
<1=NS<1=NS<1=NS<1 =NS
1=R<1=NS
9 = R
RelativeRisk Factor
score
NS = 0NS = 0NS=0NS = 0
R = 3NS = 0
R = 0
TOTAL = 3
Biological Properties of the Water
Evaluation of the biological data from the inde pendent MPA and bacterial tests indicates that the spring water probably is not contaminated by surface water from Calf Creek. Classification and quantifica tion of the MPA by the Utah State Health Laboratory indicates that Calf Creek Spring is considered a low risk for surface-water contamination (David Barrett, Utah Department of Health, written commun., 1994)(table 1). Although analysis of the water found no indicators of Giardia or coccidia, it does not imply that the water is free of Giardia or coccidia, but rather that none were found in the sample.
The sampling of Calf Creek Spring continued for more than 11 hours (beginning at 11 a.m. on June 1, 1994, and ending sometime between 10 p.m. and 2 a.m. on June 2, 1994), but lower-than-expected discharge rates and diminishing battery capacity combined to limit the total volume of water that passed through the MPA filter to about 187 gallons. Though less than the recommended volume of water, the volume was ade quate to quantify the indicator organisms (David Bar rett, Utah Department of Health, oral commun., 1994).
The assessment of a low risk of surface-water contamination is substantiated by on-site bacterial tests for fecal coliform (FC) and fecal streptococci (FS) at
four sites. The four sites where water samples were collected for bacterial tests are (1) point of discharge of Calf Creek Spring, (2) Calf Creek Spring collection box, (3) tap from water distribution system, and (4) Calf Creek near picnic area. A summary of the bacte rial data is presented in table 2. Of the four sites, only Calf Creek near picnic area (site 4) had statistically valid counts of bacteria colonies. The other three sites had less than 1 FC or FS bacteria colony per 100 milli- liters of sample, which is the reporting convention used by the USGS to represent the maximum estimated number of colonies. A preliminary assessment of the FC/FS ratio of the Calf Creek bacterial counts indicates that the bacteria found in Calf Creek near picnic area (site 4) are derived from the intestines of warm-blooded animals, but collection of more data at numerous sites and times would be required for confirmation.
Calf Creek Spring discharges at a discrete loca tion in the fractured Navajo Sandstone where the poten tial for contamination by animal- and human-borne microbes is slight. Calf Creek probably gains water along its entire length from the Navajo aquifer. Once at the surface, the water in Calf Creek is exposed to ani mal- and human-borne microbes. As long as the water level in the Navajo aquifer at the spring is higher than the water level of the creek, mixing of surface water from Calf Creek with ground water from Calf Creek

Table 2. Sample volumes and bacteria colony counts for water samples collected June 1,1994, at four selected sites inCalf Creek Spring and Calf Creek, UtahSample type: blank indicates a quality-control sample to ensure sterile procedures; duplicate indicates a duplicate sample was processed
to ensure uniformity of technique and verification of findings. Sample volume: ml, milliliters.Bacteria colony count: FC, fecal coliform; FS, fecal streptococci; , no analysis; <, less than; e, estimated. Site: Description of location where water sample was collected. See figure 1 for site location.
Sample type
Sample volume
(ml)
Bacteria colony count
(FC) (FS)
Sample Sample type volume
(ml)
Bacteria colony count
(FC) (FS)
Site 1 (Point of discharge of Calf Creek Spring)
blank
Site 4 (Calf Creek near picnic area)
duplicate
duplicate
duplicate blank
255
25255050100100250
Total colonies per 100 ml
Sample type
Samplevolume
(ml)
Bacteria colony count
(FC) (FS)
Site 2 (Calf Creek Spring collection box)
duplicate blank
52550
100100250
Total colonies per 100 ml
000
2 1
00
2 le
Sample type
Samplevolume
(ml)
Bacteria colony count
(FC) (FS)
Site 3 (Tap from water distribution system)
blank
duplicate
duplicate blank
25255050
100100200
blank
duplicate
duplicate
duplicate
duplicate
blank
251155
25255050
100200
27
0
Total colonies per 100 ml
030
325
374
168 156 290 e
3330
For filters with no characteristic colonies. To calculate colo
nies per 100 ml, assume a colony count of one on the filter with the
largest sample volume, multiply by 100, and divide by sample volume.
Result is reported as less than the number calculated per 100 ml, which
is the maximum estimated number.
For filters with non-ideal number of bacteria colony counts. To
calculate colonies per 100 ml, add non-zero colonies, multiply by 100,
and divide by the total sample volume of non-zero colonies. Result is
reported as an estimated count based on non-ideal colony count.
For 2 or more filters with ideal number of bacteria colony
counts, which are 20 to 60 colonies per filter for FC and 20 to 100 col
onies per filter for FS. To calculate colonies per 100 ml, add the ideal
colonies, multiply by 100, and divide by total sample volume of ideal
colonies.
Total colonies per 100 ml

Spring is unlikely to occur and contamination of the spring is unlikely.
Chemical Properties of the Water
Chemical properties of water from Calf Creek Spring and Calf Creek show that the waters from both sources are composed of a similar mixture of ions and probably have a related source. Water from Calf Creek Spring is a mixed type composed of magnesium, cal cium, sodium, bicarbonate, and sulfate ions, and water from Calf Creek is a mixed type composed of calcium, magnesium, bicarbonate, sulfate, and chloride ions (Hem, 1985, p. 166). Concentrations of most major cations, major anions, and dissolved solids are gener ally similar for both the spring and creek water (table 3). Specific conductance of water from the spring and creek are nearly the same. This similarity indicates that both waters could be derived from a similar source, such as the Navajo aquifer. An explanation of the vari ation in the ion concentrations, most notably calcium and chloride, between the Calf Creek Spring and Calf Creek analyses is indeterminable with the available data.
Physical Properties of the Water
Physical properties indicate that water from Calf Creek Spring probably is not influenced by surface water from Calf Creek. Turbidity trends are not conclu sive but do not indicate a direct hydraulic connection. Selected on-site physical and chemical properties of
water from Calf Creek Spring and Calf Creek are pre sented in table 4.
Discharge of Calf Creek Spring, measured volu- metrically at the overflow pipe, varied insignificantly from 65 gallons per minute on May 18,1994, to 64 gal lons per minute on June 1,1994 (table 4). By contrast, discharge of Calf Creek measured on the same dates decreased about 14 percent, from 2,700 to 2,360 gal lons per minute (table 4). If the water that discharges from Calf Creek Spring were partly or entirely sup plied by seepage from Calf Creek, then a decrease in discharge of the creek would be expected to produce a similar decrease in discharge of the spring. Discharge of the spring remained nearly constant and discharge of the creek decreased during the same time period, indi cating that there is no hydraulic connection between Calf Creek and Calf Creek Spring.
Temperature difference between the spring (14.5°C) and the creek (21.5°C) on June 1,1994, is sig nificant; on May 18 both were the same temperature (14.5°C)(table 4). If surface water from Calf Creek supplies some of the water to Calf Creek Spring, then a similar increase in temperature of the spring would be expected from May to June. The absence of an increase in the temperature of the spring water during the same time period also indicates that there is no hydraulic con nection between Calf Creek and Calf Creek Spring.
Turbidity decreased in Calf Creek Spring and increased slightly in Calf Creek from May to June 1994 (table 4). Turbidity is dependent on the nature of the hydraulic connection. If direct hydraulic connection exists between the creek and the spring, such as occurs with fractured bedrock systems, that allows a direct and nearly instantaneous response to be transmitted from
Table 3. Results of laboratory chemical analyses of water from Calf Creek Spring and Calf Creek, Utah
[mg/L, milligrams per liter; ng/L, micrograms per liter]
Location: Calf Creek Spring: Point of discharge of Calf Creek Spring (site 1); Calf Creek: Calf Creek just upstream from spring Specific conductance: p.S/cm, microsiemens per centimeter at 25 degrees Celsius.
Location Date
Calf Creek Spring June 1 , 1 994
Calf Creek June 1, 1994
Spe
cificconduct
ance(nS/cm)
640
652
PH(stand
ardunits)
7.7
8.2
Hardness,total(mg/L
asCaCO3)
250
280
Calcium,dis
solved(mg/LasCa)
38
64
Magnesium,dis
solved(mg/LasMg)
38
28
Sodium,dis
solved(mg/LasNa)
31
28
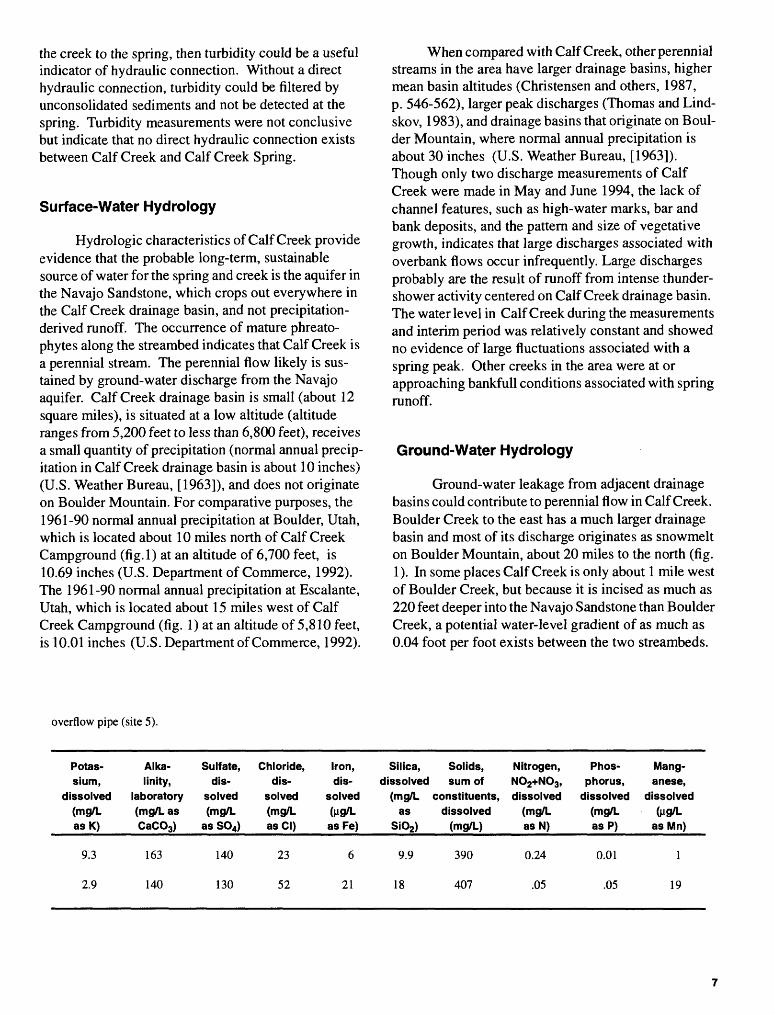
the creek to the spring, then turbidity could be a useful indicator of hydraulic connection. Without a direct hydraulic connection, turbidity could be filtered by unconsolidated sediments and not be detected at the spring. Turbidity measurements were not conclusive but indicate that no direct hydraulic connection exists between Calf Creek and Calf Creek Spring.
Surf ace-Water Hydrology
Hydrologic characteristics of Calf Creek provide evidence that the probable long-term, sustainable source of water for the spring and creek is the aquifer in the Navajo Sandstone, which crops out everywhere in the Calf Creek drainage basin, and not precipitation- derived runoff. The occurrence of mature phreato- phytes along the streambed indicates that Calf Creek is a perennial stream. The perennial flow likely is sus tained by ground-water discharge from the Navajo aquifer. Calf Creek drainage basin is small (about 12 square miles), is situated at a low altitude (altitude ranges from 5,200 feet to less than 6,800 feet), receives a small quantity of precipitation (normal annual precip itation in Calf Creek drainage basin is about 10 inches) (U.S. Weather Bureau, [1963]), and does not originate on Boulder Mountain. For comparative purposes, the 1961-90 normal annual precipitation at Boulder, Utah, which is located about 10 miles north of Calf Creek Campground (fig.l) at an altitude of 6,700 feet, is 10.69 inches (U.S. Department of Commerce, 1992). The 1961-90 normal annual precipitation at Escalante, Utah, which is located about 15 miles west of Calf Creek Campground (fig. 1) at an altitude of 5,810 feet, is 10.01 inches (U.S. Department of Commerce, 1992).
When compared with Calf Creek, other perennial streams in the area have larger drainage basins, higher mean basin altitudes (Christensen and others, 1987, p. 546-562), larger peak discharges (Thomas and Lind- skov, 1983), and drainage basins that originate on Boul der Mountain, where normal annual precipitation is about 30 inches (U.S. Weather Bureau, [1963]). Though only two discharge measurements of Calf Creek were made in May and June 1994, the lack of channel features, such as high-water marks, bar and bank deposits, and the pattern and size of vegetative growth, indicates that large discharges associated with overbank flows occur infrequently. Large discharges probably are the result of runoff from intense thunder- shower activity centered on Calf Creek drainage basin. The water level in Calf Creek during the measurements and interim period was relatively constant and showed no evidence of large fluctuations associated with a spring peak. Other creeks in the area were at or approaching bankfull conditions associated with spring runoff.
Ground-Water Hydrology
Ground-water leakage from adjacent drainage basins could contribute to perennial flow in Calf Creek. Boulder Creek to the east has a much larger drainage basin and most of its discharge originates as snowmelt on Boulder Mountain, about 20 miles to the north (fig. 1). In some places Calf Creek is only about 1 mile west of Boulder Creek, but because it is incised as much as 220 feet deeper into the Navajo Sandstone than Boulder Creek, a potential water-level gradient of as much as 0.04 foot per foot exists between the two streambeds.
overflow pipe (site 5).
Potassium,
dissolved(mg/LasK)
9.3
2.9
Alkalinity,
laboratory(mg/L asCaCO3)
163
140
Sulfate,dis
solved(mg/L
as SO4)
140
130
Chloride,dis
solved(mg/LasCI)
23
52
Iron,dis
solved(Hg/LasFe)
6
21
Silica,dissolved
(mg/Las
Si02)
9.9
18
Solids,sum of
constituents,dissolved
(mg/L)
390
407
Nitrogen,NO2+NO3,dissolved
(mg/LasN)
0.24
.05
Phosphorus,
dissolved(mg/LasP)
0.01
.05
Manganese,
dissolved(R9/1-
asMn)
1
19

Table 4. Selected on-site physical and chemical properties of water from Calf Creek Spring and Calf Creek, Utah[ , no data]Location: Calf Creek Spring: Discharge measured at end of spring overflow pipe, which is about 75 feet west of site 2; all other prop
erties determined from water collected from Calf Creek Spring collection box (site 2). Calf Creek: Discharge measurement in May was made about 500 feet downstream of site 4; all other properties were determined from water collected from Calf Creek just upstream from spring overflow pipe (site 5).
Discharge: gal/min, gallons per minute.Temperature: °C, degrees Celsius.Turbidity: NTU, Nephelometric Turbidity Units, measures the amount of light scatter through a water sample, low values indicate water
is relatively free of debris and suspended material.Specific conductance: (iS/cm, microsiemens per centimeter at 25 degrees Celsius, measures the ability of an aqueous solution to carry
an electric current.pH: in standard units, negative logarithm of hydrogen-ion activity, used as a relative indicator of acids, if less than 7, or bases, if greater
than 7.Alkalinity: mg/L, milligrams per liter. Titrated alkalinity is reported as the equivalent amount of CaCC>3 and indicates the capacity of
water to neutralize a strong acid. For example, as alkalinity values increase so does the water's capacity to neutralize a strong acid.
Location
Calf Creek Spring
Calf Creek
Date
May June
May June
18, 1994 1, 1994
18, 1994 1, 1994
Discharge (gal/min)
65 64
2,700 2,360
Temperature
14.5 14.5
14.5 21.5
Turbidity (NTU)
0.24 .14
.95 1.13
Specific conductance
(uS/cm)
650 650
670 660
pH (standard
units)
8.0 8.0
8.2
Alkalinity (mg/L
as CaCO3)
159 161
Ground-water recharge to the Navajo aquifer occurs along the south flank of Boulder Mountain (Blanchard, 1986, p. 27). Ground-water movement fol lows the topography and generally is southward. Open fractures, such as those near Calf Creek Spring, can modify the general regional movement of water in the Navajo aquifer to local discharge areas. Ground-water discharge from the Navajo aquifer varies with precipi tation (annual or longer trends), extent of the recharge area that contributes to the local ground-water flow sys tem, and hydraulic properties of the sandstone. The annual rate of discharge from the Navajo aquifer approximately equals the rate of recharge because the system virtually is in long-term equilibrium (Freethey and others, 1988, sheet 1).
Observation of the subaqueous discharge of spring water from discrete locations in bedrock frac tures contradicts the nonspecific seepage area that would be expected if the source were from surface- water-saturated sediment. Calf Creek Spring is in a 1/4-mile-wide zone of fractures that trends westward, perpendicular to Calf Creek. Movement of water from Calf Creek to Calf Creek Spring along fractures would be unlikely. Altitude of the point of discharge of the spring at the bedrock fractures is about equal to the alti
tude of the water level in Calf Creek; however, the water level of the spring, which was measured using a hand level and a rod on June 2,1994, was sufficient to elevate the water in the spring collection box at least 4 feet above the water level of Calf Creek.
SUSCEPTIBILITY OF SPRING COLLECTION BOX TO SURFACE-WATER CONTAMINATION
Microbial contamination of the spring collection box by surface water could occur during a flood or by backflow through the spring overflow pipe. Flooding in the Calf Creek drainage of sufficient depth to inundate the collection box probably occurs rarely. Backflow through the overflow pipe, however, could happen any time the pipe is submerged and the water level in the spring collection box is below the elevation of the pipe. Though it seems unlikely that any light or external influence could enter the collection box without removal of the lid, three or four aquatic macrophyte plants were collected and later identified as water mil foil or myriophyllum. Their presence indicates that the collection box is not entirely sealed from external influ ence. The plants could be relicts from earlier times when the overflow pipe was submerged under water

due to ponding caused by beaver dams. Constant vigi lance is necessary to ensure that beaver ponds do not submerge the overflow pipe.
POSSIBILITIES FOR FUTURE STUDIES
Additional work, such as studies of discharge losses and gains, and mapping of fracture patterns and orientation along the entire reach of Calf Creek, could determine areas of ground-water recharge or discharge. Determination of the source of the water in the Navajo aquifer, which could be from precipitation on the Navajo Sandstone outcrops, from leakage from Boul der Creek or from other adjacent drainage basins, or from a combination of both, is essential to development of a drinking-water-source protection plan.
SUMMARY
An absolute determination is not possible, but use of all methods and tools available indicates that sur face water from Calf Creek does not contribute to the discharge of Calf Creek Spring.
Biological data indicate that the spring water probably is not contaminated by surface water from Calf Creek. Classification and quantification of the MPA by the Utah State Health Laboratory indicates that Calf Creek Spring is considered a low risk for surface- water contamination. The assessment of a low risk of surface-water contamination is substantiated by the on- site bacterial tests for fecal coliform and fecal strepto cocci at four sites by the USGS. Of the four sites, only Calf Creek near picnic area (site 4) had statistically valid counts of bacteria colonies. As long as the water level in the aquifer in the Navajo Sandstone (referred to as the Navajo aquifer) at the spring is higher than the water in the creek, mixing of surface water from Calf Creek with ground water from Calf Creek Spring is unlikely to occur and contamination of the spring is unlikely.
Chemical properties of water from Calf Creek Spring and Calf Creek show that the waters from both sources are composed of a similar mixture of ions and probably have a related source. Concentrations of most major cations, major anions, and dissolved solids, and specific conductance are similar for both the spring and creek water. The similarity is not unusual if both waters are derived from the Navajo aquifer.
Physical properties indicate that water from Calf Creek Spring probably is not influenced by surface water from Calf Creek. Discharge of the spring remained nearly constant while discharge of the creek
decreased for the same time period. Temperature differ ence between the spring and creek on June 1, 1994, is significant; on May 18 both were the same temperature. The absence of an increase in the temperature of the spring water during the same time period also indicates that there is no hydraulic connection between Calf Creek and Calf Creek Spring. Turbidity in Calf Creek increased slightly and the turbidity of Calf Creek Spring decreased. Turbidity measurements were not conclusive but indicate that no direct hydraulic connec tion exists between Calf Creek and Calf Creek Spring.
Hydrologic characteristics of Calf Creek provide evidence that the probable long-term, sustainable source of water for the spring and creek is the aquifer in the Navajo Sandstone and not precipitation-derived runoff. Perennial flow likely is sustained by ground- water discharge from the Navajo aquifer. Compared with other perennial drainages in the area, Calf Creek drainage basin is smaller, is situated at a lower altitude, receives a smaller quantity of precipitation, and does not originate on Boulder Mountain.
Ground-water leakage from adjacent drainage basins could contribute to perennial flow in Calf Creek. In some places Calf Creek is only about 1 mile west of Boulder Creek, but because it is incised as much as 220 feet deeper into the Navajo Sandstone than Boulder Creek, a potential water-level gradient of as much as 0.04 foot per foot exists between the two streambeds. Ground-water recharge to the Navajo aquifer occurs along the south flank of Boulder Mountain. Ground- water movement follows the topography and generally is southward. Open fractures, such as those that occur near Calf Creek Spring, can modify the general regional movement of ground water in the Navajo aqui fer to local discharge areas. Altitude of the point of dis charge of the spring at the bedrock fractures is about equal to the altitude of the water surface in Calf Creek; however, the water level in the spring collection box on June 2,1994, was sufficient to elevate the water level in the spring collection box at least 4 feet above the water level of Calf Creek.
Microbial contamination of the spring collection box by surface water could occur during a flood or by backflow through the spring overflow pipe. Flooding in the Calf Creek drainage of sufficient depth to inundate the collection box probably occurs rarely. Backflow through the overflow pipe could happen anytime the pipe is submerged and the water level in the spring col lection box is below the elevation of the pipe.

REFERENCES CITED
Blanchard, P.J., 1986, Ground-water conditions in the Kaiparowits Plateau area, Utah and Arizona, with emphasis on the Navajo Sandstone: Utah Depart ment of Natural Resources Technical Publication No. 81, 87 p.
Britton, L.J., and Greeson, P. E., eds., 1989, Methods for collection and analysis of aquatic biological and microbiological samples: U.S. Geological Survey Techniques of Water Resources Investiga tions, book 5, chap. A4, 363 p.
Brown, E., Skougstad, M.W., and Fishman, M.J., 1970, Methods for collection and analysis of water sam ples for dissolved minerals and gases: U.S. Geo logical Survey Techniques of Water Resources Investigations, book 5, chap. Al, 160 p.
Christensen, R.L., Johnson, E.B., and Plantz, G.G.,1986. Manual for estimating selected streamflow characteristics of natural-flow streams in the Colo rado River Basin in Utah: U.S. Geological Water- Resources Investigations Report 85-4297, 39 p.
Christensen, R.L., Johnson, E.B., and Plantz, G.G.,1987. Streamflow characteristics of the Colorado River Basin in Utah through September 1981: U.S. Geological Survey Utah Hydrologic-Data Report No. 42, 674 p.
Freethey, G.W, Kimball, B.A., Wilberg, D.E., and Hood, J.W., 1988, General hydrogeology of the aquifers of Mesozoic age, Upper Colorado River Basin excluding the San Juan Basin Colorado, Utah, Wyoming, and Arizona: U.S. Geological Survey Hydrologic Investigations Atlas HA-698, 2 sheets.
Hem, J.D., 1985, Study and interpretation of the chem ical characteristics of natural water: U.S. Geolog ical Survey Water-Supply Paper 2254, 263 p.
Rantz, S.E., and others, 1982, Measurement and com putation of streamflow: Volume 1, Measurement of stage and discharge; Volume 2, Computation of discharge: U.S. Geological Survey Water-Supply Paper 2175, v. 1, p. 1-284; v. 2, p. 285-631.
Sylvester, M.A., Kister, L.R., and Garrett, W.B., eds., 1990, Guidelines for the collection, treatment, and analysis of water samples: U.S. Geological Survey Western Region Field Manual (for internal use only), 144 p.
Thomas, B.E., and Lindskov, K.E., 1983, Methods for estimating peak discharge and flood boundaries of streams in Utah: U.S. Geological Water- Resources Investigations Report 83-4129, 77 p.
U.S. Department of Commerce, 1992, Monthly nor mals of temperature, precipitation, and heating and cooling degree days, 1961-90, Utah: Climatogra- phy of the United States, no. 81, 31 p.
U.S. Weather Bureau, [1963], Normal annual and May- September precipitation (1931-60) for the State of Utah: Map of Utah, scale 1:500,000.
10