origin of the h1n1 virus
DESCRIPTION
Infectious Disease Epidemiology Section Office of Public Health Louisiana Department of Health and Hospitals www.infectiousdisease.dhh.louisiana.gov. Origin of the H1N1 Virus. Disclosure. - PowerPoint PPT PresentationTRANSCRIPT

Origin of the H1N1 Virus
Infectious Disease Epidemiology SectionOffice of Public Health
Louisiana Department of Health and Hospitalswww.infectiousdisease.dhh.louisiana.gov

Disclosure
I have no financial interests or other relationship with manufacturers of commercial products, suppliers of
commercial services, or commercial supporters. My
presentation will not include any discussion of the unlabeled use of
a product or a product under investigational use.
2

Novel Influenza A Infections
Human infections with influenza A virus subtypes that are different from the currently circulating human subtypes (A/H1 and A/H3)
Human infections with Novel influenza A viruses transmissible from person to person may signal the beginning of an influenza pandemic
Swine influenza virus infection in humans is a novel influenza A virus infection 3

What We Expected…What Happened
4
Reporting Requirements
Goal of novel influenza reporting: to facilitate prompt investigation and accelerate the implementation of effective public health responses
June, 2007 - CSTE added novel influenza A infections to the National Notifiable Diseases Surveillance System (NNDSS)
5
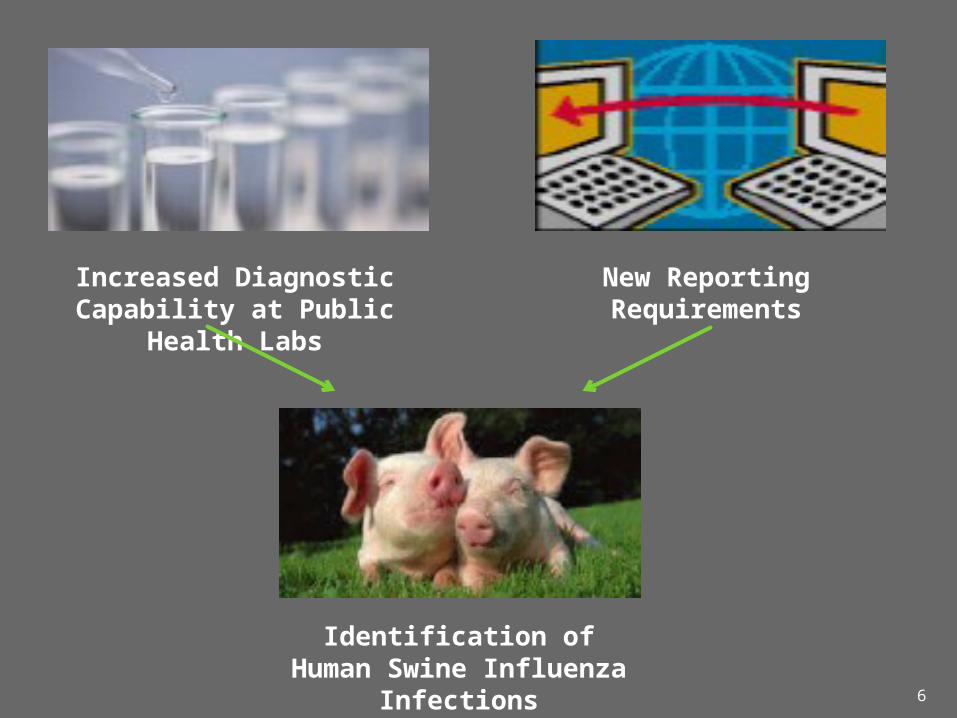
Increased Diagnostic Capability at Public Health Labs
New Reporting Requirements
Identification of Human Swine Influenza Infections
6
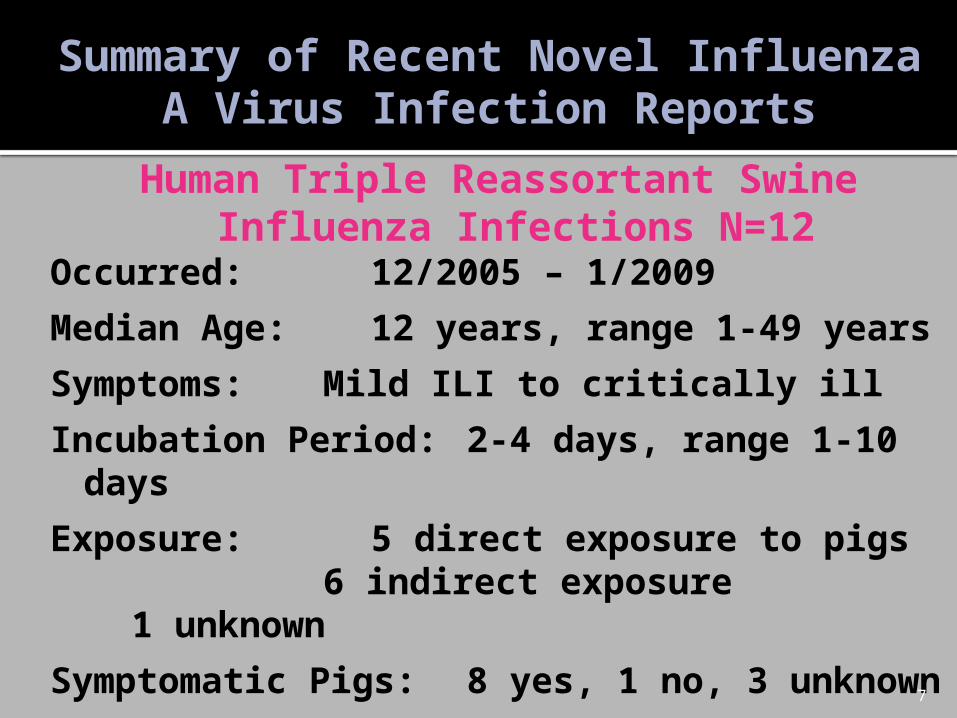
Summary of Recent Novel Influenza A Virus Infection Reports
Human Triple Reassortant Swine Influenza Infections N=12
Occurred: 12/2005 – 1/2009Median Age: 12 years, range 1-49
yearsSymptoms: Mild ILI to critically illIncubation Period: 2-4 days, range 1-10
daysExposure: 5 direct exposure to
pigs 6 indirect exposure 1 unknown
Symptomatic Pigs: 8 yes, 1 no, 3 unknownFully Investigated: 8 cases
7
A Pig (Virus) of a Different Color
8
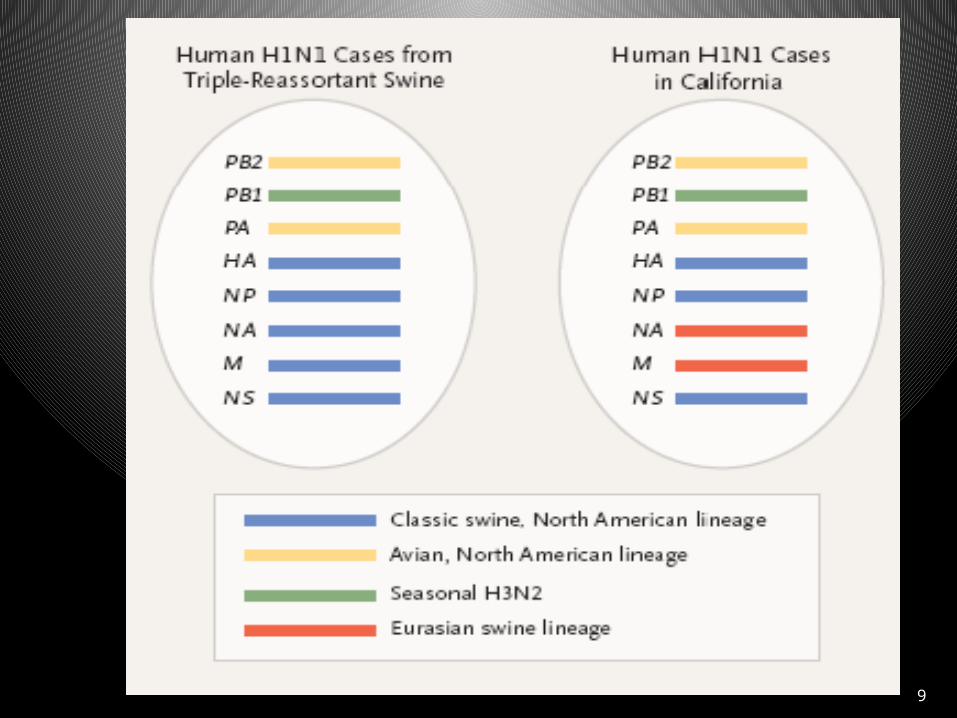
9

Summary of Events Between April 15-17, 2009
2 cases of febrile respiratory illness Residents of adjacent counties in southern
California Swine Influenza A (H1N1) virus
Both viruses are genetically closely related to each other Resistant to amantadine and rimantadine Contain a unique combination of gene
segments previously not recognized among swine or human influenza viruses in the United States
Neither child had contact with pigs10

11
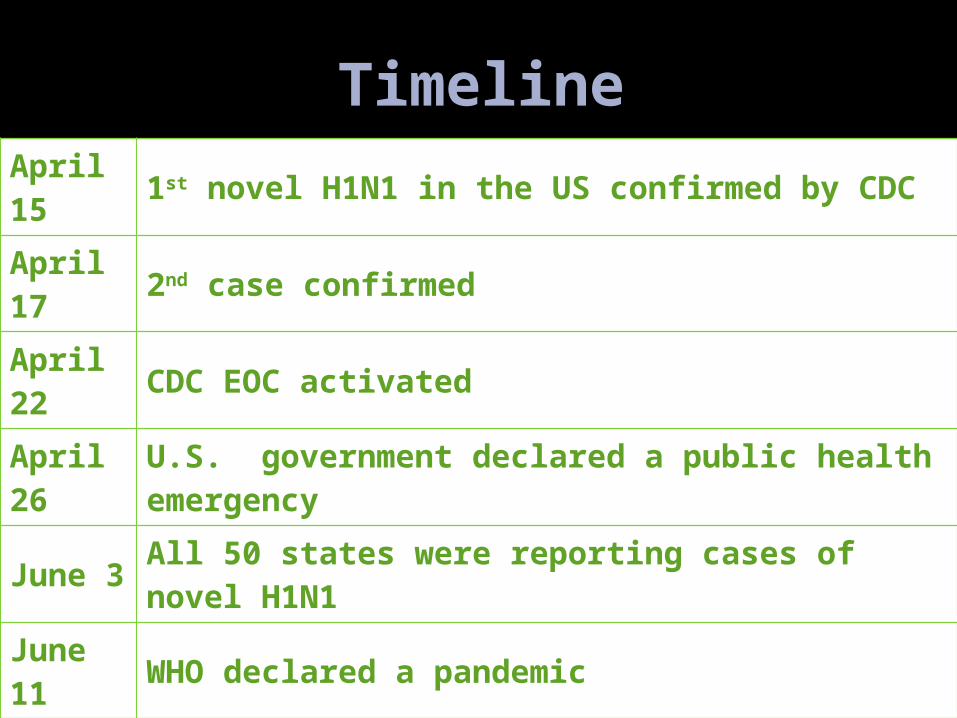
TimelineApril 15 1st novel H1N1 in the US confirmed by CDC
April 17 2nd case confirmed
April 22 CDC EOC activated
April 26
U.S. government declared a public health emergency
June 3 All 50 states were reporting cases of novel H1N1
June 11 WHO declared a pandemic
July 8WHO reports three H1N1 viruses in Denmark, Japan and China are resistant to Tamiflu
Sept 19 19,161 Hospitalizations, 936 Deaths
12
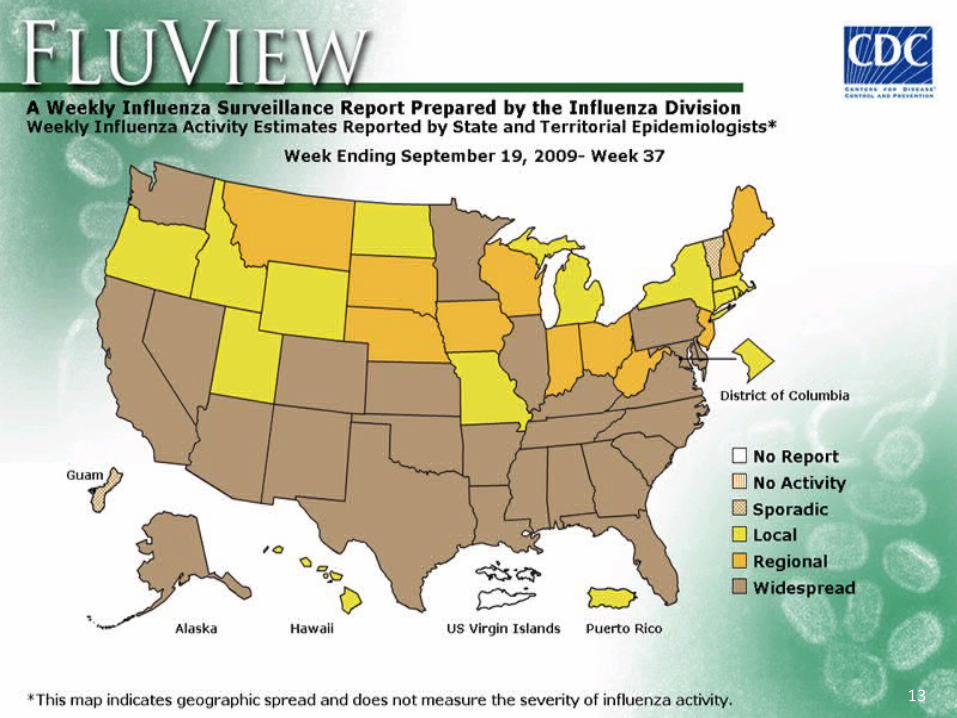
13
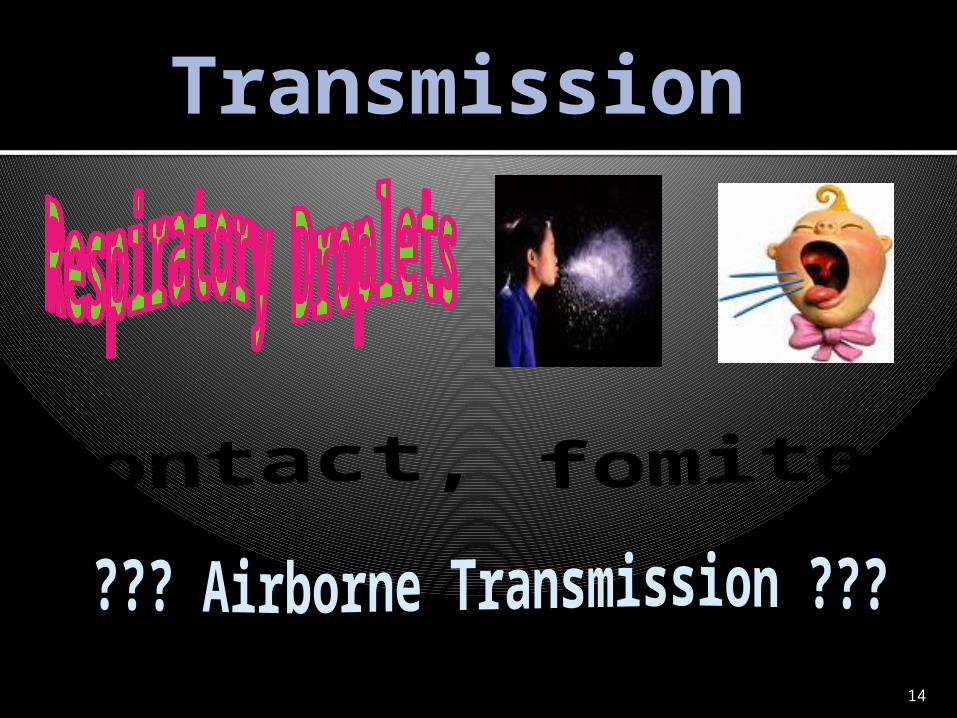
Transmission
14

Transmission Person to person Respiratory droplets
5 virions sufficient to cause infection if aerosol reaches lower respiratory tract
Airborne transmission Acheson 1952: factory outbreak in Arkansas – risk
of transmission not related to proximity Moser 1979: airline outbreak in Alaska – 72% of
passengers that sat in plane 4 hours without ventilation became infected
Animal models Large droplets on oropharynx (500) Contact, fomites
15

Droplet/Airborne Transmission
A droplet of
Will fall in
100 µm 10 seconds
40 µm 1 minute
20 µm 4 minutes
10 µm 20 minutes
5-10 µm 30-45 minutes
Droplets above 10 µm are trapped in the nose and usually do not make it to the bronchi 16

Influenza Transmission
Cough 1 good cough produces 465
DN After 30 minutes 228 DN
(49%)Speech
Count from 1 to 100 1764 DN After 30 minutes 106 DN
(6%)
17

Cough & Artificially Generated Aerosols
Artificial aerosols differ from natural aerosols generated by coughing: Mean artificial aerosols <5-6µ, with
<10% >8µ Natural coughing produces >99.9%
particles >8µTherefore, natural coughing may
produce particles of the correct size to remain suspended in air, but most particles are too large and fall to the ground (Branktson, 2007)
18
NOT Another Mode of Transmission
19

NOT Another Mode of Transmission
20

Transmissibility Period
Incubation
1-5 days
Disease3-8 days
TRANSMISSIBLE Does Shedding =
Infectious???Asymptomatic cases ???
Infectious Period• 1 day before symptom
onset• Peak shedding 1st day of
symptoms• Adults shed 4-6 days• Infants and children may
shed longer• Immunocompromised
21
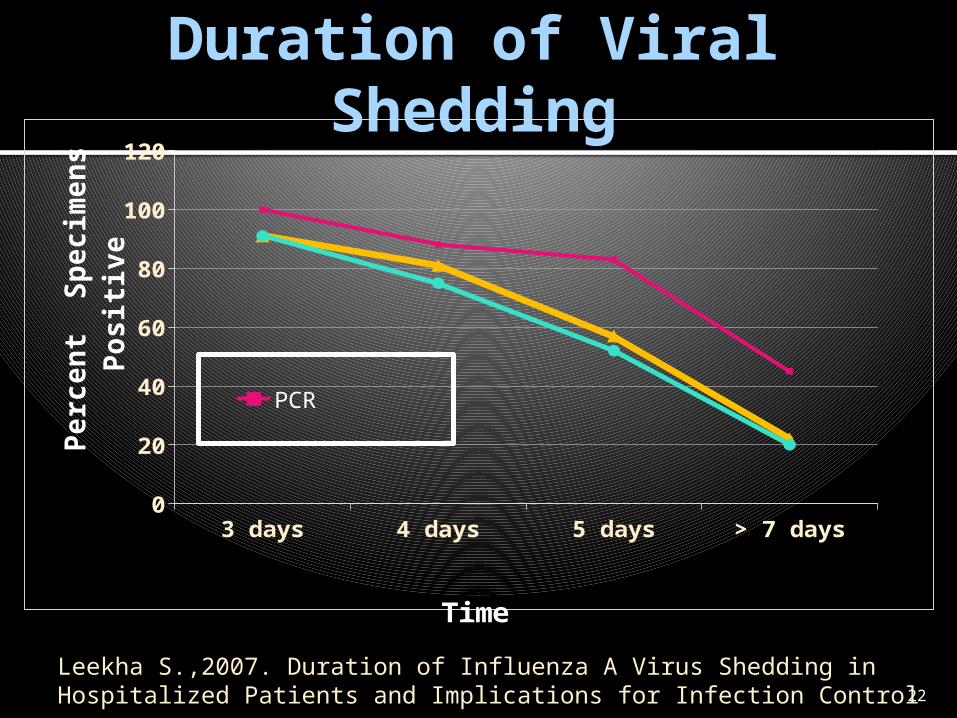
Duration of Viral Shedding
3 days 4 days 5 days > 7 days0
20
40
60
80
100
120
PCRViral Cell CultureTube Cell Culture
Time
Perc
ent
Spec
imen
s Po
sitiv
e
Leekha S.,2007. Duration of Influenza A Virus Shedding in Hospitalized Patients and Implications for Infection Control 22

Prevention
23

24
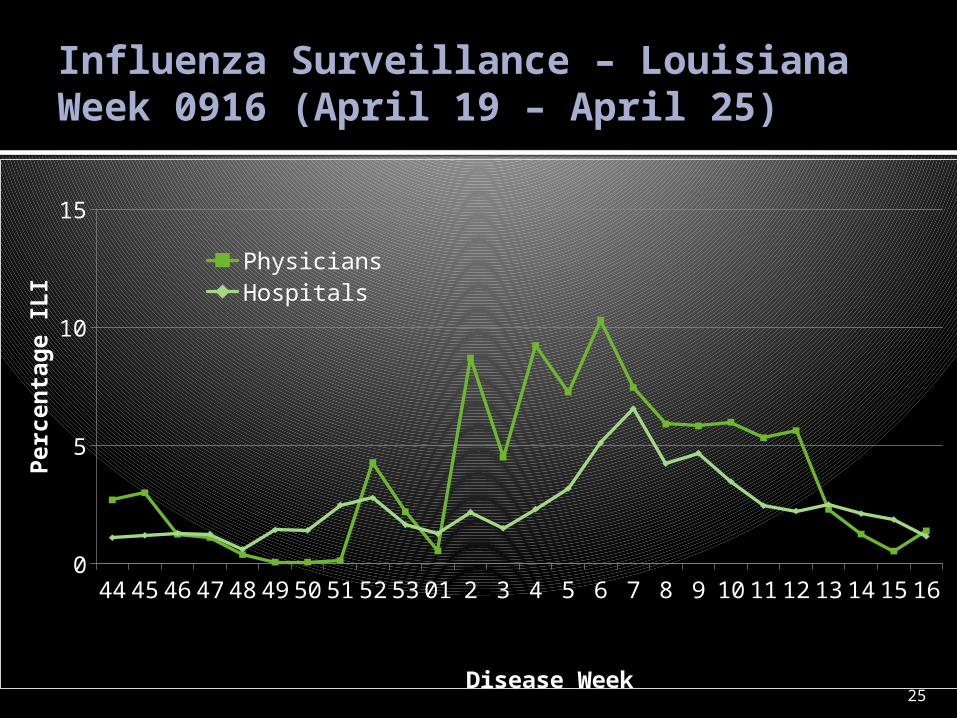
Influenza Surveillance – Louisiana Week 0916 (April 19 – April 25)
4445464748495051525301 2 3 4 5 6 7 8 9 101112131415160
5
10
15
PhysiciansHospitals
Disease Week
Perc
enta
ge IL
I
25
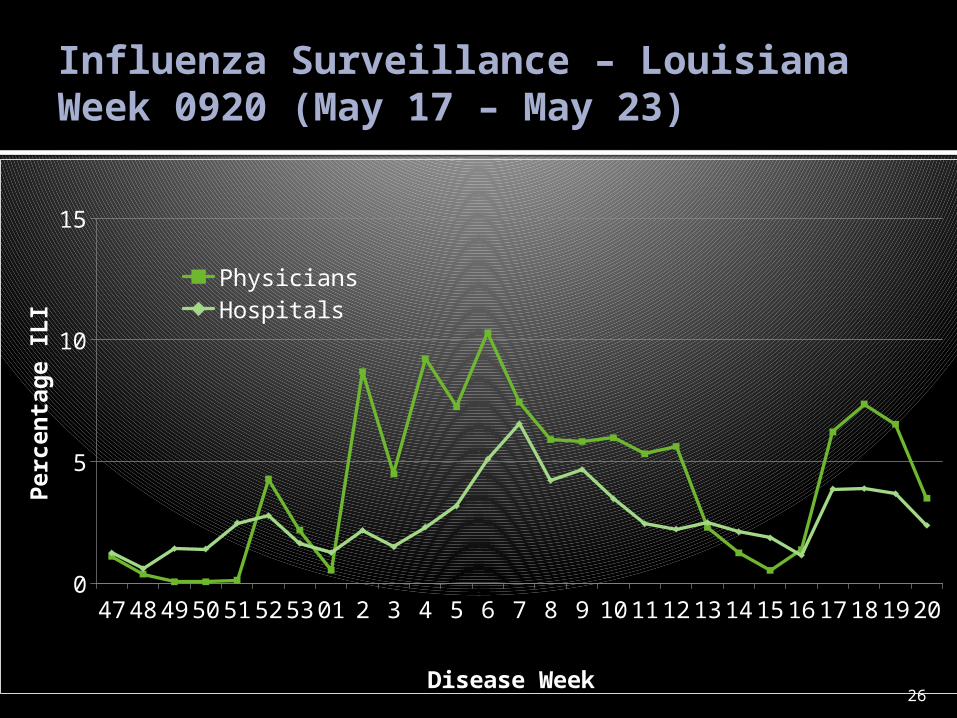
Influenza Surveillance – Louisiana Week 0920 (May 17 – May 23)
47
48
49
50
51
52
53
01
2 3 4 5 6 7 8 9 10
11
12
13
14
15
16
17
18
19
20
0
5
10
15
PhysiciansHospitals
Disease Week
Perc
enta
ge IL
I
26

Summary of Events
Conference call with CDC on April 23 7 cases : 5 in California, 2 in Texas Human-to-human spread All cases have resolved
Enhanced surveillance: Sentinel Providers Specimens collected on all ILI Daily ILI reports
27
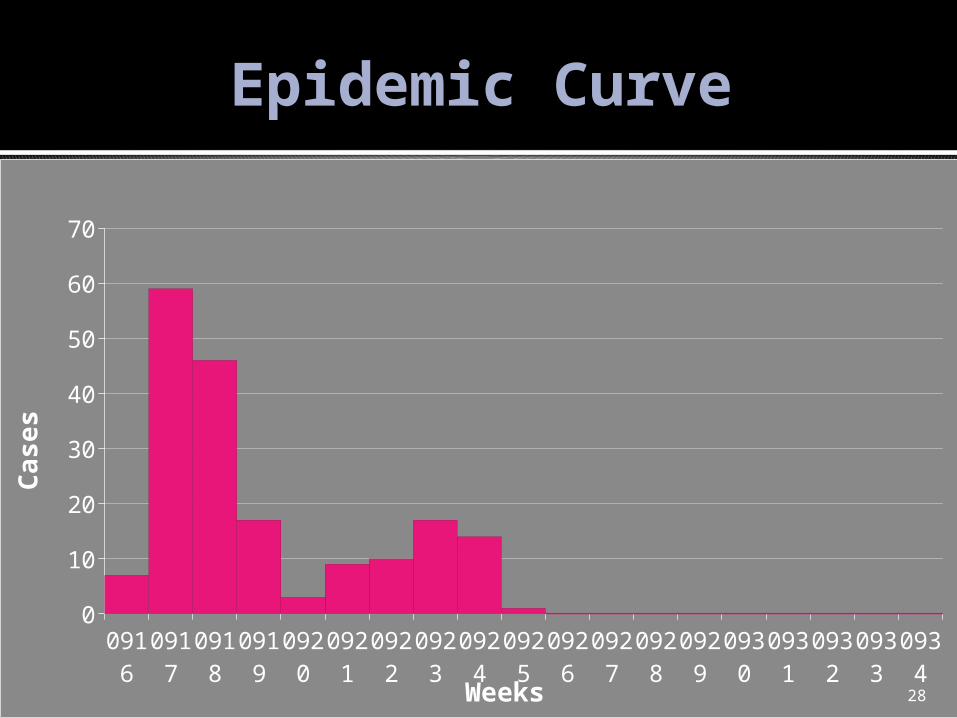
Epidemic Curve
0916
0917
0918
0919
0920
0921
0922
0923
0924
0925
0926
0927
0928
0929
0930
0931
0932
0933
0934
0
10
20
30
40
50
60
70
Weeks
Cas
es
28
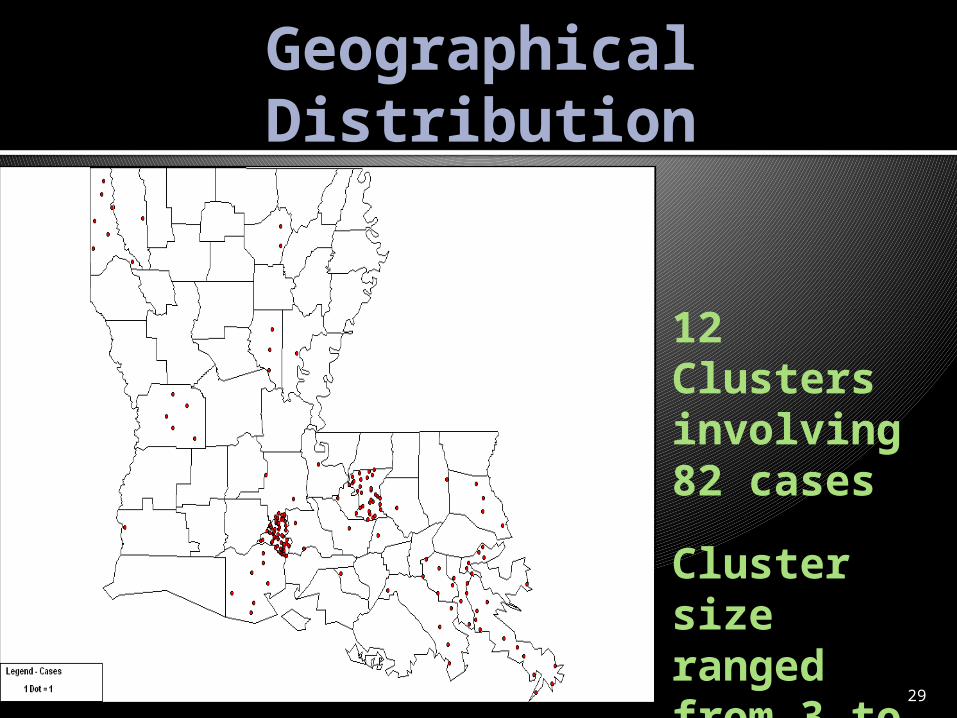
Geographical Distribution
12 Clusters involving 82 casesCluster size ranged from 3 to 23 cases
29

40414243444546474849505152531234567891
01112131415161718192021222324252627282930313233343536373839
0
5
10
15
20
25
30
35
40Influenza Sentinel Surveillance - Louisiana, 2008-
2009 SeasonMD ILI %Hosp ILI %
2008-2009 CDC Week
Perc
ent I
LI p
er T
otal
Vis
its
30
404142434445464748495051521234567891
01112131415161718192021222324252627282930313233343536373839
0
5
10
15
20
25
30
35
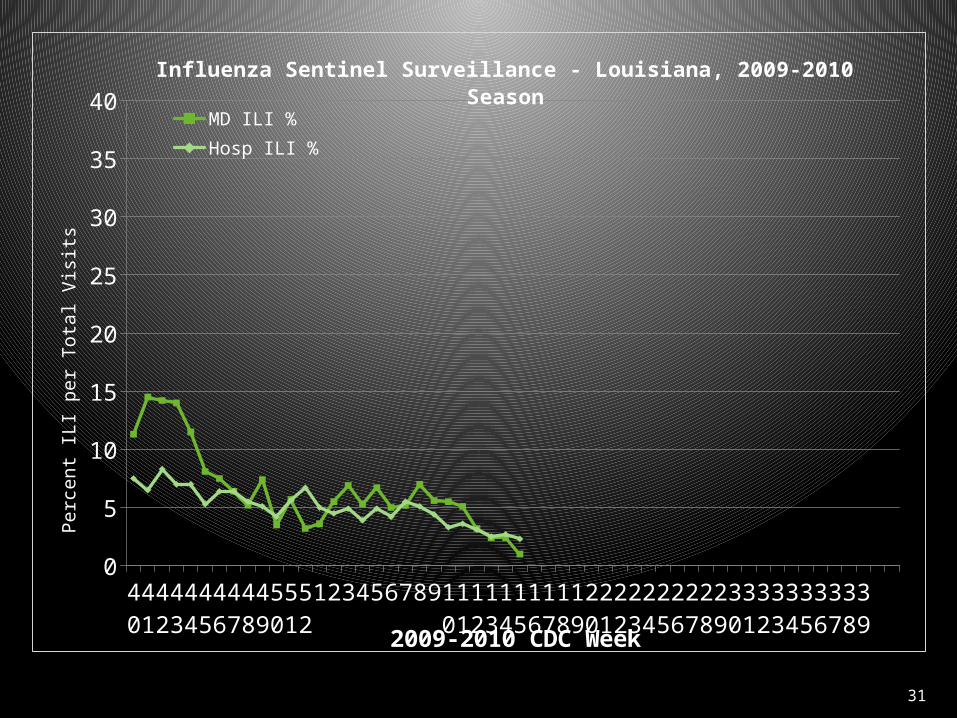
40Influenza Sentinel Surveillance - Louisiana, 2009-2010
SeasonMD ILI %Hosp ILI %
2009-2010 CDC Week
Perc
ent I
LI p
er T
otal
Visi
ts
31

40414243444546474849505152 1 2 3 4 5 6 7 8 9 1011121314151617181920212223242526272829303132333435363738390
50
100
150
200
250
Epidemic Curve 2008-2009 2009-2010
CDC Week
Number of Cases
32

Data Summary* 2,396 confirmed cases Real case count near 292,000 Distribution of cases by gender is
similar to the population distribution by gender
68 % of outpatient cases in the 5-24 year age group
62% of inpatient cases between 5-49 years of age
71% of cases had typical influenza-like illness
736 Hospitalizations 53 deaths
*as of April 17, 2010 33
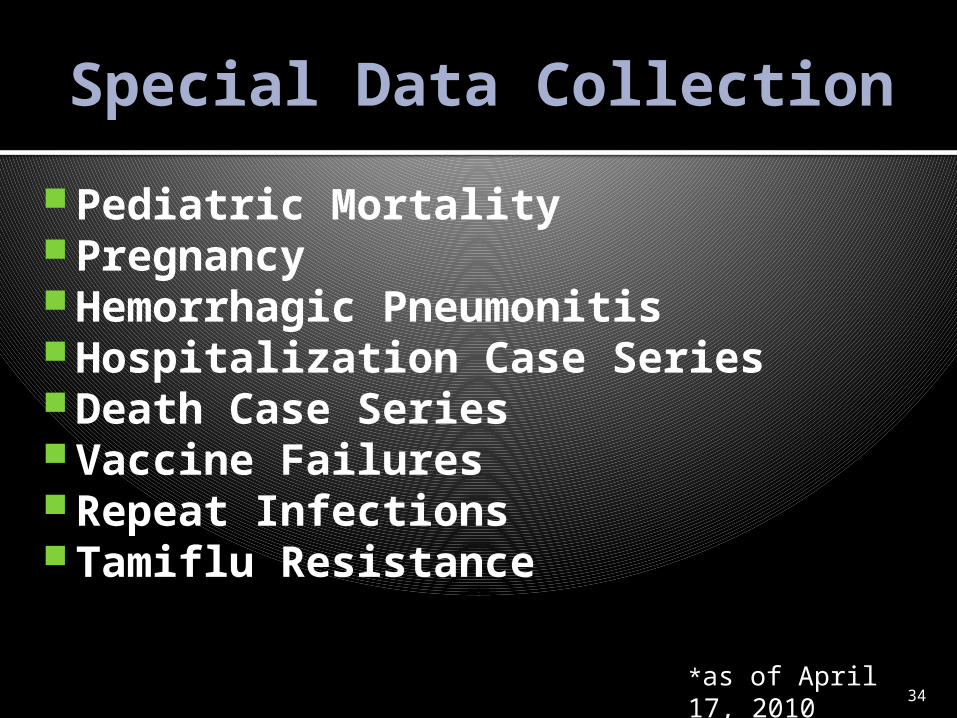
Special Data CollectionPediatric MortalityPregnancyHemorrhagic PneumonitisHospitalization Case SeriesDeath Case SeriesVaccine FailuresRepeat InfectionsTamiflu Resistance
*as of April 17, 2010 34

35

36

37
38

39