origin and function of stress-induced il-6 in murine models
TRANSCRIPT

Article
Origin and Function of Stress-Induced IL-6 in MurineModels
Graphical Abstract
Highlights
d IL-6 is the dominant endocrine cytokine induced by acute
stress in mice
d Stress-inducible IL-6 is produced in brown adipocytes via
ADRB3 signaling
d IL-6 is required for stress hyperglycemia and adaptive ‘‘fight
or flight’’ responses
d Stress-induced IL-6 decreases tolerance to a subsequent
inflammatory challenge
Qing et al., 2020, Cell 182, 372–387July 23, 2020 ª 2020 Elsevier Inc.https://doi.org/10.1016/j.cell.2020.05.054
Authors
Hua Qing, Reina Desrouleaux,
Kavita Israni-Winger, ...,
Marina R. Picciotto, Rachel J. Perry,
Andrew Wang
In Brief
During acute psychological stress, brown
adipocytes initiate a chain of events
mediated by adrenergic signaling and IL-
6 release that metabolically fuels ‘‘fight or
flight’’ adaptive responses but at the
same time comes at an
inflammatory cost.
ll

ll
Article
Origin and Function of Stress-InducedIL-6 in Murine ModelsHua Qing,1,2,7 Reina Desrouleaux,1,2,6,7 Kavita Israni-Winger,2 Yann S. Mineur,4 Nia Fogelman,3 Cuiling Zhang,1,2
Saleh Rashed,2 Noah W. Palm,2 Rajita Sinha,3 Marina R. Picciotto,4 Rachel J. Perry,5 and Andrew Wang1,2,8,*1Department of Medicine (Rheumatology, Allergy & Immunology), Yale University School of Medicine, New Haven, CT, USA2Department of Immunobiology, Yale University School of Medicine, New Haven, CT, USA3Yale Stress Center and Departments of Psychiatry and Neuroscience, Yale School of Medicine, New Haven, CT, USA4Department of Psychiatry, Yale Interdepartmental Neuroscience Program, Yale University, New Haven, CT, USA5Departments of Medicine (Endocrinology) and Cellular and Molecular Physiology, Yale University, New Haven, CT, USA6Present address: Case Western Reserve University School of Medicine, Cleveland, OH, USA7These authors contributed equally8Lead Contact
*Correspondence: [email protected]
https://doi.org/10.1016/j.cell.2020.05.054
SUMMARY
Acute psychological stress has long been known to decrease host fitness to inflammation in a wide variety ofdiseases, but how this occurs is incompletely understood. Using mouse models, we show that interleukin-6(IL-6) is the dominant cytokine inducible upon acute stress alone. Stress-inducible IL-6 is produced frombrown adipocytes in a beta-3-adrenergic-receptor-dependent fashion. During stress, endocrine IL-6 is therequired instructive signal for mediating hyperglycemia through hepatic gluconeogenesis, which is neces-sary for anticipating and fueling ‘‘fight or flight’’ responses. This adaptation comes at the cost of enhancingmortality to a subsequent inflammatory challenge. These findings provide a mechanistic understanding ofthe ontogeny and adaptive purpose of IL-6 as a bona fide stress hormone coordinating systemic immunome-tabolic reprogramming. This brain-brown fat-liver axis might provide new insights into brown adipose tissueas a stress-responsive endocrine organ and mechanistic insight into targeting this axis in the treatment ofinflammatory and neuropsychiatric diseases.
INTRODUCTION
Acute life stressors have been observed to decompensate a
wide range of inflammatory diseases since antiquity (Hippo-
crates, 1849; Liu et al., 2017). Most chronic sterile inflammatory
diseases are known to ‘‘flare’’ after acute stress, contributing
significantly to morbidity and mortality. Indeed, psychosocial
stress worsens most inflammatory diseases, including allergic
diseases, autoimmune diseases, and cancers (Batty et al.,
2017; Liu et al., 2002; Mohr et al., 2004; Roussou et al., 2013).
In human studies, stress induces measurable changes in
biology, such as in the magnitude of inflammatory cytokines
and in functional changes within relevant end-organs, such as
in pulmonary function in the case of allergic inflammation (Liu
et al., 2002). Concordantly, several randomized controlled trials
targeting stress management have largely lead to improvement
in the morbidity of inflammatory diseases (Black and Slavich,
2016; Pbert et al., 2012; Simpson et al., 2014). However, the
well-studied mediators of stress physiology, glucocorticoids,
and catecholamines, are primarily thought to be immunosup-
pressive (Russell and Lightman, 2019) and used therapeutically
for this purpose, creating a paradox that many have tried to
372 Cell 182, 372–387, July 23, 2020 ª 2020 Elsevier Inc.
resolve for over 30 years (Frank et al., 2013; Munck et al.,
1984). How does psychological stress, which leads to the pro-
duction of immunosuppressive mediators such as cortisol and
catecholamines, decrease host fitness to inflammation?
Studies dating back to 1990 have shown that psychological
stress increases circulating levels of interleukin-6 (IL-6) in hu-
mans and laboratory animals (Cheng et al., 2015; LeMay et al.,
1990; Maes et al., 1998). The role that IL-6 plays in the acute
stress response, also referred to as the ‘‘fight or flight’’ response,
is unclear. The idea that stress itself induces endocrine media-
tors like IL-6, which is traditionally associated with inflammation,
has since been supported by the detection of increased circu-
lating cytokines in depression and anxiety (Felger and Lotrich,
2013; Khandaker et al., 2014) and by the association of IL-6 poly-
morphisms in individuals with depression (Zhang et al., 2016).
Moreover, there is a robust relationship between depression
and anxiety and poor outcomes in inflammatory diseases (Eisner
et al., 2005; Satin et al., 2009). This body of research has led to
clinical trials assessing the efficacy of an antagonizing mono-
clonal antibody targeting IL-6 receptor subunit alpha (IL-6Ra),
tocilizumab—used in rheumatoid arthritis and vasculitis—
in depression (Kappelmann et al., 2018), despite little
llArticle
understanding of how and why stress induces IL-6. The possibil-
ity that stress-inducible cytokines, as opposed to glucocorti-
coids or catecholamines, underlie how stress leads to poorer
outcomes in inflammatory diseases has not been explored
in depth.
Here, we report that commonly utilized models of acute stress
in mice induce endocrine IL-6. Stress-induced IL-6 requires con-
sciousness and beta-3-adrenergic-receptor signaling in brown
adipocytes. IL-6 is required for stress hyperglycemia, a meta-
bolic adaptation that enables the ‘‘fight or flight’’ response, via
hepatic gluconeogenesis. The cost of stress-induced IL-6 is
that it decreases host fitness to a subsequent inflammatory chal-
lenge. Our studies therefore mechanistically uncover the origin
and adaptive function of IL-6 in acute stress and its cost in the
setting of inflammation in mice.
RESULTS
Acute stress induces endocrine IL-6We found that standard laboratory models of acute stress—
including tube restraint, cage switching, and social isolation—
induced high levels of circulating IL-6 (Figure 1A), consistent
with previous studies demonstrating that stress alone induced
IL-6 (Cheng et al., 2015; LeMay et al., 1990; Maes et al., 1998).
Unexpectedly, we found that a single, conscious, retro-orbital
bleed induced IL-6 (Figure 1A). To more comprehensively survey
other stress-inducible immune mediators, we screened 32 in-
flammatory cytokines and chemokines in the circulation of
stressed mice and identified a set of cytokines inducible by
stress alone; IL-6 was the most greatly induced cytokine and
common to two different stress models (Figure 1B). We did not
detect corresponding increases in the soluble IL-6 receptor (Fig-
ure S1A) (Khokha et al., 2013). The absolute level of IL-6 we de-
tected fell in the middle range of reported levels (50 pg/mL to
200 ng/mL) in inflammatory contexts and above reported ranges
post-exercise and in diet-induced obesity (30–100 pg/mL)
(Chowdhury et al., 2020; Gao et al., 2014; Greenhill et al.,
2011; Masuda et al., 2013; Osuchowski et al., 2006; Remick
et al., 2005; Vida et al., 2015; Wang et al., 2017; Yan et al.,
2015). We also confirmed that acute, stress-increased IL-6
was independent of handlers (as indicated Figure 1A–C).
To exclude circadian oscillations leading to fluctuations in IL-
6, we measured circulating IL-6 over time by retro-orbital
bleeding and observed that repeated bleeding of the same ani-
mals sustained high IL-6 levels. When individual cages of unma-
nipulated, entrained animals were bled at the corresponding
Zeitgeber times (five mice per ZT time, bled only once at that
ZT time), no such sustained increase in IL-6 was noted, demon-
strating that conscious bleeding itself increased circulating IL-6
and that repeated bleeding sustained high IL-6 levels (Figure 1C).
Thus, in order to gain insight into the kinetics of IL-6 after an
acute stress, we subjected several groups of mice to a single
retro-orbital bleed, and then sampled individual groups at
different time points after the bleed. Circulatory cortisol and
noradrenaline were increased within 15 min, peaked at 2 h after
acute stress, and returned to baseline by 4 h; however, IL-6,
which was significantly increased in blood by 2 h, peaked at 4
h, and was even detectable above baseline 18 h after acute
stress (Figure 1D). The unique kinetics of stress-induced endo-
crine IL-6 suggested that it may bemediatingmore sustained as-
pects of stress physiology.
Because the adrenal gland is thought to be themajor mediator
of the acute stress response, and previous reports have
described adrenally derived IL-6 (Path et al., 2000), we asked if
the adrenal gland was required for stress-induced IL-6. We
found that adrenalectomized mice had significantly higher levels
of IL-6 after stress, suggesting that the adrenal gland negatively
regulated IL-6 (Figure S1B). To address previous reports of
cross-talk between IL-6 and adrenal hormones (Bethin et al.,
2000; Path et al., 2000), we utilized an antagonistic anti-IL-6Ra
antibody and found that inhibition of IL-6 signaling did not
change circulating levels of corticosterone or noradrenaline after
acute stress (Figures S1C and S1D). This model avoids the con-
founding developmental defects observed in constitutive IL-6
knockout animals (Wallenius et al., 2002).
We then validated previous observations that circulating IL-6
levels were increased in stressed humans (Felger and Lotrich,
2013; Khandaker et al., 2014). We acquired a community sample
of individuals that were carefully assessed for high and low
stress by using a structured cumulative stress and adversity
interview that assessed recent and past life events (Cumulative
Adversity Interview) (Ansell et al., 2012; Seo et al., 2014; Turner
and Lloyd, 1995). The high and low groups were group matched
by age, gender, education, and body mass index (Figure S1E).
We found significant overall increased IL-6 levels in the high
(74 pg/mL, SE: 35) versus low (3.9 pg/mL, SE: 2.78) stress
groups (t = 2.15, p < 0.05) (Figure S1E). The absolute circulating
level of stress-associated IL-6 in humans was a hundred times
lower in mice, reflecting inter-species variation and/or acuity,
heterogeneity, and magnitude of stressors. Taken together,
these data indicate that IL-6 is an endocrine hormone inducible
by acute stress alone, with different kinetics than the canonical
stress hormones, corticosterone and noradrenaline.
Stress-inducible IL-6 is produced by brown adipocytesTo understand the ontogeny of stress-induced IL-6, we first
ensured that IL-6 was not induced by retro-orbital bleeding as
a result of bacterial translocation from the skin or gastrointestinal
tract (Kelly et al., 2015). Consistent with our observations that
other acute-phase cytokines were not induced after stress,
stress-induced IL-6 was present in both gnotobiotic animals
and animals deficient in key signaling pathways necessary for
detecting bacteria (Figure 2A). Previous reports had suggested
that hyperglycemia itself, a characteristic feature of the acute
stress response (Esposito et al., 2002), was sufficient to induce
IL-6. To test this, we performed an oral glucose tolerance test
4 h post retro-orbital bleeding and found that both glucose and
water induced IL-6, suggesting that the acute stress of gavaging
and bleeding, but not hyperglycemia, was responsible for IL-6 in-
duction (Figures S1F and S1G). We also wanted to exclude the
possibility that local damage to the retro-orbital plexus was
inducing regional endothelial or immune release of IL-6, and so
we sampled the contralateral orbital plexus and did not observe
differences between traumatized and untraumatized eyes, sug-
gesting that the contribution of systemic IL-6 was not signifi-
cantly affected by local damage (Figure S1H).
Cell 182, 372–387, July 23, 2020 373

Figure 1. Acute stress induces endocrine IL-6
(A) Plasma IL-6 levels in mice after exposure to one of the indicated stress challenges (n = 5 per group, representative of 2 experiments). These experiments were
performed by H.Q. NT, no treatment; TR, tube restraint.
(B) Fold change of the indicated inflammatory cytokines and chemokines 4 h after a single retro-orbital bleed or tube restraint (TR). Results are presented as the
ratio of cytokine or chemokine levels from stressed subjects compared with no stress controls (n = 5 per group). Experiments were performed by R.D.
(C) Plasma IL-6 levels after repetitive bleeding. Repetitive bleeding was applied to the same mice (n = 5) every 4 h, while circadian controls were non-stressed
mice bled once at the indicated ZT times (n = 5 for each time point). Experiments were performed by A.W.
(D) Plasma levels of noradrenaline, corticosterone, and IL-6 post bleeding at indicated time point (n = 5 per time point, representative of 2 experiments). Data are
represented as mean ± SEM. *p < 0.05, **p < 0.01, ***p < 0.001, ****p < 0.0001.
See also Figures S1 and S7.
llArticle
IL-6 is produced by many cell types, including hematopoiet-
ic cells, myocytes, endothelial cells, and adipocytes (Hunter
and Jones, 2015). To identify the origin of IL-6, we first per-
formed mixed bone marrow chimera studies by using IL-6-
deficient animals and found that stress-induced IL-6 was not
produced by radiosensitive cells (Figure 2B). Given the ki-
netics of plasma IL-6 after acute stress, we reasoned that
IL-6 would be transcriptionally regulated. Thus, we screened
multiple tissues for Il6 induction using both the bleeding and
tube restraint models. We found that Il6 was robustly induced
374 Cell 182, 372–387, July 23, 2020
in the brown adipose tissue (BAT) (Figure 2C) and confirmed
protein expression by immunohistochemistry (Figure 2D). We
did not detect increased muscle Il6, which was consistent
with the observation that mice did not significantly increase
physical activity after an acute stressor (Figure S2B). To test
if BAT was the sole source of stress-induced IL-6, we surgi-
cally excised the BAT, which ablated the IL-6 response to
bleeding stress (Figure 2E).
Because BAT is a complex collection of cells including radio-
resistant immune cells (Wolf et al., 2017), we first asked if stress-

Figure 2. Stress-inducible IL-6 is produced by brown adipocytes
(A) Plasma levels of IL-6 after retro-orbital bleeding from conventionally housed mice (SPF), germ free mice (GF), or mice deficient in key signaling pathways
necessary for pathogen detection and response (n = 8 for SPF, n = 5for GF, n = 3 for Tlr2/4�/�, n = 4 for Myd88/Trif�/�).(B) Plasma level of IL-6 from chimeric mice exposed to bleeding. WT/ Il6 KO: Il6 knockout (KO) mice transplanted with bone marrow (BM) cells from wild-type
(WT) mice; Il6 KO / WT: WT mice transplanted with BM cells from Il6 KO mice (n = 5 per group).
(C) Transcriptional analysis of Il6 in tissues from stressed and control mice (n = 5 per group, representative of 2 experiments). Abbreviations are as follows: FB,
forebrain; MB, midbrain; HB, hindbrain; BAT, brown adipose tissue; eWAT, epididymal white adipose tissue; rWAT, retroperitoneal white adipose tissue; iWAT,
inguinal white adipose tissue; NT, no treatment; TR, tube restraint.
(D) Representative images of immunohistochemical staining for IL-6 in brown adipose tissue harvested frombledmice or from controls (NT). IL-6-positive staining
is brown.
(E) Plasma level of IL-6 post bleeding frommice with surgical removal of brown adipose tissue (BATectomy) or sham surgery controls (sham) (n = 3 for sham, n = 4
for BATectomy).
(F) Transcriptional analysis of Il6 in stromal vascular fraction (SVF) of brown adipose tissue (BAT) from stressed mice (n = 3 for NT, n = 4 for Bleed or TR group,
representative of 2 experiments). Results are presented as fold increase in relation to non-stressed controls (NT). TR, tube restraint.
(G) Plasma level of IL-6 after bleeding from mice with Il6 genetically deleted in brown adipocytes (Il6f/fDUCP1) compared with littermate controls (Il6f/f). NT, no
treatment. Data are represented as mean ± SEM. *p < 0.05, **p < 0.01, ***p < 0.001, ****p < 0.0001.
See also Figure S1.
llArticle
induced Il6 would be present in the stromal vascular fraction
(SVF), which includes all cells except adipocytes. The purity of
our SVF isolation was verified by the absence of Ucp1 and
beta-3 adrenergic receptor (Adrb3) expression (Figures S1I
and S1J). Il6 transcriptional induction was not observed in the
SVF fraction from either bled or restrained animals, implying
that stress-induced IL-6 was derived from brown adipocytes
(Figure 2F). Thus, we generated an animal in which Il6 could be
inducibly deleted in brown adipocytes by using Ucp1 pro-
moter-driven Cre under the control of estrogen receptor (Il6f/
fDUCP1) and detected a significant attenuation of IL-6 after acute
stress in these animals (Figure 2G). Collectively, our data demon-
strate that brown adipocytes are the source of stress-induced
IL-6.
Cell 182, 372–387, July 23, 2020 375
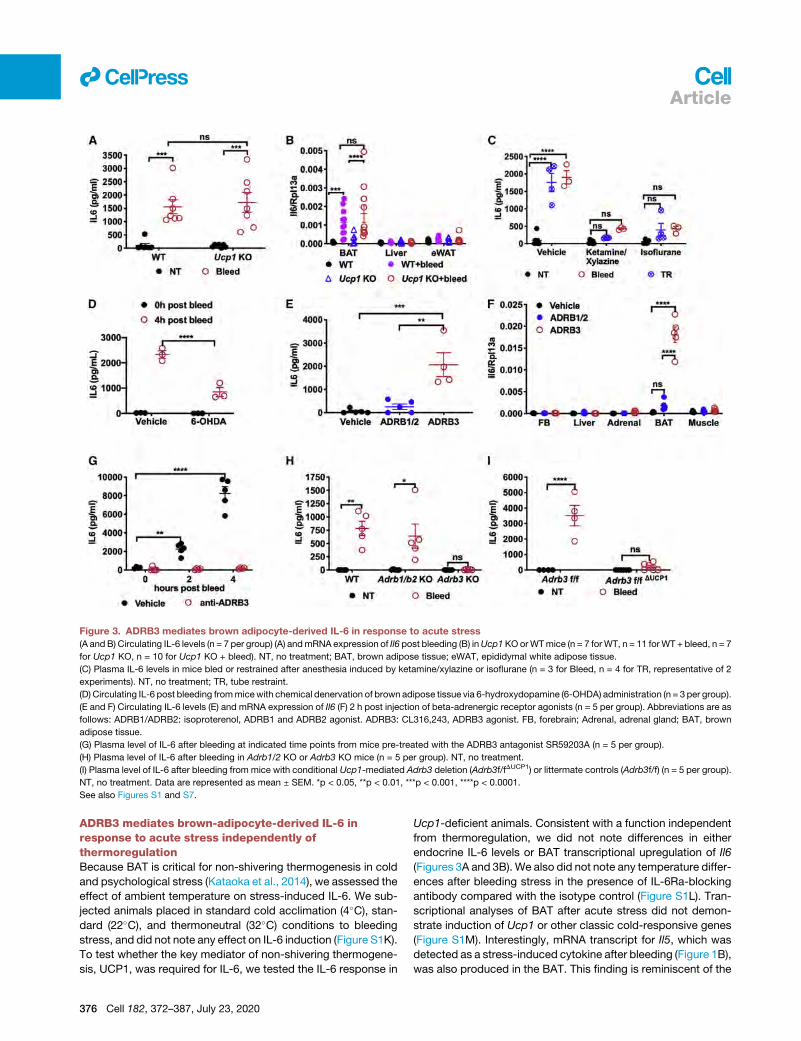
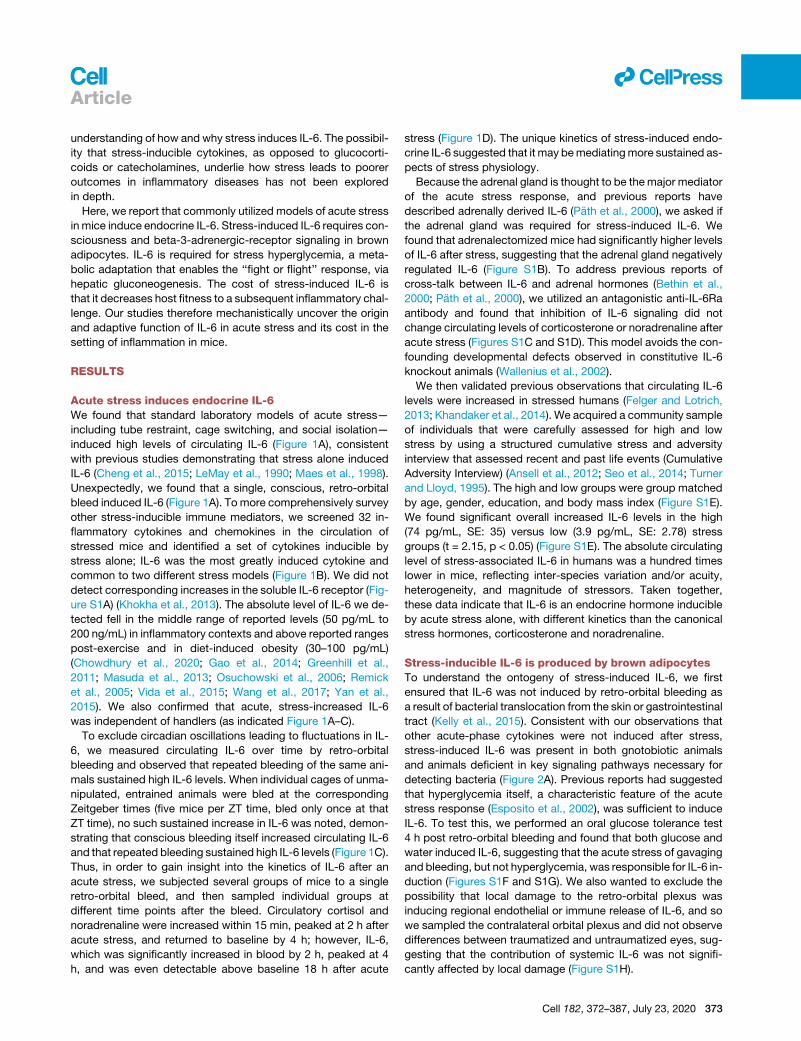
Figure 3. ADRB3 mediates brown adipocyte-derived IL-6 in response to acute stress
(A and B) Circulating IL-6 levels (n = 7 per group) (A) andmRNA expression of Il6 post bleeding (B) inUcp1KOorWTmice (n = 7 forWT, n = 11 forWT + bleed, n = 7
for Ucp1 KO, n = 10 for Ucp1 KO + bleed). NT, no treatment; BAT, brown adipose tissue; eWAT, epididymal white adipose tissue.
(C) Plasma IL-6 levels in mice bled or restrained after anesthesia induced by ketamine/xylazine or isoflurane (n = 3 for Bleed, n = 4 for TR, representative of 2
experiments). NT, no treatment; TR, tube restraint.
(D) Circulating IL-6 post bleeding frommicewith chemical denervation of brown adipose tissue via 6-hydroxydopamine (6-OHDA) administration (n = 3 per group).
(E and F) Circulating IL-6 levels (E) and mRNA expression of Il6 (F) 2 h post injection of beta-adrenergic receptor agonists (n = 5 per group). Abbreviations are as
follows: ADRB1/ADRB2: isoproterenol, ADRB1 and ADRB2 agonist. ADRB3: CL316,243, ADRB3 agonist. FB, forebrain; Adrenal, adrenal gland; BAT, brown
adipose tissue.
(G) Plasma level of IL-6 after bleeding at indicated time points from mice pre-treated with the ADRB3 antagonist SR59203A (n = 5 per group).
(H) Plasma level of IL-6 after bleeding in Adrb1/2 KO or Adrb3 KO mice (n = 5 per group). NT, no treatment.
(I) Plasma level of IL-6 after bleeding from mice with conditional Ucp1-mediated Adrb3 deletion (Adrb3f/fDUCP1) or littermate controls (Adrb3f/f) (n = 5 per group).
NT, no treatment. Data are represented as mean ± SEM. *p < 0.05, **p < 0.01, ***p < 0.001, ****p < 0.0001.
See also Figures S1 and S7.
llArticle
ADRB3 mediates brown-adipocyte-derived IL-6 inresponse to acute stress independently ofthermoregulationBecause BAT is critical for non-shivering thermogenesis in cold
and psychological stress (Kataoka et al., 2014), we assessed the
effect of ambient temperature on stress-induced IL-6. We sub-
jected animals placed in standard cold acclimation (4�C), stan-dard (22�C), and thermoneutral (32�C) conditions to bleeding
stress, and did not note any effect on IL-6 induction (Figure S1K).
To test whether the key mediator of non-shivering thermogene-
sis, UCP1, was required for IL-6, we tested the IL-6 response in
376 Cell 182, 372–387, July 23, 2020
Ucp1-deficient animals. Consistent with a function independent
from thermoregulation, we did not note differences in either
endocrine IL-6 levels or BAT transcriptional upregulation of Il6
(Figures 3A and 3B). We also did not note any temperature differ-
ences after bleeding stress in the presence of IL-6Ra-blocking
antibody compared with the isotype control (Figure S1L). Tran-
scriptional analyses of BAT after acute stress did not demon-
strate induction of Ucp1 or other classic cold-responsive genes
(Figure S1M). Interestingly, mRNA transcript for Il5, which was
detected as a stress-induced cytokine after bleeding (Figure 1B),
was also produced in the BAT. This finding is reminiscent of the

llArticle
reported role of IL-5 in BAT adaptation to prolonged cold expo-
sure (Lee et al., 2015; Qiu et al., 2014).
We reasoned that consciousness would be required for IL-6
response to acute stress. Thus, we anesthetized animals with
either ketamine/xylazine or isoflurane, after which we subjected
them to tube restraint or retro-orbital bleeding and found that
anesthesia abrogated stress-induced IL-6 (Figure 3C). Because
sympathetic outflow to BAT is well-described in settings of acute
exposure to cold (Kawate et al., 1994; Nguyen et al., 2017) and
psychological stress (Kataoka et al., 2014), where projections
originate from the rostral medullary raphe region and dorsome-
dial hypothalamus, we hypothesized that IL-6 was induced via
beta-adrenergic signaling. To test if sympathetic neurons were
required for stress-induced IL-6, we utilized 6-hydroxydopamine
(6-OHDA) at doses that achieve significant BAT sympathectomy
without significant effects on the CNS (Depocas et al., 1984). Af-
ter 6-OHDA treatment, we found that stress-inducible IL-6 was
significantly attenuated, confirming that sympathetic outflow
was required (Figure 3D). Because all three beta-adrenergic re-
ceptors are present in BAT (Figures S1J, S1N, and S1O), we
asked which of these played a role in mediating stress-induced
IL-6. We thus challenged animals with ADRB agonists and found
that the ADRB3 agonist CL316,243, but not the ADRB1/2 agonist
isoproterenol, was sufficient to induce IL-6 (Figures 3E and 3F),
consistent with previous reports (Kosteli et al., 2010; Zhang
et al., 2014). Concordantly, pre-treatment with the pharmaco-
logic inhibitor of ADRB3, but not ADRB1/2 (Figures 3G and
S1P) or genetic deletion of Adrb3 (Figure 3H), abrogated
stress-induced IL-6. These experiments demonstrate that
ADRB3 is necessary and sufficient for acute-stress-induced
IL-6. Because many cell types express Adrb3, we generated
animals in which Adrb3 could be inducibly deleted from brown
adipocytes (Adrb3f/fDUCP1) and verified that tamoxifen induction
efficiently deleted Adrb3 (Figure S1Q). As expected, and consis-
tent with Il6f/fDUCP1 animals (Figure 2G), stress-inducible IL-6
was significantly attenuated in Adrb3f/fDUCP1 mice (Figure 3I).
These data are consistent with a UCP1-independent ADRB3-
dependent endocrine function of brown adipocytes and suggest
that BAT may function as an endocrine organ sensitive to adren-
ergic outflow triggered by acute stress.
IL-6 is necessary for maintaining hyperglycemia afteracute stressGiven the large induction of IL-6 by stress alone, we hypothe-
sized that IL-6 was coordinating stress physiology. Classical
‘‘fight or flight’’ physiology includes autonomic outflow and
metabolic reprogramming toward catabolic metabolism, which
is thought to fuel the increased energy demand anticipated in
threatening situations (Russell and Lightman, 2019). We did not
detect significant changes in the quantity of canonical stress
hormones (Figures S1C and S1D) or stress-induced heart rate
or hypertension (Figure S2A) after acute stress in the absence
of IL-6 function, suggesting that autonomic output was not
significantly impacted by IL-6. In contrast, using indirect calorim-
etry, we did detect significant differences in the overall energy
expenditure of stressed animals in which IL-6 signaling was
antagonized (Figure 4A) despite no significant changes in total
activity of animals in either group (Figure S2B). We thus hypoth-
esized that organismal metabolic re-programming was likely
a key function of stress-induced IL-6, consistent with the
numerous studies that have reported a role for IL-6 in affecting
organismal metabolism in various contexts (Covarrubias and
Horng, 2014; Mauer et al., 2014; Pedersen and Febbraio, 2007;
Scheller et al., 2011; Timper et al., 2017).
We thus examined metabolic changes induced by acute
stress at the peak of endocrine IL-6 levels. We found that
stress-induced hyperglycemia was durable at 4 h after acute
stress in an IL-6Ra-dependent fashion (Figure 4B). A single bolus
of stress-dosed IL-6 was also sufficient to recapitulate the ef-
fects of acute stress (Figure S2C), indicating that IL-6 was both
necessary and sufficient to induce stress-hyperglycemia at this
time point. Hyperglycemia is caused by impaired clearance (in-
sulin resistance) and/or excess glucose production from glyco-
genolysis or gluconeogenesis. To determine which of these
processes was causing hyperglycemia, we tested organismal in-
sulin resistance with a glucose tolerance test (GTT) and did not
detect significant differences between stressed and unstressed
animals (Figure S2D). Likewise, we did not detect differences in
GTT in mice challenged with a single bolus of stress-dosed IL-6
(Figure S2E) nor did we detect changes in plasma insulin at peak
glycemia after IL-6 challenge (Figure S2F), suggesting the
absence of an effect of IL-6 on insulin-dependent glucose up-
take. However, when we performed insulin tolerance tests
(ITT), we observed that acute stress alleviated insulin-induced
hypoglycemia at later time points (Figure S2G), suggesting that
stress-induced IL-6 might potentiate endogenous glucose pro-
duction. Consistent with this idea, a single dose of recombinant
IL-6 was also sufficient to recapitulate the effects of acute stress
on maintaining higher levels of glucose at late time points during
ITT (Figure S2H), and IL-6Ra blockade in stressed animals atten-
uated the ability of mice to maintain normoglycemia after insulin
challenge (Figure S2I). We tested the contribution of glycogenol-
ysis to stress hyperglycemia by examining glycogen content in
liver, kidney, and skeletal muscle after stress but did not detect
significant differences (Figure S2J). We thus hypothesized that
IL-6 was inducing gluconeogenesis during stress.
Gluconeogenesis is typically engaged in hypoglycemic or net
negative energy balance states, with the exception of forced
intensive exercise, where muscle-derived IL-6 has been shown
to induce gluconeogenesis (Banzet et al., 2009; Febbraio et al.,
2004). To test if gluconeogenesis was impaired in an IL-6-depen-
dent fashion, wemeasured endogenous glucose production after
acute stress and found that it was significantly decreased in the
absence of IL-6 signaling (Figure 4C). This finding was supported
by pyruvate tolerance tests (PTT) in stressed animals, where pyru-
vate conversion to glucose was impaired in the absence of IL-6Ra
signaling (Figure 4D). Consistent with our previous findings, we
found that the effects of IL-6Ra antagonism could be fully recapit-
ulated by using Il6f/fDUCP1 and Adrb3f/fDUCP1 animals, which lack
stress-inducible IL-6 (Figures 4E and 4F). Gluconeogenic capacity
is mediated by key rate-limiting enzymes, many of which have
been shown to be sensitive to IL-6 signaling via STAT3 regulatory
elements (Banzet et al., 2009).We thus assessed the hepatic tran-
scriptional induction of Pck1, G6pc, and other gluconeogenic
genes and found thatPck1 andG6pcwere significantly increased
after acute stress (Figure 4G).
Cell 182, 372–387, July 23, 2020 377

Figure 4. IL-6 is necessary for promoting stress-hyperglycemia(A) Energy expenditure post bleeding from mice pretreated with IL-6Ra antibody or isotype control (n = 4 per group, representative of 2 experiments). Statistic
represents the area under the curve (AUC) between groups.
(B) Blood glucose levels post bleeding from mice pretreated with IL-6Ra antibody or isotype control (n = 10 per group). CBG, capillary blood glucose
(C) Endogenous glucose production (EGP) post bleeding in mice pretreated with IL-6Ra antibody or isotype control (n = 8 for isotype, n = 9 for IL-6Ramonoclonal
antibody [mAb]).
(D) Pyruvate tolerance test (PTT) performed 4 h after bleeding in mice pretreated with IL-6Ra antibody or isotype control (n = 5 per group, representative of 2
experiments). AUC, area under the curve.
(E and F) PTT performed 4 h after bleeding in mice with conditional Ucp1-mediated deletion of (E) Adrb3 (Adrb3f/fDUCP1) or (F) Il6 (Il6f/fDUCP1) compared
respectively with their littermate controls (n = 8 for Adrb3f/f, n = 5 for Adrb3f/fDUCP1, n = 6 for Il6f/f or Il6f/fDUCP1). AUC, area under the curve.
(G) Gluconeogenesis-associated gene expression in the liver harvested 3 h post bleeding (n = 4 for NT, n = 5 for Bleed). Abbreviations are as follows: Pck1,
phosphoenolpyruvate carboxykinase 1;G6pc, glucose-6-phosphatase catalytic subunit; Pcx, pyruvate carboxylase; Fbp1, fructose-1,6-bisphosphatase 1;Gck,
glucokinase. Data are represented as mean ± SEM. *p < 0.05, **p < 0.01, ***p < 0.001, ****p < 0.0001
See also Figures S2 and S3.
llArticle
Given the close crosstalk between glucose and lipid meta-
bolism (Weickert and Pfeiffer, 2006), observations of hyperlipid-
emia in patients receiving anti-IL-6Ra antibodies, as well as the
role of free fatty acids on hepatic glucose production (Boden
et al., 1994), we studied lipid metabolism in response to acute
stress. The circulating level of free fatty acids and glycerol
were not significantly altered in response to retro-orbital
bleeding (Figures S3A and S3B). Acute stress decreased circu-
lating triglyceride (TG) levels (Figure S3C), which was likely a
result of both enhanced TG clearance (Figure S3D) and sup-
pressed hepatic TG production (Figure S3E). Consistent with
clinical observations from patients treated with tocilizumab,
anti-IL-6Ra did increase TG in the non-stressed condition (Fig-
ure S3F). However, manipulation of IL-6 signaling did not signif-
icantly impact triglyceride metabolism in response to acute
stress, although stress-induced hypertriglyceridemia did trend
lower in IL-6Ra antagonized animals (Figure S3F). We did not
378 Cell 182, 372–387, July 23, 2020
detect differences in TG, free fatty acids, glycerol, or b-hydroxy-
butyrate after intravenous injection of IL-6 (Figures S3H–S3K) or
IL-6Ra blockade (Figure S3G), nor did we detect changes in lipo-
lytic capacity in mice with conditional Il6ra deletion in adipose
tissue (Figure S3L). Finally, we were unable to detect differences
in in vivo fatty acid turnover after anti-IL-6Ra treatment (Fig-
ure S3M). Thus, we found that the dominant effect of IL-6 during
acute stress is in inducing gluconeogenesis in the absence of a
negative energy state to support stress-induced hyperglycemia.
IL-6Ra in the liver controls stress hyperglycemiathrough hepatocyte reprogrammingBecause the liver and kidney are the major glucose-producing
organs (Stumvoll et al., 1998), we surveyed the transcriptional in-
duction of gluconeogenic genes in both organs and found that
they were induced by bleeding stress only in the liver (Figures
5A and S4A). We observed that Il6ra was significantly induced

Figure 5. IL-6 mediates stress hyperglycemia through hepatocyte reprogramming
(A) G6pc mRNA in the liver and kidney of Il6 KO or WT mice 4 h post bleeding (n = 5 per group).
(B) Il6ra mRNA in the indicated tissues from stressed mice (n = 5 per group, representative of 2 experiments). Abbreviations are as follows: FB, forebrain; MB,
midbrain; HB, hindbrain; BAT, brown adipose tissue; eWAT, epididymal white adipose tissue; rWAT, retroperitoneal white adipose tissue; iWAT, inguinal white
adipose tissue; NT, no treatment; TR, tube restraint.
(C and D) Rates of glucose production (C) and of gluconeogenesis (D) from pyruvate in the liver or kidney of mice treated with IL-6Ra antibody or isotype control
(n = 8 for isotype, n = 9 for IL-6Ra mAb).
(E and F) PTT 4 h after bleeding (E) or tube restraint (F) in mice with hepatocyte-specific deletion of Il6ra (Il6raf/fDAlb) compared with littermate controls (Il6raf/f)
(n = 5 per group). AUC, area under the curve.
(G) Time in the dark using the light/dark box paradigm analyzed 4 h after bleeding (bleed) from mice with hepatic deletion of Il6ra (Il6raf/fDAlb) compared with
littermate controls (Il6raf/f) (n = 15 for Il6raf/f, n = 9 for Il6raf/fDAlb, representative of 3 experiments). Data are represented as mean ± SEM. *p < 0.05, **p < 0.01,
***p < 0.001, ****p < 0.0001.
See also Figure S4.
llArticle
in liver but not in kidney (Figure 5B), suggesting that the liver
might be the primary target for IL-6 signaling in response to acute
stress. Concordantly, we found that the IL-6/STAT3 target
genes, Saa3 and Socs3, were also induced in the liver in
response to acute stress (Figures S4B and S4C). To directly
assess gluconeogenesis in the liver and kidney, we developed
amethod to assess the contribution of pyruvate to gluconeogen-
esis in a tissue-specific manner during stress and found that
IL-6Ra antibody suppressed gluconeogenesis from pyruvate in
liver but not in kidney (Figures 5C and 5D). We did not detect dif-
ferences in circulating gluconeogenic amino acids (Figure S4D).
Finally, to directly assess the role of hepatocyte IL-6Ra, we
generated mice with hepatocyte-specific deletion of Il6ra (Fig-
ure S4E) and performed PTT after acute stress. We found that
hepatocyte-specific deletion was sufficient to recapitulate the
inhibitory effects of systemic IL-6Ra blockade on gluconeogen-
esis after bleeding (Figure 5E) and restraint stress (Figure 5F).
These data indicate that stress-inducible IL-6 acts on the liver
to induce hepatic gluconeogenesis.
We reasoned that the purpose of activating gluconeogenesis
during acute stress, when animals are neither hypoglycemic
nor in net-negative energy balance states, is anticipatory of
Cell 182, 372–387, July 23, 2020 379

llArticle
impending increased demand (‘‘fight or flight’’ response).
Consequently, impairment of hepatic gluconeogenesis should
be sufficient to affect adaptive behavioral responses to acute
stress. To test this, we utilized the light-dark box paradigm.
The light-dark box paradigm is a common tool for studying stress
response behaviors where animals are placed into a novel envi-
ronment in which part of the apparatus is exposed under bright
light and connected to another enclosed and opaque space by
a small opening (Bourin and Hascoet, 2003). In this paradigm,
animals must balance the need to explore the novel space with
the fear of avoiding possible predation in the exposed area. A
normal adaptive response is to spend more time in the dark
enclosure. We thus established baseline responses of animals
with conditional hepatic deletion of Il6ra and then compared
the responses at the peak of endocrine IL-6 after a single,
conscious, retro-orbital bleed. We found that hepatic IL-6Ra
was required for the normal behavioral response (Figures 5G
and S4F). Taken in aggregate, we demonstrate that stress-
induced IL-6 mediates stress-hyperglycemia through hepatic
IL-6Ra signaling in positive energy balance states, and hepatic
IL-6Ra is necessary for a normal behavioral response to acute
stress.
ADRB3-dependent IL-6 from BAT potentiates lethalendotoxemia secondary to acute stressGiven the many reported roles of IL-6 in affecting inflammatory
responses, we reasoned that stress-induced IL-6 might change
the outcome of inflammation. We decided to use the lipopoly-
saccharide (LPS) model of inflammation, because in this model,
mortality is due solely to the inflammatory response without any
confounding contribution by pathogens. Animals were subjected
to various stress models that induce IL-6 followed by a subse-
quent LPS challenge. We found that priming animals with stress
robustly enhanced mortality to LPS (Figure 6A). For the LPS
studies, we opted to use the tube-restraint model to avoid con-
founders associated with the hemodynamic consequences of
bleeding. Because we found that ADRB3 activation was suffi-
cient and required for stress-induced IL-6, we pre-treated ani-
mals with ADRB agonists and found that pre-treatment with
ADRB3 agonist alone was sufficient to enhance LPS mortality
(Figure 6B). Concordantly, a single injection of stress-dosed
IL-6 was sufficient to potentiate LPS-induced mortality (Fig-
ure 6C). Because stress-induced IL-6 required consciousness,
we tested whether or not animals anesthetized prior to tube re-
straint were still more susceptible to LPS-induced mortality
and found that consciousness was required for the stress-prim-
ing effect, an effect that could be bypassed with endogenous
administration of IL-6 (Figure 6D). To test if ADRB3-dependent
IL-6 was necessary, ADRB3 antagonist was applied alongside
the restraint challenge, which negated the effects of stress-prim-
ing (Figure 6E). Finally, we asked if Il6f/fDUCP1 animals, which lack
stress-inducible IL-6, would be resistant to stress-priming (Fig-
ure 6F). Consistent with our hypotheses, Il6f/fDUCP1, which did
not display altered susceptibility to LPS in the absence of
stress-priming (Figure S5A), was resistant to the potentiating ef-
fects of tube-restraint on LPS mortality. We also tested the ef-
fects of stress-priming by using our Il6raf/fDAlb model. Here,
regardless of stress-priming, animals lacking hepatic IL-6
380 Cell 182, 372–387, July 23, 2020
signaling were significantly more sensitive to endotoxemia, sug-
gesting that the hepatic acute phase response was a required
adaptation to endotoxemia (Figure S5B), consistent with previ-
ous reports (Castell et al., 1989; Wunderlich et al., 2010). We
also tested if hyperglycemia induced by IL-6 during stress was
itself sufficient to prime LPS responses, and thus challenged an-
imals to exogenous glucose to achieve stress hyperglycemia or
an isocaloric isovolumetric dose of lipid, and found that glucose,
but not lipid, was sufficient to prime the LPS response
(Figure S5C).
To determine how stress-priming enhanced inflammation-
mediated mortality, we first measured cytokine levels and tissue
inflammatory gene induction. We did not detect significant
changes in circulating or tissue inflammatory cytokines post-
LPS in a variety of experimental settings, nor did we detect any
changes in tissue inflammatory transcripts or body temperature
(Figures S5D–S5R and S6D). Thus, we hypothesized that stress-
induced IL-6 might be affecting host tolerance (Ferreira et al.,
2011;Wang et al., 2016; Weis et al., 2017). Because our previous
work isolated key brainstem functions (likemaintaining heart and
respiratory rate) as a target of host tolerance, we also assessed
these parameters using our stress paradigm, but did not find sig-
nificant differences (Figures S6A–S6F). We also did not find large
differences in maintaining glycemia, fatty acid, or ketone body
levels (Figures S6I–S6K), which we had previously shown to be
important in host tolerance to LPS (Wang et al., 2016). Because
end-organ dysfunction is a hallmark of inflammatory damage, we
assessed biomarkers of vital organ function in stress-primed
versus control animals and found that stress-primed animals dis-
played significantly more renal and a trend toward more cardiac
damage, whereas hepatic damage appeared to be equivalent
across conditions (Figures 6G, S6G, and S6H). These markers
of end-organ damage were absent in stress-primed Il6f/fDUCP1
animals (Figure 6H), demonstrating that BAT-derived IL-6 from
stress was required for decreasing tolerance to inflammatory
damage. Together, these findings suggest that stress decrease-
shost tolerance to inflammation in a BAT-derived IL-6-depen-
dent fashion. The precisemechanism by which stress decreases
host fitness to inflammation remains to be understood. Alto-
gether, our studies suggest that stress-induced IL-6, although
adaptive for supporting fight-or-flight physiology, comes at the
cost of decreasing host fitness to endotoxemia-induced
inflammation.
DISCUSSION
Psychological stress has been known to induce endocrine IL-6
for nearly 30 years and has been shown in multiple species,
including rats, mice, and humans (Cheng et al., 2015; LeMay
et al., 1990; Maes et al., 1998). However, mechanistic under-
standing for this phenomenon has not been addressed. The
evolutionary basis for IL-6 induction during acute stress was un-
known, and how this might connect to the long-observed
connection between stress, metabolism, and inflammation was
also unclear. Our study demonstrates that stress-induced IL-6
is produced from brown adipocytes in an ADRB3-dependent
fashion in mice. Thermogenic programs were not engaged in
this context, and this response was independent of ambient

Figure 6. ADRB3-dependent IL-6 from BAT potentiates lethal endotoxemia secondary to acute stress
(A) Survival rate of LPS-induced endotoxemia in mice pre-exposed to the indicated stressors (n = 10 per group). Abbreviations are as follows: NT, no treatment;
TR, tube restraint.
(B) Survival of endotoxemic animals pretreated with vehicle (n = 8), ADRB1 and ADRB2 agonist (ADRB1/2, n = 7) or ADRB3 agonist (ADRB3, n = 9).
(C) Survival of endotoxemic animals pretreated with a stress dose of IL-6 (n = 8 per group).
(D) Survival of endotoxemic animals pretreatedwith the indicated interventions. n = 9 for tube restraint (TR), n = 10 for TRwith ketamine, n = 8 for IL-6, n = 9 for IL-6
with ketamine.
(E) Survival rate of endotoxemic mice pre-exposed to restraint with ADRB3 antagonist or vehicle injection. TR, tube restraint (n = 10 per group).
(F) Lethality in endotoxemia from mice pre-exposed to restraint with brown adipose tissue specific deletion of Il6 (Il6f/fDUCP1) compared with littermate controls
(Il6f/f) (n = 10 per group).
(G) Circulating creatinine (Cr) levels 0 or 24 h post LPS injection from mice pre-exposed to bleeding or restraint stress (n = 5 per group). Abbreviations are as
follows: NT, no treatment; TR, tube restraint.
(H) Circulating creatinine (Cr) levels 0 or 24 h post LPS injection from mice pre-exposed to restraint stress with brown adipose tissue specific deletion of Il6 (Il6f/
fDUCP1) compared with littermate controls (Il6f/f) (n = 5 per group). TR, tube restraint. Data are represented as mean ± SEM. *p < 0.05, **p < 0.01, ***p < 0.001,
****p < 0.0001
See also Figures S5 and S6.
llArticle
temperature. One key role of stress-induced endocrine IL-6 is in
reprogramming organismal metabolism by instructing hepatic
gluconeogenesis in the absence of a net negative energy bal-
ance or hypoglycemic state, likely in anticipation of increased
glucose demand. Hepatic IL-6 signaling was also necessary
for mediating normal behavioral responses in the light-dark
box paradigm suggesting that hepatic organismal reprogram-
ming is required for an adaptive ‘‘fight or flight’’ response. Finally,
we found that stress-induced BAT-derived endocrine IL-6 was
necessary and sufficient for decreasing host tolerance to a sub-
sequent inflammatory response by using the endotoxe-
mia model.
Cell 182, 372–387, July 23, 2020 381

llArticle
Gluconeogenesis is normally not engaged in positive energy
balance states, with the exception of forced exercise (Banzet
et al., 2009). In this setting, IL-6 is derived frommyocytes and in-
duces hepatic gluconeogenesis. In our study, we did not observe
any IL-6 induction inmuscle, nor did we observe increased activ-
ity after stress, and instead found that brown adipocytes were
indispensable in the setting of acute stress. It is interesting to
speculate why IL-6, which can be derived from many different
cell types, is produced by brown adipocytes in this context.
The BAT has a number of features thatmake it an ideal endocrine
organ responsive to acute psychologic stress. It is highly inner-
vated, and thus capable of immediate responsiveness after
detection of stress, a feature that has been clearly demonstrated
in acute cold exposure for the purpose of defending body tem-
perature. In addition, blood flow through BAT can be quickly
increased (hyperemia) (Abreu-Vieira et al., 2015) and, in the
setting of acute cold exposure, is optimal for quickly circulating
warmed blood, or, in this case, a stress hormone. Interestingly,
BAT hyperemia and thermogenesis can be decoupled, suggest-
ing that there could be scenarios where uncoupled respiration is
not necessary for hyperemia (Abreu-Vieira et al., 2015). In our
study, we did not find that ambient temperature played a role
in stress-inducible IL-6, observe transcriptional induction of the
thermogenic program, find differences in body temperature as
a function of IL-6 signaling, or demonstrate a requirement for
UCP1. We speculate that perhaps through other contextual in-
puts, such as the cold-sensor TRPM8 (Ma et al., 2012; Moraes
et al., 2017), might be required to activate the full thermogenic
program. From this perspective, BAT can thus be considered a
stress-responsive endocrine organ that might have several re-
sponses depending on other contextual inputs. Finally, BAT is
highly enriched in ADRB3. Unlike ADRB1 or ADRB2, ADRB3
has been shown to be less easily desensitized (Rouget et al.,
2004), thus providing more durable responsiveness to adren-
ergic outflow. Consistent with this idea, we found that repeated
stress-exposure over the course of 24 h maintained elevated
plasma IL-6 levels. The role of BAT in adult humans is controver-
sial because its detection is dependent upon the approach em-
ployed (Leitner et al., 2017; Porter et al., 2016; van Marken Lich-
tenbelt et al., 2009). It is principally confined to clavicular and
para-aortic areas, which might be why less stress-associated
IL-6 is recovered in humans than in mice if it is even made in hu-
man BAT at all (Maes et al., 1998). On the other hand, recent
work suggests that BAT of ‘‘humanized’’ mice is notably similar
to human BAT (de Jong et al., 2019). It remains unclear how
the mechanistic insights from our studies in rodents will translate
to humans.
Our work further highlights the complexity of adrenergic
signaling in physiology. Although signaling on ADRB2 in immune
cells has largely been shown to be anti-inflammatory (A�gac et al.,
2018; Nance and Sanders, 2007), our study suggests that
ADRB3 activation after acute stress exposure might be detri-
mental for adaptation to a subsequent inflammatory challenge.
The clinical observation that sympathetic mimetics enhance sur-
vival in septic shock might be resultant from the effects of supra-
physiological dosing on supporting blood pressure that might be
the dominant mechanism of protection regardless of its other
effects.
382 Cell 182, 372–387, July 23, 2020
Like adrenergic biology, the role of IL-6 in inflammation and
metabolism is similarly complex. IL-6 is generally considered a
pro-inflammatory cytokine, which is supported by the efficacy
of IL-6 blockade in inflammatory diseases (Kotch et al., 2019).
On the other hand, several studies demonstrate an anti-inflam-
matory role for IL-6 (Mauer et al., 2014; Nandi et al., 2010). In
our study, we demonstrate that BAT-derived IL-6 is required
for stress to enhance end-organ damage and mortality caused
by the LPS model. Likewise, we found that pre-exposure to
peak plasma levels of stress-induced IL-6 was sufficient to in-
crease end-organ damage and potentiate mortality. In the LPS
model, which might not be generalizable to other models of
inflammation, we found that although stress did not meaningfully
increase inflammatory magnitude, hemodynamic or cardiopul-
monary parameters, or gross metabolic parameters, it nonethe-
less led to measurable worsening of end-organ function and
death. The mechanism underlying this phenomenon is unclear,
but likely is a result of stress-induced IL-6-dependent metabolic
re-programming similar to that which has been previously pub-
lished by our group and others (Ganeshan et al., 2019; Luan
et al., 2019; Wang et al., 2016; Luan et al., 2019; Weis et al.,
2017). Whether other types of inflammatory challenges would
also be affected by the models of acute stress used here, and,
more generally, how different types, degrees, and durations of
stress affect tissue tolerance in different inflammatory settings
is an open question, as is the precise mechanism for how IL-6
primes LPS-mediated mortality. Moreover, it remains unclear if
the elevated levels of circulating IL-6 seen in aging and obesity
or after exercise would also drive differences in host tolerance
to inflammation. Similarly, from a metabolic perspective, IL-6
has been shown to be both insulin sensitizing and insulin desen-
sitizing depending on the context. In contexts of chronically
increased IL-6 such as obesity or rheumatoid arthritis, IL-6 has
been shown to induce insulin resistance (Castaneda et al.,
2019; Kim et al., 2004; Perry et al., 2015). On the other hand, in
these same contexts, others have shown that IL-6 induces insu-
lin sensitivity (Carey et al., 2006; Findeisen et al., 2019; Matthews
et al., 2010; Mauer et al., 2014; Steensberg et al., 2003; Timper
et al., 2017), whereas IL-6 has been shown to be insulin sensi-
tizing in exercise (Benrick et al., 2012). Our study did not find
that IL-6 was playing a role in insulin sensitivity after stress.
Our animals were all lean, chow-fed animals, and thus in a net
energy positive state. One main finding of our study is that IL-6
is a distinct inductive signal to instruct hepatic gluconeogenesis
during net energy positive states. Unlike during fasting, keto-
genic diets, or other hypoglycemic states where gluconeogen-
esis programs aremediated primarily by CREB/FoxO1 programs
(Oh et al., 2013), which are responsive to low energy states,
stress induces gluconeogenesis even in net positive energy bal-
ance states. Our data suggest that IL-6 signaling in hepatocytes
is required for gluconeogenesis in non-net negative energy bal-
ance states. Although IL-6 does not appear to increase gluco-
neogenesis at rest (Steensberg et al., 2003), our studies resonate
well with other studies demonstrating STAT3 regulation of the
same gluconeogenic genes such as Pck1 and G6pc and with
studies demonstrating a role for IL-6 in exercise-mediated he-
patic gluconeogenesis (Banzet et al., 2009). Here, it is interesting
to consider the similarities between psychological stress and
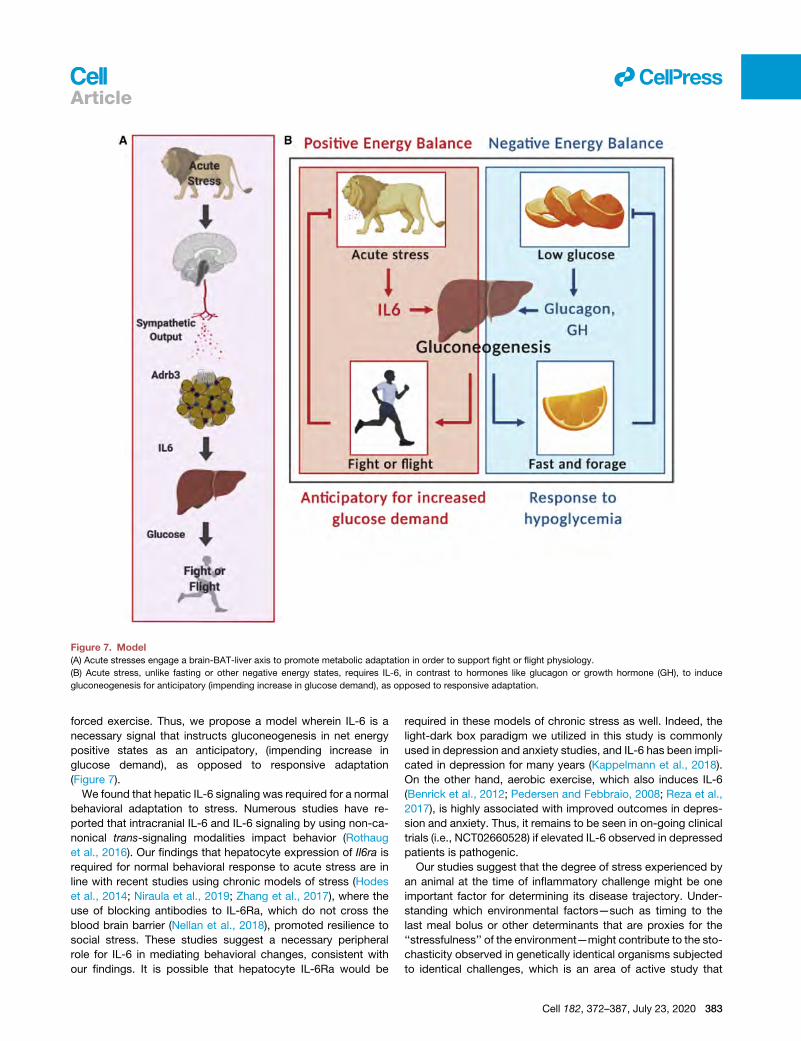
Figure 7. Model
(A) Acute stresses engage a brain-BAT-liver axis to promote metabolic adaptation in order to support fight or flight physiology.
(B) Acute stress, unlike fasting or other negative energy states, requires IL-6, in contrast to hormones like glucagon or growth hormone (GH), to induce
gluconeogenesis for anticipatory (impending increase in glucose demand), as opposed to responsive adaptation.
llArticle
forced exercise. Thus, we propose a model wherein IL-6 is a
necessary signal that instructs gluconeogenesis in net energy
positive states as an anticipatory, (impending increase in
glucose demand), as opposed to responsive adaptation
(Figure 7).
We found that hepatic IL-6 signaling was required for a normal
behavioral adaptation to stress. Numerous studies have re-
ported that intracranial IL-6 and IL-6 signaling by using non-ca-
nonical trans-signaling modalities impact behavior (Rothaug
et al., 2016). Our findings that hepatocyte expression of Il6ra is
required for normal behavioral response to acute stress are in
line with recent studies using chronic models of stress (Hodes
et al., 2014; Niraula et al., 2019; Zhang et al., 2017), where the
use of blocking antibodies to IL-6Ra, which do not cross the
blood brain barrier (Nellan et al., 2018), promoted resilience to
social stress. These studies suggest a necessary peripheral
role for IL-6 in mediating behavioral changes, consistent with
our findings. It is possible that hepatocyte IL-6Ra would be
required in these models of chronic stress as well. Indeed, the
light-dark box paradigm we utilized in this study is commonly
used in depression and anxiety studies, and IL-6 has been impli-
cated in depression for many years (Kappelmann et al., 2018).
On the other hand, aerobic exercise, which also induces IL-6
(Benrick et al., 2012; Pedersen and Febbraio, 2008; Reza et al.,
2017), is highly associated with improved outcomes in depres-
sion and anxiety. Thus, it remains to be seen in on-going clinical
trials (i.e., NCT02660528) if elevated IL-6 observed in depressed
patients is pathogenic.
Our studies suggest that the degree of stress experienced by
an animal at the time of inflammatory challenge might be one
important factor for determining its disease trajectory. Under-
standing which environmental factors—such as timing to the
last meal bolus or other determinants that are proxies for the
‘‘stressfulness’’ of the environment—might contribute to the sto-
chasticity observed in genetically identical organisms subjected
to identical challenges, which is an area of active study that
Cell 182, 372–387, July 23, 2020 383

llArticle
might shed insight into mechanistic determinants of disease
trajectories.
In summary, this study identifies a brain-BAT-liver axis in mice
whereby IL-6 modulates glucose metabolism under conditions
of acute stress and suggests that there is an adaptive purpose
for inducing IL-6 in acute stress. We speculate that maladaptive
states might arise in chronic stress where IL-6 becomes persis-
tently elevated. Whether or not ADRB3 or IL-6Ra receptor
biology changes as a function of chronic IL-6 states, as has
been shown for the glucocorticoid and insulin receptors
(Boucher et al., 2014; Cohen et al., 2012), remains to be seen.
Should this brain-BAT-liver axis also be relevant in humans,
our findings have implications for the pathogenesis of psychiatric
diseases such as seasonal affective disorder, where depression
occurs primarily as a function of cold and dark seasons,
and also implicate ADRB3 and IL-6 as potential therapeutic tar-
gets for preventing disease flares in conditions of pathologic
inflammation.
Limitations of studyThese experiments were performed on mice in a single facility
and largely on the C57BL/6J genetic background. The impact
of the microbiota, genetic background, and facility-specific fac-
tors are unknown, and the unnatural settings in animal facilities
likely affect the results and interpretation of physiology studies,
including this one. It is likely that stress-induced IL-6 plays addi-
tional roles besides those described in our studies. There are a
number of open questions raised by our study. Does psycholog-
ical stress affect all types of inflammation the same? How do
different stressors and degrees of stress affect inflammation?
Are our observations informative for placebo and nocebo
biology? Finally, the translatability of this study to humans is to
be determined.
STAR+METHODS
Detailed methods are provided in the online version of this paper
and include the following:
d KEY RESOURCES TABLE
d RESOURCE AVAILABILITY
384
B Lead Contact
B Materials Availability
B Data and Code Availability
d EXPERIMENTAL MODEL AND SUBJECT DETAILS
B Mice
B Human Subjects
d METHOD DETAILS
B Quantification of Plasma Cytokines
B Quantification of Plasma Metabolites, Hormones, and
Organ Injury Markers
B Surgical Removal of Brown Adipose Tissue
B Metabolic Tolerance Tests
B Endogenous Glucose Production and Palmitate
Turnover
B qRT-PCR
B Stromal Vascular Fraction Isolation
B Metabolic Cage
Cell 182, 372–387, July 23, 2020
B Ambulatory Blood Pressure Measurements
B Behavioral Tests
B Immunohistochemistry
d QUANTIFICATION AND STATISTICAL ANALYSIS
SUPPLEMENTAL INFORMATION
Supplemental Information can be found online at https://doi.org/10.1016/j.
cell.2020.05.054.
ACKNOWLEDGMENTS
We thank members of the Wang, Picciotto, Sinha, and Perry labs for helpful
discussions. We are indebted to Dr. Ruslan Medzhitov for his guidance and
support. We thank Ali Nasiri and Wanling Zhu for the mouse metabolic flux
phenotyping, Dr. Mamula’s lab for sharing equipment, and Dr. Akiko Iwasaki
for use of thermoneutral cabinets. We thank Mrs. Krista Wang, Dr. Ruth
Franklin, and Dr. Harding Luan for review of the manuscript. Invasive hemody-
namic monitoring was performed through the George M. O’Brien Kidney Cen-
ter at Yale (NIH P30-DK079310). A.W. was supported by the NIHClinical Inves-
tigator Award (K08AI128745). K.I.-W. was supported by a Gruber Fellowship.
Metabolic flux analysis performed in the Perry lab was supported by an NIH
Pathway to Independence Award (K99/R00 CA215315) to R.J.P. M.R.P. was
supported by NIH grants DA050986, MH077681, and DA14241. R.S. was sup-
ported by NIH grant R01-DK099039.
AUTHOR CONTRIBUTIONS
H.Q. and R.D. contributed equally to this work. H.Q., R.D., and A.W. designed
the study, analyzed the data, and wrote the manuscript with input from the
other authors. H.Q. and R.D. performed the experiments with assistance
from K.I.-W. and C.Z. R.J.P. performed all analyses for flux studies. S.R. in
the laboratory of N.W.P. assisted with experiments with gnotobiotic animals.
N.F. in the laboratory of R.S. collected all human samples, performed the an-
alyses, and provided input into stress biology. Y.M., in the laboratory of M.R.P.
provided assistance with behavioral studies.
DECLARATION OF INTERESTS
The authors declare no competing interests.
Received: August 26, 2019
Revised: March 16, 2020
Accepted: May 28, 2020
Published: June 30, 2020; corrected online: August 10, 2020
REFERENCES
Abreu-Vieira, G., Hagberg, C.E., Spalding, K.L., Cannon, B., and Nedergaard,
J. (2015). Adrenergically stimulated blood flow in brown adipose tissue is not
dependent on thermogenesis. Am. J. Physiol. Endocrinol. Metab. 308,
E822–E829.
A�gac, D., Estrada, L.D., Maples, R., Hooper, L.V., and Farrar, J.D. (2018). The
b2-adrenergic receptor controls inflammation by driving rapid IL-10 secretion.
Brain Behav. Immun. 74, 176–185.
Ansell, E.B., Rando, K., Tuit, K., Guarnaccia, J., and Sinha, R. (2012). Cumula-
tive adversity and smaller gray matter volume in medial prefrontal, anterior
cingulate, and insula regions. Biol. Psychiatry 72, 57–64.
Aune, U.L., Ruiz, L., and Kajimura, S. (2013). Isolation and differentiation of
stromal vascular cells to beige/brite cells. J. Vis. Exp. (73), 50191.
Banzet, S., Koulmann, N., Simler, N., Sanchez, H., Chapot, R., Serrurier, B.,
Peinnequin, A., and Bigard, X. (2009). Control of gluconeogenic genes during
intense/prolonged exercise: hormone-independent effect of muscle-derived
IL-6 on hepatic tissue and PEPCK mRNA. J. Appl. Physiol. (1985) 107,
1830–1839.

llArticle
Batty, G.D., Russ, T.C., Stamatakis, E., and Kivimaki, M. (2017). Psychological
distress in relation to site specific cancer mortality: pooling of unpublished
data from 16 prospective cohort studies. BMJ 356, j108.
Benrick, A., Wallenius, V., and Asterholm, I.W. (2012). Interleukin-6 mediates
exercise-induced increase in insulin sensitivity in mice. Exp. Physiol. 97,
1224–1235.
Bethin, K.E., Vogt, S.K., and Muglia, L.J. (2000). Interleukin-6 is an essential,
corticotropin-releasing hormone-independent stimulator of the adrenal axis
during immune system activation. Proc. Natl. Acad. Sci. USA 97, 9317–9322.
Black, D.S., and Slavich, G.M. (2016). Mindfulness meditation and the immune
system: a systematic review of randomized controlled trials. Ann. N Y Acad.
Sci. 1373, 13–24.
Boden, G., Chen, X., Ruiz, J., White, J.V., and Rossetti, L. (1994). Mechanisms
of fatty acid-induced inhibition of glucose uptake. J. Clin. Invest. 93,
2438–2446.
Boucher, J., Kleinridders, A., and Kahn, C.R. (2014). Insulin receptor signaling
in normal and insulin-resistant states. Cold Spring Harb. Perspect. Biol. 6,
a009191.
Bourin, M., and Hascoet, M. (2003). The mouse light/dark box test. Eur. J.
Pharmacol. 463, 55–65.
Carey, A.L., Steinberg, G.R., Macaulay, S.L., Thomas, W.G., Holmes, A.G.,
Ramm, G., Prelovsek, O., Hohnen-Behrens, C., Watt, M.J., James, D.E.,
et al. (2006). Interleukin-6 increases insulin-stimulated glucose disposal in hu-
mans and glucose uptake and fatty acid oxidation in vitro via AMP-activated
protein kinase. Diabetes 55, 2688–2697.
Castaneda, S., Remuzgo-Martınez, S., Lopez-Mejıas, R., Genre, F., Calvo-
Alen, J., Llorente, I., Aurrecoechea, E., Ortiz, A.M., Triguero, A., Blanco, R.,
et al. (2019). Rapid beneficial effect of the IL-6 receptor blockade on insulin
resistance and insulin sensitivity in non-diabetic patients with rheumatoid
arthritis. Clin. Exp. Rheumatol. 37, 465–473.
Castell, J.V., Gomez-Lechon, M.J., David, M., Andus, T., Geiger, T., Trullen-
que, R., Fabra, R., and Heinrich, P.C. (1989). Interleukin-6 is the major regu-
lator of acute phase protein synthesis in adult human hepatocytes. FEBS
Lett. 242, 237–239.
Cheng, Y., Jope, R.S., and Beurel, E. (2015). A pre-conditioning stress accel-
erates increases in mouse plasma inflammatory cytokines induced by stress.
BMC Neurosci. 16, 31.
Chowdhury, S., Schulz, L., Palmisano, B., Singh, P., Berger, J.M., Yadav, V.K.,
Mera, P., Ellingsgaard, H., Hidalgo, J., Bruning, J., and Karsenty, G. (2020).
Muscle-derived Interleukin 6 Increases Exercise Capacity by Signaling in Os-
teoblasts. J. Clin. Invest. 130, 2888–2902.
Cohen, S., Janicki-Deverts, D., Doyle, W.J., Miller, G.E., Frank, E., Rabin, B.S.,
and Turner, R.B. (2012). Chronic stress, glucocorticoid receptor resistance,
inflammation, and disease risk. Proc. Natl. Acad. Sci. USA 109, 5995–5999.
Covarrubias, A.J., and Horng, T. (2014). IL-6 strikes a balance in metabolic
inflammation. Cell Metab. 19, 898–899.
de Jong, J.M.A., Sun, W., Pires, N.D., Frontini, A., Balaz, M., Jespersen, N.Z.,
Feizi, A., Petrovic, K., Fischer, A.W., Bokhari, M.H., et al. (2019). Human brown
adipose tissue is phenocopied by classical brown adipose tissue in physiolog-
ically humanized mice. Nat. Metab. 1, 830–843.
Depocas, F., Foster, D.O., Zaror-Behrens, G., Lacelle, S., and Nadeau, B.
(1984). Recovery of function in sympathetic nerves of interscapular brown ad-
ipose tissue of rats treated with 6-hydroxydopamine. Can. J. Physiol. Pharma-
col. 62, 1327–1332.
Eisner, M.D., Katz, P.P., Lactao, G., and Iribarren, C. (2005). Impact of depres-
sive symptoms on adult asthma outcomes. Ann. Allergy Asthma Immunol. 94,
566–574.
Esposito, K., Nappo, F., Marfella, R., Giugliano, G., Giugliano, F., Ciotola, M.,
Quagliaro, L., Ceriello, A., andGiugliano, D. (2002). Inflammatory cytokine con-
centrations are acutely increased by hyperglycemia in humans: role of oxida-
tive stress. Circulation 106, 2067–2072.
Febbraio, M.A., Hiscock, N., Sacchetti, M., Fischer, C.P., and Pedersen, B.K.
(2004). Interleukin-6 is a novel factor mediating glucose homeostasis during
skeletal muscle contraction. Diabetes 53, 1643–1648.
Felger, J.C., and Lotrich, F.E. (2013). Inflammatory cytokines in depression:
neurobiological mechanisms and therapeutic implications. Neuroscience
246, 199–229.
Ferreira, A., Marguti, I., Bechmann, I., Jeney, V., Chora, A., Palha, N.R., Re-
belo, S., Henri, A., Beuzard, Y., and Soares, M.P. (2011). Sickle hemoglobin
confers tolerance to Plasmodium infection. Cell 145, 398–409.
Findeisen, M., Allen, T.L., Henstridge, D.C., Kammoun, H., Brandon, A.E.,
Baggio, L.L., Watt, K.I., Pal, M., Cron, L., Estevez, E., et al. (2019). Treatment
of type 2 diabetes with the designer cytokine IC7Fc. Nature 574, 63–68.
Frank, M.G., Watkins, L.R., and Maier, S.F. (2013). Stress-induced glucocorti-
coids as a neuroendocrine alarm signal of danger. Brain Behav. Immun.
33, 1–6.
Ganeshan, K., Nikkanen, J., Man, K., Leong, Y.A., Sogawa, Y., Maschek, J.A.,
Van Ry, T., Chagwedera, D.N., Cox, J.E., and Chawla, A. (2019). Energetic
Trade-Offs and Hypometabolic States Promote Disease Tolerance. Cell 177,
399–413.
Gao, Y., Liu, F., Fang, L., Cai, R., Zong, C., and Qi, Y. (2014). Genkwanin in-
hibits proinflammatory mediators mainly through the regulation of miR-101/
MKP-1/MAPK pathway in LPS-activated macrophages. PLoS ONE 9, e96741.
Greenhill, C.J., Rose-John, S., Lissilaa, R., Ferlin, W., Ernst, M., Hertzog, P.J.,
Mansell, A., and Jenkins, B.J. (2011). IL-6 trans-signaling modulates TLR4-
dependent inflammatory responses via STAT3. J. Immunol. 186, 1199–1208.
Hippocrates. (1849). The genuine works of Hippocrates/translated from the
Greek, with a preliminary discourse and annotations by Francis Adams, in
two volumes (The Sydenham Society).
Hodes, G.E., Pfau, M.L., Leboeuf, M., Golden, S.A., Christoffel, D.J., Bregman,
D., Rebusi, N., Heshmati, M., Aleyasin, H., Warren, B.L., et al. (2014). Individual
differences in the peripheral immune system promote resilience versus sus-
ceptibility to social stress. Proc. Natl. Acad. Sci. USA 111, 16136–16141.
Hunter, C.A., and Jones, S.A. (2015). IL-6 as a keystone cytokine in health and
disease. Nat. Immunol. 16, 448–457.
Kappelmann, N., Lewis, G., Dantzer, R., Jones, P.B., and Khandaker, G.M.
(2018). Antidepressant activity of anti-cytokine treatment: a systematic review
and meta-analysis of clinical trials of chronic inflammatory conditions. Mol.
Psychiatry 23, 335–343.
Kataoka, N., Hioki, H., Kaneko, T., and Nakamura, K. (2014). Psychological
stress activates a dorsomedial hypothalamus-medullary raphe circuit driving
brown adipose tissue thermogenesis and hyperthermia. Cell Metab. 20,
346–358.
Kawate, R., Talan, M.I., and Engel, B.T. (1994). Sympathetic nervous activity to
brown adipose tissue increases in cold-tolerant mice. Physiol. Behav. 55,
921–925.
Kelly, J.R., Kennedy, P.J., Cryan, J.F., Dinan, T.G., Clarke, G., and Hyland,
N.P. (2015). Breaking down the barriers: the gut microbiome, intestinal perme-
ability and stress-related psychiatric disorders. Front. Cell. Neurosci. 9, 392.
Khandaker, G.M., Pearson, R.M., Zammit, S., Lewis, G., and Jones, P.B.
(2014). Association of serum interleukin 6 and C-reactive protein in childhood
with depression and psychosis in young adult life: a population-based longitu-
dinal study. JAMA Psychiatry 71, 1121–1128.
Khokha, R., Murthy, A., andWeiss, A. (2013). Metalloproteinases and their nat-
ural inhibitors in inflammation and immunity. Nat. Rev. Immunol. 13, 649–665.
Kim, H.J., Higashimori, T., Park, S.Y., Choi, H., Dong, J., Kim, Y.J., Noh, H.L.,
Cho, Y.R., Cline, G., Kim, Y.B., and Kim, J.K. (2004). Differential effects of inter-
leukin-6 and -10 on skeletal muscle and liver insulin action in vivo. Diabetes 53,
1060–1067.
Kosteli, A., Sugaru, E., Haemmerle, G., Martin, J.F., Lei, J., Zechner, R., and
Ferrante, A.W., Jr. (2010). Weight loss and lipolysis promote a dynamic im-
mune response in murine adipose tissue. J. Clin. Invest. 120, 3466–3479.
Cell 182, 372–387, July 23, 2020 385

llArticle
Kotch, C., Barrett, D., and Teachey, D.T. (2019). Tocilizumab for the treatment
of chimeric antigen receptor T cell-induced cytokine release syndrome. Expert
Rev. Clin. Immunol. 15, 813–822.
Lee, M.W., Odegaard, J.I., Mukundan, L., Qiu, Y., Molofsky, A.B., Nussbaum,
J.C., Yun, K., Locksley, R.M., and Chawla, A. (2015). Activated type 2 innate
lymphoid cells regulate beige fat biogenesis. Cell 160, 74–87.
Leitner, B.P., Huang, S., Brychta, R.J., Duckworth, C.J., Baskin, A.S., McGe-
hee, S., Tal, I., Dieckmann, W., Gupta, G., Kolodny, G.M., et al. (2017). Map-
ping of human brown adipose tissue in lean and obese young men. Proc.
Natl. Acad. Sci. USA 114, 8649–8654.
LeMay, L.G., Vander, A.J., and Kluger, M.J. (1990). The effects of psycholog-
ical stress on plasma interleukin-6 activity in rats. Physiol. Behav. 47, 957–961.
Liu, L.Y., Coe, C.L., Swenson, C.A., Kelly, E.A., Kita, H., and Busse, W.W.
(2002). School examinations enhance airway inflammation to antigen chal-
lenge. Am. J. Respir. Crit. Care Med. 165, 1062–1067.
Liu, Y.Z., Wang, Y.X., and Jiang, C.L. (2017). Inflammation: The Common
Pathway of Stress-Related Diseases. Front. Hum. Neurosci. 11, 316.
Luan, H.H., Wang, A., Hilliard, B.K., Carvalho, F., Rosen, C.E., Ahasic, A.M.,
Herzog, E.L., Kang, I., Pisani, M.A., Yu, S., et al. (2019). GDF15 Is an Inflamma-
tion-Induced Central Mediator of Tissue Tolerance. Cell 178, 1231–1244.
Ma, S., Yu, H., Zhao, Z., Luo, Z., Chen, J., Ni, Y., Jin, R., Ma, L., Wang, P., Zhu,
Z., et al. (2012). Activation of the cold-sensing TRPM8 channel triggers UCP1-
dependent thermogenesis and prevents obesity. J. Mol. Cell Biol. 4, 88–96.
Maes, M., Song, C., Lin, A., De Jongh, R., Van Gastel, A., Kenis, G., Bosmans,
E., De Meester, I., Benoy, I., Neels, H., et al. (1998). The effects of psycholog-
ical stress on humans: increased production of pro-inflammatory cytokines
and a Th1-like response in stress-induced anxiety. Cytokine 10, 313–318.
Masuda, K., Ripley, B., Nishimura, R., Mino, T., Takeuchi, O., Shioi, G., Kiyo-
nari, H., and Kishimoto, T. (2013). Arid5a controls IL-6 mRNA stability, which
contributes to elevation of IL-6 level in vivo. Proc. Natl. Acad. Sci. USA 110,
9409–9414.
Matthews, V.B., Allen, T.L., Risis, S., Chan, M.H., Henstridge, D.C., Watson,
N., Zaffino, L.A., Babb, J.R., Boon, J., Meikle, P.J., et al. (2010). Interleukin-
6-deficient mice develop hepatic inflammation and systemic insulin resis-
tance. Diabetologia 53, 2431–2441.
Mauer, J., Chaurasia, B., Goldau, J., Vogt, M.C., Ruud, J., Nguyen, K.D., The-
urich, S., Hausen, A.C., Schmitz, J., Bronneke, H.S., et al. (2014). Signaling by
IL-6 promotes alternative activation of macrophages to limit endotoxemia and
obesity-associated resistance to insulin. Nat. Immunol. 15, 423–430.
Mineur, Y.S., Somenzi, O., and Picciotto, M.R. (2007). Cytisine, a partial
agonist of high-affinity nicotinic acetylcholine receptors, has antidepressant-
like properties in male C57BL/6J mice. Neuropharmacology 52, 1256–1262.
Mohr, D.C., Hart, S.L., Julian, L., Cox, D., and Pelletier, D. (2004). Association
between stressful life events and exacerbation in multiple sclerosis: a meta-
analysis. BMJ 328, 731.
Moraes, M.N., de Assis, L.V.M., Henriques, F.D.S., Batista, M.L., Jr., Guler,
A.D., and Castrucci, A.M.L. (2017). Cold-sensing TRPM8 channel participates
in circadian control of the brown adipose tissue. Biochim. Biophys. Acta Mol.
Cell Res. 1864, 2415–2427.
Munck, A., Guyre, P.M., and Holbrook, N.J. (1984). Physiological functions of
glucocorticoids in stress and their relation to pharmacological actions. Endocr.
Rev. 5, 25–44.
Nance, D.M., and Sanders, V.M. (2007). Autonomic innervation and regulation
of the immune system (1987-2007). Brain Behav. Immun. 21, 736–745.
Nandi, D., Mishra, M.K., Basu, A., and Bishayi, B. (2010). Protective effects of
interleukin-6 in lipopolysaccharide (LPS)-induced experimental endotoxemia
are linked to alteration in hepatic anti-oxidant enzymes and endogenous cyto-
kines. Immunobiology 215, 443–451.
Nellan, A., McCully, C.M.L., Cruz Garcia, R., Jayaprakash, N., Widemann,
B.C., Lee, D.W., and Warren, K.E. (2018). Improved CNS exposure to tocilizu-
mab after cerebrospinal fluid compared to intravenous administration in rhe-
sus macaques. Blood 132, 662–666.
386 Cell 182, 372–387, July 23, 2020
Nguyen, N.L., Barr, C.L., Ryu, V., Cao, Q., Xue, B., and Bartness, T.J. (2017).
Separate and shared sympathetic outflow to white and brown fat coordinately
regulates thermoregulation and beige adipocyte recruitment. Am. J. Physiol.
Regul. Integr. Comp. Physiol. 312, R132–R145.
Niraula, A., Witcher, K.G., Sheridan, J.F., and Godbout, J.P. (2019). Inter-
leukin-6 Induced by Social Stress Promotes a Unique Transcriptional Signa-
ture in the Monocytes That Facilitate Anxiety. Biol. Psychiatry 85, 679–689.
Oh, K.J., Han, H.S., Kim, M.J., and Koo, S.H. (2013). CREB and FoxO1: two
transcription factors for the regulation of hepatic gluconeogenesis. BMB
Rep. 46, 567–574.
Osuchowski, M.F., Welch, K., Siddiqui, J., and Remick, D.G. (2006). Circu-
lating cytokine/inhibitor profiles reshape the understanding of the SIRS/
CARS continuum in sepsis and predict mortality. J. Immunol. 177, 1967–1974.
Path, G., Scherbaum, W.A., and Bornstein, S.R. (2000). The role of interleukin-
6 in the human adrenal gland. Eur. J. Clin. Invest. 30 (Suppl 3 ), 91–95.
Pbert, L., Madison, J.M., Druker, S., Olendzki, N., Magner, R., Reed, G., Alli-
son, J., and Carmody, J. (2012). Effect of mindfulness training on asthma qual-
ity of life and lung function: a randomised controlled trial. Thorax 67, 769–776.
Pedersen, B.K., and Febbraio, M.A. (2007). Point: Interleukin-6 does have a
beneficial role in insulin sensitivity and glucose homeostasis. J. Appl. Physiol.
(1985) 102, 814–816.
Pedersen, B.K., and Febbraio, M.A. (2008). Muscle as an endocrine organ:
focus on muscle-derived interleukin-6. Physiol. Rev. 88, 1379–1406.
Perry, R.J., Camporez, J.G., Kursawe, R., Titchenell, P.M., Zhang, D., Perry,
C.J., Jurczak, M.J., Abudukadier, A., Han, M.S., Zhang, X.M., et al. (2015). He-
patic acetyl CoA links adipose tissue inflammation to hepatic insulin resistance
and type 2 diabetes. Cell 160, 745–758.
Perry, R.J., Peng, L., Abulizi, A., Kennedy, L., Cline, G.W., and Shulman, G.I.
(2017a). Mechanism for leptin’s acute insulin-independent effect to reverse
diabetic ketoacidosis. J. Clin. Invest. 127, 657–669.
Perry, R.J., Peng, L., Cline, G.W., Butrico, G.M., Wang, Y., Zhang, X.M., Roth-
man, D.L., Petersen, K.F., and Shulman, G.I. (2017b). Non-invasive assess-
ment of hepatic mitochondrial metabolism by positional isotopomer NMR
tracer analysis (PINTA). Nat. Commun. 8, 798.
Perry, R.J., Wang, Y., Cline, G.W., Rabin-Court, A., Song, J.D., Dufour, S.,
Zhang, X.M., Petersen, K.F., and Shulman, G.I. (2018). Leptin Mediates a
Glucose-Fatty Acid Cycle to Maintain Glucose Homeostasis in Starvation.
Cell 172, 234–248.
Porter, C., Herndon, D.N., Chondronikola, M., Chao, T., Annamalai, P., Bhat-
tarai, N., Saraf, M.K., Capek, K.D., Reidy, P.T., Daquinag, A.C., et al. (2016).
Human and Mouse Brown Adipose Tissue Mitochondria Have Comparable
UCP1 Function. Cell Metab. 24, 246–255.
Qiu, Y., Nguyen, K.D., Odegaard, J.I., Cui, X., Tian, X., Locksley, R.M., Pal-
miter, R.D., and Chawla, A. (2014). Eosinophils and type 2 cytokine signaling
in macrophages orchestrate development of functional beige fat. Cell 157,
1292–1308.
Remick, D.G., Bolgos, G., Copeland, S., and Siddiqui, J. (2005). Role of inter-
leukin-6 in mortality from and physiologic response to sepsis. Infect. Immun.
73, 2751–2757.
Reza, M.M., Subramaniyam, N., Sim, C.M., Ge, X., Sathiakumar, D., McFar-
lane, C., Sharma, M., and Kambadur, R. (2017). Irisin is a pro-myogenic factor
that induces skeletal muscle hypertrophy and rescues denervation-induced
atrophy. Nat. Commun. 8, 1104.
Rothaug, M., Becker-Pauly, C., and Rose-John, S. (2016). The role of inter-
leukin-6 signaling in nervous tissue. Biochim. Biophys. Acta 1863 (6 Pt A),
1218–1227.
Rouget, C., Breuiller-Fouche, M., Mercier, F.J., Leroy, M.J., Loustalot, C., Na-
line, E., Frydman, R., Croci, T., Morcillo, E.J., Advenier, C., and Bardou, M.
(2004). The human near-term myometrial beta 3-adrenoceptor but not the
beta 2-adrenoceptor is resistant to desensitisation after sustained agonist
stimulation. Br. J. Pharmacol. 141, 831–841.
Roussou, E., Iacovou, C., Weerakoon, A., and Ahmed, K. (2013). Stress as a
trigger of disease flares in SLE. Rheumatol. Int. 33, 1367–1370.

llArticle
Russell, G., and Lightman, S. (2019). The human stress response. Nat. Rev.
Endocrinol. 15, 525–534.
Satin, J.R., Linden, W., and Phillips, M.J. (2009). Depression as a predictor of
disease progression and mortality in cancer patients: a meta-analysis. Cancer
115, 5349–5361.
Scheller, J., Chalaris, A., Schmidt-Arras, D., and Rose-John, S. (2011). The
pro- and anti-inflammatory properties of the cytokine interleukin-6. Biochim.
Biophys. Acta 1813, 878–888.
Seo, D., Tsou, K.A., Ansell, E.B., Potenza, M.N., and Sinha, R. (2014). Cumu-
lative adversity sensitizes neural response to acute stress: association with
health symptoms. Neuropsychopharmacology 39, 670–680.
Simpson, R., Booth, J., Lawrence, M., Byrne, S., Mair, F., and Mercer, S.
(2014). Mindfulness based interventions in multiple sclerosis–a systematic re-
view. BMC Neurol. 14, 15.
Steensberg, A., Fischer, C.P., Sacchetti, M., Keller, C., Osada, T., Schjerling,
P., van Hall, G., Febbraio, M.A., and Pedersen, B.K. (2003). Acute inter-
leukin-6 administration does not impair muscle glucose uptake or whole-
body glucose disposal in healthy humans. J. Physiol. 548, 631–638.
Stumvoll, M., Meyer, C., Perriello, G., Kreider, M., Welle, S., and Gerich, J.
(1998). Human kidney and liver gluconeogenesis: evidence for organ substrate
selectivity. Am. J. Physiol. 274, E817–E826.
Timper, K., Denson, J.L., Steculorum, S.M., Heilinger, C., Engstrom-Ruud, L.,
Wunderlich, C.M., Rose-John, S., Wunderlich, F.T., and Bruning, J.C. (2017).
IL-6 Improves Energy andGlucose Homeostasis in Obesity via EnhancedCen-
tral IL-6 trans-Signaling. Cell Rep. 19, 267–280.
Turner, R.J., and Lloyd, D.A. (1995). Lifetime traumas and mental health: the
significance of cumulative adversity. J. Health Soc. Behav. 36, 360–376.
van Marken Lichtenbelt, W.D., Vanhommerig, J.W., Smulders, N.M., Dros-
saerts, J.M., Kemerink, G.J., Bouvy, N.D., Schrauwen, P., and Teule, G.J.
(2009). Cold-activated brown adipose tissue in healthy men. N. Engl. J. Med.
360, 1500–1508.
Vida, M., Gavito, A.L., Pavon, F.J., Bautista, D., Serrano, A., Suarez, J., Arra-
bal, S., Decara, J., Romero-Cuevas, M., de Fonseca, J.R., and Baixeras, E.
(2015). Chronic Administration of Recombinant IL-6 Upregulates Lipogenic
Enzyme Expression and Aggravates High-Fat-Diet-Induced Steatosis in IL-
6-deficient Mice. Dis. Model Mech. 8, 721–731.
Wallenius, V., Wallenius, K., Ahren, B., Rudling, M., Carlsten, H., Dickson, S.L.,
Ohlsson, C., and Jansson, J.O. (2002). Interleukin-6-deficient mice develop
mature-onset obesity. Nat. Med. 8, 75–79.
Wang, A., Huen, S.C., Luan, H.H., Yu, S., Zhang, C., Gallezot, J.D., Booth, C.J.,
and Medzhitov, R. (2016). Opposing Effects of Fasting Metabolism on Tissue
Tolerance in Bacterial and Viral Inflammation. Cell 166, 1512–1525.
Wang, L.C., Yao, H.W., Chang, C.F., Wang, S.W., Wang, S.M., and Chen, S.H.
(2017). Suppression of interleukin-6 increases enterovirus A71 lethality inmice.
J. Biomed. Sci. 24, 94.
Weickert, M.O., and Pfeiffer, A.F. (2006). Signalling mechanisms linking hepat-
ic glucose and lipid metabolism. Diabetologia 49, 1732–1741.
Weis, S., Carlos, A.R., Moita, M.R., Singh, S., Blankenhaus, B., Cardoso, S.,
Larsen, R., Rebelo, S., Schauble, S., Del Barrio, L., et al. (2017). Metabolic
Adaptation Establishes Disease Tolerance to Sepsis. Cell 169, 1263–1275.
Wolf, Y., Boura-Halfon, S., Cortese, N., Haimon, Z., Sar Shalom, H., Kuper-
man, Y., Kalchenko, V., Brandis, A., David, E., Segal-Hayoun, Y., et al.
(2017). Brown-adipose-tissuemacrophages control tissue innervation and ho-
meostatic energy expenditure. Nat. Immunol. 18, 665–674.
Wunderlich, F.T., Strohle, P., Konner, A.C., Gruber, S., Tovar, S., Bronneke,
H.S., Juntti-Berggren, L., Li, L.S., van Rooijen, N., Libert, C., et al. (2010). Inter-
leukin-6 signaling in liver-parenchymal cells suppresses hepatic inflammation
and improves systemic insulin action. Cell Metab. 12, 237–249.
Yan, C., Zhang, B.B., Hua, H., Li, B., Zhang, B., Yu, Q., Li, X.Y., Liu, Y., Pan,W.,
Liu, X.Y., et al. (2015). The Dynamics of Treg/Th17 and the Imbalance of Treg/
Th17 in Clonorchis sinensis-Infected Mice. PLoS ONE 10, e0143217.
Zhang, W., Mottillo, E.P., Zhao, J., Gartung, A., VanHecke, G.C., Lee, J.F.,
Maddipati, K.R., Xu, H., Ahn, Y.H., Proia, R.L., et al. (2014). Adipocyte lipol-
ysis-stimulated interleukin-6 production requires sphingosine kinase 1 activity.
J. Biol. Chem. 289, 32178–32185.
Zhang, C., Wu, Z., Zhao, G., Wang, F., and Fang, Y. (2016). Identification of IL6
as a susceptibility gene for major depressive disorder. Sci. Rep. 6, 31264.
Zhang, J.C., Yao, W., Dong, C., Yang, C., Ren, Q., Ma, M., and Hashimoto, K.
(2017). Blockade of interleukin-6 receptor in the periphery promotes rapid and
sustained antidepressant actions: a possible role of gut-microbiota-brain axis.
Transl. Psychiatry 7, e1138.
Cell 182, 372–387, July 23, 2020 387

llArticle
STAR+METHODS
KEY RESOURCES TABLE
REAGENT or RESOURCE SOURCE IDENTIFIER
Antibodies
Anti-mouse IL6 eBioscience Cat#14-7061-85; RRID: AB_468422
Biotin-conjugated anti-IL6 BD PharMingen Cat#554402; RRID: AB_395368
HRP-conjugated streptavidin BD Bioseiences Cat#554066
Anti-mouse TNFa eBioscience Cat#14-7423-85; RRID: AB_468492
Anti-mouse IL-1b Invitrogen Cat#14-7012-81; RRID: AB_468396
Biotin-conjugated anti-TNFa Invitrogen Cat#13-7349-81; RRID: AB_466952
Biotin-conjugated anti-IL-1b eBioscience Cat#13-7112-85; RRID: AB_466925
InVivoMAb anti-mouse IL-6R Bio X Cell Cat#BE0047; RRID: AB_1107588
InVivoMAb rat IgG2b isotype control, anti-
keyhole limpet hemocyanin
Bio X Cell Cat#BE0090; RRID: AB_1107780
Biological Samples
Human plasma Yale Stress Center N/A
Chemicals, Peptides, and Recombinant Proteins
Recombinant mouse IL6 R & D Cat#406-ML
Recombinant mouse TNFa R & D Cat#410-MY
Recombinant mouse IL-1b R & D Cat#401-ML-010
NEFA standard solution Wako Diagnostics Cat#276-76491
HR series NEFA-HR(2) color reagent A Wako Diagnostics Cat#999-34691
HR series NEFA-HR(2) solvent A Wako Diagnostics Cat#995-34791
HR series NEFA-HR(2) color reagent B Wako Diagnostics Cat#991-34891
HR series NEFA-HR(2) solvent B Wako Diagnostics Cat#993-35191
Multi-calibrator lipid Wako Diagnostics Cat#464-01601
L-type triglyceride M enzyme color A Wako Diagnostics Cat#994-02891
L-type triglyceride M enzyme color B Wako Diagnostics Cat#990-02991
Intralipid 20% Sigma-Aldrich Cat#1141
Poloxamer 407 Sigma-Aldrich Cat#16758
Glucose, D-[3-3H] PerkinElmer Cat#NET331C250UC
Potassium palmitate (U-13C16) Cambridge Isotope Laboratories Cat#CLM-3943-PK
Sodium L-lactate-3-13C solution Sigma-Aldrich Cat#490040
6-hydroxydopamine Sigma-Aldrich Cat#H4381
Lipopolysaccharides from Escherichia
coli O55:B5
Sigma-Aldrich Cat#L2880
Lot#039M4004V
Isoproterenol Sigma-Aldrich Cat#1351005
CL316243 Sigma-Aldrich Cat#C5976
Propranolol Sigma-Aldrich Cat#P0884
SR59203A Cayman Chemical Cat#21407
Critical Commercial Assays
Mouse cytokine array/chemokine array 44-
plex (MD44)
Eve Technologies N/A
Human cytokine array/chemokine array 42-
plex with IL-18(HD42)
Eve Technologies N/A
Glycerol assay kit Sigma-Aldrich Cat#MAK117-1KT
b-hydroxybutyrate colorimetric assay kit Cayman Chemical Cat#700190
(Continued on next page)
e1 Cell 182, 372–387.e1–e6, July 23, 2020

Continued
REAGENT or RESOURCE SOURCE IDENTIFIER
Corticosterone ELISA kit Enzo Life Sciences Cat#ADI-900-097
Mouse insulin ELISA kit Crystal Chem Cat#90080
Noradrenaline ELISA kit Eagle Biosciences Cat#NOR31-K01
Mouse CTnI Life Diagnostics Cat#CTNI-1-US
Alanine transaminase colorimetric activity
assay kit
Cayman Chemical Cat#700260
Experimental Models: Organisms/Strains
Mouse: C57BL/6J The Jackson Laboratory 00064
Mouse: Adrb1 tm1Bkk Adrb2 tm1Bkk The Jackson Laboratory 003810
Mouse: B6.129-Ucp1 tm1Kz The Jackson Laboratory 003124
Mouse: B6;SJL-Il6ra tm1.1Drew / J The Jackson Laboratory 12944
Mouse: B6. FVB(129)-Tg(Alb-cre)1Dlr / J The Jackson Laboratory 016832
Mouse: B6. 129-Tg(Adipo q-cre/Esr1*)
1Evdr / J
The Jackson Laboratory 024671
Mouse: Adrenalectomy and sham surgery The Jackson Laboratory https://www.jax.org/
jax-mice-and-services/
find-and-order-jax-mice/
surgical-and-preconditioning-services/
surgical-service-for-jax-mice
Oligonucleotides
Primers for mouse Il6 Forward This paper TGAACAACGATGATGCACTTG
Primers for mouse Il6 Reverse This paper CTGAAGGACTCTGGCTTTGTC
Primers for mouse Il6ra Forward This paper AGACCTGGGACCCGAGTTAC
Primers for mouse Il6ra Reverse This paper AAGGTCAAGCTCCTCCTTCC
Primers for mouse Fbp1 Forward This paper TGGTTCCGATGGACACAAGG
Primers for mouse Fbp1 Reverse This paper CCAATGTGACTGGGGATCAAG
Primers for mouse Gck Forward This paper TTACACTGGCCTCCTGATGG
Primers for mouse Gck Reverse This paper TTTGCAACACTCAGCCAGAC
Primers for mouse Ucp1 Forward This paper GTGAACCCGACAACTTCCGAA
Primers for mouse Ucp1 Reverse This paper TGCCAGGCAAGCTGAAACTC
Primers for Pck1, G6p, Pcx, Adrb3, Adrb1,
Adrb2, Rpl13a, Ikkb, Tnfa, Cxcl1, Mx1,
Il12b, Saa3, Prdm16, Il5, Ssa3, Socs3, See
Table S1
This paper N/A
Software and Algorithms
Prism 8.0 GraphPad Software, Inc. N/A
llArticle
RESOURCE AVAILABILITY
Lead ContactFurther information and requests for reagents may be directed to, and will be fulfilled by, the lead contact Andrew Wang (andrew.
Materials AvailabilityThis study did not generate new reagents. Mouse lines for this study are available from the Lead Contact with a completed Materials
Transfer Agreement.
Data and Code AvailabilityThis study did not generate any datasets/code amenable for depositing into public repositories.
Cell 182, 372–387.e1–e6, July 23, 2020 e2
llArticle
EXPERIMENTAL MODEL AND SUBJECT DETAILS
MiceMale mice with 6-8 weeks of age were used. C57BL/6J, Adrb1/b2 KO, Ucp1 KO, Il6ra f/f, AlbCre, AdipoCre mice were purchased
from Jackson Laboratories and bred at Yale University. Adrb3 KO mice were a kind gift from Dr. Natasa Petrovic (Stockholm
University), Adrb3 f/f mice were a kind gift from Dr. Jean-Luc Balligand (UC Louvain), the Ucp1CreER animal was a kind gift from
Dr. Christian Wolfrum (ETH Zurich), the Il6 f/f mice were a kind gift from Dr. Juan Hidalgo (Universitat Autonoma Barecelona) and
the Tlr2/4 KO, and Myd88/Trif KO animals were kindly provided by Dr. Ruslan Medzhitov. Adrenalectomy and sham surgery mice
were purchased from Jackson Laboratories. All animal experiments were performed according to institutional regulations upon re-
view and approval of Yale University’s Institutional Animal Care and Use Committee.
For stress models, all experiments were done during the light period. Acute restraint stress was initiated by retaining a mouse in a
ventilated 50ml Falcon tube for four hours. Social isolation was induced by individually housing mouse for three days. Retro-orbital
bleeding (50 mL of blood drawn via a glass cuvette VWR #53432-921) was performed four hours before experiments, then blood was
collected from the other eye for analysis. In the cage switchmodel, mice were removed from their home cage and placed in new cage
of the same size with dirty bedding of other non-littermatemales. Non-disturbed socially-housed littermates were applied as the con-
trols. For anesthesia studies, ketamine/xylazine was injected intraperitoneally or animals were placed in isoflurane chambers. Veri-
fication of anesthesia was confirmed by lack of activity after toe pinching. Chemically sympathectomized with 6-hydroxydopamine
(6-OHDA, sigma) was applied through intraperitoneal injection 24 hours before acute stress at a dosage of 10 mg/kg. For manipu-
lation of ambient temperature, mice were either housed at thermoneutral (32�C) cabinets for twoweeks, or placed in the cold (4�C) forthree hours, or housed at standard housing (22�C).
For flux and metabolite measurements, mice underwent surgery under isoflurane anesthesia to place a catheter in the left jugular
vein. Animals were individually housed with unrestricted access to food and water and were treated again with IL-6Ra antibody or
isotype control the night before a 120 min tracer infusion, performed after two hours of acclimation to a 1.25 inch diameter plastic
restrainer (IBI Scientific) in which the mouse’s tail was drawn through the restraint and tethered with tape, while an adjustable
nose cone permitted the mouse several centimeters of forward movement. At the conclusion of the tracer infusion, mice were eutha-
nized via IV pentobarbital and liver and kidney were obtained and freeze-clamped in liquid N2 within 30 s of euthanasia.
For LPS endotoxemia, mice were injected intraperitoneally with LPS derived from Escherichia coli 055:B5 (Sigma-Aldrich) diluted
in PBS. Dosing varies dramatically from lot to lot. New lots are tested for LD50. In these studies, lethal doses are between 15 and
20 mg/kg. For experiments with antibody blockade, anti-IL-6Ra or the isotype antibody (BE0047 and BE0090 respectively, Bio
X Cell, 8 mg/kg) diluted in PBS was injected intravenously one night before experiment through retro-orbital injection. For experi-
ments utilizing recombinant IL-6, recombinant mouse IL-6 (406-ML-025/CF, R&D) or PBS control was intravenously injected one
hour before experiment at a dose of 5ng/100 ml/mouse through the retro-orbital plexus. For experiments utilizing adrenergic agonists,
ADRB1/2 agonist (Isoproterenol, 1351005, Sigma-Aldrich, 1mg/kg), ADRB3 agonist (CL316243, Sigma-Aldrich, 1mg/kg) were in-
jected intraperitoneally two hours prior to blood and tissue harvesting. For adrenergic antagonists, propranolol (5 mg/kg, P0884,
Sigma-Aldrich) and ADRB3 antagonist (SR59203A, 21407, Cayman Chemical, 5mg/kg) were applied once every two hours during
four-hour-exposure of acute stresses, blood were collected at indicated time point, and lethal dose of LPS was administered two
hours after last injection of ADRB3 antagonist.
Vital signs, including blood oxygen saturation, breath rate, and heart rate post LPS injection were monitored via pulse oximetry
using the MouseOx Plus (Starr Life Sciences Corp.). Core body temperature was measured by rectal probe thermometry (Physitemp
TH-5 Thermalert).
Human SubjectsA community sample of individuals signedwritten informed consent for research approved by the Yale Institutional ReviewBoard and
was carefully assessed for high and low stress using a structured cumulative stress and adversity interview that assessed recent and
past life events (Cumulative Adversity Interview (CAI)) (Ansell et al., 2012; Seo et al., 2014; Turner and Lloyd, 1995). The high and low
groups were group matched on age, gender, education and body mass index (BMI). All subjects participated in two standardized
experiment sessions on consecutive days conducted between 2:00 and 4:00 pm in the afternoon. Baseline blood draws were drawn
at 2 pm after a one-hour habituation period and two additional draws were conducted within 15 minutes. Change from baseline
values were computed to assess baseline adjusted values and reduce variability across subjects.
METHOD DETAILS
Quantification of Plasma CytokinesUndiluted plasma from stressedmice were screened by Eve Technologies usingmouse cytokine arrays, the raw data including stan-
dard results were presented in Figure S7A. Except for the results in Figures 1B and S1E from samples analyzed by Eve Technologies,
other analyses were conducted in our laboratory. Plasma concentrations of IL-6 were assayed by sandwich ELISA (Luan et al., 2019;
Wang et al., 2016). Anti-mouse IL-6 capture antibody (14-7061-85, eBioscience) was diluted (1:1000) in coating buffer (NaHPO4PH9)
then incubated in enhanced protein-binding ELISA-grade plate (490012-252, VWR) overnight at 4�C. On the next day plates were
e3 Cell 182, 372–387.e1–e6, July 23, 2020

llArticle
blocked using PBS buffer with 10% FBS for one hour at room temperature. Afterward, the standards and plasma from stressedmice
were incubated in the plate overnight at 4�C. The highest concentration of recombinant IL-6 standard (406-ML, R&D) was 10ng/ml
followed by serial two-fold dilutions to create a standard curve, and plasma were diluted 1:5 (20ul plasma in 80ul blocking buffer per
well). On the third day, biotin-conjugated anti-IL-6 detection antibodies (554402, BD PharMingen) was diluted (1:500) and incubated
in the plate for one hour at room temperature, followed with another incubation of diluted (1:1000) HRP-conjugated streptavidin
(554066, BD Biosciences) for half an hour at room temperature. Then plates were incubated in the dark at room temperature with
TMB substrate reagent (555214, BD Biosciences) and the color was checked every five minutes. Then plates were read at 450nm
instantly after stop solution (3M H2SO4) was added. Between each step, five to seven times of washing were normally applied.
The raw data, results of standard curve and representative plate with color developed with TMB were displayed in Figures S7B–
S7E. Plasma concentrations of TNFa and IL-1b were assayed by the same sandwich ELISA method. Recombinant TNFa
(410-MY, R&D) and IL-1b (401-ML-010, R&D) were utilized as standards with the highest concentration at 10ng/ml and 1ng/ml
respectively. Capture antibodies were anti-TNFa (14-7423-85, eBioscience) and anti-IL-1b (14-7012-81, Invitrogen). Detection anti-
bodies conjugated with biotin were anti-mouse TNFa (13-7349-81, Invitrogen) and anti-mouse IL-1b (13-7112-85, eBioscience).
HRP-conjugated streptavidin, TMB substrate reagent, and stop solution were the same with those in ELISA assay for IL-6
measurement.
Quantification of Plasma Metabolites, Hormones, and Organ Injury MarkersGlycemia wasmeasured by whole blood collection via the retro-orbital plexus and assessed using a glucometer (OneTouch), or, dur-
ing the flux studies in IL-6Ra treatedmice, in blood collected from the tail vein using the YSI Glucose Analyzer. Plasmawas separated
using lithium heparin-coated microcentrifuge tubes (BD Diagnostics). Plasma L-type triglycerides (TG) and nonesterified fatty acids
were measured using the kits according to manufacturer’s instructions (Wako Diagnostics). Plasma Glycerol and b-hydroxybutyrate
were measured using the kits per manufacturer’s instructions (Sigma Aldrich and Cayman Chemical, respectively). Plasma amino
acid concentrations were measured by gas chromatography-mass spectrometry (GC-MS) as described previously (Perry et al.,
2018). Plasma levels of corticosterone (Enzo Life Sciences), insulin (Crystal Chem), and noradrenaline (Eagle Biosciences) were
measured using kits according to the manufacturer’s protocols. Cardiac Troponin-I (CTNI) concentration and Alanine Aminotrans-
ferase (ALT) activity in the blood were measured by kits per manufacturers’ instructions (Life Diagnostics and Cayman Chemical,
respectively). Plasma creatinine were assayed using HPLC by the George M. O’Brien Kidney Center at Yale.
Surgical Removal of Brown Adipose TissueSurgical removal of brown adipose tissue (BAT) was applied to sevenweeks oldmalemice. A 1.5 cm incisionwasmade to expose the
intrascapular fat pads following intraperitoneal injection of ketamine/xylazine. Two lobes of darkly colored BAT were completely
removed with little bleeding. Sham-operated mice were anesthetized and incisions were made into the muscles without tissue exci-
sion. Heat mats were applied to keep all animals warm during and after surgery until consciousness was fully recovered. Then mice
were kept in room temperature, and IL-6 secretion post retro-orbital bleeding was analyzed in these mice two days after surgery.
Metabolic Tolerance TestsFor oral GTT, D-Glucose (G8270, Sigma-Aldrich) or water gavage was performed; blood was collected afterward through retro-
orbital plexus at indicated time point for glucose and IL-6 analysis. For intraperitoneal GTT, D-glucose was given through intraper-
itoneal injection at the dose of 2g/kg. CBG was analyzed using a glucometer (OneTouch) at indicated time points. For insulin toler-
ance tests, insulin (Novolin R) was administrated at 2 IU/kg through intraperitoneal injection. For pyruvate tolerance tests, pyruvate
(Sigma-Aldrich) was applied at 2g/kg by intraperitoneal injection. CBG was analyzed at indicated time points. For lipid tolerance
tests, intralipid 20% (1141, Sigma-Aldrich) was intraperitoneally injected at a volume of 200 mL per mouse. Plasma level of TG
was analyzed at 0, 1, 2, 3, and 4 hours after intralipid administration. For hepatic triglyceride production, poloxamer 407 (16758,
Sigma-Aldrich) was dissolved in PBS and then intraperitoneally injected at 1g/kg. Plasma level of TG was analyzed at 0, 1, 2, 3,
and 4 hours after poloxamer injection. Mice were fasted overnight before the hepatic TG production assay and assessment of
glucose and palmitate turnover; for all other tolerance tests, stressed or unstressed mice were fasted for four hours before testing.
Capillary blood glucose (CBG) was analyzed using a glucometer (OneTouch) at indicated time points.
Endogenous Glucose Production and Palmitate TurnoverAfter anti-IL-6Ra treatment, endogenous glucose production and palmitate turnover from C57BL/6J mice were measured as
precious described (Perry et al., 2017a, 2017b). In brief, IL-6Ra inhibitor or vehicle control was injected through orbital venous plexus
respectively before catheter placement and tracer infusions. Mice were infused with [3-3H] glucose (10 mCi/min, PerkinElmer),
[U-13C16] potassium palmitate (2.5 mmol/kg/min, Cambridge Isotopes), and [3-13C] sodium lactate (40 mmol/kg/min, Sigma) contin-
uously for a total of two hours following a 5 min 3X prime. Palmitate turnover was determined by gas chromatography-mass spec-
trometry (GC-MS) (Perry et al., 2017a). Plasma specific activity was measured using a scintillation counter and compared to tracer
specific activity to measure whole-body endogenous glucose production, which can be attributed entirely to gluconeogenesis in a
16 hr fasted, glycogen-depleted mouse. Based on equations previously described (Perry et al., 2017b), and after verifying minimal
(atom percent enrichment < 1%, as compared to glucose 15%–20%) renal and hepatic bicarbonate enrichment, we measured the
Cell 182, 372–387.e1–e6, July 23, 2020 e4

llArticle
whole-body ratio of pyruvate carboxylase flux (i.e., gluconeogenesis from pyruvate) to total gluconeogenesis by mass isotopomer
distribution analysis (MIDA):
GNG from pyruvate =½C2 13�glucose
XFE2(1)
where XFE represents the fractional triose enrichment and is calc
ulated asXFE =1
1+ ½C1 13�glucose2�½C2 13�glucose
: (2)
In these calculations, we corrected for any [13C2] glucose synthe
sized from [13C2] trioses – as opposed to the condensation of two[13C1] trioses – by GC-MS measurement of the enrichment in the glucose C4C5C6 fragment, according to the equation
Corrected ½C213�glucose = Measured ½C2 13�glucose� 2 � ½C4C5C6�C2 13�glucose (3)
This ratio was measured in plasma (representing whole-body gluc
oneogenesis from pyruvate), liver, and renal cortex. By comparingthe whole-body gluconeogenesis from pyruvate (GNG from pyruvateT) to that measured in liver (GNG from pyruvateL) and kidney
(GNG from pyruvateK), we were able to measure the fractional contribution of the kidney to whole-body gluconeogen-
esis ðGNGK =GNGÞ: �GNGK
GNG
�= 1�GNG from pyruvateT �GNG from pyruvateK
GNG from pyruvateL �GNG from pyruvateK
(4)
Absolute rates of gluconeogenesis from kidney could then be calc
ulated by multiplying the measured endogenous glucose produc-tion by ðGNGK =GNGÞ (Equation 4), and gluconeogenesis from liver was calculated as the difference between total endogenous
glucose production and gluconeogenesis from kidney. The rate of gluconeogenesis from liver and kidney was then multiplied by
the fractional contribution of pyruvate to gluconeogenesis in those tissues to calculate the contribution of pyruvate to gluconeogen-
esis in each tissue.
qRT-PCRTissues were homogenized in 1ml RNA-Bee (Tel-Test, Inc) using a FastPrep-24 5G homogenizer (MPBiomedicals). RNAwas purified
using QIAGENRNeasy columns according to themanufacturer’s instructions. cDNAwas generatedwith reverse transcriptase (Clon-
tech) using oligo-dT6 primers (Sigma-Aldrich). qRT-PCR was performed on a CFX96 Real-Time System (Bio-Rad) using PerfeCTa
SYBR Green SuperMix (Quanta Biosciences). Relative expression units were calculated as transcript levels of target genes relative
to Rpl13a. Primers used for qRT-PCR are listed in Table S1.
Stromal Vascular Fraction IsolationStromal vascular fraction (SVF) were isolated by density separation as previously reported (Aune et al., 2013). Briefly, interscapular
BAT depotswereminced and digested in collagenase at 37�C for 1 hourwith constant agitation. Then after filtering through 70 mMcell
strainer, the cell suspensions were centrifuged at 500 g for 5 min. The pellet was the SVF fraction.
Metabolic CageEnergy expenditure after acute stress was measured by indirect calorimetry using metabolic cages (Promethion, Sable Systems In-
ternational). A 2-day period of acclimation was followed by 2 days of steady-state recording prior to experimentation. Afterward,
C57BL/6Jmicewere given IL-6Ra antibody or isotype control through intravenous injection; the nextmorning, both groupswere sub-
jected to retro-orbital bleeding stress.
Ambulatory Blood Pressure MeasurementsA blood pressure transducer (TA11-PA-C10, commercially available through Data Sciences International) was surgically implanted
under isoflurane anesthesia (1%–3% in oxygen) into the carotid artery of mice using sterile surgical technique. Meloxicam was pro-
vided for 48 hours for post-operative analgesia and the skin was closedwith surgical staples.Micewere allowed to recover for 7 days.
Afterward, surgical staples were removed, and the mice were transferred to a fresh cage and singly housed for data collection. There
they were allowed to acclimate for several days prior to initiation of study. A 10 s segment was collected every minute for the duration
of the experiment. Every dot in the figure reflects the averaged value over one hour reading period.
Behavioral TestsThe spontaneous exploratory behavior of mice following acute stress was analyzed three hours post retro-orbital bleeding using
the light-dark paradigm. All experiments were performed between 11AM and 12 noon in male mice 6-8 weeks of age. Non-stressed
mice were habituated to the environment three hours prior to being placed in the light/dark box; three days later, the samemice were
e5 Cell 182, 372–387.e1–e6, July 23, 2020

llArticle
transferred to the testing room one night before the experiment for acclimatization, then retro-orbital bleeding or tube restraint was
performed three hours before light/dark box test. The light/dark box consisted of two of the same-sized chambers (18x10x13 cm), a
dark chamber and an equal size light chamber connected by a small central aperture (3.8x3.8x3.8cm). Urine and feces were removed
and the box was cleaned after each trial. Mice were initially placed in the corner of the light chamber facing away from the opening
andmonitored for 6minutes after the first entry into the dark section. The latency time for the first passage from the light section to the
dark one, transitions between the two compartments, and the amount of time spent in the dark were recorded (Mineur et al., 2007).
ImmunohistochemistryMice were euthanized and perfused with PBS or fixative. Brown adipose tissues were immersion-fixed in 10% neutral buffered
formalin. Then tissues were trimmed, processed, embedded, and sectioned and stained for IL-6.
QUANTIFICATION AND STATISTICAL ANALYSIS
Statistical analyses were performed using Prism 8.0 (GraphPad Software, Inc.). For parameters obtained from metabolic cage, the
area under a curve was calculated followed by Student’s t test. Student’s t test was used for two groups comparison. More than two
groups were compared using one-way analysis of variance (ANOVA) followed by Tukey test. Samples at different time points from
multiple groups were analyzed using two-way ANOVA followed by Tukey test. The log-rank Mantel-Cox test was used to compare
Kaplan Meier curves. A p value less than 0.05 was considered statistically significant. Data are presented as the mean ± SEM. * p <
0.05, ** p < 0.01, *** p < 0.001, **** p < 0.0001
Cell 182, 372–387.e1–e6, July 23, 2020 e6

Supplemental Figures
Figure S1. ADRB3 Mediates Brown Adipocyte-Derived IL-6 in Response to Acute Stress, Related to Figures 1, 2, and 3
(A) Plasma concentrations of soluble IL-6 receptor (s-IL6Ra) from bled mice (n = 5 per group).
(B) Plasma IL-6 levels post-bleeding in mice with bilateral adrenalectomy or sham (n = 5 per group).
(C) Plasma noradrenaline and (D) corticosterone in mice pretreated with IL-6Ra antibody or isotype control (n = 5 per time point per group).
(E) Relative level of circulating IL-6 from human with high or low stress history (n = 12 for high stress history, n = 13 for low stress history).
(F) Capillary blood glucose (CBG) and (G) plasma IL-6 fromWTmice after glucose or water gavage. Mice were bled then fasted for four hours before gavage (n = 5
per group).
(H) Plasma IL-6 levels in blood collected from the indicated site of mouse eyes four hours post bleeding (n = 5 per group).
(legend continued on next page)
llArticle

(I) qPCR analyses of Ucp1 and (J) Adrb3 in brown adipocyte tissue (BAT) or the stromal vascular fraction (SVF) from mice stressed with the indicated conditions
(n = 5 per group).
(K) Plasma concentration of IL-6 four hours post bleeding from mice subjected to the indicated ambient temperature (n = 3 per group, representative of 2
experiments).
(L) Body temperature after bleeding stress in the presence of IL-6Ra antibody or isotype control (n = 5 per group).
(M) Transcriptional analyses of cold-sensitive genes and Il5 in BAT (n = 3-4 per group). Results are expressed as fold change relative to non-stressed control (NT).
(N-O) Transcriptional expression of beta-adrenergic receptors Adrb1 and Adrb2 in BAT or SVF from BAT of stressed mice (n = 3-4 per group).
(P) Plasma IL-6 levels at indicated time points post bleeding from mice pre-treated with an ADRB1/2 antagonist propranolol (anti-ADRB1/2) or PBS (n = 5
per group).
(Q) Expression of Adrb3 in the indicated tissues frommice with conditionalUcp1-medidated deletion of Adrb3 (n = 4 per group). *p < 0.05, **p < 0.01, ***p < 0.001,
****p < 0.0001
llArticle

Figure S2. IL-6 Is Necessary for Promoting Stress-Hyperglycemia, Related to Figure 4
(A) Continuous heart (HR) and blood pressure (BP) tracings in mice treated with IL-6Ra mAb or isotype control followed by tube restraint (TR) (n = 4 per group).
(B) Activity of mice treated with IL-6Ra antibody of isotype control followed by retro-orbital bleeding (n = 4 per group, representative of 2 experiments).
(C) Capillary blood glucose (CBG) one hour after injection of stress-dosed IL-6 (n = 10 per group).
(D) Glucose tolerance test (GTT) performed four hours post bleeding frommice pretreated with IL-6Ra antibody or isotype control (n = 5 per group, representative
of 3 experiments).
(E) GTT performed one hour after injection with IL-6 or vehicle control (n = 5 per group).
(F) Plasma insulin levels one hour after injection with IL-6 or vehicle control (n = 6 for vehicle, n = 8 for IL-6).
(G) Insulin tolerance test performed in animals four hours after a single retro-orbital bleeding (n = 5 per group, representative of 2 experiments). NT, no treatment.
(H) Insulin tolerance test performed one hour after a stress-dose IL-6 injection (n = 6 per group).
(I) Insulin tolerance test performed in mice pretreated with IL-6Ra antibody or isotype control (n = 5 per group)
(J) Glycogen content in the indicated tissues of mice 3 hours post bleeding (muscle is gastrocnemius, n = 5 per group). *p < 0.05, **p < 0.01, ***p < 0.001,
****p < 0.0001
llArticle

Figure S3. Lipid Metabolism in Response to Acute Stress or External IL-6, Related to Figure 4
(A-C) (A) Plasma levels of non-esterified fatty acid (NEFA), (B) glycerol, and (C) triglycerides (TG) four hours post bleeding (n = 28 for NT, n = 29 for Bleed. Pooled
from 3 experiments).
(D) Intralipid tolerance test performed four hours post bleeding (n = 5 per group).
(E) Hepatic triglyceride secretion at indicted time points post poloxamer injection from bled mice or controls (NT) (n = 5 per group).
(F-G) (F) Plasma levels of TG, (G) NEFA assessed four hours post bleeding in mice pretreated with IL-6Ra antibody or isotype control (n = 5 per group).
(H-K) (H) Plasma levels of TG, (I) NEFA, (J) Glycerol, (K) b-Hydroxybutyrate (BHB) one hour after IL-6 injection (n = 5 per group).
(L) In vivo lipolysis assay performed using ADRB3 agonist CL316,243 in mice with conditional Il6ra deletion in the adipose tissue (Il6raf/fDAdipo) or littermate
controls (Il6raf/f) (n = 6 per group).
(M) Palmitate turnover assessed in mice treated with IL-6Ra antibody or isotype control (n = 8 per group). *p < 0.05, **p < 0.01, ***p < 0.001, ****p < 0.0001
llArticle

Figure S4. IL-6 Mediates Stress Hyperglycemia through Hepatocyte Reprogramming, Related to Figure 5
(A) Pck1 mRNA measured at four hours post bleeding from the liver and kidney of Il6 KO or WT mice (n = 5 per group)
(B) Expression of Saa3 and (C) Socs3 in the indicated tissues from stressed mice (n = 5 per group).
(D) Plasma level of amino acids four hours post bleeding in mice pretreated with IL-6Ra antibody or isotype control (n = 5 per group).
(E) Il6ra expression in the indicated tissue from mice with liver-specific deletion of Il6ra (Il6raf/fDAlb) or littermate controls (Il6raf/f) (n = 6 per group).
(F) Latency to dark in mice with liver-specific Il6ra deletion (n = 15 for Il6raf/f, n = 9 for Il6raf/fDAlb, representative of 3 experiments). *p < 0.05, **p < 0.01, ***p <
0.001, ****p < 0.0001
llArticle

Figure S5. Inflammatory Responses to a Lethal Endotoxemia Are Not Affected by the Pre-exposure of Acute Stress, Related to Figure 6
(A) Survival rate ofmicewith brown adipose tissue specific deletion of Il6 (Il6/f/fDUCP1) comparingwith littermate controls (Il6f/f) (n = 6 per group, representative of 2
experiments).
(B) Survival rate of mice with liver specific deletion of Il6ra (Il6raf/fDAlb) comparing with littermate controls (Il6raf/f) (n = 6 per group, representative of 3
experiments).
(C) Survival of animals pre-treated with glucose or an isocaloric isovolumetric dose of intralipid followed by LPS injection (n = 5 per group).
(D) Plasma IL-6, (E) TNFa, and (F) IL-1b levels sampled 0, 2, 6, and 20 hours after LPS challenge in bled mice or non-bled controls (n = 5 per group, representative
of 2 experiments).
(G) Plasma IL-6, (H) TNFa, and (I) IL-1b levels sampled 0, 2, 6, and 20 hours after LPS challenge in mice pre-challenged with ADRB3 agonist or vehicle control (n =
5 per group).
(J) The peak levels of circulating IL-6 and (K) TNFa during LPS-mediated endotoxemia from mice pre-exposed to tube restraint (TR) or controls (NT) (n = 5
per group).
(L-R) Expression of inflammatory transcripts in the indicated tissues from LPS-treated mice pre-exposed to bleeding stress. Tissues were harvested three hours
after LPS challenge (n = 5 per group). *p < 0.05, **p < 0.01, ***p < 0.001, ****p < 0.0001
llArticle

Figure S6. BAT-Derived IL-6 from Acute Stress Decreases Host Tolerance to Inflammatory Damage, Related to Figure 6
(A-D) Vital signs before and 24 hours post LPS challenge from mice pre-exposed to acute stress. NT, no treatment. TR, tube restraint. HR, heart rate.
(E) Continuous systolic blood pressure (BP) and (F) heart rate (HR) tracings in mice with tube restraint and the subsequent LPS challenge. NT, no treatment. TR,
tube restraint.
(G) Circulating alanine aminotransferase (ALT) and (H) cardiac troponin I (CTNI) levels 0 or 24 hours post LPS injection from mice pre-exposed to bleeding or
restraint stress (n = 5 per group). NT, no treatment. TR, tube restraint.
(I) Capillary blood glucose (CBG) levels post LPS injection at indicated time points frommice pre-exposed to restraint stress (n = 5 per group, representative of 2
experiments). NT, no treatment. TR, tube restraint.
(J) Plasma non-esterified fatty acid (NEFA) levels post LPS injection at indicated time points from mice pre-exposed to restraint stress (n = 5 per group,
representative of 2 experiments).
(K) Plasma b-hydroxy-butyrate (BHB) levels post LPS injection at indicated time points frommice pre-exposed to restraint stress (n = 5 per group, representative
of 2 experiments).
llArticle

Figure S7. Raw Data from ELISA Analysis of IL-6, Related to Figures 1B, 3D, and 3G
(A) The raw data of IL-6 from stressed mice including the standards concentration from Eve Technologies.
(B) The raw OD values from the plate presented in (D).
(C) The layout of samples from the plate presented in (D). Row A, C, E, and F were samples collected before bleeding. Row B, D, G, and H were samples at four
hours post bleeding. NA, no samples in thewell. RowA and Bwere related to Figure 3D frommice treatedwith 6-OHDA 0 and 4 hours post bleeding. RowC andD
were from mice with surgical denervation of BAT or sham controls (data not show). Row E, F, G, and H were related to Figure 3G from mice with BAT-specific
deletion of Il6 (Il6f/fDUCP1) or littermate controls (Il6f/f) 0 and 4 hours post bleeding.
(D) The representative plate with color developed with TMB.
(E) The standard curve generated based on the OD value in (A) and concentrations in (B) from column 1 and 2.
llArticle