oriental weavers investor presentations3.amazonaws.com/inktankir2/orwe/investor presentation...
TRANSCRIPT

ORIENTAL WEAVERS Investor presentation

Oriental Weavers in Numbers
No. 1
World Largest
producer by volumes
85%
Market share in Egypt
c. 82%
Utilization rate
67%
Export contribution in
3Q FY2017
8
Manufacturing
companies
130
Export countries
Slide 2

2014
2011-12
2001-06
1993-98
Group’s key Milestones
US subsidiary partnering with Pantone & Tommy Bahama
• King Tut yarn plant
• OW Hospitality in
London
• A new showroom in
New York City
•OW China.
•Patent rights for 100% acrylic rugs, which emulates the look and feel of silk
•Manufacturing facility in the US
•OWI, the export oriented subsidiary
1981-87
1991-92 1979-81
•Egyptian Fibers Co. (EFCO)
•First showroom in the USA
Oriental Weavers
& MAC were
established
• Sphinx, the US
distribution arm.
• OW largest showroom
in Atlanta.
2015
OW won the award of the world’s best carpet for the second year in a row
2016
OW Sphinx was named “the Supplier
of the Year “ by Rugs Direct
Slide 3

Main segments of OW
Woven Tufted Non-woven
Description Surface yarn is woven simultaneously
with the backing. Then a latex
compound is added.
The surface yarn is
inserted into a
polypropylene sheet
Fibers bonded together
using chemicals and
heat.
Subsidiaries OWC OWI &
OWT
OWUSA OW
China
MAC New MAC EFCO
% of Revenues 32% 25% 21% 1% 17% 4%
Tax rate 22.5% Exempted 34% 17% 22.5% Exempted 22.5%
Capacity
mn sqm
(Oct,2017)
25.2 44 NA 3.4 48 18.5
Slide 4

The Group’s structure
Oriental Weavers Carpets
OW USA OW Textiles OW
International
OW China
MAC
New MAC
EFCO
Slide 5
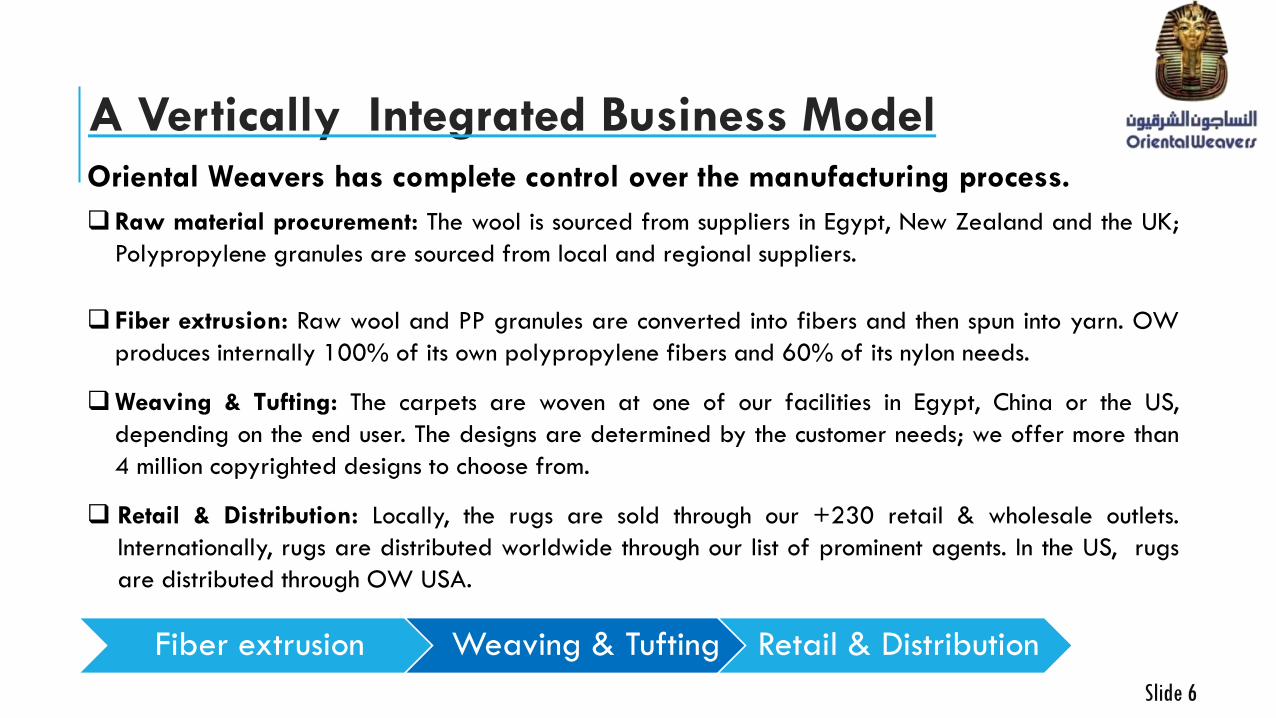
A Vertically Integrated Business Model Oriental Weavers has complete control over the manufacturing process.
Raw material procurement: The wool is sourced from suppliers in Egypt, New Zealand and the UK;
Polypropylene granules are sourced from local and regional suppliers.
Fiber extrusion: Raw wool and PP granules are converted into fibers and then spun into yarn. OW
produces internally 100% of its own polypropylene fibers and 60% of its nylon needs.
Weaving & Tufting: The carpets are woven at one of our facilities in Egypt, China or the US,
depending on the end user. The designs are determined by the customer needs; we offer more than
4 million copyrighted designs to choose from.
Retail & Distribution: Locally, the rugs are sold through our +230 retail & wholesale outlets.
Internationally, rugs are distributed worldwide through our list of prominent agents. In the US, rugs
are distributed through OW USA.
Fiber extrusion Weaving & Tufting Retail & Distribution
Slide 6

Revised local selling prices
Increasing focus on export exposure ( 67% as of 3Q 2017)
to secure foreign currency,
ensure better profitability, and
With 4% local currency debt as of September 30 2017, OW is working on gradually settling its EGP debt facilities to avoid the high finance charges.
OW signed forward contracts starting March 2017 to sell the excess dollar proceeds ,and
the resulting FX gains from these contracts should offset the high finance charges on the EGP debt facilities.
Slide 7
Policy towards EGP floatation & high EGP i/r
Slide 8
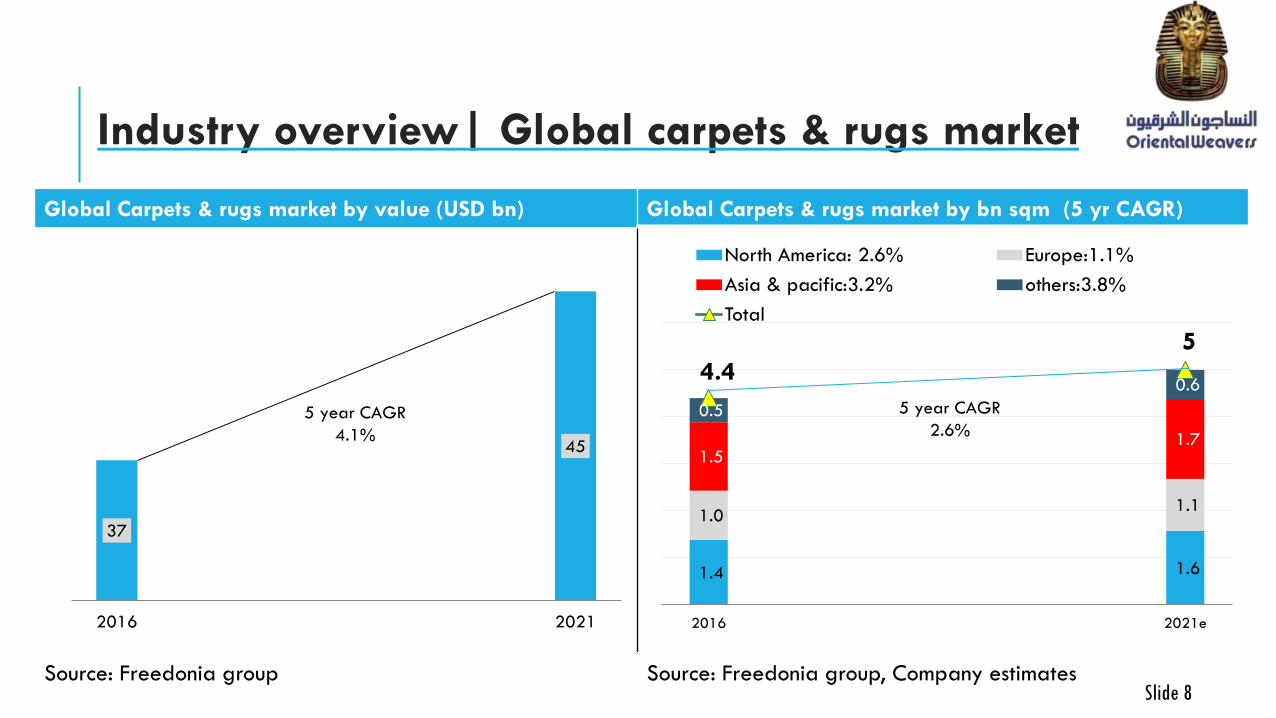
Industry overview| Global carpets & rugs market
Global Carpets & rugs market by value (USD bn) Global Carpets & rugs market by bn sqm (5 yr CAGR)
Source: Freedonia group Source: Freedonia group, Company estimates
37
45
2016 2021
5 year CAGR
4.1%
1.4 1.6
1.0 1.1
1.5 1.7
0.5
0.6 4.4
5
2016 2021e
North America: 2.6% Europe:1.1%
Asia & pacific:3.2% others:3.8%
Total
5 year CAGR
2.6%

Global Macro Fundamentals
Slide 9
US Market Europe Asia & Africa
Expected continuous growth in new home sales driven by
employment gains and a rise in household formations.
European economy is set to follow a
moderate growth path. Strong potential in African
beside East Asian markets.
Homeowners improvements & repairs (USD bn)
New residential construction
expanded by 8.8% in 2016, and is
expected to grow by +6.8% in
2017e. (Euroconstuct, 2017)
Developing consumer trends
driving growth in these
regions.
Source: Joint center for housing studies
Residential renovation and
maintenance grows steadily by about
1.5% per year.
Growing Urbanization
279 285 291 296 298 304 310 315 318
324 336
4.80% 5.20%
5.90% 6.50%
6.8% 6.7% 6.4% 6.3% 6.5%
6.7%
8.5%
5%
5%
6%
6%
7%
7%
8%
8%
9%
9%
200
220
240
260
280
300
320
340
360
Q1 Q2 Q3 Q4 Q1 Q2 Q3 Q4e Q1e Q2e Q3e
2016 2017 2018
USD Bn

Demand Triggers in Egypt
Sizeable youth bracket
Slide 10
Growing economy GDP is expected to grow by 4 -5% annually up to 2021
as per the IMF.
Sizeable youth
population
50% of the Egyptian population are near the marriage
with around one million marriages taking place annually.
Housing gap Housing gap is about 3 million units which creates potential
for the development of new private and social housing
projects.
Protection of local
industries
Increasing stringent procedures on imports of rugs starting
March 2016.
Egyptian culture habits Soft floor coverings are considered essential in every house

OW: A large player in the Egyptian market
Capturing a strong market share in the local market.
Sells directly through a network of 230 showrooms.
80k sqm of retail and wholesale selling area.
Adding between 6-8 showrooms annually.
Slide 11

Local market overview
•On adjusted basis including sales of the merged Modern EFCO
2.1 2.3 2.7
3.0
2013 2014* 2015 2016
3-year CAGR 12%
48 48 51 54
2013 2014 2015 2016
3-year CAGR 4%
61
%
60
%
55
%
55
%
39
%
40
%
45
%
45
%
2013 2014 2015 2016
Export Local
Slide 12
Growing local revenues (EGPbn) Export vs. Local Revenue % Local sales volumes (mn sqm)

Local Market Development in 9M 2017
Slide13
Percentage Change 3Q 2017 vs
3Q 2016 Volume Value
Avg. Price
Contribution to Local Revenues Percentage Change
9M 2017 vs 9M 2016
Volume Value
3Q 2017 3Q 2016
Woven ▼25% ▲31% ▲73% 84% 71% Woven ▼19% ▲45%
Tufted ▲1% ▲18% ▲16% 10% 9% Tufted ▲7% ▲34%
Non-woven felt ▲8% ▲55% ▲44% 4% 3% Non-woven felt ▲3% ▲50%
Others (imported rugs & yarn sales)
▼89% 2% 18% Others (imported rugs & yarn sales)
▼93%
Total ▼16% ▲9% 100% 100% Total ▼11% ▲17%

Export Market development
Revenue contribution & performance by region in 3Q 2017
Slide 14
▲113%
Russia & China
▲86%
▲163% US
▲110%
▲9%
Asia
▲132%
▲96%
Egypt 33%
US34%
Europe
25%
Russia & Asia4%
Africa & GCC3%

Slide 15
Longstanding relationship with major customers

Extended partnership agreement with Tommy Bahama.
America’s most magnificent rug award in Atlanta Floor covering exhibition.
Opened corporate showrooms in 2012 in Fifth Avenue, New York and
Las Vegas
Growing online business with Target, Kohl’s, Amazon, and Wayfair in
addition to more focused sites such as Rugsdirect.com and rugsusa.com
OW’s long standing position in the US
Slide 16

Export performance overview
*On adjusted basis including sales of the merged Modern EFCO
3.4 3.5 3.2 3.7
2013 2014* 2015 2016
76 74 71 63
2013 2014 2015 2016
61
%
60
%
55
%
55
%
39
%
40
%
45
%
45
%
2013 2014 2015 2016
Export Local
Slide 17
Export revenues (EGPbn) Export vs. Local Revenue % Export volumes (mn sqm)

Slide 18
Export Market Development
A. New orders in the US
Market
-Home Depot, Menards, Lowe’s
-Walmart, Big Lots
-Tuesday mornings
-Dotcom retailers, Home city
B. Latin America
-Chili |Sodimac & Replay
-Mexico | Home Depot, Lowe’s,
Leroy Merlin
-Brazil | Maioricasa
C. Europe & Scandinavian
-Jysk (1500 stores), Rusta (70 stores)
-Ikea
-France | St Maclau, BUT, Le Claire, Gifi,
Dealing with agents that sell online
(cafom) to facilitate exposure, NK sales
-Italy| OBI, Sofabed, Leroy Merlin
D. Asia & Australia
-Japan | Nitori,
-New Zealand| Bunnings
-India | Big Bazar
-Approaching customers in Bangladesh,
Siri lanka, Vietnam & Pakistan
E. Africa
-South Africa | Global Flooring, Golden Star, Multifloor,
-Approaching customers in Zambia, Mauritius,
Rowanda

Export Market Development in 9M2017
Slide19
Percentage Change 3Q 3017 vs 3Q 3016
Volume Value Avg. Price
Contribution to Export Revenues
Percentage Change vs. 9M 2017 vs 9M 2016
Volume Value
3Q3017 3Q3016
Woven ▲18% ▲107% ▲75% 73% 76% Woven ▲3% ▲105%
Tufted ▲53% ▲229% ▲115% 23% 16% Tufted ▲23% ▲152%
Non-woven felt ▲12% ▲127% ▲103% 4% 4% Non-woven felt ▲20% ▲116%
Others - - - 0% 4% Others ▼64%
Total ▲28% ▲117% 100% 100% Total ▲11% ▲112%

Revenue progress
*On adjusted basis including sales of the merged Modern EFCO
** 2016 volumes include OW USA volumes sold and excludes OW
China
3.4 3.5 3.2 3.7
2.1 2.3 2.7 3.0
5.5 5.8 5.9
6.8
2013 2014* 2015 2016
Export Local
76 74 71 63
48 48 51 54
124 122 122 117
2013 2014 2015 2016
Export Local
61
%
60
%
55
%
55
%
39
%
40
%
45
%
45
%
2013 2014 2015 2016
Export Local
Slide 20
Revenues (EGPbn) Export vs. Local Revenue % Sales volumes (mn sqm)
3-year CAGR 7%

9M 2017 Financial summary
Slide 21
Quarterly Revenue Performance (EGPmn) 9M Revenue Performance (EGPmn)
1,708 2,033 2,224 2,593
2,641 2,468 2,322
4,914 4,349 4,501 4,546
7,507
9M 2014 9M 2015 9M 2016 9M 2017
Local Export
626 685 786 859
878 834 798
1,735 1,504 1,519 1,584
2,594
3Q 2014 3Q 2015 3Q 2016 3Q2017
Local Export

Diversified Product Mix
3Q 2017 Revenue Mix (by volume) 3Q 2017 Revenue Mix (by value)
EGP325/sqm
EGP133/sqm EGP69/sqm
EGP53/sqm
EGP52/sqm EGP26/sqm
Woven-Grade A
Non-woven (EFCO)
Tufted pieces
Tufted wall-to-wall
Woven-Grade C
Woven-Grade B
Slide 22
Woven58%
OW USA17%
OW China2%
Tufted19%
Non-woven
4%
Others0%
Woven48%
OW USA9%
OW China1%
Tufted29%
Non-woven
4%

Premier Partners: Hospitality Segment
OW Hospitality, the London-based hospitality carpeting arm, is the preferred supplier for the Four Seasons and several other major hotel chains.
We continue to see solid and continuous growth in the US and the KSA.
Slide 23
OW Hospitality: Recently delivered Projects
El-Masah Hotel, New Administrative Capital
New Capital Airport , New Administrative Capital
Conference center, New Administrative Capital
Al-Sahaba Mosque, Sharm El Sheikh,
The Military Judgment House, New Cairo,
Cairo Marriott Hotel,
M.S. Mayfair in Luxor
Slide 24

Recent and Future Expansions
2016-2020
2015 2016 2017
Woven 13 looms added increasing production
capacity by 6%
4 new goblin looms
9 new looms
2 yarn production
lines
8 looms were added till November
2 looms should be received before
yearend
Tufted MAC penetrated the artificial turf
segment following the addition of two
new machines
2017: Digital Printing Machine
Non-woven Two new machines added Two new machines
added 2-3 machines to be added
Slide 25

3Q 2017 Cost Breakdown
Source: Company Almost 63% of costs are dollar based.
Slide 26
Industrial Exp. 11%
Selling Exp. 19%
Other 18%
Wool 5%
Polypropylene- Nylon 30%
Backing 10%
Finishing material 7%
Raw material 52%

Polypropylene is OW main raw material
Polypropylene granules are carefully sourced after receiving monthly price quotations from different suppliers, taking into account other cost factors associated with importing the granules.
Almost 50% of the polypropylene needs are sourced locally and the remaining needs are imported from regional suppliers.
Sources: Company
Polypropylene — used in synthetic and blended rugs
and carpets — is an oil derivative, representing
around 28% of costs. Polypropylene prices are driven
in large part by:
i) Oil prices ii) Market demand for polypropylene
PP prices (in $/ Metric Tons)
Slide 27
990
1,363
1,629 1,456
1,585 1,576
1,184
986 1,116
300
900
1,500
2,100
2009 2010 2011 2012 2013 2014 2015 2016 9M 2017
USD /ton

Net sales (EGP bn)
6.8 +15% growth y-o-y
FY 2016 financial Summary
Net Profit (EGP mn)
484 +36% y-o-y
EBITDA (EGP mn)
1,116 +39% y-o-y performance
EBITDA Margin
16.5% +243 bps y-o-y
Net Cash Flow from Operations EGP 1,422mn
Net debt Paid off
EGP57 mn
Recorded rebates
+EGP214
mn
Capex
EGP529
mn
Annual Financial and Operational Performance
Slide 28

Financial Summary
* On adjusted basis including figures of the merged Modern EFCO
694 772 803 1,116
12.6% 13.3% 13.7%
16.5%
6%
10%
14%
18%
100
350
600
850
1,100
2013 2014* 2015 2016
EGPmn EBITDA EBITDA margin
347 377 356 484
6.3% 6.5% 6.1%
7.1%
4%
6%
8%
100
200
300
400
500
2013 2014* 2015 2016
EGPmn Net income Net margin
1.4 1.0 0.8 1.3
2.0
1.2 1.0
1.2
0.0
0.5
1.0
1.5
2.0
2.5
0.0
0.5
1.0
1.5
2013 2014 2015 2016
EGPbn Net debt Net debt/EBITDA
Slide 29
EBITDA Performance (EGPbn) Net Income Performance Net Debt (EGPbn)
3-year CAGR 24% 3-year CAGR 23%

9M 2017 Financial summary
Slide 30
Quarterly EBITDA Performance (EGPmn) 9M EBITDA Performance (EGPmn) 2
09
19
7
25
4
32
7
13.9% 13.0%
16.0% 12.6%
0%
2%
4%
6%
8%
10%
12%
14%
16%
18%
-
50
100
150
200
250
300
350
3Q 2014 3Q 2015 3Q 2016 3Q 2017
EBITDA EBITDA margin
65
3
65
8
76
5 1,1
69
15.0% 14.9%
16.8% 15.6%
14%
14%
15%
15%
16%
16%
17%
17%
0
200
400
600
800
1,000
1,200
1,400
9M 2014 9M 2015 9M 2016 9M 2017
EBITDA EBITDA margin

9M 2017 Financial summary
Slide 31
Quarterly Net income Performance (EGPmn) 9M Net income Performance (EGPmn) 6
9
33
13
3
10
9 4.6%
2.1%
8.4%
4.2%
0.0%
2.0%
4.0%
6.0%
8.0%
10.0%
-
20
40
60
80
100
120
140
3Q2014 3Q2015 3Q2016 3Q2017
Net income Net Margin
30
9
29
4
39
5 54
8
7.1% 6.5%
8.7% 7.3%
0.0%
2.0%
4.0%
6.0%
8.0%
10.0%
-
100
200
300
400
500
600
9M 2014 9M 2015 9M 2016 9M 2017
Net income Net Margin

Impact of Energy Subsidy Reform on Costs
* Energy cost represents less than 4% of the company’s total cost
Energy cost Jun-14 Jul-15 Jul-16 Jul-17
%
Change
Natural gas (US$/mmbtu) 2.25 5 5 5 -
Electricity (EGP/KW) 0.28 0.435 0.53 0.77 48%
Transportation costs (EGP
Diesel/Liter) 1.1 1.80 2.35 3.65 55%
Slide 32

Documents submitted to Export Subsidy
Fund
Export subsidies
(% of exports in EGP)
Exports
Export cash proceeds
Export Incentive Program:
Sources: Company
EGP200 mn delayed
disbursement till
October 2017
OW recorded
EGP78mn as of 9M
2017.
Slide 33

Export Incentive Program
The program includes only very minor changes to incentive rates, but does offer exporters extra incentives in growing USD exports from 10%–25%, exporting to Africa and opening new markets (such as Russia, China, Latin America, CIS).
These amendments should be implemented retroactively on export shipments starting July 1, 2016.
Non-free Zone area (NFZ) Weighted average
Free Zone area (FZ) Weighted average Average rate based
on 70% of exports from FZ
Program Local
materials Imported materials 50%/50%
Local materials
Imported materials 50%/50%
Old 10% 6% 8% 9% 5.0% 7.0% 7.3%
New* 12% 6% 9% 9% 4.5% 6.8% 7.4%
Slide 34

Share Data
Sources: Company
o450 mn shares at par value of EGP 1 per share.
o Issued and Paid-in Capital EGP 450 mn.
oListed in EGX since September 1997.
o3 Month average daily value EGP6.2mn.
o Market Cap USD 430 mn (as of Nov 25, 2017).
o2016 DPS of EGP1.4.
oReuters; Bloomberg ORWE.CA; ORWE EY.
Khamis Family 56%
Institutions 39%
Foreign Institutions 27% Local Institutions 12%
Treasury Shares 1%
Retail 4%
Shareholders’ structure
0.5 0.5 0.6 1.5
78% 76% 81%
92%
0%
20%
40%
60%
80%
100%
-
0.200
0.400
0.600
0.800
1.000
1.200
1.400
1.600
1.800
2013 2014 2015 2016
EGP EPS Payout ratio
Slide 35

Disclaimer
Certain information contained in this document consists of forward-looking statements reflecting the current view of the Company with respect to future events and are subject to certain risks, uncertainties and assumptions. Many factors could cause the actual results, performance or achievements of the Company to be materially different from any future results, performance, or achievements that may be expressed or implied by such forward-looking statements, including worldwide economic trends, the economic and political climate of Egypt and the Middle East and changes in business strategy and various other factors. Should one or more of these risks or uncertainties materialize, or should underlying assumptions prove incorrect, actual results may vary materially from those described in such forward-looking statements. Recipients of this document are cautioned not to place any reliance on these forward-looking statements. The Company undertakes no obligation to republish revised forward-looking statements to reflect changed events or circumstances.
Slide 36

For More Information, please contact
Ingy El-Diwany, CFA
Investor Relations Manager
+202-22685166
www.orientalweavers.com
Slide 37