organizational adoption of open source software · organizations and individuals can use open...
TRANSCRIPT

Organizational Adoption of Open Source Software
Diomidis Spinellisa,∗, Vaggelis Giannikasa,b
aDepartment Management Science and Technology, Athens University of Economics and Business, Patision 76, GR-104 34 Athens, GreecebInstitute for Manufacturing, University of Cambridge, 17 Charles Babbage Road, Cambridge, CB3 0FS, United Kingdom
Abstract
Organizations and individuals can use open source software(OSS) for free, they can study its internal workings, andthey can even fix it or modify it to make it suit their particular needs. These attributes makeOSSan enticing techno-logical choice for a company. Unfortunately, because most enterprises view technology as a proprietary differentiatingelement of their operation, little is known about the extentof OSS adoption in industry and the key drivers behindadoption decisions. In this article we examine factors and behaviors associated with the adoption ofOSSand provideempirical findings through data gathered from theUS Fortune-1000 companies. The data come from each company’sweb browsing and serving activities, gathered by sifting through more than 278 million web server log records andanalyzing the results of thousands of network probes. We show that the adoption ofOSS in largeUS companies issignificant and is increasing over time through a low-churn transition, advancing from applications to platforms. Itsadoption is a pragmatic decision influenced by network effects. It is likelier in larger organizations and those withmany less productive employees, and is associated withIT and knowledge-intensive work and operating efficiencies.
Keywords: open source software, technology adoption, industrial practice
1. Introduction
Thousands of volunteers and numerous companies develop, distribute, and license software in a way that allowsothers to freely use it, study it, modify it, and redistribute it. What are the prospects of the organizational adoption ofthis so-called open source software (OSS) and why should we care?
In this paper, through a novel application of web server log scanning and host fingerprinting techniques, we gatherevidence ofOSSadoption among theUS Fortune-1000 companies, and use it to examine factors associated withOSS
adoption. Our observations are statistically significant and span a wide sample of companies. However, although eachresearch question we test is backed by existing theories, wefreely admit that our study as a whole is data-driven ratherthan grounded on a single cohesive theoretical framework. Our main contributions are: a) findings that theoreticalframeworks of organizationalOSSadoption could build upon and should be able to explain, and b) the description anddemonstration of powerful internet-based methods for collecting data about an organization’sIT operations.
A commonly acceptedOSSdefinition (Coar 2006) specifies that complying software must be licensed for free re-distribution (at no cost or for profit), must provide access to its source code, should allow the creation of derived worksprovided they respect the creation of the original author, and should not restrict the use of the software with referenceto specific persons, groups, fields of endeavor, products, technologies, or other software. Well-known examples ofopen source software include the Linux operating system kernel, the Mozilla Firefox web browser, the OpenOffice.orgoffice application suite, the MySQL relational database system, and thePHPprogramming language. ManyOSSprod-ucts offer plausible alternatives to the corresponding proprietary products, while some, like the the Apache web server,
∗Corresponding author. Email address:[email protected] of Systems and Software, 85(3):666–682, March 2012.This is a machine-readable rendering of a working paper draft that led to a publication. The publication should always becited in preference
to this draft using the reference in the previous footnote. This material is presented to ensure timely dissemination ofscholarly and technical work.Copyright and all rights therein are retained by authors or by other copyright holders. All persons copying this information are expected to adhereto the terms and constraints invoked by each author’s copyright. In most cases, these works may not be reposted without the explicit permission ofthe copyright holder.
Preprint submitted to Elsevier February 18, 2012

the Sendmail mail server, and theBIND domain name system server, are market leaders in their categories (NetcraftLtd 2009, E-Soft Inc 2007, Simpson and Bekman 2007, Kerner 2007).
With its roots in the academic worldOSSwas initially viewed with suspicion by some companies. As a represen-tative example, Microsoft openly attacked it citing problems related to version incompatibilities, intellectual propertyrisks (especially in the context of copyleft licenses), lack of a credible business model, and an inability to fund in-novation (Mundie 2001, The Economist). However, otherIT companies have embraced it for operational or strategicreasons. One example of operational use involves Google’s thousands of servers, which work on a modified version ofLinux, thus benefiting the company through the system’s low cost and the ability to modify it to suit its needs (Weber2005, p. 6). As another example consider Apple, which has used OSScode from the Mach and FreeBSD operating sys-tems to leapfrog in the development of its widely-acclaimedMac OS X operating system (West 2003). On the strategicfront, IBM has built a large community of developers and potential clients around the open source Eclipse integratedsoftware development environment (Gamma and Beck 2004), while Sun—before becoming part of Oracle—created ahuge (though commercially underutilized) mindshare amongprogrammers and system administrators with the open-sourcing of its Java platform and Solaris operating system (Goldman and Gabriel 2005).
Proponents of open source software advance various arguments regarding the benefits of its adoption (West andDedrick 2001, Wheeler 2007, Ven and Verelst 2006) — see Section 2.1. There is also considerable anecdotal evidenceon the use ofOSS in non IT companies (see references in Section 2.3). However, theories and arguments on theadoption ofOSSare seldom substantiated by empirical data, and the available data are patchy, difficult to replicate andquantify, and unsuitable for deriving generally useful theories and prescriptive results. To address these problems weanalyze factors associated with the adoption ofOSS(Section 3) and validate them empirically through the analysis ofdata collected for theUS Fortune-1000 companies (Section 5). The data come from eachcompany’s web browsing andserving activities, gathered by sifting through more than 278 million web server log records and analyzing the resultsof thousands of network probes (Section 4).
There are several reasons motivating our study. First, patterns ofOSS adoption in the Fortune-1000 companiesreveal best practices, challenges, and opportunities thatmay be applicable to other organizations. Given the role ofknowledge barriers in technology diffusion (Attewell 1992), our findings outline the role of an ecosystem that canlower them. In addition, the software industry forms a vitaland important part of theUS economy (Rubin et al. 2002).The emergence ofOSSis likely to form a disruptive change. Therefore, companiesdeveloping proprietary software canstudyOSSadoption patterns to best determine how to adjust their business models. Moreover, the agile end-user andvolunteer-driven practices used for developing open source software differ markedly from the more rigid processesoften followed in the development of proprietary software.Thus, the commercial adoption of products developedunder theOSSmodel can be a precursor to wider changes on how many other products are developed and marketed(von Hippel 1998, 2001). Finally, for-profit and volunteerOSS development organizations can study the way theirproducts are adopted in order to optimize their offerings and their dissemination strategies.
2. Related Work
Theories and empirical data related to this article fall roughly into four fields: organizational adoption ofIT inno-vation, research on the adoption ofOSSby organizations, studies ofOSSadoption at an aggregate level, and reportson specific cases ofOSSuse. We examine work related to this paper’s specific research questions and in particular theorganizational adoption ofIT innovation in Section 3.
2.1. OSS Adoption by Organizations
For the choice of software that fits best an organization’s needs Wang and Wang (2001) proposed criteria for aproduct-oriented evaluation framework. They used this framework to compare open source systems, arguing that mostof the criteria one must consider when choosing anOSSare common with those of proprietary software selection.
Searching why and how enterprises adopt open source Dedrickand West (2003), based on a series of interviewswith MIS managers, developed a grounded theory of open source platform adoption. They classified the inherentfactors they found into five categories: the willingness to take risks on a new and unproven technology, the need fororganizational slack to evaluate the new technology and to self-support unsponsored technologies, the low cost of opensource software, the inherent trialability of “free” software distributed on the internet, and the availability of externalsources of support and expertise. An important contribution of this study is the suggestion for researchers to study theinnovation adoption decision separately from the issues associated with switching between standards.
2

This advice was coincidentally followed by Glynn et al. (2005) who investigated a case of large-scaleOSSadoptionin a specific organization. Significant factors proved to be:the possibility of collaborating in a reciprocal fashion withtheOSScommunity, the awareness of other organizations that were adoptingOSS, cost, the availability ofOSS-literatepersonnel, and the ability to modify and access the source code.
Research around benefits and significant factors drivingOSS adoption, has led to the conclusion that the mostimportant reason of choosing open source is purchasing costand the total cost of ownership (Forrester 2008). Althoughother benefits like stability and performance (Berlecon Research 2002), flexibility and control (The Dravis Group2003), external support (Ven and Verelst 2006) and security(Walli et al. 2005) are also stressed in the advantageslisted by open source adopters, it seems that total cost of ownership and lower acquisition cost are the most significantones.
On the other hand, there are also many factors that operate asbarriers toward the organizational adoption ofOSS. Among them the most important ones seem to be knowledge barriers, integration with legacy applications,uncertainties introduced by forking, sunk costs, and technological immaturity (Nagy et al. 2010).
2.2. Aggregate Studies of OSS Adoption
Numerous studies examineOSSadoption across whole regions, industries, or applicationdomains. More detailedpresentations of such work can be found in a survey conductedby UNU-MERIT (2006), Wheeler’s 2007 article onthe reasons of choosingOSS, and recent work on the dynamics of theOSScommunity (Deshpande and Riehle 2008).
In brief, studies agree that web and database servers are themost common types ofOSSused. According to Uni-sphere Research (2006) 71% of Linux users chose it to host their web servers and 65% for their databases. Examiningthe adoption of web servers, evidence suggests that open source is the most popular choice, mainly because of theApache web server with its adoption showing a rising trend during the last 15 years (Netcraft Ltd 2009, E-Soft Inc.2009). Examining the use of open source operating systems, studies have reported thatOSS adoption on servers ismarkedly higher than onPCs and workstations. Specifically, Netcraft Ltd (2001) foundthat 45% of operating systemsused by computers running public internet web sites was opensource, just 4.5 percentage points below Microsoft’sshare. Gradually the adoption ofOSS is moving beyond the server market extending along the entire software andapplication stack. Forrester (2008), in a study of companies usingOSS for experimental projects or prototyping ona group level, found that 62% usedOSSdesktop applications and 71%OSSprogramming languages. Finally, on thesectoral distribution ofOSSadoption two studies report that firms in the telecommunications sector are the ones mostlikely to adoptOSS(Walli et al. 2005, IDC 2005), while several surveys indicate the importance of a firm’s size inOSS
adoption (Walli et al. 2005, Unisphere Research 2006). These last two findings are examined and discussed later inour paper.
2.3. Specific Cases of OSS Adoption
We searched existing publications looking for specific cases of OSSadoption categorizing them according to theapplications used, the organization in which they were used, and the reasons cited for choosingOSS.1 We foundrelatively few studies and even fewer containing enough details in all three areas. It is therefore not prudent to derivereliable conclusions from the sum of these studies.
From the studies we examined, 17 organizations usedOSS for providing back-office functionality, two for salessupport, eight in theirR& D activities, and more than 30 for unspecified purposes. Reasons cited for choosingOSS in-cludelower cost(Voth 2003, Proctor et al. 2003, Searls 2004, Fitzgerald andKenny 2004, Rossi et al. 2005, Matthewset al. 2008),lower hardware cost(IDC 2001a, Geiszler et al. 2004; Woods and Guliani 2005, p. 85), software fea-tures (IDC 2001b, Yang and Jiang 2007, Matthews et al. 2008),lower total cost of ownership(Gupta et al. 2008),quick deployment (Searls 2003),portability across platforms (Voth 2003),avoidance of formal procurement andcommercial license management(Voth 2003), andcustomizability (Proctor et al. 2003).
3. Theory and Research Questions
Before posing our research questions we must set straight our terminology: the meaning ofOSSadoption and itsrelationship to its actual use. A thorny issue in the diffusion of innovation studies are adoption’s so-calledassimilation
1In our search we ignored grey-literature sources, such as web sites, pamphlets, and trade press articles.
3
OSS Adoption
Phenomenology Technological Context Organizational Context Individual Factors External Environment
Q1Adoption level
Q2Adoption dynamics
Q3Driving software
Q4Network effects
Q5Organization size
Q6IT usage intensity
Q7Cost savings
Q8Operational stability
Q11Policy
Q9Knowledge intensity
Q10Personal productivity
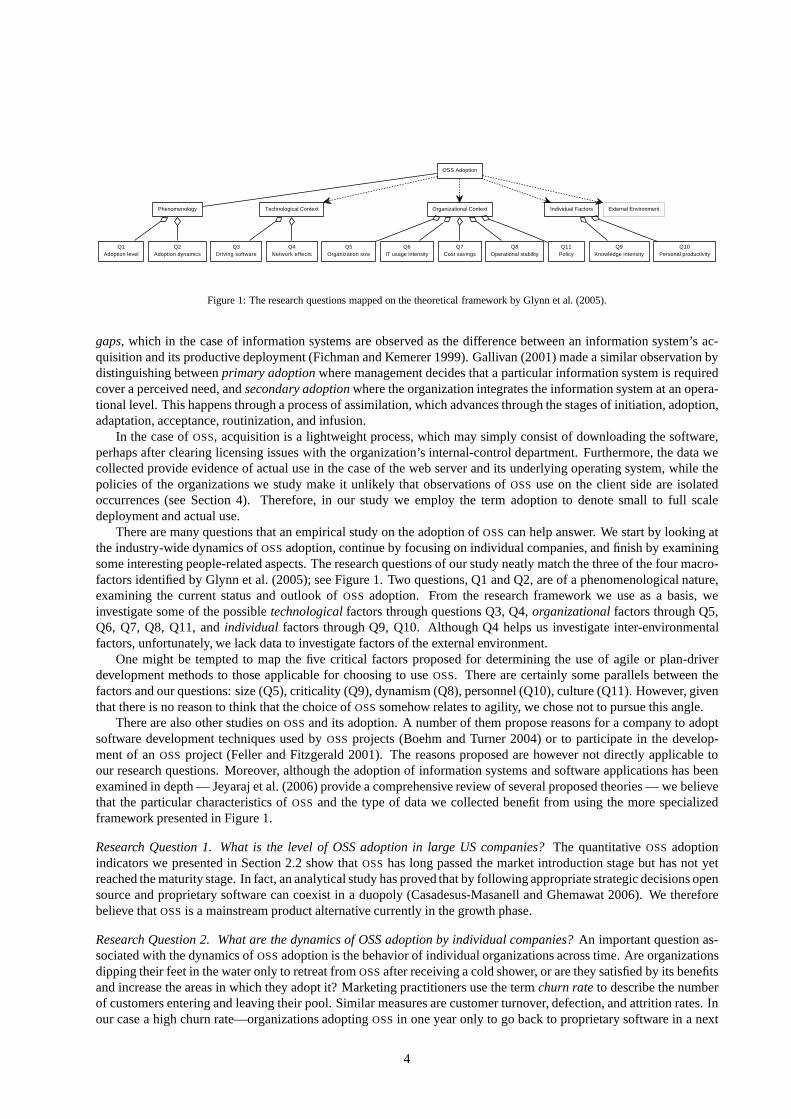
Figure 1: The research questions mapped on the theoretical framework by Glynn et al. (2005).
gaps, which in the case of information systems are observed as thedifference between an information system’s ac-quisition and its productive deployment (Fichman and Kemerer 1999). Gallivan (2001) made a similar observation bydistinguishing betweenprimary adoptionwhere management decides that a particular information system is requiredcover a perceived need, andsecondary adoptionwhere the organization integrates the information system at an opera-tional level. This happens through a process of assimilation, which advances through the stages of initiation, adoption,adaptation, acceptance, routinization, and infusion.
In the case ofOSS, acquisition is a lightweight process, which may simply consist of downloading the software,perhaps after clearing licensing issues with the organization’s internal-control department. Furthermore, the datawecollected provide evidence of actual use in the case of the web server and its underlying operating system, while thepolicies of the organizations we study make it unlikely thatobservations ofOSS use on the client side are isolatedoccurrences (see Section 4). Therefore, in our study we employ the term adoption to denote small to full scaledeployment and actual use.
There are many questions that an empirical study on the adoption of OSScan help answer. We start by looking atthe industry-wide dynamics ofOSSadoption, continue by focusing on individual companies, and finish by examiningsome interesting people-related aspects. The research questions of our study neatly match the three of the four macro-factors identified by Glynn et al. (2005); see Figure 1. Two questions, Q1 and Q2, are of a phenomenological nature,examining the current status and outlook ofOSS adoption. From the research framework we use as a basis, weinvestigate some of the possibletechnologicalfactors through questions Q3, Q4,organizationalfactors through Q5,Q6, Q7, Q8, Q11, andindividual factors through Q9, Q10. Although Q4 helps us investigate inter-environmentalfactors, unfortunately, we lack data to investigate factors of the external environment.
One might be tempted to map the five critical factors proposedfor determining the use of agile or plan-driverdevelopment methods to those applicable for choosing to useOSS. There are certainly some parallels between thefactors and our questions: size (Q5), criticality (Q9), dynamism (Q8), personnel (Q10), culture (Q11). However, giventhat there is no reason to think that the choice ofOSSsomehow relates to agility, we chose not to pursue this angle.
There are also other studies onOSSand its adoption. A number of them propose reasons for a company to adoptsoftware development techniques used byOSS projects (Boehm and Turner 2004) or to participate in the develop-ment of anOSS project (Feller and Fitzgerald 2001). The reasons proposedare however not directly applicable toour research questions. Moreover, although the adoption ofinformation systems and software applications has beenexamined in depth — Jeyaraj et al. (2006) provide a comprehensive review of several proposed theories — we believethat the particular characteristics ofOSS and the type of data we collected benefit from using the more specializedframework presented in Figure 1.
Research Question 1. What is the level of OSS adoption in large US companies?The quantitativeOSS adoptionindicators we presented in Section 2.2 show thatOSS has long passed the market introduction stage but has not yetreached the maturity stage. In fact, an analytical study hasproved that by following appropriate strategic decisions opensource and proprietary software can coexist in a duopoly (Casadesus-Masanell and Ghemawat 2006). We thereforebelieve thatOSSis a mainstream product alternative currently in the growthphase.
Research Question 2. What are the dynamics of OSS adoption byindividual companies?An important question as-sociated with the dynamics ofOSSadoption is the behavior of individual organizations across time. Are organizationsdipping their feet in the water only to retreat fromOSSafter receiving a cold shower, or are they satisfied by its benefitsand increase the areas in which they adopt it? Marketing practitioners use the termchurn rateto describe the numberof customers entering and leaving their pool. Similar measures are customer turnover, defection, and attrition rates.Inour case a high churn rate—organizations adoptingOSS in one year only to go back to proprietary software in a next
4
one—would indicate problems in the technology’s adoption,even in the face of an increasing overall adoption rate. Incontrast, an increasing scope ofOSSproducts used might indicate that the organization is happywith OSSand seeks toexpand its perceived benefits to other areas.
The two main factors that might impede a company’s replacement of proprietary systems withOSSones of equiv-alent functionality are switching costs (von Weizsacker 1984, Brynjolfsson 1993, Bessen 2002) and customer loyalty(Dick and Basu 1994). Once these considerable obstacles areovercome we would expect a stable flow of transitionsprompted by the various benefits ofOSSoutlined in sections 2.1 and 2.3 and also presented in other studies (West andDedrick 2001, Wheeler 2007).
Research Question 3. In what order is OSS adopted within a company?Do companies adoptingOSSwork bottom-upfrom the operating system (which many consider a commodity)and progress to the more business-critical applications,or do they avoid the disruption of an operating system switchand instead test the waters in the application space? Themain determinants here are the decomposition of software into applications and infrastructure (Messerschmitt andSzyperski 2004, pp. 200–204), the advantages enjoyed by platform leaders (Cusumano 2004, pp. 74–77), and theimportance of network effects (Shapiro and Varian 1999).
One argument is that pragmatic users want particular results from theirIT infrastructure (for instance, obtainingor serving web pages). These can often be provided by anOSSapplication, and this scenario can be easily tested bydeploying such applications on the existing operating system. Once anOSSapplication is installed and proves its value,the underlying operating system can also be switched to an open source one, because the proprietary application thatrequired a corresponding operating system has been removed. This mode of adoption minimizes the drag of earliertechnology onIT adoption (Fichman and Kemerer 1993), and at the same time builds on the learning effects that mayarise from the earlier use of a technology (Stoneman 1981).
Other factors affecting the order of adoption include the risk associated with particular changes (critical real-timecustomer-serving systems, versus less-critical batch-oriented back-office operations), as well as the levels of trust thecompany places on various parts of anOSSecosystem.
Research Question 4. Is the selection of proprietary software or OSS subject to network effects?In the precedingresearch question 3 we posit a particular technology-basedadoption scenario. However, there may also be the casethat that there are concrete network-specific advantages inusing applications of a particular type (open source orproprietary). Several studies have examined the importanteffect of network externalities in a technology’s adoptionusing both theoretical methods (Katz and Shapiro 1986, 1994, Economides and Katsamakas 2006) and empiricalfindings (Saloner and Shepard 1995, Majumdar and Venkataraman 1998, Gowrisankaran and Stavins 2004).
Intra-organizational network effects (i.e. component selection interactionswithin a company’s boundaries) asso-ciated with the adoption ofOSScan be direct or indirect. The direct effects are associatedwith the prevalence of aparticular product within the organization where it enjoysadvantages over a competing product in the areas ofIT sup-port, software provision (Church and Gandal 1992), and training. For instance, if all a company’sPCs run MicrosoftWindows, itsIT administrators may find it easier to run the same system also on their servers. The indirect or two-sidednetwork effects (Parker and Van Alstyne 2005) are associated with the co-existence of different but complementaryproducts, such as the operating system and the application running on it, or the web server and the correspondingbrowser. In this case, products of the same kind benefit through their superior interoperability, through the availabil-ity of bundled licenses and support contracts, and through the organization’s contacts with (the typically segregated)support communities. This has been empirically validated for the case of web servers and browsers (Gallaugher andWang 2002). As a concrete example, if a company writes its software using Microsoft’s .NET development tools thiswill run reliably only the company’s Windows systems.
Based on the above description, we considerOSS and proprietary applications as two disjoined networks withinteroperability challenges. Specifically, we examine whether a particular organization will try to use eitherOSS
applications or proprietary ones, rather than mix the two kinds freely together.
Research Question 5. How is an organization’s size affecting the adoption of OSS?Let us now switch our view fromthe dynamics ofOSS adoption to the organizations adoptingOSS. The relationship between a company’s size andIT adoption can be viewed either from anIT management perspective (DeLone 1981) or by looking at a company’sorganizational characteristics (Hannan and McDowell 1984, Kelley and Helper 1999). For the majority of organiza-tions we have studied, the advantages of open source software are in most cases relatively small and tactical ratherthan strategic. However, they are compounded over the totalnumber of installations and the size of a company’sIT
operations (Cohen and Levinthal 1989), perhaps through economies of scale and scope. As an example, a company
5

with thousands of employees running only standardized web-based applications could easily switch theirPCs to runLinux and the Firefox web browser. Although such a move in a large organization will entail large switching costs,these are proportional to the organization’s resources andtherefore these large costs should not derail the choice ofswitching to new software.
Furthermore, studies have found that there is a positive relationship between organizational size, innovations, andtheir implementation (Damanpour 1992), that large firms aremore likely to adopt innovations before smaller ones(Davies 1975, p. 118), that the establishment and firm sizes are positively related toICT adoption (Bayo-Morionesand Lera-López 2007), and that a firm’s size also affects the availability of ICT-related skills (Morgan et al. 2006) andresources (Spanos et al. 2002), which are needed in a transition to OSS.
Research Question 6. How isIT usage intensity affecting OSS adoption?Another element of scale efficiencies is notassociated with a company’s size, but with the intensity ofIT usage within it. The theoretical underpinning is the sameas that of the preceding question 5, but the driver is a higherdensity ofIT installations. Compounding factors in thiscase are experience withIT technology (Venkatesh et al. 2003, pp. 433–435, 447) and technical know-how (Attewell1992). Thus, companies in fields with a highIT-usage intensity could be more likely to adoptOSS.
Research Question 7. Is OSS adoption associated with financial operating efficiencies?Numerous studies have ex-amined the influence on a company’s performance of technology policy and adoption in general (Tornatzky and Klein1982, Zahra and Covin 1993, Stoneman and Kwon 1996) andIT in particular (Brynjolfsson 1993, Brynjolfsson andYang 1996, Stiroh 2002, Carr 2003). On a first reading the results appear to be inconclusive. However, Hitt and Bryn-jolfsson in their classic 1996 paper used the theory of production and theories of competitive strategy to deduce thatthere is no inherent contradiction between increased productivity, increased consumer value, and unchanged businessprofitability.
In many cases the direct cost of purchasingOSSand keeping it up to date is zero or very low. If this cost is reflectedin an overall lower total cost of ownership it could lead to increased profits. However, given thatIT costs are typicallya relatively low percentage of a company’s total expenditures, it is more likely that the causal relationship will be theother way round. Namely, profitable well-run companies may be adoptingOSSas an additional appropriate practicefor lowering the cost and increasing the efficiency of their operations. This view is further strengthened by studiesarguing that firms for which an innovation is most profitable will become early adopters (von Hippel 1988, Attewell1992).
Research Question 8. How is an organization’s stability affecting OSS adoption?As posited by Nolan (1973) andothers who have built on his work (King and Kraemer 1984) the introduction of information technologies in an or-ganization proceeds in distinct stages. Therefore, it is likely that the introduction of a new technology, likeOSS, willface obstacles that will depend on the company’s state ofIT growth. Furthermore, the company’s growth stage mayalso be a significant factor in the adoption of innovation. However, the theoretical arguments for this are conflicting.Younger, growing firms may benefit through their flexibility (Christensen and Rosenbloom 1995) as well as throughlower adjustment costs and modern capital stock, while older, stable companies may profit from their technologicalexperience (Dunne 1994). This conflict is also reflected in empirical studies: some report a positive relationship be-tween an organization’s age and its ability to innovate (Sorensen and Stuart 2000) and others a negative one (Kimberlyand Evanisko 1981).
The introduction ofOSS in an organization can be disruptive, and the evolution and maintenance of existingOSS
installations trickier than comparable setups based on proprietary software. These problems can be less of an issue ina slower-growing, stable organization where change and therefore demands fromIT staff are lower. Companies thatare in a flux, as evidenced by increasing capital spending or sales, or high levels of debt, are more likely to minimizethe risk of theirIT operations (King et al. 1994, Fichman 2000) by opting for proprietary solutions. In contrast,more stable companies that do not exhibit the previously mentioned characteristics may have established a culture forprocess improvements and have more appetite forIT risk and the ability to manage it effectively, and will therefore bemore likely to adoptOSS.
Research Question 9. How is an organization’s human capitaloccupation affecting OSS adoption?A number ofstudies examine the characteristics of new technology adopters (Davis 1989, Thompson et al. 1991, Venkatesh et al.2003). The main causation factors include the judgment of one’s ability to use technology — as modeled in the socialcognitive theory of self-efficacy (Compeau and Higgins 1995), the perceived relative advantage within the contextof the innovation diffusion theory (Moore and Benbasat 1991), and the role of experience (Venkatesh et al. 2003,
6
pp. 433-435, 447). More specifically, Cohen and Levinthal (1989) found that human and knowledge capital are keydeterminants for a firm’s ability to assess technological opportunities and adoptICT, while Brynjolfsson and Hitt(2002) state that knowledge-intensive firms tend to be more eagerIT adopters.
The case for the adoption ofOSScan be further strengthened by hypothesizing that knowledge-intensive industriesare more likely to realize a significant-enough return on investment on open source technologies that will warrant theiradoption. In other industries the costs of switching to opensource and supporting non-mainstream technologies maybe difficult to justify, and, therefore, such industries will be less likely to adoptOSS.
Research Question 10. How is employee productivity affecting OSS adoption?Open source software is often lesspolished than its proprietary alternatives; version proliferation and poor usability are two often-reported problems(Nichols and Twidale 2003, Krishnamurthy 2005, Viorres et al. 2007). Highly-paid employees, like knowledge work-ers, may argue that the fit of theOSS(Thompson et al. 1991), the service quality it offers (DeLone and McLean 2003),or the perceived behavioral control they have over it (Ajzen1991) is worse than that of its proprietary alternative. Thekey factors for resisting such change can be classified into people-oriented, system-oriented, and interaction theories(Jiang et al. 2000). As the cost of the software used by highlyproductive workers forms a small percentage of theirtotal employment cost and the software’s quality reflects a lot on their productivity, spending on industry-standardproprietary software may be a rational decision. Consequently, we could expect that the relative advantage ofOSS
viewed as an innovation (Moore and Benbasat 1991, Rogers 2003) will be marginal. As an example, traders withseven figure incomes are unlikely to skimp on the operating system running on theirPCs.
Conversely, in Fortune 1000 companies with numerous but less productive employees adoption of cheaper thoughless polishedOSS can offer significant cost advantages, and therefore management can easier mandate its use. Forinstance, we can easily imagine the cost savings associatedwith thousands of service desks running Linux and theThunderbird mail client.
Research Question 11. Is the choice between OSS and proprietary software a matter of principle?The choices be-tween open source and proprietary software have been mainlyanalyzed in the context of business strategies (West2003) and the software industry (Economides and Katsamakas2006). Many open source adherents advocate theadoption ofOSSon the basis of ideology (Gay 2002), while opponents have cautioned against adoption by analyzingvarious risks (Mundie 2001). We thus examine whetherOSS ideology and risks carry real weight, or whether compa-nies will choose betweenOSSand proprietary software platforms in a rational and pragmatic manner looking for theirbest interest (Aupperle et al. 1985, Clarkson 1995), irrespective of the software’s license.
4. Methodology
We conducted our study by examining web server logs and usingnetwork probes to look for evidence ofOSS
adoption among theUS Fortune 1000 companies. Focusing on the Fortune 1000 companies benefited our study in anumber of ways. First, their large size means that such companies are likely to adopt innovations before smaller ones(Davies 1975, p. 118). In addition, the Fortune 1000 companies cover most sectors of theUS economy, while theiractivity forms a large part of it. In fact, their revenues amount to about 41.5% of the totalUS corporate revenues for2007 (US Census Bureau 2009) and about half (49.6%) of the total profits (Wolfram|Alpha 2009). Large firms are alsomore likely to be export-oriented or multinational therebyincreasing the study’s applicability to a global audience.Furthermore, their large size increases the visibility of their operations, and makes them more likely to appear in ourstudy’s browser software radar. Finally, our choice meant that for all the companies we could readily obtain relativelyreliable financial data, a sectoral categorization, and an address of an operating web site, and thereby also a probabledomain-name address their employees use when accessing theweb. Our study’sUS and large company focus confinessomewhat its wider applicability, but the limitation is offset by the data’s reliability and the sample’s homogeneity.
To a large extent our method avoids the self-selection, recall, and pro-adopter biases (Rogers 2003) that plagueother studies (Jeyaraj et al. 2006). With a questionnaire-based study it would be probable that companies with anti-quatedIT strategies and systems would fail to respond; the same couldalso be true for companies whoseIT manage-ment formed a tactical or strategic advantage. Both factorsintroduce a self-selection bias. Furthermore, self-reportsare unreliable thus adding a recall bias. Finally, case studies often focus on adopters introducing a pro-adopter bias.By collecting hard objective data from a predefined sample weavoid these pitfalls, at the expense however, of loosingthe ability to select all the questions we might want to answer.
7

Table 1: Industry Distribution in Log Data and Among Fortune1000 Companies (%)
Industries by SIC For each year For each year Any entry Population2002–2008 2006–2008 2002–2009
Agriculture, Forestry and Fishing 0.0 0.0 0.0 0.2Construction 0.0 0.7 0.6 1.8Finance, Insurance and Real Estate 3.1 15.9 16.0 16.1Manufacturing 59.4 40.3 38.5 37.7Mining 3.1 2.2 2.9 3.6Public Administration 0.0 0.4 0.2 0.1Retail Trade 0.0 8.0 10.5 11.2Services 21.9 15.9 13.9 11.3Transportations, Communications, 12.5 12.3 12.6 13.0Electric Gas and Sanitary ServicesWholesale Trade 0.0 4.3 4.8 5.0
4.1. Data Collection and Processing
We used a variety of techniques to obtain data about the software used on the companies’ desktops and by theirback-office operations. Due to the methods we used, we focused on three types of software in four distinct roles: theweb browser (on the desktop), the web server (in the back-office), and the operating system on which the two arerunning (on the desktop and in the back-office).
To determine the desktop operating system and web browser software used by each company we examined webserver logs. We collected about 55GB of log files from three sources: our own servers (4.7GB), servers of our personalcontacts (11.6GB), and files we located in the wild through Google queries (33.8GB). In total the log files contained278 million entries. Web servers record a log entry in a standardized format for every file they send to a web browser.For the purposes of our study the entry’s important fields arethe IP address, the date, and the client’s software. Asa first step we processed each entry to convert the (typically) numericalIP address, like 195.212.29.137 into a hostname like blueice18n5.uk.ibm.com. We then went through alllog entries looking for those where the last two parts ofa client’s hostname matched those of a Fortune 1000 company’s web site address. For instance, the above host namewould matchIBM ’s web site address www.ibm.com. We identified 4.7 million records associated with Fortune 1000companies. These requests included 16,705 unique machine signatures (anIP address, a browser, and an operatingsystem triple). Finally, for each matching entry we examined the client software details to determine whether the webbrowser and the underlying operating system were proprietary or open source. As an example, the following clientidentification string
Mozilla/5.0 (Windows; U; Windows NT 5.1; en-US; rv:1.9)Gecko/2008052906 Firefox/3.0
corresponds to an open source browser (Firefox) running on aproprietary operating system (Microsoft WindowsXP).We tabulated the results by company and year in a list specifying whether a company was found to use a proprietaryor open source (or both) operating system or browser.
To determine the web server used by each company we retrievedthe company’s top web page using thewgettool,and logged theHTTP protocol headers. One of those headers contains an identification string of the web server, whichwe used to establish whether the company used a proprietary or an open source product.
To determine the operating system type we employednmap, a network exploration and port scanning tool (Wolf-gang 2002).Nmapworks by sending specific network packets to the host, and analyzing minute accidental differencesin the responses that can be traced back to the responding computer’s operating system. It then matches those re-sults against a database of 1503 (for the version 4.76 we used) so-called operating system fingerprints. The match isprobabilistic in nature and can often fail.
Obtaining historical data regarding theOSS adoption proved difficult. The method we used to obtain adoptionevidence on the server side (the web server and its hosting operating system) provided us data only for the time weexecuted the probe. On the other hand, web server logs provided useful data for the client side (the web client andits hosting operating system) for a time period spanning from 2002 to 2009. We removed from the longitudinal studythe data from 2009, because it formed an incomplete and therefore potentially biased sample. (Events that occurred
8

rarely within a year would be underrepresented compared to the other, complete, years.) For a number of reasons,when looking for trends onOSSadoption we chose to look at the latest three years rather than the full six year periodfor which we had logs. First, the early logs came mainly from this paper’s first author web site, which focuses onIT
andOSS. This would introduce a bias due to the companies likely to access such material. Moreover, the availablelogs gave us required data only for 3.2% of the Fortune 1000 companies for the whole 2002–2008 period. Finally, datafrom the latest three years appear to give a considerably more representative sample of our population than data fromthe full six year period (see Table 1).
4.2. Threats to Validity
There are several threats to the validity of this study; manyare associated with the data we employed for identifyingcompanies using open source operating systems and browsers.
The first problem concerns the small number of software systems we examine. A company may use hundredsof software systems for a variety of purposes, but we examinejust four: the web browser, the web server, and theircorresponding operating system hosts. We argue that these are ubiquitous and highly-visible systems, from whichwe can derive generalizable lessons for desktop applications and system software. Nevertheless, lessons from thesesystems cannot apply to specialized vertical applications, and this remains a limitation of our study.
In addition, the time period we use for the research questions with a longitudinal component (Q1, Q2, Q3) is verysmall (three years). This was a result of balancing data quality against time coverage, as explained in Section 4.1. Forthis reason we do not perform any longitudinal regression analysis, and base our findings on statistically significantresults obtained for each year.
We determined the web browser and operating systems used in acompany by looking at the log entries createdduring web browsing. However, the web server logs we collected form only a tiny fraction of a company’s completebrowsing activity. As detailed in Section 4.1, for all the Fortune-1000 companies we identified 4.7 million web pagerecords; on average 4,668 requests per company. These requests included 16,705 unique machine signatures giving usan average of 16.7 uniquely-configuredPCs per company. Therefore, our work shares the problems of anyempiricalstudy based on a small sample of field data.
Other, less important, possible sources of error include the parallel presence ofOSSand proprietary applications,the provenance of the logs we examined, web requests performed by a company’s visitors, the mapping of numericalIP addresses into host names, doctoredHTTP headers, and limitations of the fingerprinting technique weemployed.
A concern voiced by some of this work’s reviewers is whether the use of a particular operating system or browserreflects a company’s policy rather than choices of individual employees. For this reason studies ofIT acceptanceoften distinguish between voluntary vs. mandatory contexts (Venkatesh et al. 2003) and stress the importance ofemploying a multilevel perspective. This criticism is justified, because we academics and researchers are blessed withvirtually unlimited freedom regarding the choice, setup, and configuration of our computing infrastructure. However,the situation in industry is different. There, automated mass installations from a single stable configuration image, aseverely constrained user ability to install new software,and rigidly enforcedIT policies are the rule. In large listedcompanies externally imposed legal requirements and standards,2 the provision of a standard operating environment,and the imposition of change management procedures align the software used by a company’s employees with itspolicies.
5. Analysis and Findings
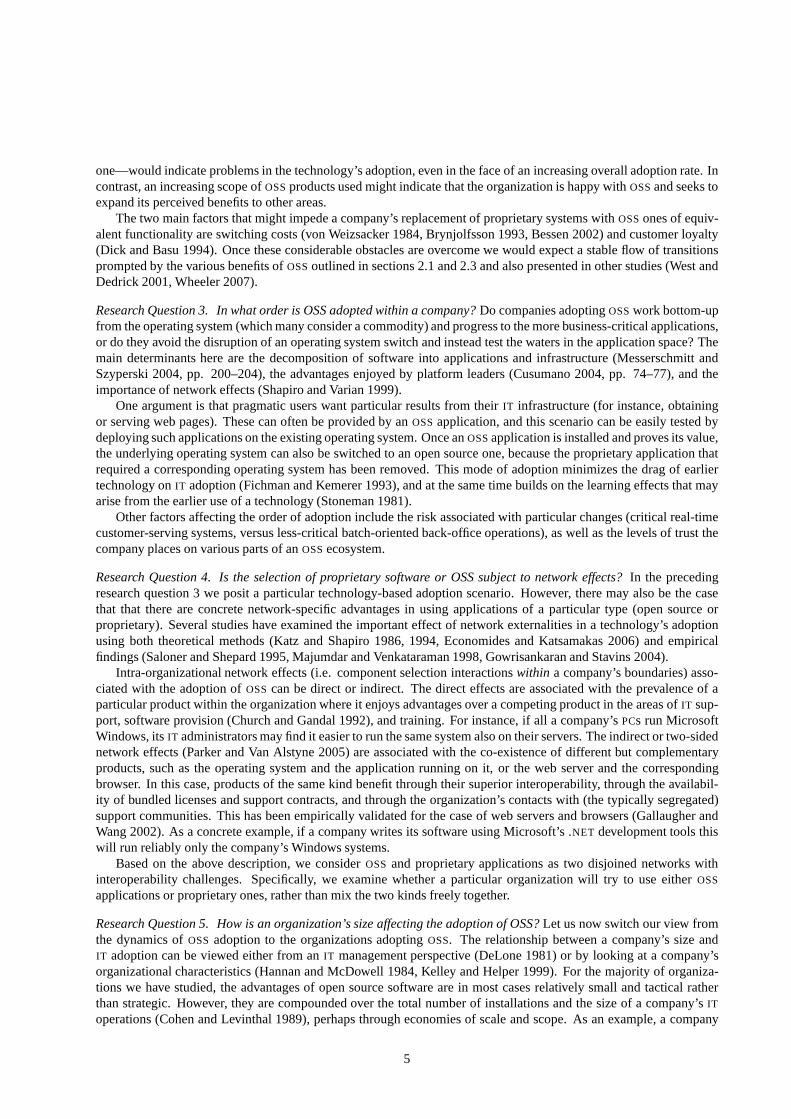
In order to search relationships and differences between financial data andOSSwe started by looking at the differ-ence between the means ofOSSusers and nonOSSusers using the t-test method (Table 2). We then used the logisticregression model (Ross 2004) based on the binomial distribution to find the specific relation between our measuresand the type of software used (open source or proprietary)—see Table 3. We chose this model in order to handlethe “evidence ofOSS adoption” binary dependent variable. All the other analyses are commented in each researchquestion and the corresponding results can be found in this paper’s tables.
2Larsen et al. (2006) list 17IT governance tools, among them the well-known Sarbanes-Oxley Act of 2002 (SOX) and Information TechnologyInfrastructure Library (ITIL ).
9

Table 2: Statistical Results of t-test Analysis
OSS Proxy Mean t-test p-valueUsers Non-users
Any
Assets 45,132 21,392 2.7458 0.0061**Capital Spending 5 Year 12.85 18.18−2.8148 0.0050**Growth RateGross Margin 5 Yr Avg 36.52 32.00 2.9380 0.0034**Gross MarginTTMa 34.57 29.42 3.3307 0.0009***Profits 851 569 1.6208 0.1054Positive Profits 1,210 730 2.9193 0.0036**Revenue Over 667,525 1,563,088−2.0478 0.0413*EmployeeTTM
Revenues 14,270 9,191 3.0363 0.0025**Sales 5 Year Growth Rate 11.53 15.58−2.2555 0.0245*
WebBrowser
Revenues 16,932 9,544 3.3780 0.0008***Capital Spending 5 Year 12.07 16.23−2.0088 0.0462*Growth rateProfits 993 491 2.2027 0.0281*Positive Profits 1,455 660 4.2950 2.18×10⁻⁵***Revenue Over 674,797 992,923−1.9729 0.0509*EmployeeTTM
Price to Tangible BookMRQb 3.7790 2.2158 3.1306 0.0019**
Client OS
Revenues 24,839 12,395 3.3830 0.0010***Gross Margin 5 Yr Avg 40.95 3,515 2.2226 0.0277*Gross MarginTTM 39.22 3,298 2.3548 0.0198*Profits 2,315 486 4.3463 2.79×10⁻⁵***Positive Profits 2,611 876 4.1299 0.0001***Revenue Over 540,980 819,519−2.5600 0.0112*EmployeeTTM
Web Server
Assets 45,856 19,258 2.5062 0.0127*Revenues 13,776 10,178 1.9698 0.0493*Gross Margin 5 Yr Avg 36.46 33.08 2.0094 0.0451*Revenue Over 621,814 1,326,272−2.1751 0.0301*EmployeeTTM
SalesTTM vs. 5.0407 8.9279 −2.2109 0.0273*TTM One Year Ago
ServerOS
Capital Spending 5 Year 11.84 17.76−2.5478 0.0115*Growth RateGross Margin 5 Yr Avg 40.02 33.52 2.3921 0.0180*SalesTTM vs. 2.3631 10.9705 −3.2821 0.0011**TTM One Year Ago
(*) α=0.05, (**) α=0.01, (***) α=0.001
aTrailing twelve months.bMost recent quarter.
10
Table 3: Statistical Results of Logistic Regression Analysis
Dependent Variable Independent Variable Coefficient Wald Z p-value
Open Source SoftwareAdoption
Assets 2.37×10⁻⁶a 2.4732 0.0133*Capital Spending 5 Year −9.10×10⁻³ −2.6837 0.0073**Growth RateGross Margin 5 Yr Avg 1.03×10⁻² 2.7788 0.0055**Gross MarginTTM 1.07×10⁻² 3.1186 0.0018**Profits 4.17×10⁻⁵ 1.5728 0.1158Positive Profits 1.38×10⁻⁴ 2.8801 0.0040**Revenue / EmplTTM −1.51×10⁻⁷ −2.4287 0.0152*Revenues 1.09×10⁻⁵ 2.8715 0.0041**Sales 5 Year Growth Rate −9.97×10⁻³ −2.1806 0.0292*
OSSWeb BrowserAdoption
Revenues 1.81×10⁻⁵ 2.5934 0.0095**Capital Spending 5 Year −0.0140 −2.1139 0.0345*Growth RatePositive Profits 0.0003 2.7849 0.0054**Revenue / EmplTTM −2.32×10⁻⁷ −2.3068 0.0211*Price to Tangible BookMRQ 0.1115 2.3704 0.0178*
OSSWeb ClientOS
Adoption
Revenues 1.42×10⁻⁵ 3.6523 0.0003***Profits 0.0003 4.7087 3.88×10⁻⁶***Positive Profits 0.0003 4.6175 2.49×10⁻⁶***Gross Margin 5 Yr Avg 0.0112 2.1029 0.0355*Gross MarginTTM 0.0119 2.2721 0.0231*Revenue / EmplTTM −2.00×10⁻⁷ −2.0097 0.0445*Price to Tangible BookMRQ 0.0515 2.0567 0.0397*
OSSWeb ServerAdoption
Assets 2.25×10⁻⁶ 2.6807 0.0073**Gross Margin 5 Yr Avg 0.0079 2.0100 0.0444*Revenue / EmplTTM −1.72×10⁻⁷ −1.9599 0.0500*SalesTTM vs. −0.0070 −1.9668 0.0492*TTM One Year Ago
OSSWeb ServerOS
Adoption
Capital Spending 5 Year −0.0164 −2.3972 0.0165*Growth RateGross Margin 5 Yr Avg 0.0151 2.4482 0.0144*Gross MarginTTM 0.0114 2.0096 0.0445*SalesTTM vs. −0.0188 −2.8322 0.0046**TTM One Year Ago
aThe very small coefficient values are due to the very big difference between the values of the variables (0/1 for the dependent variable and manyorders of magnitude higher values for the independent one).This also occurs in the other regression tests.
11
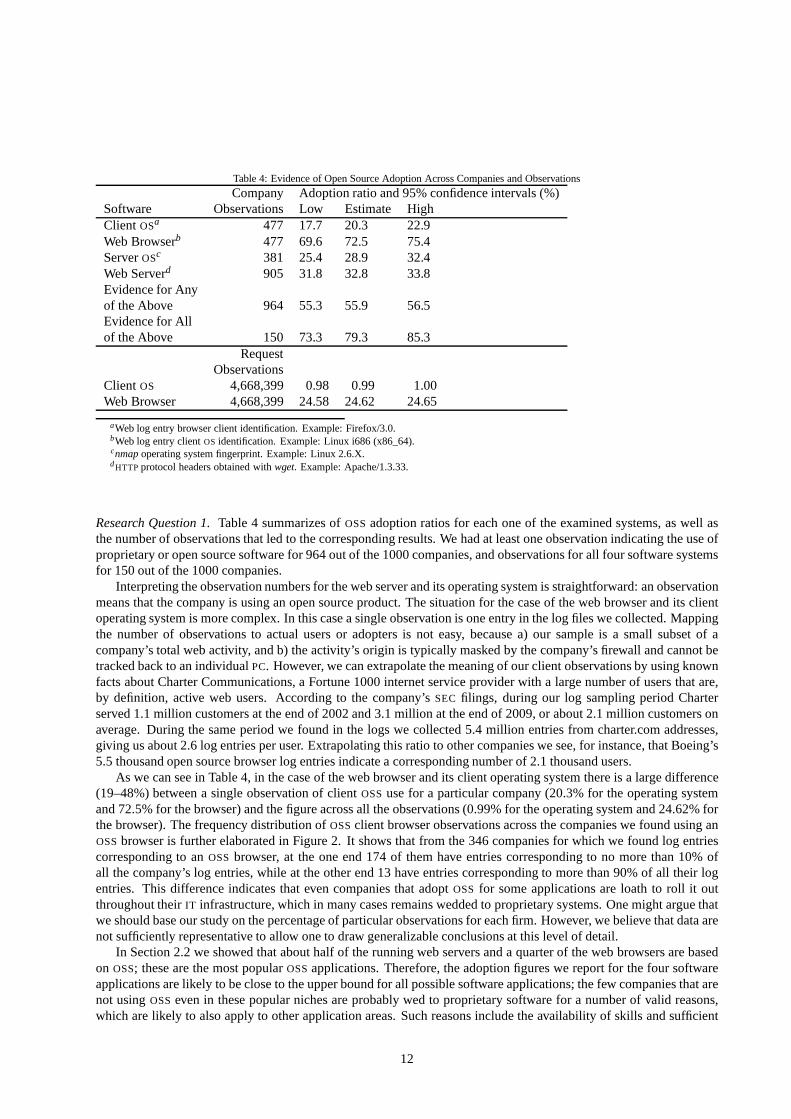
Table 4: Evidence of Open Source Adoption Across Companies and Observations
Company Adoption ratio and 95% confidence intervals (%)Software Observations Low Estimate HighClient OSa 477 17.7 20.3 22.9Web Browserb 477 69.6 72.5 75.4ServerOSc 381 25.4 28.9 32.4Web Serverd 905 31.8 32.8 33.8Evidence for Anyof the Above 964 55.3 55.9 56.5Evidence for Allof the Above 150 73.3 79.3 85.3
RequestObservations
Client OS 4,668,399 0.98 0.99 1.00Web Browser 4,668,399 24.58 24.62 24.65
aWeb log entry browser client identification. Example: Firefox/3.0.bWeb log entry clientOS identification. Example: Linux i686 (x86_64).cnmapoperating system fingerprint. Example: Linux 2.6.X.dHTTP protocol headers obtained withwget. Example: Apache/1.3.33.
Research Question 1.Table 4 summarizes ofOSSadoption ratios for each one of the examined systems, as wellasthe number of observations that led to the corresponding results. We had at least one observation indicating the use ofproprietary or open source software for 964 out of the 1000 companies, and observations for all four software systemsfor 150 out of the 1000 companies.
Interpreting the observation numbers for the web server andits operating system is straightforward: an observationmeans that the company is using an open source product. The situation for the case of the web browser and its clientoperating system is more complex. In this case a single observation is one entry in the log files we collected. Mappingthe number of observations to actual users or adopters is noteasy, because a) our sample is a small subset of acompany’s total web activity, and b) the activity’s origin is typically masked by the company’s firewall and cannot betracked back to an individualPC. However, we can extrapolate the meaning of our client observations by using knownfacts about Charter Communications, a Fortune 1000 internet service provider with a large number of users that are,by definition, active web users. According to the company’sSEC filings, during our log sampling period Charterserved 1.1 million customers at the end of 2002 and 3.1 million at the end of 2009, or about 2.1 million customers onaverage. During the same period we found in the logs we collected 5.4 million entries from charter.com addresses,giving us about 2.6 log entries per user. Extrapolating thisratio to other companies we see, for instance, that Boeing’s5.5 thousand open source browser log entries indicate a corresponding number of 2.1 thousand users.
As we can see in Table 4, in the case of the web browser and its client operating system there is a large difference(19–48%) between a single observation of clientOSSuse for a particular company (20.3% for the operating systemand 72.5% for the browser) and the figure across all the observations (0.99% for the operating system and 24.62% forthe browser). The frequency distribution ofOSSclient browser observations across the companies we found using anOSSbrowser is further elaborated in Figure 2. It shows that fromthe 346 companies for which we found log entriescorresponding to anOSS browser, at the one end 174 of them have entries corresponding to no more than 10% ofall the company’s log entries, while at the other end 13 have entries corresponding to more than 90% of all their logentries. This difference indicates that even companies that adoptOSS for some applications are loath to roll it outthroughout theirIT infrastructure, which in many cases remains wedded to proprietary systems. One might argue thatwe should base our study on the percentage of particular observations for each firm. However, we believe that data arenot sufficiently representative to allow one to draw generalizable conclusions at this level of detail.
In Section 2.2 we showed that about half of the running web servers and a quarter of the web browsers are basedon OSS; these are the most popularOSSapplications. Therefore, the adoption figures we report forthe four softwareapplications are likely to be close to the upper bound for allpossible software applications; the few companies that arenot usingOSSeven in these popular niches are probably wed to proprietarysoftware for a number of valid reasons,which are likely to also apply to other application areas. Such reasons include the availability of skills and sufficient
12
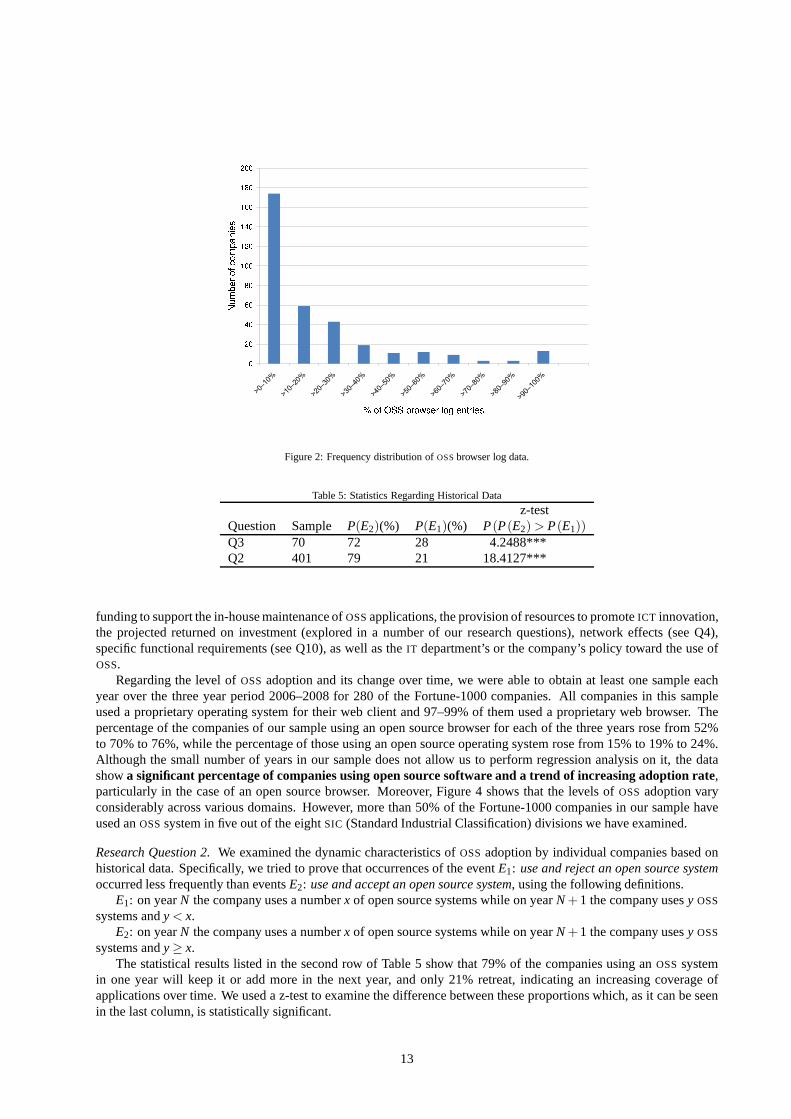
Figure 2: Frequency distribution ofOSSbrowser log data.
Table 5: Statistics Regarding Historical Data
z-testQuestion Sample P(E2)(%) P(E1)(%) P(P(E2)> P(E1))Q3 70 72 28 4.2488***Q2 401 79 21 18.4127***
funding to support the in-house maintenance ofOSSapplications, the provision of resources to promoteICT innovation,the projected returned on investment (explored in a number of our research questions), network effects (see Q4),specific functional requirements (see Q10), as well as theIT department’s or the company’s policy toward the use ofOSS.
Regarding the level ofOSS adoption and its change over time, we were able to obtain at least one sample eachyear over the three year period 2006–2008 for 280 of the Fortune-1000 companies. All companies in this sampleused a proprietary operating system for their web client and97–99% of them used a proprietary web browser. Thepercentage of the companies of our sample using an open source browser for each of the three years rose from 52%to 70% to 76%, while the percentage of those using an open source operating system rose from 15% to 19% to 24%.Although the small number of years in our sample does not allow us to perform regression analysis on it, the datashowa significant percentage of companies using open source software and a trend of increasing adoption rate,particularly in the case of an open source browser. Moreover, Figure 4 shows that the levels ofOSS adoption varyconsiderably across various domains. However, more than 50% of the Fortune-1000 companies in our sample haveused anOSSsystem in five out of the eightSIC (Standard Industrial Classification) divisions we have examined.
Research Question 2.We examined the dynamic characteristics ofOSSadoption by individual companies based onhistorical data. Specifically, we tried to prove that occurrences of the eventE1: use and reject an open source systemoccurred less frequently than eventsE2: use and accept an open source system, using the following definitions.
E1: on yearN the company uses a numberx of open source systems while on yearN+1 the company usesy OSS
systems andy< x.E2: on yearN the company uses a numberx of open source systems while on yearN+1 the company usesy OSS
systems andy≥ x.The statistical results listed in the second row of Table 5 show that 79% of the companies using anOSSsystem
in one year will keep it or add more in the next year, and only 21% retreat, indicating an increasing coverage ofapplications over time. We used a z-test to examine the difference between these proportions which, as it can be seenin the last column, is statistically significant.
13
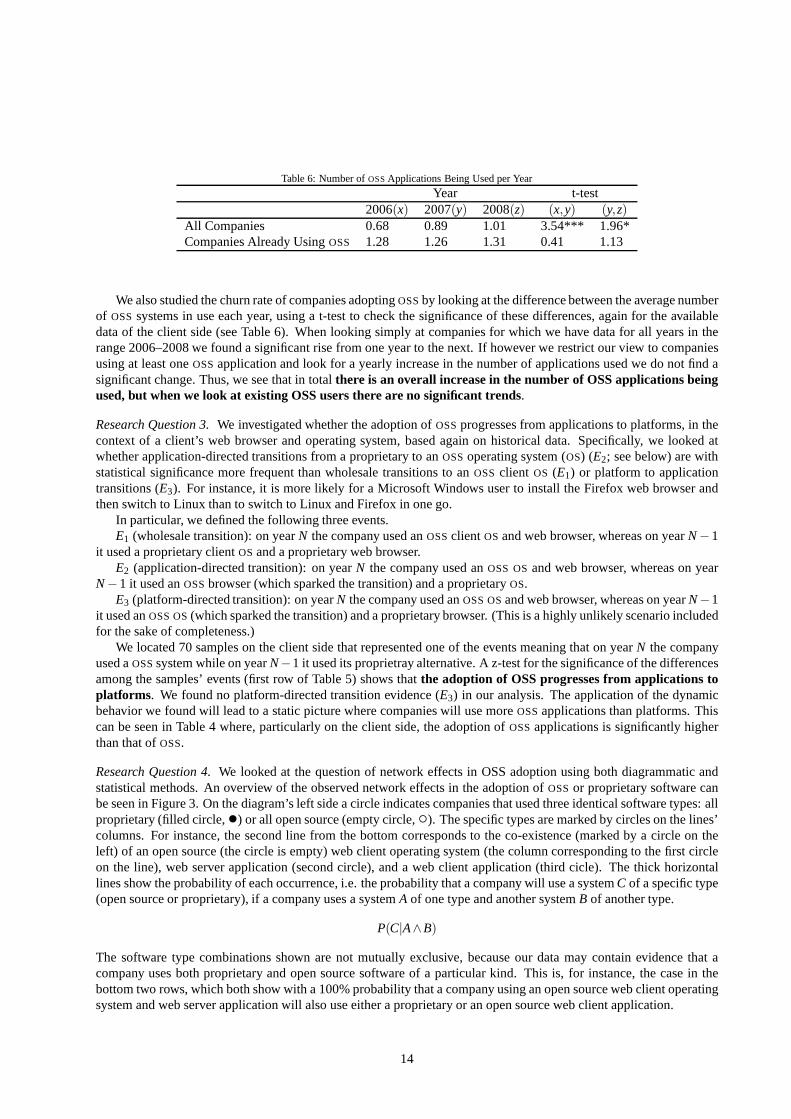
Table 6: Number ofOSSApplications Being Used per Year
Year t-test2006(x) 2007(y) 2008(z) (x,y) (y,z)
All Companies 0.68 0.89 1.01 3.54*** 1.96*Companies Already UsingOSS 1.28 1.26 1.31 0.41 1.13
We also studied the churn rate of companies adoptingOSSby looking at the difference between the average numberof OSSsystems in use each year, using a t-test to check the significance of these differences, again for the availabledata of the client side (see Table 6). When looking simply at companies for which we have data for all years in therange 2006–2008 we found a significant rise from one year to the next. If however we restrict our view to companiesusing at least oneOSSapplication and look for a yearly increase in the number of applications used we do not find asignificant change. Thus, we see that in totalthere is an overall increase in the number of OSS applications beingused, but when we look at existing OSS users there are no significant trends.
Research Question 3.We investigated whether the adoption ofOSSprogresses from applications to platforms, in thecontext of a client’s web browser and operating system, based again on historical data. Specifically, we looked atwhether application-directed transitions from a proprietary to anOSSoperating system (OS) (E2; see below) are withstatistical significance more frequent than wholesale transitions to anOSS client OS (E1) or platform to applicationtransitions (E3). For instance, it is more likely for a Microsoft Windows user to install the Firefox web browser andthen switch to Linux than to switch to Linux and Firefox in onego.
In particular, we defined the following three events.E1 (wholesale transition): on yearN the company used anOSSclient OS and web browser, whereas on yearN−1
it used a proprietary clientOS and a proprietary web browser.E2 (application-directed transition): on yearN the company used anOSS OSand web browser, whereas on year
N−1 it used anOSSbrowser (which sparked the transition) and a proprietaryOS.E3 (platform-directed transition): on yearN the company used anOSS OSand web browser, whereas on yearN−1
it used anOSS OS(which sparked the transition) and a proprietary browser. (This is a highly unlikely scenario includedfor the sake of completeness.)
We located 70 samples on the client side that represented oneof the events meaning that on yearN the companyused aOSSsystem while on yearN−1 it used its proprietray alternative. A z-test for the significance of the differencesamong the samples’ events (first row of Table 5) shows thatthe adoption of OSS progresses from applications toplatforms. We found no platform-directed transition evidence (E3) in our analysis. The application of the dynamicbehavior we found will lead to a static picture where companies will use moreOSSapplications than platforms. Thiscan be seen in Table 4 where, particularly on the client side,the adoption ofOSSapplications is significantly higherthan that ofOSS.
Research Question 4.We looked at the question of network effects in OSS adoption using both diagrammatic andstatistical methods. An overview of the observed network effects in the adoption ofOSSor proprietary software canbe seen in Figure 3. On the diagram’s left side a circle indicates companies that used three identical software types: allproprietary (filled circle,•) or all open source (empty circle,◦). The specific types are marked by circles on the lines’columns. For instance, the second line from the bottom corresponds to the co-existence (marked by a circle on theleft) of an open source (the circle is empty) web client operating system (the column corresponding to the first circleon the line), web server application (second circle), and a web client application (third cicle). The thick horizontallines show the probability of each occurrence, i.e. the probability that a company will use a systemC of a specific type(open source or proprietary), if a company uses a systemA of one type and another systemB of another type.
P(C|A∧B)
The software type combinations shown are not mutually exclusive, because our data may contain evidence that acompany uses both proprietary and open source software of a particular kind. This is, for instance, the case in thebottom two rows, which both show with a 100% probability thata company using an open source web client operatingsystem and web server application will also use either a proprietary or an open source web client application.
14
If a company usesweb client
app OSweb serverapp OS
and usesweb client
app OSweb serverapp OS
it will also useweb client
app OSweb serverapp OS
72267
9291871599999595351747
13542
415156
458233337282
156459642
41517
274951599358787917296
27417174848
Allor
0% #samples
100%Probability
Proprietary software Open source software
Figure 3: Network effects in the adoption ofOSSor proprietary software.
15
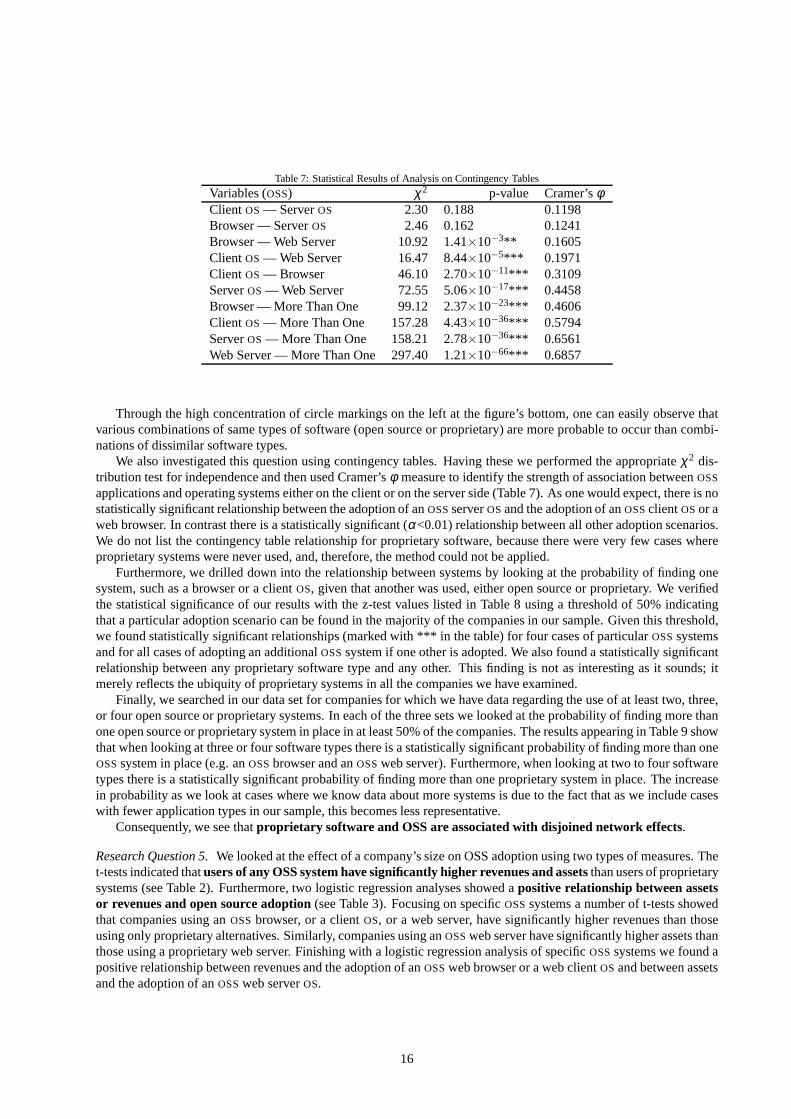
Table 7: Statistical Results of Analysis on Contingency Tables
Variables (OSS) χ2 p-value Cramer’sφClient OS — ServerOS 2.30 0.188 0.1198Browser — ServerOS 2.46 0.162 0.1241Browser — Web Server 10.92 1.41×10⁻³** 0.1605Client OS — Web Server 16.47 8.44×10⁻⁵*** 0.1971Client OS — Browser 46.10 2.70×10⁻¹¹*** 0.3109ServerOS — Web Server 72.55 5.06×10⁻¹⁷*** 0.4458Browser — More Than One 99.12 2.37×10⁻²³*** 0.4606Client OS — More Than One 157.28 4.43×10−36*** 0.5794ServerOS — More Than One 158.21 2.78×10−36*** 0.6561Web Server — More Than One 297.40 1.21×10−66*** 0.6857
Through the high concentration of circle markings on the left at the figure’s bottom, one can easily observe thatvarious combinations of same types of software (open sourceor proprietary) are more probable to occur than combi-nations of dissimilar software types.
We also investigated this question using contingency tables. Having these we performed the appropriateχ2 dis-tribution test for independence and then used Cramer’sφ measure to identify the strength of association betweenOSS
applications and operating systems either on the client or on the server side (Table 7). As one would expect, there is nostatistically significant relationship between the adoption of anOSSserverOSand the adoption of anOSSclient OSor aweb browser. In contrast there is a statistically significant (α<0.01) relationship between all other adoption scenarios.We do not list the contingency table relationship for proprietary software, because there were very few cases whereproprietary systems were never used, and, therefore, the method could not be applied.
Furthermore, we drilled down into the relationship betweensystems by looking at the probability of finding onesystem, such as a browser or a clientOS, given that another was used, either open source or proprietary. We verifiedthe statistical significance of our results with the z-test values listed in Table 8 using a threshold of 50% indicatingthat a particular adoption scenario can be found in the majority of the companies in our sample. Given this threshold,we found statistically significant relationships (marked with *** in the table) for four cases of particularOSSsystemsand for all cases of adopting an additionalOSSsystem if one other is adopted. We also found a statisticallysignificantrelationship between any proprietary software type and anyother. This finding is not as interesting as it sounds; itmerely reflects the ubiquity of proprietary systems in all the companies we have examined.
Finally, we searched in our data set for companies for which we have data regarding the use of at least two, three,or four open source or proprietary systems. In each of the three sets we looked at the probability of finding more thanone open source or proprietary system in place in at least 50%of the companies. The results appearing in Table 9 showthat when looking at three or four software types there is a statistically significant probability of finding more than oneOSSsystem in place (e.g. anOSSbrowser and anOSSweb server). Furthermore, when looking at two to four softwaretypes there is a statistically significant probability of finding more than one proprietary system in place. The increasein probability as we look at cases where we know data about more systems is due to the fact that as we include caseswith fewer application types in our sample, this becomes less representative.
Consequently, we see thatproprietary software and OSS are associated with disjoinednetwork effects.
Research Question 5.We looked at the effect of a company’s size on OSS adoption using two types of measures. Thet-tests indicated thatusers of any OSS system have significantly higher revenues and assetsthan users of proprietarysystems (see Table 2). Furthermore, two logistic regression analyses showed apositive relationship between assetsor revenues and open source adoption(see Table 3). Focusing on specificOSSsystems a number of t-tests showedthat companies using anOSSbrowser, or a clientOS, or a web server, have significantly higher revenues than thoseusing only proprietary alternatives. Similarly, companies using anOSSweb server have significantly higher assets thanthose using a proprietary web server. Finishing with a logistic regression analysis of specificOSSsystems we found apositive relationship between revenues and the adoption ofanOSSweb browser or a web clientOS and between assetsand the adoption of anOSSweb serverOS.
16

Table 8: Adoption Relationships Between Systems
P(Uses(x)|Uses(y)) z-testy x n(%) n> 50%
OSS
Client OS Browser 100 51.0156***a
Web Server Browser 81 11.5908***ServerOS Browser 73 4.3858***Web Server ServerOS 60 2.2972*ServerOS Web Server 58 1.8090Client OS Web Server 58 1.6368Client OS ServerOS 51 0.1770Browser ServerOS 44 −1.2401Browser Web Server 43 −2.6892Web Server ClientOS 29 −6.4683Browser ClientOS 28 −11.2424ServerOS Client OS 26 −4.3858Client OS More Than One 100 51.0156***Web Server More Than One 80 12.3322***ServerOS More Than One 74 6.1270***Browser More Than One 57 3.3574***
Proprietary
Browser ClientOS 100 51.0156***ServerOS Client OS 100 51.0156***Web Server ClientOS 100 51.0156***Client OS Browser 98 51.0156***Web Server Browser 97 51.0156***ServerOS Browser 96 24.1783***ServerOS Web Server 86 19.6397***Web Server ServerOS 84 17.9629***Client OS Web Server 64 7.8448***Browser Web Server 64 7.7645***Client OS ServerOS 60 2.8158**Browser ServerOS 59 2.4865*Browser More Than One 100 51.0156***Client OS More Than One 99 51.0156***Web Server More Than One 96 51.0156***ServerOS More Than One 94 35.5233***
aWe use this value as the biggest possible forz
Table 9: Statistics of Adopting More Than One Application ofthe Same Typet
Number of Known P(∃i, j : t(ai) = t(a j)) z-testApplicationsa1...ak
Sample n(%) n> 50%
k .
OSS
At Least 2 446 51 0.8906At Least 3 353 55 2.4606*All Four 119 63 3.3528***
ProprietaryAt Least 2 668 94 83.0644***At Least 3 578 99 182.1667***All Four 354 100 369.3907***
17

0
10
20
30
40
50
60
70
80
Constructio
nMining
WholesaleTrade
Manufacturing
Transportatio
n & Utility Services
Retail Trade
Finance, Insurance & Real Estate
Services
OS
S A
doption %
Figure 4: Evidence ofOSSadoption across industries.
Research Question 6.A correlation analysis between an industry sector’sIT capital stock share (Stiroh 2001) and itscorrespondingOSSadoption ratio gives a Kendall’sτ coefficient of 0.33, which indicates an agreement, though notperfect, between the two rankings.3 We thus find thatthe adoption of OSS benefits from a high intensity of ITusage as measured through the IT capital stock share.
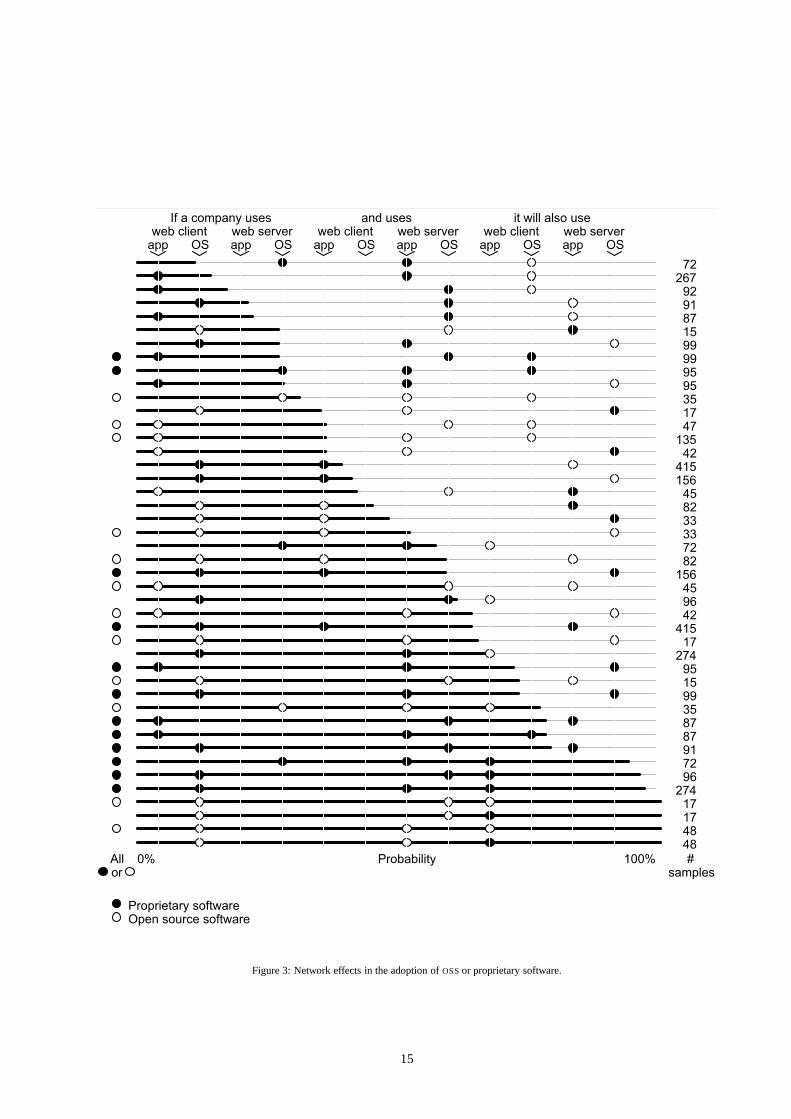
Furthermore, Figure 4 illustrates the level ofOSSadoption ratio evidenced by our data across the ten top levelSIC
divisions. The divisions are ordered by increasing rates ofOSSadoption, and one can thus readily observe thatOSS
adoption is rising with surprising regularity from the diagram’s left to the right as a company’s focus moves towardthe consumer presumably commanding a higher intensity ofIT usage.
Research Question 7.We observed statistically significantdifferences on gross margins and (positive) profits be-tween users and non-users of OSS. Furthermore, we also found significant positive coefficients of the logistic re-gression (Table 3). We failed to demonstrate a relationshipbetween profits in general (including losses expressed asa negative value) and the adoption ofOSS. This is not too surprising, because a company (other than anairline) withlosses is in a short-term exceptional state and all bets regarding its strategy and tactics are off. Looking at specificOSS
systems t-tests analyses show that companies using open source client operating systems have higher gross margins(TTM and five year average) and (positive) profits than those usingproprietary alternatives. Companies usingOSS
browsers appear to have higher profits, while companies running anOSSweb server or serverOS have significantlyhigher five year average gross margins than companies running proprietary alternatives. Furthermore, for each of thepreceding measures logistic regression finds a positive relationship with the adoption of anOSSclientOS, a web server,and serverOS. Web browser adoption is related only with positive profits,while the adoption of a serverOS is alsorelated in a positive way with both the five year average and the TTM gross margin values.
Research Question 8.We tested the organizational stability effect on OSS adoption by performing a t-test for meansand a logistic regression analysis (see tables 2 and 3). We used three financial measures as proxies of a company’sdynamism: capital spending five year growth rate, sales five year growth rate, and salesTTM vs. TTM one year ago.These indicators measure change, therefore, companies with low values will be unexciting and stable whereas growingand volatile companies will have high associated indicatorvalues.
The t-tests indicated thatcompanies using any OSS system have significantly lower dynamic financial indica-tors than those using proprietary systems(see Table 2) apart from salesTTM vs. TTM one year ago for which thisdifference existed only for the server side. Also, three logistic regression analyses showed a statistically significantnegative relationship between the financial indicators associated with lively, volatile, and growing companiesand OSS adoption(see Table 3). Again the same relationship held only for the software on the server side regarding
3In order to match with the source’s classification we split the manufacturing industry into Durable (SIC codes 20–23, 26–31) and Non-Durable(SIC codes 24, 25, 32–39)
18

Table 10: Statistics on Adoption of BothOSSand Proprietary Software
Number of Known P(use both software types) z-testapplications Sample n(%) n> 50%At Least 2 692 60 10.6668***At Least 3 434 81 22.2601***All 150 79 9.6187***
Table 11: Company Examples Across Research Questions
Level Evidence ofOSSAdoption ExampleIT usage High Yes PSSWorld Medicalintensity Low No Newmont Mining CorporationKnowledge High Yes Travelersintensity Low No TargetRevenue per High No Dow Chemicalemployee Low Yes MGM MirageConsumer High Yes Starwood Hotelsfocus Low No Kiewit
salesTTM vs. TTM one year ago. Focusing on specificOSSsystems a number of t-tests showed that companies usingan OSS web browser or serverOS present a lower growth rate of capital spending in the last five years. Similarly,companies that use anOSSweb browser or serverOS present lower levels of salesTTM vs. TTM one year ago. Thelogistic regression showed a negative relationship between the five year average capital spending growth rate and theadoption of anOSSweb browser or serverOS, and between salesTTM vs. TTM one year ago and the adoption of aOSS
web server or serverOS.
Research Question 9.Again, Figure 4 indicates that in relative termsOSSadoption is lower in sectors where manualworkers are prevalent and higher in sectors where knowledgeworkers dominate. Similarly, a correlation analysisbetween an industry sector’s knowledge workers share (Wolff 2006) and its correspondingOSSadoption ratio gives aKendall’sτ coefficient of 0.52, which indicates an even better agreement than that obtained for question 6. Moreover,on the client side, t-test and logistic regression show thatorganizations with knowledge-intensive workers are aptto adopt OSS. The t-tests indicated that companies usingOSS browsers have significantly higher price to tangiblebookMRQ while logistic regression showed that there is a positive relationship between this measure and the adoptionof bothOSSsoftware types on the client side (see tables 2 and 3).
Research Question 10.We examined the relationship between employees’ productivity andOSSadoption by lookingat the revenue that each employee brings into the company. The statistical analysis listed in tables 2 and 3 indicatesthatOSS is more likely to be adopted by large organizations with less productive employees.
A number of t-tests showed that adopters of an open source browser, clientOS and web server produce lessrevenue for their firm (on aTTM base) while logistic regression proved that the adoption ofthese software types is alsonegatively correlated with the revenues over employeeTTM figure.
Research Question 11.We tested the pragmatism ofOSSadoption choices by looking for zealots: companies that useexclusively open source or proprietary software. We chose sets of companies for which we had data regarding theirsoftware choices in the same way as that used in question 4. Table 10 confirms that in the three data sets 61–81% of thecompanies will mix and match both software types. The raw results are also interesting. In the set of 150 companiesfor which we have data on all four software systems only 31 companies used just proprietary software, just 11 usedOSSfor all four software types, and no companies used exclusively OSS. We thus see thatorganizations will mix andmatch OSS and proprietary products as needed.
6. Discussion and Conclusions
Our results show that the adoption ofOSS in largeUS companies is significant and is increasing over time (Q1)through a low-churn transition (Q2), advancing from applications to platforms (Q3). The adoption ofOSS is a prag-
19
matic decision (Q11) influenced by network effects (Q4). Theadoption is likelier in larger organizations (Q5) and isassociated withIT and knowledge-intensive work (Q6, Q9), operating efficiencies (Q7), and less productive employees(Q10). Table 11 lists scenarios ofOSSadoption as indicated by our findings illustrated by examples of conceivablecorresponding companies. (Although the examples are consistent with our data, we do not claim statistically validatedsignificance for the specific cases.)
The results associated with question 10 may seem to contradict the answers to questions 6 and 9. One would expectknowledge-intensive workers to be associated with high-revenues per employee andIT usage intensity. However, atleast in the context ofOSSadoption, we have seen that these are orthogonal measures. There seem to be knowledge-intensive operations with relatively low revenues per employee, such as a call center, which can benefit fromOSS
adoption. There are also cases, such as in the health industry, where high revenues per employee are not (yet) associatedwith a relative high intensity ofIT usage.
Our findings are broadly in agreement with existing theory onthe coexistence of open source and proprietarysoftware in a duopoly (Figure 3 — Casadesus-Masanell and Ghemawat 2006), switching costs (Q2 — von Weizsacker1984), the advantages enjoyed by platform leaders (Q3 — Cusumano 2004, pp. 74–77), the drag of earlier technologyon IT adoption (Q3 — Fichman and Kemerer 1993), network effects (Q4 — Katz and Shapiro 1986), the positiverelationship between organizational size and the adoptionof innovation (Q5 — Kimberly and Evanisko 1981), theeffect of technical know-how (Q6 — Attewell 1992), the role of a company’s technological experience (Q8 — Dunne1994), the risk inIT operations (Q8 — King et al. 1994), the importance of human and knowledge capital (Q9 —Cohen and Levinthal 1989), and the rationality of corporatesocial responsibility (Q11 — Clarkson 1995). Two ofour findings add weight to intensly studied organizationalIT adoption predictors reported by Jeyaraj et al. (2006).Specifically, organizational size (Q5) has been found to be significant in 8 out of 12 studies, and theIS department size(indirectly examined by Q6) has been found to be significant in 4 out of 7 studies.
On the other hand, we felt that our research was treading on thin theoretical ground in the areas of intra-organizationalnetwork effects (Q4), the relationship ofIT operations and profitability (Q7), and the effect of an individual’s produc-tivity on IT adoption decisions (Q10). These are clearly areas that can benefit from further research. Finally, as onewould expect, our study failed to find support that companiesfollow the ideological arguments associated with theadoption ofOSS(Q11 — Gay 2002).
It would be a mistake for organizations to read our results ina prescriptive manner. The wayOSSis currently beingadopted does not mean that this is the wayOSSshould be adopted. A number of companies have successfully usedOSSas means of strategic differentiation (Samuelson 2006, West 2003). It is quite likely that the majority of successfulOSSadoption cases concerns inward-lookingIT systems, which our study failed to capture. Even at the tactical level,innovation and progress in theIT industry can well change the wayOSS is deployed and used. Following the flockreduces only known risks and will limit opportunities.
Despite the applicability limits of our results, which we outlined in the preceding paragraph, there are some clearlessons that aCTO can learn from this study.OSS is a legitimate technological choice, which is increasingly followedby majorUS companies. In stable slow-growth environments with a largenumber of software installations the lowpurchasing and maintenance cost ofOSScan result in savings and thereby increased profitability. Examples include callcenters, workstations running just web-based applications, special-purpose platforms, like cash registers and mobileterminals, large server farms, and wide scale deployments of bespoke software with few dependencies on proprietaryecosystems. OSS is not an all or nothing proposition; it can be adopted in a gradual fashion testing the waters forbenefits and unknown risks.
Our study’s findings are likely to be painful for theOSScommunity. For many of its members, there are powerfulengineering, organizational, and ideological factors acting in favor ofOSS(Gay 2002, Kuan 2003). Nevertheless, ourstudy found evidence that the open source software’s main advantage is its low cost. Where this doesn’t dominate acompany’s financials and purchasing decisions, in rapidly-changing demanding areas and environments, proprietaryofferings seem to have an edge. Yet, there is no reason for thecommunity to read too much from these findings. Formost of its lifeOSShas thrived in the hands of enthusiasts and hobbyists, away from the limelight of big business. Theonly who should legitimately worry are those viewingOSSas a foundation for a highly profitable business model. Wefind it unlikely for somebody to achieve financial success on software that is freely available and that big companiestreat as a low priced commodity. In any case, theOSS community has always had an uneasy relationship with thesoftware’s commercial exploitation, and in that light our results can be seen as positive.
Furthermore, one finding of our study (Q3) can help the formulation of the Linux community’s strategy. Thisshows that proponents of Linux who try to pushOSS from a platform to the desktop may be fighting the wrong war.Organizations are more likely to adopt anOSSoperating system if they have already migrated toOSSapplications.
20
Perhaps, the clearest lessons from our study concern the software industry. We showed that in the area of webclients and serversOSShas a large following, and that big companies are increasingly adopting it as they realize itscost benefits in those areas. Software companies that derivea large part of their income from selling standardizedproducts that can be easily replaced byOSSofferings risk seeing their corresponding income stream collapse. Possibleremedies include balancing the business between the offering of products and services (Messerschmitt and Szyperski2004) and moving toward higher-value, more sophisticated,and tighter integrated products, which we have shown tobe less likely to be replaced byOSS.
We were startled by this paper’s results. This paper’s first author is not a neutral observer, but anOSSadvocate. Hehas written two monographs with hundreds of examples fromOSSsystems (Spinellis 2003, 2006), he has developeda number ofOSS tools, he is contributing to a majorOSS project, and has served as a board member of a nationalacademicNGO that promotesOSS. The paper’s findings came to him as an unwelcome surprise: the main reason foradoptingOSSis lower cost and higher operating efficiencies;OSSappears to be unwelcomed by highly-productive em-ployees and in rapidly growing and volatile organizations.Arguments frequently put forward in favor ofOSSregardingits flexibility and the retention of technological know-how(Wheeler 2007) were shattered through findings showingexactly the opposite. Organizations that need flexibility choose proprietary software, as do highly-paid employees whocould supposedly most benefit by tinkering withOSSto make it fit their needs.
Yet in retrospect the results are not too surprising, if one removes the rose-tainted glasses of romantic idealismand technological optimism. Companies will profit by focusing on their core competencies and by optimizing theiroperations (Prahalad and Hamel 1990). There are few reasonsto believe that the market would fail to provide themwith the software products most suitable for their needs in terms of flexibility, technological sophistication, or abilityto adapt software to their specific needs (Attewell 1992). The market’s success will therefore leave cost as the majorremaining benefit ofOSS.
Acknowledgements
We thank Georgios Giaglis, Georgios Gousios, Maria Kehagia, Alexandros Kouloumbis, Stathis Panagiotopoulos,Konstantinos Psounis, Eric Soderquist, Konstantinos Stroggylos for aiding us with references and data associated withthis study. We are also grateful to Antonios Andreatos, Alessio Maria Braccini, Ioanna Chini, Dimitrios Karaiskos,Panagiotis Louridas, Raphael Markellos, Thanos Papadimitriou, Dimitris Papakyriakopoulos, Nancy Pouloudi, Ange-liki Poulymenakou, Yannis Spanos, and Adam Vrechopoulos for interesting discussions and insights they provided forthis work. Parts of this work benefited from a presentation atthe Fourth Mediterranean Conference on InformationSystems, Athens, Greece (2009).
References
Ajzen, I., 1991. The theory of planned behavior. Organizational Behavior and Human Decision Processes 50, 179–211.
Attewell, P., 1992. Technology diffusion and organizational learning: The case of business computing. OrganizationScience 3, 1–19.
Aupperle, K.E., Carroll, A.B., Hatfield, J.D., 1985. An empirical examination of the relationship between corporatesocial responsibility and profitability. The Academy of Management Journal 28, 446–463.
Bayo-Moriones, A., Lera-López, F., 2007. A firm-level analysis of determinants of ICT adoption in Spain. Technova-tion 27, 352 – 366.
Berlecon Research, 2002. Free/libre open source software:Survey and study — use of open source software in firmsand public institutions: Evidence from Germany, Sweden andUK.
Bessen, J., 2002. Technology adoption costs and productivity growth: The transition to information technology.Review of Economic Dynamics 5, 443–469.
Boehm, B., Turner, R., 2004. Balancing Agility and Discipline: A Guide for the Perplexed. Addison-Wesley, Boston,MA. chapter 2.
Brynjolfsson, E., 1993. The productivity paradox of information technology: Review and assessment. Communica-tions of the ACM 35, 66–77.
21

Brynjolfsson, E., Yang, S., 1996. Information technology and productivity: A review of the literature, in: Zelkowitz,M. (Ed.), Advances in Computers. Academic Press. volume 43,pp. 179–214.
Brynjolfsson, T.F.B.E., Hitt, L.M., 2002. Information technology, workplace organization, and the demand for skilledlabor: Firm-level evidence. Quarterly Journal of Economics 117, 339–376.
Carr, N.G., 2003. IT doesn’t matter. Harvard Business Review , 41–49.
Casadesus-Masanell, R., Ghemawat, P., 2006. Dynamic mixedduopoly: A model motivated by Linux vs. Windows.Management Science 52, 1072–1084.
Christensen, C.M., Rosenbloom, R.S., 1995. Explaining theattacker’s advantage: Technological paradigms, organi-zational dynamics, and the value network. Research Policy 24, 233 – 257.
Church, J., Gandal, N., 1992. Network effects, software provision, and standardization. The Journal of IndustrialEconomics 40, 85–103.
Clarkson, M.B.E., 1995. A stakeholder framework for analyzing and evaluating corporate social performance. TheAcademy of Management Review 20, 92–117.
Coar, K., 2006. The open source definition. Available online: http://www.opensource.org/docs/osd.Current July 2009.
Cohen, W.M., Levinthal, D.A., 1989. Innovation and learning: The two faces of R&D. The Economic Journal 99,569–596.
Compeau, D.R., Higgins, C.A., 1995. Computer self-efficacy: Development of a measure and initial test. MISQuarterly 19, 189–211.
Cusumano, M.A., 2004. The Business of Software: What Every Manager, Programmer, and Entrepreneur Must Knowto Thrive and Survive in Good Times and Bad. The Free Press, New York.
Damanpour, F., 1992. Organizational size and innovation. Organization Studies 13, 375–402.
Davies, S., 1975. The Diffusion of Process Innovations. Cambridge University Press.
Davis, F.D., 1989. Perceived usefulness, perceived ease ofuse, and user acceptance of information technology. MISQuarterly 13, 319–340.
Dedrick, J., West, J., 2003. Why firms adopt open source platforms: A grounded theory of innovation and standardsadoption, in: MISQ Special Issue Workshop on Standard Making: A Critical Research Frontier for InformationSystems, pp. 236–257.
DeLone, W.H., 1981. Firm size and the characteristics of computer use. MIS Quarterly 5, 65–77.
DeLone, W.H., McLean, E.R., 2003. The DeLone and McLean model of information systems success: A ten-yearupdate. Journal of Management Information Systems 19, 9–30.
Deshpande, A., Riehle, D., 2008. The total growth of open source, in: 4th Conference on Open Source Systems (OSS2008), pp. 197–209.
Dick, A.S., Basu, K., 1994. Customer loyalty: Toward an integrated conceptual dramework. Journal of the Academyof Marketing Science 22, 99–113.
Dunne, T., 1994. Plant age and technology use in US manufacturing industries. Rand Journal of Economics 25,488–499.
E-Soft Inc, 2007. Mail (MX) server survey. Available online: http://www.securityspace.com/s_survey/data/man.200701/mxsurvey.html. Current July 2009.
E-Soft Inc., 2009. Web server survey. Available online:http://www.securityspace.com/s_survey/data/200902/index.html. Current March 2009.
22

Economides, N., Katsamakas, E., 2006. Two-sided competition of proprietary vs. open source technology platformsand the implications for the software industry. ManagementScience 52, 1057–1071.
Feller, J., Fitzgerald, B., 2001. Understanding Open Source Software Development. Pearson Education, Harlow, UK.chapter 9.
Fichman, R.G., 2000. The diffusion and assimilation of information technology innovations, in: Zmud, R. (Ed.), Fram-ing the Domains of It Management: Projecting the Future ... Through the Past. Pinnaflex Educational Resources,Cincinnati, OH, pp. 105–128.
Fichman, R.G., Kemerer, C.F., 1993. Adoption of software engineering process innovations: The case of objectorientation. Sloan Management Review 34, 7–22.
Fichman, R.G., Kemerer, C.F., 1999. The illusory diffusionof innovation: An examination of assimilation gaps.Information Systems Research 10, 255–275.
Fitzgerald, B., Kenny, T., 2004. Open source software in thetrenches: Lessons from a large-scale OSS implementation,in: 24th International Conference on Information Systems,pp. 316–326.
Forrester, 2008. Open source paves the way for the next generation of enterprise IT.
Gallaugher, J.M., Wang, Y.M., 2002. Understanding networkeffects in software markets: Evidence from web serverpricing. MIS Quarterly 26, 303–327.
Gallivan, M.J., 2001. Organizational adoption and assimilation of complex technological innovations: Developmentand application of a new framework. ACM SIGMIS Database 32, 51–85.
Gamma, E., Beck, K., 2004. Contributing to Eclipse: Principles, Patterns, and Plug-Ins. Addison-Wesley, Boston,MA.
Gay, J. (Ed.), 2002. Free Software, Free Society: Selected Essays of Richard M. Stallman. GNU Press, Free SoftwareFoundation, Boston.
Geiszler, D.A., Kent, J., Strahl, J.L.S., Cook, J., Love, G., Phegley, L., Schmidt, J., Zhao, Q., Franco, F., Frost, L.,Frost, M., Grant, D., Lowder, S., Martinez, D., McDermid, L.N., 2004. The Navy’s on-scene weather predictionsystem, COAMPS-OS, in: 20th Conference on Weather Analysisand Forecasting/16th Conference on NumericalWeather Prediction, American Meteorologival Society. p. 19.
Glynn, E., Fitzgerald, B., Exton, C., 2005. Commercial adoption of open source software: An empirical study, in:International Symposium on Empirical Software Engineering, pp. 225–234.
Goldman, R., Gabriel, R.P., 2005. Innovation Happens Elsewhere: Open Source As Business Strategy. Morgan Kauf-mann. chapter Licenses. pp. 111–136.
Gowrisankaran, G., Stavins, J., 2004. Network externalities and technology adoption: Lessons from electronic pay-ments. The RAND Journal of Economics 35, 260–276.
Gupta, A., Hatter, J., Pinnoju, S., 2008. E*trade financial services. Journal of Business Case Studies 4.
Hannan, T.H., McDowell, J.M., 1984. The determinants of technology adoption: The case of the banking firm. TheRAND Journal of Economics 15, 328–335.
von Hippel, E., 1998. Economics of product development by users: The impact of “sticky” local information. Man-agement Science 44, 629–644.
Hitt, L.M., Brynjolfsson, E., 1996. Productivity, business profitability, and consumer surplus: Three different measuresof information technology value. MIS Quarterly 20, 121–142.
IDC, 2001a. Amazon.com migration from unix to Red Hat Linux.white paper.
IDC, 2001b. Toyota motor sales USA: Red Hat Linux across the enterprise. white paper.
23

IDC, 2005. Western European software end-user survey.
Jeyaraj, A., Rottman, J.W., Lacity, M.C., 2006. A review of the predictors, linkages, and biases in IT innovationadoption research. Journal of Information Technology 21, 1–23.
Jiang, J.J., Muhanna, W.A., Klein, G., 2000. User resistance and strategies for promoting acceptance across systemtypes. Information & Management 37, 25 – 36.
Katz, M.L., Shapiro, C., 1986. Technology adoption in the presence of network externalities. The Journal of PoliticalEconomy 94, 822–841.
Katz, M.L., Shapiro, C., 1994. Systems competition and network effects. The Journal of Economic Perspectives 8,93–115.
Kelley, M.R., Helper, S., 1999. Firm size and capabilities,regional agglomeration, and the adoption of new technology.Economics of Innovation and New Technology 8, 79–103.
Kerner, S., 2007. The trouble with BIND DNS servers. Available online:http://www.internetnews.com/security/article.php/3712251/. Current July 2009.
Kimberly, J.R., Evanisko, M.J., 1981. Organizational innovation: The influence of individual, organizational, and con-textual factors on hospital adoption of technological and administrative innovations. The Academy of ManagementJournal 24, 689–713.
King, J.L., Gurbaxani, V., Kraemer, K.L., McFarlan, F.W., Raman, K.S., Yap, C.S., 1994. Institutional factors ininformation technology innovation. Information Systems Research 5, 139–169.
King, J.L., Kraemer, K.L., 1984. Evolution and organizational information systems: An assessment of Nolan’s stagemodel. Communications of the ACM 27, 466–475.
Krishnamurthy, S., 2005. An analysis of open source business models, in: Feller, J., Fitzgerald, B., Hissam, S.,Lakhani, K. (Eds.), Making sense of the bazaar: Perspectives on open source and free software. MIT Press, Cam-bridge, UK, pp. 279–298.
Kuan, J., 2003. Open source software as lead user’s make or buy decision: A study of open and closed source quality,in: Second Conference on the Economics of the Software and Internet Industries.
Larsen, M.H., Pedersen, M.K., Andersen, K.V., 2006. IT governance: Reviewing 17 IT governance tools and analysingthe case of novozymes A/S. Hawaii International Conferenceon System Sciences 8, 195c.
Majumdar, S.K., Venkataraman, S., 1998. Network effects and the adoption of new technology: Evidence from theU.S. telecommunications industry. Strategic Management Journal 19, 1045–1062.
Matthews, D., Wilson, G., Easterbrook, S., 2008. Configuration management for large-scale scientific computing atthe UK met office. Computing in Science and Engineering 10, 56–64.
Messerschmitt, D.G., Szyperski, C., 2004. Software Ecosystem: Understanding an Indispensable Technology andIndustry. MIT Press, Cambridge, MA.
Moore, G.C., Benbasat, I., 1991. Development of an instrument to measure the perceptions of adopting an informationtechnology innovation. Information Systems Research 2, 192–222.
Morgan, A., Colebournea, D., Thomas, B., 2006. The development of ICT advisors for SME businesses: An innovativeapproach. Technovation 26, 980–987.
Mundie, C., 2001. The commercial software model. Availableonline: http://www.microsoft.com/presspass/exec/craig/05-03sharedsource.mspx. Current July 2009. Speech Transcript — TheNew York University Stern School of Business.
Nagy, D., Yassin, A.M., Bhattacherjee, A., 2010. Organizational adoption of open source software: Barriers andremedies. Commun. ACM 53, 148–151.
24

Netcraft Ltd, 2001. Counting computers running the web. Available online:http://www.theregister.co.uk/2001/07/04/netcraft_posts_june_2001_web/. Current August 2009.
Netcraft Ltd, 2009. February 2009 web server survey. Available online: http://news.netcraft.com/archives/2009/02/18/february_2009_web_server_survey.html. Current March 2009.
Nichols, D.M., Twidale, M.B., 2003. The usability of open source software. First Monday 8.
Nolan, R.L., 1973. Managing the computer resource: A stage hypothesis. Communications of the ACM 16, 399–405.
Parker, G.G., Van Alstyne, M.W., 2005. Two-sided network effects: A theory of information product design. Man-agement Science 51, 1494–1504.
Prahalad, C.K., Hamel, G., 1990. Core competence of the corporation. Harvard Business Review 68.
Proctor, P., Deusen, P.C., Heath, L.S., Gove, J.H., 2003. The open-source movement: An introduction for forestryprofessionals, in: 5th Annual Forest Inventory and Analysis Symposium, pp. 203–208.
Rogers, E.M., 2003. Diffusion of Innovations. Free Press. fifth edition.
Ross, S.M., 2004. Introduction to Probability Models and Statistics for Engineers and Scientists, Third Edition.Academic Press. chapter 9. pp. 351–438.
Rossi, B., Russo, B., Zuliani, P., Succi, G., 2005. On the transition to an open source solution for desktop officeautomation, in: Böhlen, M., Gamper, J., Polasek, W., A.Wimmer, M. (Eds.), E-Government: Towards ElectronicDemocracy, Springer Berlin / Heidelberg. pp. 277–285. Lecture Notes in Artificial Intelligence 3416.
Rubin, H., Johnson, M., Iventosch, S., 2002. The US softwareindustry. IEEE Software 19, 95–97.
Saloner, G., Shepard, A., 1995. Adoption of technologies with network effects: An empirical examination of theadoption of automated teller machines. The RAND Journal of Economics 26, 479–501.
Samuelson, P., 2006. IBM’s pragmatic embrace of open source. Communications of the ACM 49, 21–25.
Searls, D., 2003. Linux makes wi-fi happen in new york city. Linux Journal 2003, 3.
Searls, D., 2004. DIY-IT: How Linux and open source are bringing do-it-yourself to information technology. LinuxJournal 2004, 4.
Shapiro, C., Varian, H.R., 1999. Information Rules: A Strategic Guide to the Network Economy. Harvard BusinessSchool Press, Boston.
Simpson, K., Bekman, S., 2007. Fingerprinting the world’s mail servers. Available online:http://www.oreillynet.com/pub/a/sysadmin/2007/01/05/fingerprinting-mail-servers.html.Current July 2009.
Sorensen, J.B., Stuart, T.E., 2000. Aging, obsolescence, and organizational innovation. Administrative ScienceQuarterly 45, 81–112.
Spanos, Y.E., Prastacos, G.P., Poulymenakou, A., 2002. Therelationship between information and communicationtechnologies adoption and management. Information and Management 39, 659 – 675.
Spinellis, D., 2003. Code Reading: The Open Source Perspective. Addison-Wesley, Boston, MA.
Spinellis, D., 2006. Code Quality: The Open Source Perspective. Addison-Wesley, Boston, MA.
Stiroh, K.J., 2001. Investing in information technology: Productivity payoffs for U.S. industries. Current Issues inEconomics and Finance 7.
Stiroh, K.J., 2002. Information technology and the U.S. productivity revival: What do the industry data say? TheAmerican Economic Review 92, 1559–1576.
25
Stoneman, P., 1981. Intra-firm diffusion, bayesian learning and profitability. The Economic Journal 91, 375–388.
Stoneman, P., Kwon, M.J., 1996. Technology adoption and firmprofitability. The Economic Journal 106, 952–962.
The Dravis Group, 2003. Open source software: Case studies examining its use.
The Economist, 2001. An open and shut case: What is behind Microsoft’s attack on open-source software? TheEconomist .
Thompson, R.L., Higgins, C.A., Howell, J.M., 1991. Personal computing: Toward a conceptual model of utilization.MIS Quarterly 15, 125–143.
Tornatzky, L., Klein, K., 1982. Innovation characteristics and innovation adoption-implementation: A meta-analysisof findings. IEEE Transactions on Engineering Management 29, 28–45.
Unisphere Research, 2006. IBM open source and LinuxLine survey.
UNU-MERIT, 2006. Study on the economic impact of open sourcesoftware on innovation and the competitivenessof the information and communication technologies (ICT) sector in the EU.
US Census Bureau, 2009. 2007 economic census, core businessstatistics. Available online: http://factfinder.census.gov/servlet/DatasetMainPageServlet?_program=ECN&_submenuId=datasets_4&_lang=en. Current June 2009.
Ven, K., Verelst, J., 2006. The organizational adoption of open source server software by belgian organizations, in:Open Source Systems. Springer, Boston. volume 203, pp. 111–122.
Venkatesh, V., Morris, M.G., Davis, G.B., Davis, F.D., 2003. User acceptance of information technology: Toward aunified view. MIS Quarterly 27, 425–478.
Viorres, N., Xenofon, P., Stavrakis, M., Vlachogiannis, E., Koutsabasis, P., Darzentas, J., 2007. Major HCI challengesfor open source software adoption and development, in: Online Communities and Social Computing. SpringerVerlag, pp. 455–464. Lecture Notes in Computer Science 4564.
von Hippel, E., 1988. The Sources of Innovation. Oxford University Press, New York.
von Hippel, E., 2001. Innovation by user communities: Learning from open source software. Sloan ManagementReview 42, 82–86.
Voth, D., 2003. Open source in the US government. IEEE Software 20, 73.
Walli, S., Gynn, D., von Rotz, B., 2005. The growth of open source software in organizations.
Wang, H., Wang, C., 2001. Open source software adoption: A status report. IEEE Software 18, 90–95.
Weber, S., 2005. The Success of Open Source. Harvard University Press.
von Weizsacker, C.C., 1984. The costs of substitution. Econometrica 52, 1085–1116.
West, J., 2003. How open is open enough?: Melding proprietary and open source platform strategies. Research Policy32, 1259–1285.
West, J., Dedrick, J., 2001. Open source standardization: The rise of linux in the network era. Knowledge, Technologyand Policy 14, 88–112.
Wheeler, D.A., 2007. Why open source software / free software (OSS/FS, FLOSS, or FOSS)? look at the numbers!Available online:http://www.dwheeler.com/oss_fs_why.html. Current March 2009.
Wolff, E., 2006. The growth of information workers in the US economy, 1950–2000: The role of technological change,computerization, and structural change. Economic SystemsResearch 18, 221–255.
26
Wolfgang, M., 2002. Host Discovery with nmap. Available online http://moonpie.org/writings/discovery.pdf. Current February 2009.
Wolfram|Alpha, 2009. “total US company profits 2007” query.Available online: http://www08.wolframalpha.com/input/?i=total+us+company+profits+2007. Current July 2009.
Woods, D., Guliani, G., 2005. Open Source for the Enterprise: Managing Risks, Reaping Rewards. O’Reilly Media,Incorporated.
Yang, Z., Jiang, M., 2007. Using Eclipse as a tool-integration platform for software development. IEEE Software 24,87–89.
Zahra, S.A., Covin, J.G., 1993. Business strategy, technology policy and firm performance. Strategic ManagementJournal 14, 451–478.
Revision: 1.246
27