organisms can essentially be classified according to two ... · (human), plasmodium falciparum...
TRANSCRIPT
ORIGINAL ARTICLE
Organisms can essentially be classified accordingto two codon patterns
T. Okayasu Æ K. Sorimachi
Received: 28 December 2007 / Accepted: 12 March 2008 / Published online: 1 April 2008
� The Author(s) 2008
Abstract We recently classified 23 bacteria into two
types based on their complete genomes; ‘‘S-type’’ as rep-
resented by Staphylococcus aureus and ‘‘E-type’’ as
represented by Escherichia coli. Classification was char-
acterized by concentrations of Arg, Ala or Lys in the amino
acid composition calculated from the complete genome.
Based on these previous classifications, not only prokary-
otic but also eukaryotic genome structures were
investigated by amino acid compositions and nucleotide
contents. Organisms consisting of 112 bacteria, 15 archaea
and 18 eukaryotes were classified into two major groups by
cluster analysis using GC contents at the three codon
positions calculated from complete genomes. The 145
organisms were classified into ‘‘AT-type’’ and ‘‘GC-type’’
represented by high A or T (low G or C) and high G or C
(low A or T) contents, respectively, at every third codon
position. Reciprocal changes between G or C and A or T
contents at the third codon position occurred almost syn-
chronously in every codon among the organisms.
Correlations between amino acid concentrations (Ala, Ile
and Lys) and the nucleotide contents at the codon position
were obtained in both ‘‘AT-type’’ and ‘‘GC-type’’ organ-
isms, but with different regression coefficients. In certain
correlations of amino acid concentrations with GC con-
tents, eukaryotes, archaea and bacteria showed different
behaviors; thus these kingdoms evolved differently. All
organisms are basically classifiable into two groups having
characteristic codon patterns; organisms with low GC and
high AT contents at the third codon position and their
derivatives, and organisms with an inverse relationship.
Keywords Classification � Prokaryotes � Eukaryotes �Amino acid compositions � Codon usage � GC content �Cluster analysis
Introduction
During the past decade, more than 200 species genomes
have been completed through interagency and international
collaborations. Particularly, eukaryotic genomes that con-
sist of huge numbers of genes have been analyzed; these
included human (International Human Genome Sequencing
Consortium 2001; Venter et al. 2001). The results have
greatly contributed to progress in the understanding of
various organisms; characteristically this understanding is
based on nucleotide or amino acid sequences of genes.
Indeed, the recently developed science of proteomics is
based on this concept, and protein–protein or protein–small
molecule interactions have been investigated, resulting in
new drug developments and a better understanding of
diseases. Further, changes in nucleotides or amino acid
sequences have been applied to evolutionary research
(Dayhoff et al. 1977; Sogin et al. 1986; Woese et al. 1990;
Doolittle and Brown 1994; Maizels and Weiner 1994;
DePouplana et al. 1998; Sakagami et al. 2006), on the
assumption that amino acid sequence changes are linked to
biological evolution.
Electronic supplementary material The online version of thisarticle (doi:10.1007/s00726-008-0059-0) contains supplementarymaterial, which is available to authorized users.
T. Okayasu
Center of Medical Informatics, Dokkyo Medical University,
Mibu, Tochigi 321-0293, Japan
K. Sorimachi (&)
Educational Support Center, Dokkyo Medical University,
Mibu, Tochigi 321-0293, Japan
e-mail: [email protected]
123
Amino Acids (2009) 36:261–271
DOI 10.1007/s00726-008-0059-0

The basic pattern of cellular amino acid composition is
conserved in various organisms from bacteria to mamma-
lian cells (Sorimachi 1999; Sorimachi et al. 2000; 2001);
and differences in cellular amino acid composition among
organisms seem to reflect biological evolution. In addition,
cellular amino acid compositions obtained experimentally
resemble those conveniently calculated from a complete
genome (Sorimachi et al. 2001). Using amino acid com-
positions, it is possible to compare among organisms not
only the same genes but also gene assemblies consisting of
various different genes that represent the complete genome
(Sorimachi and Okayasu 2003; 2004a; 2005a, b; 2008a–c).
Based on their complete genomes, bacteria are classifiable
into two groups, ‘‘S-type’’ represented by Staphylococcus
aureus and ‘‘E-type’’ represented by Escherichia coli
(Sorimachi and Okayasu 2004b).
We recently showed that correlations between the con-
tents of each nucleotide in a genome can be expressed by
linear formulas (Sorimachi and Okayasu 2008a). The
genomic GC content is strongly correlated with the average
amino acid composition of proteins (Sueoka 1961), which
is theoretically supported by Lobry (1997). Further, the
genomic GC contents at the three codon positions have
been applied to organism classification (Rowe et al. 1984;
Takeuchi et al. 2003). Thus, how organisms would be
classified compared with the different kingdoms based on
genomic structures appeared worthy of investigation to
understand biological evolution. Therefore, in the present
study cluster analyses using GC contents calculated from
the complete genome at the three codon positions were
applied to classify not only prokaryotes but also eukary-
otes, although there are many cluster analyses based on
amino acid and nucleotide sequence data (Rowe et al.
1984; Barloy-Hubler et al. 2001; Farlow et al. 2002; Martin
et al. 2003; Dyhrman et al. 2006; Sakagami et al. 2006).
Graphic representation or a diagram approach to the
study of complicated biological systems can provide an
intuitive picture and provide useful insights. Various
graphical approaches have been successfully used; for
example, to study enzyme-catalyzed systems (Chou 1983,
1989, 1990; Chou et al. 1979; Kuzmic et al. 1992; Lin and
Neet 1990; Zhou and Deng 1984), protein folding kinetics
(Chou 1990), codon usage (Chou and Zhang 1992; Sori-
machi and Okayasu 2003; 2004a; 2005a, b; 2008a, b, c;
Zhang and Chou 1993), and HIV reverse transcriptase
inhibition mechanisms (Althaus et al. 1993a–c; Chou et al.
1994). Cellular automaton images (Wolfram 1984, 2002)
have also been used to represent biological sequences
(Xiao et al. 2005b), to predict protein subcellular locali-
zation (Xiao et al. 2006b), predict transmembrane regions
in proteins (Diao et al. 2008), predict the effect on repli-
cation ratio by HBV virus gene missense mutation (Xiao
et al. 2005a), and to study hepatitis B viral infections (Xiao
et al. 2006a). Graphic approaches have been used recently
to represent DNA sequences (for example, Qi et al. 2007b),
investigate p53 stress response networks (Qi et al. 2007a),
analyze the network structure of the amino acid metabo-
lism (Shikata et al. 2007), study cellular signaling networks
(Diao et al. 2007) and proteomics (Gonzalez-Dıaz et al.
2008), and for a systematic biology analysis of the
Drosophila phagosome (Stuart et al. 2007).
Methods
Genomic data
In our earlier study (Sorimachi and Okayasu 2004b), amino
acid composition was calculated from all genes construct-
ing a complete genome and from data obtained from
GenomeNet (http://www.genome.ad.jp). In the present
study, codon usage databases were obtained from the
Kazusa DNA Research Institute (http://www.kazusa.or.jp/
codon). However, we computationally calculated amino
acid compositions, codon usages and the nucleotide con-
tents of organisms to replace genomic data that was
incomplete in Kazusa’s table.
Calculations
Amino acid compositions and nucleotide contents at vari-
ous codon positions were computationally calculated from
codon usage databases. Cluster analysis was carried out
using the software (multivariate analysis, version four),
developed as an add-in program of EXCEL, which was
purchased from ESUMI (Tokyo, Japan). In this program, as
the cluster element was limited to 50, representative spe-
cies from the same family were examined to reduce the
sample numbers by as much as possible, although the
complete genomes of more than 200 species had already
been analyzed. Cluster analysis has five methods based on
differences in calculation procedures to estimate the dis-
tance between two samples; Ward’s, nearest neighbor,
furthest neighbor, group average and centroid methods.
However, in the present analysis only the widely used
Ward’s method was applied.
Results
Amino acid compositions
Bacteria consisting of 11 Gram positive and 12 Gram neg-
ative bacteria were classified into ‘‘S-type’’ and ‘‘E-type’’
groups based on differences in concentrations of Arg, Ala or
Lys in their 17 amino acid compositions as calculated from
262 Amino Acids (2009) 36:261–271
123
the all genes in the genome (Sorimachi and Okayasu 2004a).
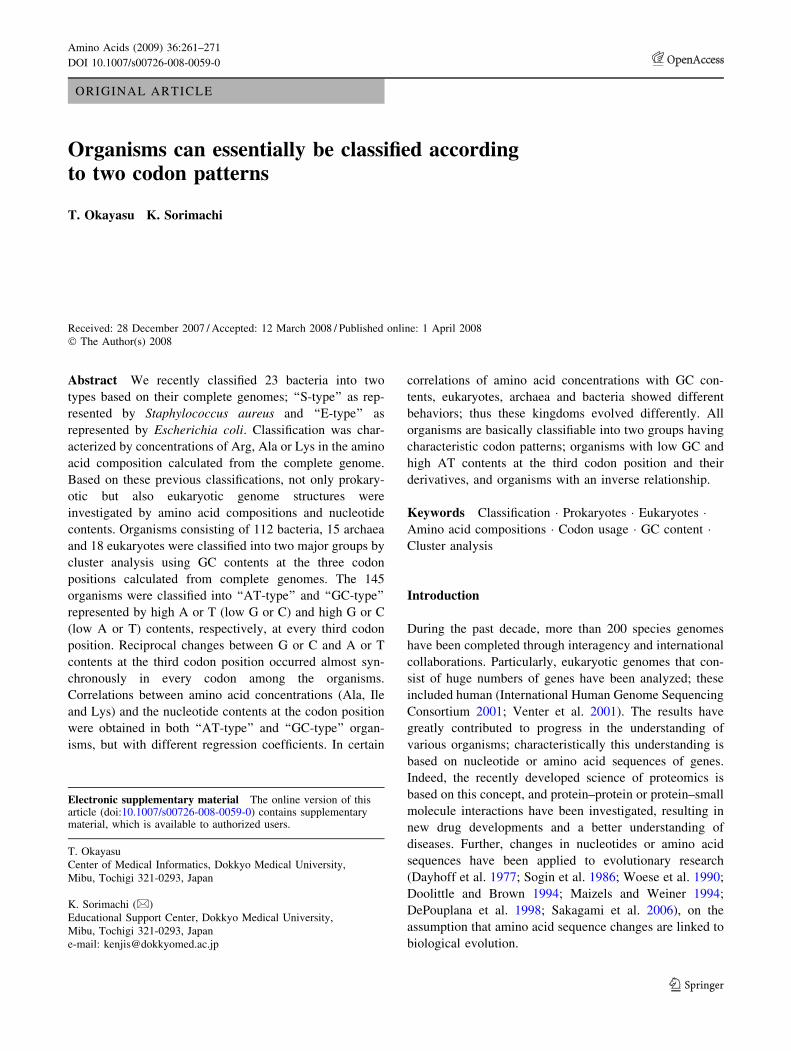
In ‘‘S-type’’, Ala and Arg concentrations were lower than
those in ‘‘E-type’’, while Lys concentrations were higher
than those in ‘‘E-type’’. The pattern of Mycobacterium
tuberculosis amino acid composition resembled that of E.
coli which represents ‘‘E-type’’, and the pattern of Urea-
plasma urelyticum resembled that of S. aureus which
represents ‘‘S-type’’, as shown in Fig. 1a. Shapes based on
the relationship between Leu and Ile concentrations differed
between ‘‘S-type’’ and ‘‘E-type’’. Two characteristic shapes
were identified in the cellular amino acid compositions of
S. aureus and E. coli (Sorimachi 1999). Thus, phenotype
expression is consistent with genotype expression in these
two amino acids, indicating that data based on a complete
genome are linked to biological meaning. Further, the two
patterns were clearly characterized by concentrations of Ala,
Arg or Lys. Similarly, radar charts have been used to illus-
trate differences in amino acid compositions to predict
protein subcellular localization (Chou and Elrod 1999).
Also, radar charts have been applied in a different manner to
show the subsite coupling for the cleavable peptides by HIV
protease. Radar charts have also been applied in a different
manner to show the interaction of HIV protease and proteins.
Amino acid compositions of four archaea, Halobacte-
rium, Aeropyrum pernix, Sulfolobus solfataricus and
Methanococcus jannaschii, were calculated from their
complete genomes. Their amino acid compositions dif-
fered, although the basic pattern of a ‘‘star-shape’’, based
on high concentrations of Asp, Glu, Gly, Arg, Ala, Val, Ile
and Leu, was preserved among them (Fig. 1b). It was
clearly shown that there are great changes in Ala, Ile and
Lys concentrations among four archaea.
The patterns of amino acid compositions of four
eukaryotes; Neurospora crassa (fungi), Homo sapiens
(human), Plasmodium falciparum (protista) and Dictyose-
lium discoideum (cellular slime mold), were calculated
from their complete genomes (Fig. 1c). Among them, the
concentrations of Ala and Ile varied significantly. The
characteristic shapes of the Leu and Ile relationship based
on the H. sapiens and D. discoideum genomes were also
a
b
c
Fig. 1 Amino acid compositions of various organisms. Amino acid compositions are expressed on radar charts. Asn and Gln were calculated as
Asp and Glu, respectively, and Trp, having concentrations less than 1%, was omitted from this presentation (Sorimachi 1999)
Amino Acids (2009) 36:261–271 263
123

observed in their cellular amino acid compositions
(Sorimachi 1999), which were consistent with those of
bacteria, as noted above.
Codon usage patterns
The four nucleotide frequencies in human (Zhang and Chou
1993; 1996) and E. coli (Zhang and Chou 1994a, b) genes
were graphically presented by a point in a three-dimensional
space. Meanwhile, a similar codon usage approach was used
to analyze HIV (Chou and Zhang 1992) and anti-sense
(Chou et al. 1996) proteins. Codon usage patterns were
compared among the four bacteria presented in Fig. 2a. In
Mycobacterium tuberculosis, which was ‘‘E-type’’, C or G
contents were very high at the third codon position, while A
or T contents at the third codon position were very low
compared among codons consisting of the same character-
istics at the first and second codon positions. These
relationships were independent of the degenerated codon. In
the present study, ‘‘E-type’’ is called ‘‘GC-type’’. C or G
contents at the third codon position reduced, whereas the A
or T contents increased in E. coli representing the ‘‘E-type’’.
On the other hand, C or G contents at the third codon
position were much lower than the A or T contents in
S. aureus representing the ‘‘S-type’’ (Fig. 2a), and C or G
contents were extremely lower than the A or T contents in
U. urelyticum. GC contents at the third codon position varied
synchronously in 64 codon usages among different organ-
isms. In the present study, ‘‘S-type’’ is called ‘‘AT-type’’.
Codon usages of the four archaea presented in Fig. 2b
were investigated. In Halobacterium, C or G contents at the
third codon position were much higher than A or T in every
codon, whereas the former was close to the latter in
Aeropyrum pernix. On the other hand, A or T contents at
the third codon position were higher than those of G or C in
Sulfolobus solfataricus, and the former contents were much
higher than the latter in Methanococcus jannaschii
(Fig. 2b). These reciprocal changes occurred synchro-
nously among different species.
In Neurospora crassa and Homo sapiens, C or G con-
tents at the third codon position were higher than those of
A or T (Fig. 2c). On the other hand, A or T contents at the
third codon position were higher than those of C or G in
Plasmodium falciparum and Dictyostelium discoideum.
These reciprocal changes occurred synchronously among
the four archaea, as now observed in both bacteria and
archaea.
Classification of organisms by cluster analysis
GC contents at the third codon position differ among
various organisms (Sorimachi and Okayasu 2004b[e1],
2008a); therefore, GC contents at three different codon
positions were calculated from complete genomes. To
classify 112 bacteria, cluster analyses were carried out.
Using GC contents at the three codon positions as traits, the
classification of just two groups was obtained (Fig. 3a).
When cluster analyses using Ala, Arg and Lys as traits
were applied to the bacteria, slightly different classifica-
tions were obtained (Supplementary Fig. 1a). Some
organisms were distributed into another group.
We previously demonstrated that the amino acid com-
positions of four archaea, Methanococcus jannaschii,
Archaeoglobus fulgidus, Pyrococcus horikoshii. and Meth-
nobacterium autotrophicum, calculated from their complete
genomes resembled those of cellular amino acid composi-
tions obtained experimentally from amino acid analyses of
cell lyzates (Sorimachi et al. 2001). Another 11 archaea with
completely analyzed genomes were also examined in the
present study. Using GC contents at the three different
codon positions (Fig. 3b), the 15 archaea were classified
into 2 major clusters. Similar two clusters were obtained
using Ala, Arg and Lys as traits, although only A. fulgidus
belonged to another group (Supplementary Fig. 1b).
Cluster analysis of 18 eukaryotes was carried out, using
GC contents at the three codon positions as traits (Fig. 3c).
Two major clusters were formed, with one containing a
cluster of vertebrates, Homo sapiens (human), Mus mus-
musculus (mouse), Gallas galas (bird), Rattus norvegicus
(rat) and Danio rerio (fish), and Drosophila melanogaster
(insect) being closed to the vertebrate cluster (Fig. 3c).
Caenorhabditis elegans (nematode) was completely sepa-
rated from other animals. Arabidopsis thaliana (plant) was
closed to Caenorhabditis elegans (nematode) while the
major cluster containing this plant was separated from
another major cluster containing Oryza sativa (plant). The
former and latter are plants belonging to dicotyledons and
monocotyledons, respectively. In our previous study
(Sorimachi et al. 2000), the cellular amino acid composi-
tions of carrot and Torenia fournieri (both dicotyledons)
differed that of Cynbidium (a monocotyledon). Thus,
phenotype expression is consistent with that of genotype in
plants. Fungi and protists were distributed into both major
clusters. Different classifications were obtained using Ala,
Arg and Lys as traits (Supplementary Fig. 1c). Encepha-
litozoon cuniculi belongs to fungi, while a cluster that
consists of A. thaliana, C. elegans and S. pombe belonged a
different cluster consisting of another type of organisms.
Using different components as traits, the sub-branches of
the phylogenic trees changed naturally because of the dif-
ferent standards.
All organisms
All organisms, 112 bacteria, 15 archaea and 18 eukary-
otes, were simultaneously applied to cluster analysis
264 Amino Acids (2009) 36:261–271
123

using CG contents at the three codon positions as traits,
two major clusters were observed in the 145 analyzed
(Fig. 4).
Archaea and eukaryotes were classified into two types.
Vertebrates (D. rerio, H. sapiens, M. musculus, R. nor-
vegicus) and insects (D. melanogaster) were incorporated
a
b
c
Fig. 2 Codon usage patterns.
a bacteria, b archaea,
c eukaryotes. Codons that have
C or G at the third codon
position are red online version
and those that have A or T at the
third codon position are blue.
The horizontal axis represents
the codon and amino acid
Amino Acids (2009) 36:261–271 265
123

into the same element, while another animal (C. elegans)
was classified into a different major cluster. These results
clearly demonstrated that vertebrate biological evolution
occurred quite recently over a very short period. When Ala,
Arg and Lys concentrations were used as traits to classify
the 145 organisms, some ‘‘GC-type’’ and ‘‘AT-type’’
organisms belonged to the same cluster(s), as shown in
Supplementary Fig. 1a–c. However, all organisms were
apparently classified into two major groups except for
some organisms (Supplementary Fig. 2a). Additionally,
using 20 amino acid concentrations or 64 codons as traits,
similar classifications were obtained (Supplementary
Fig. 2b, c). These results indicate that codon usages are
closely linked to the amino acid expression.
a
I
II
b
I
II
c
I
II
Fig. 3 Dendrogram of
organism classifications
obtained utilizing the Ward
method. As traits, GC contents
at the three codon positions
were used. a 112 bacteria, b 15
archaea, c 18 eukaryotes. Bluecharacters online version
(Group II) represent ‘‘AT-type’’
and red (Group I) represent
‘‘GC-type’’
266 Amino Acids (2009) 36:261–271
123

Correlations of amino acid concentrations
with nucleotide contents
When Ala concentrations were plotted against GC contents
at the third codon position, good correlations were obtained
in both ‘‘AT-type’’ organisms (r = 0.73) and ‘‘GC-type’’
organisms (r = 0.83) (Fig. 5a). The regression lines
between Ala concentration and GC content were expressed
by slightly different slopes in both the types of organisms.
Eukaryotes and archaea located under the regression line in
‘‘AT-type’’ organisms, and a similar result was obtained in
‘‘GC-type’’ organisms with two exceptions in eukaryotes
and with one exception in archaea. However, when Ile
concentrations were used, good correlations were obtained
in both ‘‘AT-type’’ (r = 0.77) and ‘‘GC-type’’ (r = 0.65)
(Fig. 5b). Archaea and eukaryotes located above and under
the regression line, respectively, in ‘‘AT-type’’ organisms.
In ‘‘GC-type’’ organisms, eukaryotes located under the
regression line with one exception. In addition, correlations
were also obtained between Lys concentrations against GC
contents at the third codon position in both ‘‘AT-type’’
organisms (r = 0.73) and ‘‘GC-type’’ organisms (r = 0.70)
(Fig. 5c). Characteristically, in eukaryotes, Lys concentra-
tions were nearly constant among the 18 eukaryotes
examined in the present study.
When other nucleotide contents such as total C and total
A contents at the three codon positions were used instead
of the third GC content, good correlations of Ala concen-
trations with these nucleotide contents were obtained in
both ‘‘GC-type’’ and ‘‘AT-type’’ organisms (Supplementary
Fig. 3).
Ala correlation with Lys
When Ala concentration increased in various organisms,
Lys concentration correspondingly decreased (Fig. 1).
I
II
Fig. 4 Dendrogram of the
classifications of 145 organisms
obtained utilizing the Ward
method. As traits, GC contents
at the three codon positions
were used. Blue charactersonline version (Group II)
represent ‘‘AT-type’’ and red(Group I) represent ‘‘GC-type’’.
Dark yellow online version and
gray boxes represent eukaryotes
and archaea, respectively
Amino Acids (2009) 36:261–271 267
123

Therefore, when the former was plotted against the latter,
good correlations were obtained in both ‘‘AT-type’’
organisms (r = 0.78) and ‘‘GC-type’’ organisms (r = 0.85)
(Fig. 6), with the regression line slope differing between the
two groups. Ala, Arg and Lys concentrations, which seemed
strongly linked to biological evolution, were used unless
otherwise stated.
Discussion
Our expressions by amino acid composition or nucleotide
content might appear rough compared to counting
replacement numbers of nucleotides or amino acids in a
gene or genome, but the values in the percentage calcula-
tions, based on the primary sequences of amino acid
residues and nucleotides, are absolute values that exclude
deviations. Using data based on complete genomes
expressed by a nucleotide sequence, the standard deviation
is null. Our studies using amino acid compositions, codon
usages and nucleotide contents are applicable to analyses
not only of single genes but also of gene assemblies that
consist of different genes. Indeed, using nucleotide con-
tents at the three codon positions as traits in multivariate
analysis, 145 organisms were classified into 50 elements in
the present study (Fig. 4); therefore, based on the same
standard, it would be possible to investigate all organisms
from bacteria to mammalian cells. The present study
demonstrated that amino acid compositions, codon usages
and nucleotide contents as well as amino acid or nucleotide
sequences are useful values to investigate genomic struc-
tures and biological evolution.
Ala or Lys concentration showed good correlation with
GC content at the third codon position (Fig. 5a, b), and
organisms classified into ‘‘GC-type’’ and ‘‘AT-type’’ were
separated into two distributions by arranging in order of
decreasing Ala or Lys concentration. Thus, when organ-
isms classified into ‘‘GC-type’’ and ‘‘AT-type’’ based on
GC contents can be separated into two distributions by
arranging in order of decreasing levels of certain amino
acid concentrations, the amino acid concentration corre-
lates with GC content. Therefore, Ala, Gly, Pro, Arg and
Val increase with GC content at the third codon position,
while Lys, Phe, Ile, Asn and Tyr decrease with GC content
(unpublished data). These results are consistent with other
results obtained from total genomic GC content (Sueoka
1961; Lobry 1997).
The high GC contents at the third codon position were
linked to low Ala and Arg concentrations or high Lys
a
12
8
4
0
Ile
conc
entr
atio
n (%
)
b
12
8
4
0
Lys
con
cent
ratio
n (%
)
c
16
Ala
con
cent
ratio
n (%
)
3rd GC content (%)
0
4
12
8
20 40 60 80 100
3rd GC content (%) 20 40 60 80 100
3rd GC content (%) 20 40 60 80 100
Fig. 5 Correlation of Ala, Ile or Lys concentration with GC content
at the third codon position. a Ala correlation with GC content, b Ile
correlation with GC content, c Lys correlation with GC content. ‘‘GC-
type’’ and ‘‘AT-type’’ are presented in red online version (right side
half) and blue (left side half), respectively. Diamond shape, closedcircle and closed triangle represent bacteria, eukaryotes and archaea,
respectively
12
8
4
0
Ala
con
cent
ratio
n (%
)
16
Lys concentration (%) 4 8 12
Fig. 6 Correlation of Ala with Lys concentration. ‘‘GC-type’’ and
‘‘AT-type’’ are presented in red online version (left side half) and blue(right side half), respectively. Diamond shape, closed circle and
closed triangle represent bacteria, eukaryotes and archaea,
respectively
268 Amino Acids (2009) 36:261–271
123

concentrations. Additionally, in the cluster analyses GC
contents at the first and second codon positions (Fig. 3)
strongly contributed to differentiating the two groups.
Thus, in biological evolution intra-codon alterations appear
to be strongly controlled by amino acid composition. As
these relationships were observed in archaea and eukary-
otes (Fig. 2), biological evolution progresses under this
form of control in all organisms. Correlations between the
contents of each nucleotide in a genome can be expressed
by linear formulas (Sorimachi and Okayasu 2008a).
Eukaryotes, archaea and bacteria behaved differently from
each other in respect of correlations of certain amino acid
concentrations with nucleotide contents (Fig. 5a–c). The
consistent results were obtained from nucleotide alterna-
tions in various organisms (Sorimachi and Okayasu
2008a). Thus, biological evolution can be said to progress
differently among different kingdoms.
Although codon usage patterns differ among bacterial
species (Fig. 2a), their amino acid composition patterns
based on complete genomes resemble each other
(Sorimachi and Okayasu 2004a). The latter point indicates
that the basic pattern of amino acid compositions based on
complete genomes is conserved among bacterial species
(Sorimachi and Okayasu 2004b), and this was experimen-
tally proved in our previous studies of phenotype
(Sorimachi 1999; Sorimachi et al. 2000; 2001). GC or AT
contents at the first and second codon positions apparently
influence the third codon formation, as shown in Fig. 2.
Thus, eventually the conservation of the basic pattern of
amino acid compositions induces a reciprocal relationship
between C or G and T or A at the third codon position in
codons that have the same two nucleotides at the first and
second codon positions; something observed as GC biases
among various genes (Sueoka 1988). The relationship
between GC and AT contents at the third codon position is
comparatively conserved in every codon (Fig. 2), and
eventually their changes appeared synchronously among
different species. As these changes occurred even in the
degenerated codon, they are apparently based on neutral
mutations, although these mutations are obviously con-
trolled by particular forces in the degenerated codon. Based
on a random choice of nucleotides or amino acids that
consisted of a certain composition, simulation analyses
suggested that codon formation followed chronologically
protein formation in the origin of life (Sorimachi and
Okayasu 2008b). This conclusion is strictly controlled by
the compositions of nucleotides or amino acids. Similarly,
as the nucleotide composition in a genome is determined,
random mutations are strongly controlled by nucleotide
composition even in degenerated codons. Thus, the effect
of composition is equal to a particular force. Random
mutation is also supported by the relationship between
amino acid frequencies and codon usages among various
genes (King and Jukes 1989). Based on mathematical
calculations, other groups have proposed neutral mutation
in biological evolution (Kimura 1977).
In the present study, organisms with low GC and high
AT contents at the third codon position were classified into
‘‘AT-type’’, while organisms with high GC and low AT
contents at the third codon position were classified into
‘‘GC-type’’. Even organisms with similar AT and GC
contents at the third codon position were classified into two
types. In addition, correlations of certain amino acid con-
centrations with nucleotide contents differed between the
two types, ‘‘AT-type’’ and ‘‘GC-type’’; not only in pro-
karyotes, but also in eukaryotes (Fig. 5a, b). Thus, all
organisms are classified into two major groups; organisms
with low GC and high AT contents at the third codon
position and their derivatives, and organisms with high GC
and low AT contents at the third codon position and their
derivatives. The average amino acid compositions of ‘‘AT-
type’’ and ‘‘GC-type’’ and their combination are shown in
Fig. 7. The amino acid compositions of ‘‘AT-type’’ and
‘‘GC-type’’, based on 72 and 73 complete genomes,
respectively, are very similar to those based on S. aureus
representing ‘‘S-type’’ and E. coli representing ‘‘E-type’’.
The pattern of amino acid composition obtained from all
145 organisms analyzed here resembles that obtained in
Fig. 7 Amino acid compositions. ‘‘GC-type’’ and ‘‘AT-type’’ based
on 72 and 73 completed genomes, respectively, classified as shown in
Fig. 4. ‘‘Genotype’’ was based on all 145 completed genomes, and
‘‘Phenotype’’ was calculated from cellular amino acid compositions
obtained from 30 living cells from bacteria to mammalian cells
(Sorimachi 1999; Sorimachi et al. 2000, 2001)
Amino Acids (2009) 36:261–271 269
123
various cells from bacteria to mammalian cells (Sorimachi
1999). This confirms that genomes are constructed from
putative small units with similar amino acid compositions;
suggesting that synchronous mutations might occur over
the genome (Sorimachi and Okayasu 2003; 2004a; 2005a,
b; 2008a–c). This ‘‘star-shape’’ represents organisms
existing on the earth. On the basis of Darwin’s theory, the
origin of life has been assumed to be a single event (Mayer
1965[e3], 2000); however, an opposite theory supposing a
plural origin is also acknowledged (Woese 1998; Doolittle
1999). The present results, based on the two different
codon usage patterns, indicate that all organisms have
diverged in two main directions.
Open Access This article is distributed under the terms of the
Creative Commons Attribution Noncommercial License which per-
mits any noncommercial use, distribution, and reproduction in any
medium, provided the original author(s) and source are credited.
References
Althaus IW, Chou JJ, Gonzales AJ et al (1993a) Kinetic studies with
the nonnucleoside HIV-1 reverse transcriptase inhibitor
U-88204E. Biochemistry 32:6548–6554
Althaus IW, Chou JJ, Gonzales AJ et al (1993b) Steady-state kinetic
studies with the non-nucleoside HIV-1 reverse transcriptase
inhibitor U-87201E. J Biol Chem 268:6119–6124
Althaus IW, Gonzales AJ, Chou JJ et al (1993c) The quinoline
U-78036 is a potent inhibitor of HIV-1 reverse transcriptase.
J Biol Chem 268:14875–14880
Barloy-Hubler F, Lelaure V, Galiber F (2001) Ribosomal protein gene
cluster analysis in eubacterium genomics: homology between
Sinorhizobium melioloti strain 1021 and Bacillus subtilis.
Nucleic Acids Res 29:2747–2756
Chou KC (1983) Advances in graphical methods of enzyme kinetics.
Biophys Chem 17:51–55
Chou KC (1989) Graphical rules in steady and non-steady enzyme
kinetics. J Biol Chem 264:12074–12079
Chou KC (1990) Review: applications of graph theory to enzyme
kinetics and protein folding kinetics. Steady and non-steady state
systems. Biophys Chem 35:1–24
Chou KC, Elrod DW (1999) Protein subcellular location prediction.
Protein Eng 12:107–118
Chou KC, Zhang CT (1992) Diagrammatization of codon usage in
339 HIV proteins and its biological implication. AIDS Res Hum
Retrovir 8:1967–1976
Chou KC, Jiang SP, Liu WM et al (1979) Graph theory of enzyme
kinetics: 1. Steady-state reaction system. Sci Sin 22:341–358
Chou KC, Kezdy FJ, Reusser F (1994) Review: steady-state inhibition
kinetics of processive nucleic acid polymerases and nucleases.
Anal Biochem 221:217–230
Chou KC, Zhang CT, Elrod DW (1996) Do antisense proteins exist?
J Protein Chem 15:59–61
Dayhoff MO, Park CM, McLaughlin PJ (1977) Building a phyloge-
netic trees: cytochrome C. In: Atlas of protein sequence and
structure, vol 5. National Biomedical Foundation, Washington,
DC, pp 7–16
DePouplana L, Turner RJ, Steer BA et al (1998) Genetic code origins:
tRNAs older than their synthetases? Proc Natl Acad Sci USA
95:11295–11300
Diao Y, Li M, Feng Z et al (2007) The community structure of human
cellular signaling network. J Theor Biol 247:608–615
Diao Y, Ma D, Wen Z et al (2008) Using pseudo amino acid
composition to predict transmembrane regions in protein:
cellular automata and Lempel–Ziv complexity. Amino Acids
34:111–117
Doolittle WF (1999) Phylogenetic classification and the universal
tree. Science 284:2124–2128
Doolittle WF, Brown JR (1994) Tempo, mode, the progenote, and the
universal root. Proc Natl Acad Sci USA 91:6721–6728
Dyhrman ST et al (2006) Phosphonate utilization by the globally
important marine diazotroph Trichodesmium. Nature 439:68–71
Farlow J, Postic D, Smith KL et al (2002) Strain typing of Borreliaburgdorferi, Borrelia afzelii, and Borrelia garinii by using
multiple-locus variable-number tandem repeat analysis. J Clin
Microbiol 40:4612–4618
Gonzalez-Dıaz H, Gonzalez-Dıaz Y, Santana L et al (2008) Proteo-
mics, networks, and connectivity indices. Proteomics. doi:
10.1002/pmic.200700638
International Human Genome Sequencing Consortium (2001) Initial
sequencing and analysis of the human genome. Nature 409:860–
921
Kimura M (1977) Preponderance of synonymous changes as evidence
for the neutral theory of molecular evolution. Nature 267:275–
276
King JL, Jukes TH (1989) Non-Darwinian evolution. Most evolu-
tionary change in proteins may be due to neutral mutations and
genetic drifts. Science 164:788–798
Kuzmic P, Ng KY, Heath TD (1992) Mixtures of tight-binding
enzyme inhibitors. Kinetic analysis by a recursive rate equation.
Anal Biochem 200:68–73
Lin SX, Neet KE (1990) Demonstration of a slow conformational
change in liver glucokinase by fluorescence spectroscopy. J Biol
Chem 265:9670–9675
Lobry JR (1997) Influence of genomic G + C content on average
amino-acid composition of proteins from 59 bacterial species.
Gene 205:309–316
Maizels N, Weiner AM (1994) Phylogeny from function: evidence
from the molecular fossil record that tRNA originated in
replication, not translation. Proc Natl Acad Sci USA 91:6729–
6734
Martin MJ, Herrero J, Mateos A et al (2003) Comparing bacterial
genomes through conservation profiles. Genome Res 13:991–
998
Mayer E (1965) Animal species and evolution. Harvard University
Press, Cambridge
Mayer E (2000) Darwin’s influence on modern thought. Sci Am
283:79–83
Qi JP, Shao SH, Li DD, Zhou GP (2007a) A dynamic model for the
p53 stress response networks under ion radiation. Amino Acids
33:75–83
Qi XQ, Wen J, Qi ZH (2007b) New 3D graphical representation of
DNA sequence based on dual nucleotides. J Theor Biol 249:681–
690
Rowe G.W, Szabo VL, Trainor LHE (1984) Cluster analysis of genes
in codon space. J Mol Evol 20:167–174
Sakagami M, Nakayama T, Hashimoto T et al (2006) Phylogeny of
the centrohelida inferred from SSU rRNA, tubulin, and actin
genes. J Mol Evol 61:765–775
Shikata N, Maki Y, Noguchi Y et al (2007) Multi-layered network
structure of amino acid (AA) metabolism characterized by each
essential AA-deficient condition. Amino Acids 33:113–121
Sogin ML, Elwood HJ, Gunderson JH (1986) Evolutionary diversity
of eukaryotic small subunit rRNA genes. Proc Natl Acad Sci
USA 83:1383–1387
270 Amino Acids (2009) 36:261–271
123
Sorimachi K (1999) Evolutionary changes reflected by the cellular
amino acid composition. Amino Acids 17:207–226
Sorimachi K, Okayasu T (2003) Gene assembly consisting of small
units with similar amino acid composition in the Saccharomycescerevisiae genome. Mycosicence 44:415–417
Sorimachi K, Okayasu T (2004a) An evaluation of evolutionary
theories based on genomic structures in Saccharomyces cerevi-siae and Encephalitozoon cuniculi. Mycoscience 45:345–350
Sorimachi K, Okayasu T (2004b) Classification of eubacteria based
on their complete genome: where does Mycoplasmataceae
belong?. Proc R B Suppl Biol Lett 271: S127–S130
Sorimachi K, Okayasu T (2005a) Simulation analysis of genomic
amino acid composition homogeneity based on putative small
units. In Proceedings of the 9th world multi-conference on
systemics, cybernetics and informatics, Orlando, Florida, USA,
vol VI, pp 190–196
Sorimachi K, Okayasu T (2005b) Genomic structure consisting of
putative units coding similar amino acid composition: synchro-
nous mutations in biological evolution. Dokkyo J Med Sci
32:101–106
Sorimachi K, Okayasu T (2008a) Codon evolution is governed by
linear formulas. Amino Acids. doi:10.1007/s00726-007-0024-3
Sorimachi K, Okayasu T (2008b) Mathematical proof of the
chronological precedence of protein formation over codon
formation. Curr Top Pept Protein Res (in press)
Sorimachi K, Okayasu T (2008c) Genome structure is homogeneous
based on codon usages. Curr Top Pept Protein Res (in press)
Sorimachi K, Okayasu T, Akimoto K et al (2000) Conservation of the
basic pattern of cellular amino acid composition during biolog-
ical evolution in plants. Amino Acids 18:193–196
Sorimachi K, Itoh T, Kawarabayasi Y et al (2001) Conservation of the
basic pattern of cellular amino acid composition during biolog-
ical evolution and the putative amino acid composition of
primitive life forms. Amino Acids 21:393–399
Sueoka N (1961) Correlation between base composition of deoxyri-
bonucleic acid and amino acid composition of proteins. Proc
Natl Acad Sci USA 47:1141–1149
Sueoka N (1988) Directional mutation pressure and neutral molecular
evolution. Proc Natl Acad Sci USA 85:2653–2657
Stuart LM, Boulais J, Charriere GM et al (2007) A systems biology
analysis of the Drosophila phagosome. Nature 445:95–101
Takeuchi F, Futamura Y, Yoshikura H, Yamamoto K (2003) Statistics
of trinucleotides in coding sequences and evolution. J Theor Biol
222:139–149
Venter JC et al (2001) The sequence of the human genome. Science
291:1304–1351
Woese CR (1998) The universal ancestor. Proc Natl Acad Sci USA
95:6854–6859
Woese CR, Kandler O, Wheelis MI (1990) Towards a natural system
of programs: proposal for the domains archaea, bacteria, and
eucarya. Proc Natl Acad Sci USA 87:4576–4579
Wolfram S (1984) Cellular automation as models of complexity.
Nature 311:419–424
Wolfram S (2002) A new kind of science. Wolfram Media Inc.,
Champaign
Xiao X, Shao S, Ding Y et al (2005a) An application of gene
comparative image for predicting the effect on replication ratio
by HBV virus gene missense mutation. J Theor Biol 235:555–
565
Xiao X, Shao S, Ding Y et al (2005b) Using cellular automata to
generate image representation for biological sequences. Amino
Acids 28:29–35
Xiao X, Shao SH, Chou KC (2006a) A probability cellular automaton
model for hepatitis B viral infections. Biochem Biophys Res
Commun 342:605–610
Xiao X, Shao SH, Ding YS et al (2006b) Using cellular automata
images and pseudo amino acid composition to predict protein
subcellular location. Amino Acids 30:49–54
Zhang C-T, Chou K-C (1993) Graphic analysis of codon usage
strategy in1490 human proteins. J Protein Chem 12:329–335
Zhang CT, Chou KC (1994a) Analysis of codon usage in 1562 E. coliprotein coding sequences. J Mol Biol 238:1–8
Zhang C-T, Chou K-C (1994b) A graphic approach to analyzing
codon usage in 1562 Echerichia coli protein coding sequences.
J Mol Biol 238:1–8
Zhang C-T, Chou K-C (1996) An analysis of base frequencies in the
anti-sense strands corresponding to the 180 human protein
coding sequences. Amino Acids 10:253–262
Zhou GP, Deng MH (1984) An extension of Chou’s graphical rules
for deriving enzyme kinetic equations to system involving
parallel reaction pathways. Biochem J 222:169–176
Amino Acids (2009) 36:261–271 271
123