organic waste digestion project protocol · (ssr 17) ... organic waste digestion project protocol...
TRANSCRIPT

Organic Waste Digestion Project Protocol
Avoiding Methane Emissions from Anaerobic Digestion of Food Waste and/or Agro-Industrial
Wastewater
Version 1.0 October 7, 2009

Organic Waste Digestion Project Protocol Version 1.0, October 2009
Acknowledgements Staff Syd Partridge Climate Action Reserve Derik Broekhoff Climate Action Reserve Tim Kidman Climate Action Reserve Nancy Kong Climate Action Reserve Heather Raven Climate Action Reserve Rachel Tornek Climate Action Reserve Workgroup Marcia Gowen Trump Atmosclear Keith Driver Blue Source Canada Nick Lapis Californians Against Waste Pierre Loots Cantor CO2e Kevin Eslinger California Air Resources Board Shelby Livingston California Air Resources Board Jack Macy City and County of San Francisco Rowena Romano City of Los Angeles Ronald Lew California Integrated Waste Management Board Rob Janzen Climate Check Paul Relis CR&R Inc. Stephanie Cheng East Bay Municipal Utility District Jay Wintergreen First Environment Adam Penque Greenhouse Gas Services, LLC. Juliette Bohn Humboldt Waste Management Authority Michael Hvisdos Microgy, Inc. Rachel Oster Recology, Inc. Derek Markolf Ryerson, Master and Associates, Inc. Peter Freed Terra Pass Charles Kennedy Tetra Tech Sally Brown University of Washington Chuck White Waste Management Paul Sousa Western United Dairymen

Organic Waste Digestion Project Protocol Version 1.0, October 2009
Table of Contents Abbreviations and Acronyms ........................................................................................................1 1 Introduction ................................................................................................................2 2 The GHG Reduction Project ......................................................................................3
2.1 Project definition.........................................................................................................3 2.2 The Project Developer ...............................................................................................3
3 Eligibility Rules ...........................................................................................................5 3.1 Location......................................................................................................................5 3.2 Project Start Date.......................................................................................................5 3.3 Project Crediting Period .............................................................................................6 3.4 Anaerobic Baseline Conditions ..................................................................................6 3.5 Additionality................................................................................................................6
3.5.1 The Performance Standard Test................................................................................7 3.5.2 The Legal Requirement Test......................................................................................8
3.6 Regulatory Compliance............................................................................................10 4 The GHG Assessment Boundary.............................................................................11 5 Quantifying GHG Emission Reductions ...................................................................18
5.1 Quantifying Baseline Emissions...............................................................................19 5.1.1 Baseline Emissions from Eligible Food Waste Streams (SSR 5).............................20 5.1.2 Baseline Emissions from Eligible Agro-industrial Wastewater Streams (SSR 7) .....25 5.1.3 Baseline Emissions from Manure Treatment Systems (SSR 6)...............................27
5.2 Quantifying Project Emissions .................................................................................28 5.2.1 Project CO2 Emissions from On-Site Fossil Fuel Combustion and Grid Delivered
Electricity (SSRs 4, 9, 14, 16, 18) ............................................................................29 5.2.2 Project Emissions from the Biogas Control System (SSRs 10,11,12,13,15) ...........30 5.2.3 Project Methane Emissions from Liquid Digester Effluent Storage and Treatment
(SSR 17) ..................................................................................................................33 5.2.4 Project Emissions from Aerobic Treatment of Digestate (SSR 18)..........................34 5.2.5 Project Emissions from Anaerobic Disposal of Digestate produced in the digestion
process (SSR 18).....................................................................................................36 5.2.6 Project Emissions from Manure Treatment Systems (SSR 6) .................................36
5.3 Calculating the Total Quantity of Methane Destroyed by the Project.......................37 6 Project Monitoring ....................................................................................................38
6.1 Organic Waste and Wastewater Monitoring Requirements .....................................38 6.1.1 Food Waste Monitoring ............................................................................................38 6.1.2 Agro-Industrial Wastewater Monitoring ....................................................................39 6.1.3 Digester Effluent and Digestate Monitoring..............................................................40
6.2 Biogas Control System Monitoring...........................................................................40 6.2.1 Biogas Measurement Instrument QA/QC.................................................................42 6.2.2 Missing Data ............................................................................................................43
6.3 Monitoring Parameters.............................................................................................43 7 Reporting Parameters ..............................................................................................49
7.1 Project Submittal Documentation.............................................................................49 7.2 Record Keeping .......................................................................................................49 7.3 Reporting Period & Verification Cycle ......................................................................50
8 Verification Guidance ...............................................................................................51 8.1 Standard of Verification............................................................................................51 8.2 Monitoring Plan ........................................................................................................51 8.3 Verifying Project Eligibility ........................................................................................51
Organic Waste Digestion Project Protocol Version 1.0, October 2009
8.4 Core Verification Activities .......................................................................................52 8.5 OWD Verification Items............................................................................................53
8.5.1 Project Eligibility and CRT Issuance ........................................................................53 8.5.2 Quantification ...........................................................................................................54 8.5.3 Risk Assessment......................................................................................................56
8.6 Completing Verification ............................................................................................56 9 Glossary of Terms....................................................................................................57 10 References...............................................................................................................61 Appendix A Associated Environmental Impacts .....................................................................63 Appendix B Data Lookup Tables ............................................................................................64 Appendix C Summary of the Performance Standard Paper ...................................................70
C.1. Selected Waste Generating Industries.....................................................................70 C.2. Organic Waste Generation and Management and OWD Performance Standard Options 72 C.3. Regulatory Conditions and Regulatory Additionality Recommendations .................76 C.4. Digestion Economics................................................................................................76
Appendix D Data Substitution .................................................................................................79
Organic Waste Digestion Project Protocol Version 1.0, October 2009
List of Tables Table 4.1. Description of all Sources, Sinks, and Reservoirs. ....................................................13 Table 5.1. Combined methane and nitrous oxide emission factors for aerobic treatment of digestate. ....................................................................................................................................35 Table 6.1. Organic waste digestion project monitoring parameters. ..........................................43 Table 8.1. Summary of eligibility criteria for an organic waste digestion project.........................52 Table 8.2. Eligibility verification items. ........................................................................................54 Table 8.3. Quantification verification items. ................................................................................55 Table 8.4. Risk assessment verification items. ...........................................................................56 List of Figures Figure 4.1. General illustration of the GHG Assessment Boundary............................................12 Figure 6.1. Suggested arrangement of biogas metering equipment. ..........................................41 .

Organic Waste Digestion Project Protocol Version 1.0, October 2009
Abbreviations and Acronyms BCS Biogas Control System
CAR Climate Action Reserve
CCAR California Climate Action Registry
CDM Clean Development Mechanism
CH4 Methane
CO2 Carbon Dioxide
CRT Climate Reserve Tonne
COD Chemical Oxygen Demand
FOD First Order Decay
GHG Greenhouse Gas
MSW Municipal Solid Waste
MT Metric Ton (or Tonne)
N2O Nitrous Oxide
OWD Organic Waste Digestion
POTW Publicly Owned Treatment Works
SSRs Sources, Sinks, and Reservoirs
UNFCCC United Nations Framework Convention on Climate Change
W.W. Wastewater
1

Organic Waste Digestion Project Protocol Version 1.0, October 2009
1 Introduction The Climate Action Reserve (Reserve) Organic Waste Digestion (OWD) Project Protocol provides guidance to account for, report, and verify greenhouse gas (GHG) emission reductions associated with the diversion of organic waste and/or wastewater away from anaerobic treatment and disposal systems and to a Biogas Control System (BCS). For the purposes of this protocol, a Biogas Control System consists of an anaerobic digester, a biogas collection and monitoring system, and one or more biogas destruction devices.1 Eligible organic waste and/or wastewater streams can be separately-digested, co-digested together, or co-digested in combination with livestock manure.2 Project developers that co-digest eligible organic waste and/or wastewater sources together with livestock manure must use this protocol together with the most current version (as of the date of project listing) of the Climate Action Reserve’s Livestock Project Protocol. The Climate Action Reserve is a national offsets program working to ensure integrity, transparency, and financial value in the U.S. carbon market. It does this by establishing regulatory-quality standards for the development, quantification and verification of GHG emissions reduction projects in North America; issuing carbon offset credits known as Climate Reserve Tonnes (CRT) generated from such projects; and tracking the transaction of credits over time in a transparent, publicly-accessible system. Adherence to the Reserve’s high standards ensures that emission reductions associated with projects are real, permanent and additional, thereby instilling confidence in the environmental benefit, credibility and efficiency of the U.S. carbon market. The Climate Action Reserve operates as a program under the similarly named nonprofit organization. Two other programs, the Center for Climate Action and the California Climate Action Registry, also operate under the Climate Action Reserve. Project developers that initiate OWD projects use this document to register GHG reductions with the Reserve. The protocol provides eligibility rules, methods to calculate reductions, performance-monitoring instructions, and procedures for reporting project information to the Reserve. Additionally, all project reports receive annual, independent verification by ISO-accredited and Reserve-approved verification bodies. Guidance for verification bodies to verify reductions is provided in the Reserve Verification Program Manual and Section 8 of this protocol.3 This protocol is designed to ensure the complete, consistent, transparent, accurate, and conservative quantification and verification of GHG emission reductions associated with an OWD project.4
1 Eligible destruction options include both on-site destruction or off-site destruction 2 Eligible organic waste streams are those that meet the “performance standard” threshold specified in Section 3.5.1 of this protocol 3 With previous project protocols, the Reserve has produced a separate verification protocol for each project reporting protocol. Reporting and verification guidance is now included in one document. Revisions to already existing project protocols will implement this programmatic change. 4 See the WRI/WBCSD GHG Protocol for Project Accounting (Part I, Chapter 4) for a description of GHG reduction project accounting principles.
2

Organic Waste Digestion Project Protocol Version 1.0, October 2009
2 The GHG Reduction Project Organic waste, organic wastewater, and manure wastes that are treated, stored, or disposed of under anaerobic conditions will decompose to produce methane, which, if not captured, is emitted to the atmosphere. For manure and organic wastewater streams, this predominantly occurs when the waste is managed in uncontrolled anaerobic liquid-based systems (e.g. in lagoons, ponds, tanks, or pits). For solid organic waste, this predominantly occurs if the waste is disposed of at a landfill. A biogas control system is designed to capture and destroy methane gas produced from the anaerobic decomposition of organic wastes and manure. By diverting organic waste and manure away from landfills and anaerobic liquid-based management systems to a biogas control system, emissions of methane to the atmosphere can be prevented and avoided.
2.1 Project definition For the purpose of this protocol, a GHG reduction project (“project”) is defined as the digestion of one or more eligible organic waste and/or agro-industrial wastewater streams in an operational Biogas Control System that captures and destroys methane gas that would otherwise have been emitted to the atmosphere in the absence of the project. For the purposes of this protocol, a BCS is considered operational on the date at which the BCS begins destroying methane gas upon completion of a start-up period. Captured biogas can be destroyed on-site, or transported for off-site use (e.g. through a gas distribution or transmission pipeline), or used to power vehicles or fuel cells. Regardless of how project developers take advantage of the captured biogas, the ultimate fate of the methane must be destruction. Projects that co-digest eligible organic waste streams together with manure also meet the definition of an OWD project. However, projects that digest manure without the addition of one or more eligible organic waste streams do not meet the definition of an OWD project and must use the Reserve’s Livestock Project Protocol to register GHG reductions with the Reserve. Centralized digesters that digest eligible waste streams from more than one source also meet the definition of an OWD project. Similarly, existing digesters at municipal wastewater treatment plants that use excess capacity to co-digest or single-digest eligible organic waste streams also meet the definition of an OWD project.
2.2 The Project Developer The “project developer” is an entity that has an active account on the Reserve, submits a project for listing and registration with the Reserve, and is ultimately responsible for all project reporting and verification. Project developers may be agribusiness owners and operators, such as dairy or swine farmers, cheese producers, or food or agricultural processing plant operators. They may also be other entities, such as renewable power developers, municipalities, or waste management entities. In all cases, the project developer must attest to the Reserve that they have exclusive claim to the GHG reductions – including indirect emission reductions – resulting from the project. Indirect emission reductions are reductions in GHG emissions that occur at a location other than where the reduction activity is implemented, and/or at sources not owned or controlled by project participants. An OWD project may result in indirect emission reductions if it diverts organic
3

Organic Waste Digestion Project Protocol Version 1.0, October 2009
4
waste streams away from landfills or wastewater treatment systems that are not located at the project site or that are not owned or controlled by project participants. Each time a project is verified, the project developer must attest that no other entities are reporting or claiming (e.g. for voluntary reporting or regulatory compliance purposes) the GHG reductions caused by the project.5 The Reserve will not issue CRTs for GHG reductions that are reported or claimed by entities other than the project developer.
5 This is done by signing the Reserve’s Attestation of Title form, available at: http://www.climateactionreserve.org/how/projects/register/project-submittal-forms/

Organic Waste Digestion Project Protocol Version 1.0, October 2009
3 Eligibility Rules Projects must fully satisfy the following eligibility rules in order to register with the Reserve. The criteria only apply to projects that meet the definition of a GHG reduction project (Section 2.1). Eligibility Rule I: Location → U.S. and its territories
Eligibility Rule II: Project Start Date →
Within six months prior to project submission*
Eligibility Rule III: Anaerobic Baseline → Demonstrate anaerobic baseline conditions
Eligibility Rule IV: Additionality → Meet performance standard
→ Exceed regulatory requirements
Eligibility Rule V: Regulatory Compliance → Compliance with all applicable laws
* See Section 3.2 for additional information on project start date
3.1 Location Only projects located in the United States and its territories, or on U.S. tribal lands, are eligible to register reductions with the Reserve under this protocol. All organic waste, wastewater, and manure waste sources that contribute waste to the OWD project must be located within the United States. Under this protocol, reductions from international projects are not eligible to register with the Reserve.
3.2 Project Start Date The project start date is defined as the date at which eligible feedstock is first digested in an operational Biogas Control System.6 For the purposes of this protocol, a BCS is considered operational on the date at which the BCS begins destroying methane gas upon completion of a start-up period. This date can be selected by the project developer within a 6 month timeframe from the date at which biogas is first produced from the digestion of eligible feedstock in the BCS digester. For digesters that were previously digesting manure prior to other eligible organic waste feedstocks, the start date shall be defined as the date at which manure was first digested in an operational BCS. Projects that digest manure without the addition of one or more eligible organic waste streams must use the Reserve’s Livestock Project Protocol if seeking to register GHG reductions with the Reserve. To be eligible, the project must be submitted to the Reserve no more than six months after the project start date, unless the project is submitted during the first 12 months following the date of 6 In some instances, food waste digestion projects may go through an initial piloting, demonstration, or testing phase where the intent is to perform research or testing on digester components and potential feedstocks. The piloting phase is generally prior to the financial commitment to implement a larger-scale (commercial scale) digestion project. If a project has gone through a piloting phase and can demonstrate that less than 5,000 MT of food waste was digested per year during the piloting phase, the project developer may elect to begin the 10-year crediting period on the date corresponding to the operational start date of the commercial scale BCS system as opposed to the operational start date of the pilot-scale project.
5

Organic Waste Digestion Project Protocol Version 1.0, October 2009
adoption of this protocol by the Reserve board (the Effective Date).7 For a period of 12 months from the Effective Date of this protocol (Version 1.0), projects with start dates no more than 24 months prior to the Effective Date of this protocol are eligible. Specifically, projects with start dates on or after October 7, 2007 are eligible to register with the Reserve if submitted by October 7, 2010. Projects with start dates prior to October 7, 2007 are not eligible under this protocol. Projects may always be submitted for listing by the Reserve prior to their start date.
3.3 Project Crediting Period The crediting period for OWD projects under this protocol is ten years. At the end of a project’s first crediting period, project developers may apply for eligibility under a second crediting period. However, the Reserve will cease to issue CRTs for GHG reductions associated with eligible waste streams if at any point in the future, the diversion of those waste streams becomes legally required, as defined by the terms of the Legal Requirement Test (see Section 3.5.2). Thus, the Reserve will issue CRTs for GHG reductions quantified and verified according to this protocol for a maximum of two ten year crediting periods after the project start date, or until the project activity is required by law (based on the date that a legal mandate takes effect), whichever comes first. Section 3.5.1 describes requirements for qualifying for a second crediting period.
3.4 Anaerobic Baseline Conditions Developers of projects that digest agro-industrial wastewater streams and/or manure streams must demonstrate that the depth of the anaerobic wastewater and/or manure treatment ponds and lagoons prior to the project’s implementation were sufficient to prevent algal oxygen production and create an oxygen-free bottom layer; which means at least 1 meter depth.8 In the event that the pre-project wastewater treatment system is located at a facility other than where the project is located, and is owned and/or operated by an entity other than the project developer, the project developer shall ensure that the verifier has access to all necessary data and has access to the site where the pre-project wastewater treatment system is located. Greenfield agro-industrial wastewater OWD projects (i.e., projects that are implemented at new industrial facilities that have no prior wastewater treatment system) are eligible only if the project developer can demonstrate that uncontrolled anaerobic storage and/or treatment of wastewater is common practice in the industry and geographic region where the project is located.
3.5 Additionality The Reserve strives to register only projects that yield surplus GHG reductions that are additional to what would have occurred in the absence of a carbon offset market. Projects must satisfy the following tests to be considered additional:
1. The Performance Standard Test 2. The Legal Requirement Test
7 Projects are considered submitted when the project developer has fully completed and filed the appropriate Project Submittal Form, available on the Reserve’s website. 8 This is consistent with the United Nations Framework Convention on Climate Change (UNFCCC) Clean Development Mechanism (CDM) methodologies ACM0010 and ACM0014 (available at http://cdm.unfccc.int/methodologies/PAmethodologies/approved.html). For additional information on the design and maintenance of anaerobic wastewater treatment systems, see U.S. Department of Agriculture Natural Resources Conservation Service, Conservation Practice Standard, Waste Storage Facility, No. 313; and U.S. Department of Agriculture Natural Resources Conservation Service, Conservation Practice Standard, Waste Treatment Lagoon, No. 359.
6
Organic Waste Digestion Project Protocol Version 1.0, October 2009
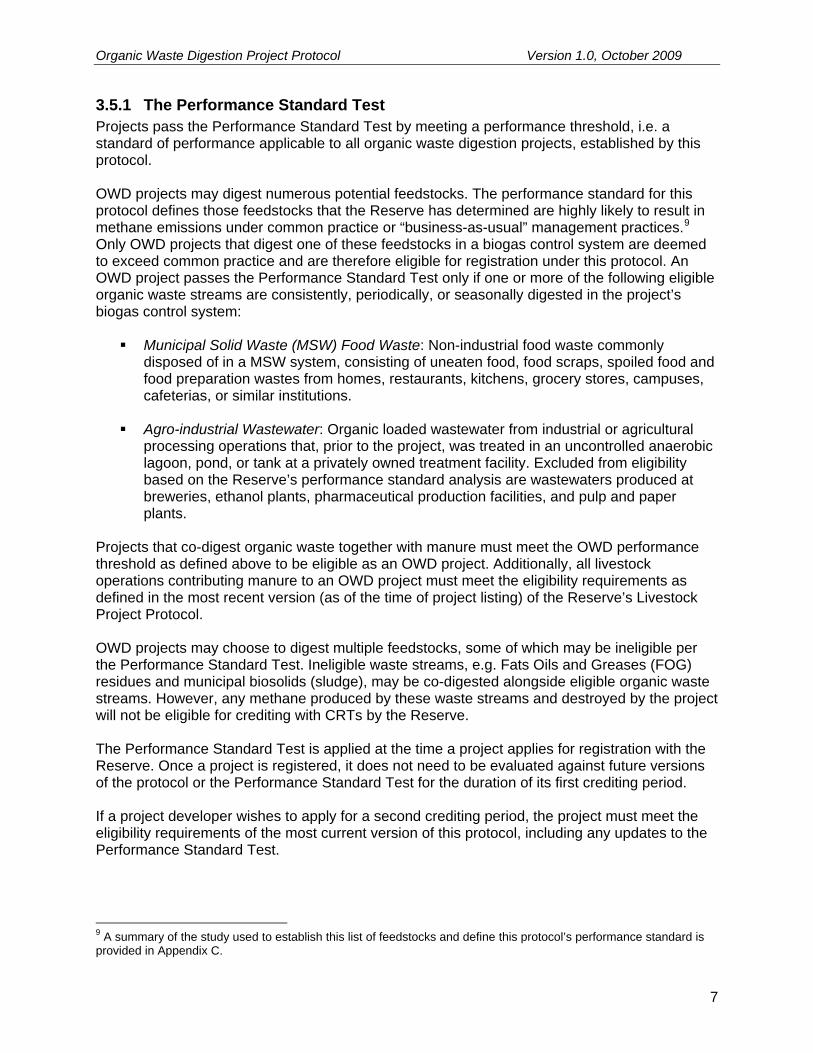
3.5.1 The Performance Standard Test Projects pass the Performance Standard Test by meeting a performance threshold, i.e. a standard of performance applicable to all organic waste digestion projects, established by this protocol. OWD projects may digest numerous potential feedstocks. The performance standard for this protocol defines those feedstocks that the Reserve has determined are highly likely to result in methane emissions under common practice or “business-as-usual” management practices.9 Only OWD projects that digest one of these feedstocks in a biogas control system are deemed to exceed common practice and are therefore eligible for registration under this protocol. An OWD project passes the Performance Standard Test only if one or more of the following eligible organic waste streams are consistently, periodically, or seasonally digested in the project’s biogas control system:
Municipal Solid Waste (MSW) Food Waste: Non-industrial food waste commonly disposed of in a MSW system, consisting of uneaten food, food scraps, spoiled food and food preparation wastes from homes, restaurants, kitchens, grocery stores, campuses, cafeterias, or similar institutions.
Agro-industrial Wastewater: Organic loaded wastewater from industrial or agricultural
processing operations that, prior to the project, was treated in an uncontrolled anaerobic lagoon, pond, or tank at a privately owned treatment facility. Excluded from eligibility based on the Reserve’s performance standard analysis are wastewaters produced at breweries, ethanol plants, pharmaceutical production facilities, and pulp and paper plants.
Projects that co-digest organic waste together with manure must meet the OWD performance threshold as defined above to be eligible as an OWD project. Additionally, all livestock operations contributing manure to an OWD project must meet the eligibility requirements as defined in the most recent version (as of the time of project listing) of the Reserve’s Livestock Project Protocol. OWD projects may choose to digest multiple feedstocks, some of which may be ineligible per the Performance Standard Test. Ineligible waste streams, e.g. Fats Oils and Greases (FOG) residues and municipal biosolids (sludge), may be co-digested alongside eligible organic waste streams. However, any methane produced by these waste streams and destroyed by the project will not be eligible for crediting with CRTs by the Reserve. The Performance Standard Test is applied at the time a project applies for registration with the Reserve. Once a project is registered, it does not need to be evaluated against future versions of the protocol or the Performance Standard Test for the duration of its first crediting period. If a project developer wishes to apply for a second crediting period, the project must meet the eligibility requirements of the most current version of this protocol, including any updates to the Performance Standard Test.
9 A summary of the study used to establish this list of feedstocks and define this protocol’s performance standard is provided in Appendix C.
7
Organic Waste Digestion Project Protocol Version 1.0, October 2009
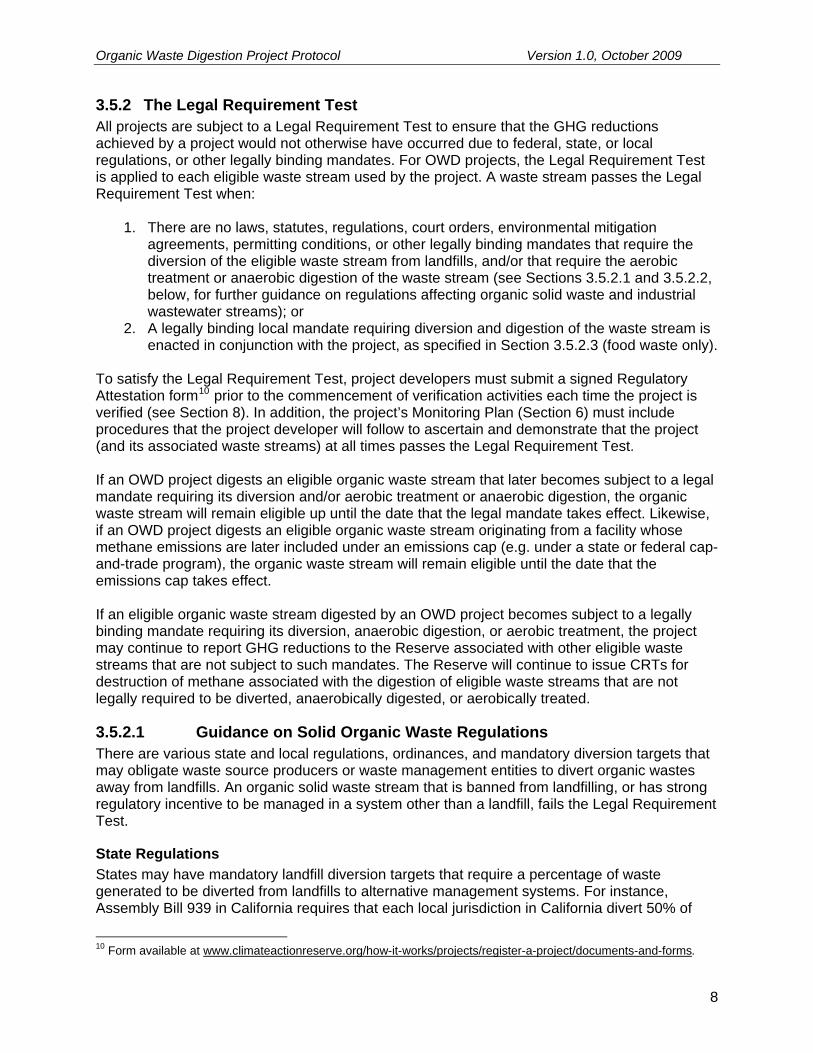
3.5.2 The Legal Requirement Test All projects are subject to a Legal Requirement Test to ensure that the GHG reductions achieved by a project would not otherwise have occurred due to federal, state, or local regulations, or other legally binding mandates. For OWD projects, the Legal Requirement Test is applied to each eligible waste stream used by the project. A waste stream passes the Legal Requirement Test when:
1. There are no laws, statutes, regulations, court orders, environmental mitigation agreements, permitting conditions, or other legally binding mandates that require the diversion of the eligible waste stream from landfills, and/or that require the aerobic treatment or anaerobic digestion of the waste stream (see Sections 3.5.2.1 and 3.5.2.2, below, for further guidance on regulations affecting organic solid waste and industrial wastewater streams); or
2. A legally binding local mandate requiring diversion and digestion of the waste stream is enacted in conjunction with the project, as specified in Section 3.5.2.3 (food waste only).
To satisfy the Legal Requirement Test, project developers must submit a signed Regulatory Attestation form10 prior to the commencement of verification activities each time the project is verified (see Section 8). In addition, the project’s Monitoring Plan (Section 6) must include procedures that the project developer will follow to ascertain and demonstrate that the project (and its associated waste streams) at all times passes the Legal Requirement Test. If an OWD project digests an eligible organic waste stream that later becomes subject to a legal mandate requiring its diversion and/or aerobic treatment or anaerobic digestion, the organic waste stream will remain eligible up until the date that the legal mandate takes effect. Likewise, if an OWD project digests an eligible organic waste stream originating from a facility whose methane emissions are later included under an emissions cap (e.g. under a state or federal cap-and-trade program), the organic waste stream will remain eligible until the date that the emissions cap takes effect. If an eligible organic waste stream digested by an OWD project becomes subject to a legally binding mandate requiring its diversion, anaerobic digestion, or aerobic treatment, the project may continue to report GHG reductions to the Reserve associated with other eligible waste streams that are not subject to such mandates. The Reserve will continue to issue CRTs for destruction of methane associated with the digestion of eligible waste streams that are not legally required to be diverted, anaerobically digested, or aerobically treated.
3.5.2.1 Guidance on Solid Organic Waste Regulations There are various state and local regulations, ordinances, and mandatory diversion targets that may obligate waste source producers or waste management entities to divert organic wastes away from landfills. An organic solid waste stream that is banned from landfilling, or has strong regulatory incentive to be managed in a system other than a landfill, fails the Legal Requirement Test.
State Regulations States may have mandatory landfill diversion targets that require a percentage of waste generated to be diverted from landfills to alternative management systems. For instance, Assembly Bill 939 in California requires that each local jurisdiction in California divert 50% of
10 Form available at www.climateactionreserve.org/how-it-works/projects/register-a-project/documents-and-forms.
8

Organic Waste Digestion Project Protocol Version 1.0, October 2009
generated solid waste (by weight) from landfills. Although waste diversion targets may not specify a reduction or percentage of diversion that must be met from organic waste, these targets nevertheless provide strong regulatory incentives to divert all wastes (including organic) from landfills. Thus, organic waste originating from a jurisdiction that is not in compliance with a mandated landfill diversion target does not pass the Legal Requirement Test until the date at which the target is achieved. In California, for instance, food waste would only be considered an eligible solid waste stream per the Legal Requirement Test if the jurisdiction producing the waste has been determined by the California Integrated Waste Management Board (the regulating entity) to have met all requirements specified in AB939 related to the amount of waste being disposed and/or diverted. Mandatory state diversion targets are not to be confused with state diversion goals. Should a state adopt a statewide waste diversion goal that does not impose penalties on jurisdictions for failing to meet diversion targets, then this state goal would not result in a failure of the Legal Requirement Test.
Local and Municipal Regulations and Ordinances Local jurisdictions may have bans on certain types of waste going to landfill, or may have mandatory ordinances that require the diversion of organic solid wastes from landfills. If a local jurisdiction has established a mandatory ban on food waste disposal at landfills, or otherwise has enacted food waste diversion mandates, food waste streams originating from the jurisdiction fail the Legal Requirement Test.
3.5.2.2 Guidance on Industrial Wastewater Regulations
Federal Regulations There are several federal regulations and standards for industrial wastewater discharge and pre-treatment. For example, Title 40 of the Code of Federal Regulations establishes pre-treatment standards for 35 different categories of industrial facilities. As of the date of adoption of this protocol, however, no federal regulations or standards require the installation of a BCS at industrial wastewater facilities, or the control of methane emissions to the atmosphere, so these regulations and standards do not affect application of the Legal Requirement Test.
State, Local, and Municipal Regulations State regulations must be at least as stringent as any federal requirement, but states can adopt more stringent and additional requirements as well. Wastewater regulations vary between states and even between counties or cities within a single state. For example, the East Bay Municipal Utility District (EBMUD) in California sets Total Suspended Solids (TSS) limits between 30 and 3,500 mg/l depending on the industry while Sheboygan and Waukesha, Wisconsin set TSS limits at 234 and 340 mg/l, respectively. Each of these localities also sets different fees that are applied to discharges when wastewater pollution limits are exceeded. Limits and discharge fees range from a few thousand to a few million dollars, thereby encouraging reduction of wastewater discharges with a combination of prescriptive controls and economic motivation. Although certain regions may encourage reduction of wastewater discharge into public treatment systems through combination of lower discharge limits and higher fees, there are no regulations known as of the date of adoption of this protocol that specifically require the installation of a BCS at industrial wastewater facilities, or the control of methane emissions to the atmosphere.
9

Organic Waste Digestion Project Protocol Version 1.0, October 2009
10
3.5.2.3 Local Food Waste Diversion Mandates Enacted in Conjunction with an OWD Project
A food waste stream subject to a local food waste diversion mandate passes the Legal Requirement Test if (and only if):
1. The project digesting the local food waste stream has an operational start date prior to, but no more than 6 months before, the date that the food waste diversion mandate is enacted by the local jurisdiction; or
2. The project is implemented subsequent to, but no more than 6 months after, the date of passage into law of the local food waste mandate.
For the purposes of this protocol, the date of project implementation may be defined with respect to the date at which the project first broke ground, began digester installation, purchased the digester or food waste pre-processing equipment, began the permitting process for the facility, or otherwise financially committed to pursue the project. All food waste streams must continue to pass the Legal Requirement Test on the state and federal level in order to be considered eligible per the Legal Requirement Test
3.6 Regulatory Compliance As a final eligibility requirement, project developers must attest that the project is in material compliance with all applicable laws relevant to the project activity (e.g. air, water quality, wastewater discharge, nutrient management, safety, etc.) prior to verification activities commencing each time a project is verified. Project developers are required to disclose in writing to the verifier any and all instances of non-compliance of the project with any law. If a verifier finds that a project is in a state of recurrent non-compliance or non-compliance that is the result of negligence or intent, then CRTs will not be issued for GHG reductions that occurred during the period of non-compliance. Non-compliance solely due to administrative or reporting issues, or due to “acts of nature,” will not affect CRT crediting.

Organic Waste Digestion Project Protocol Version 1.0, October 2009
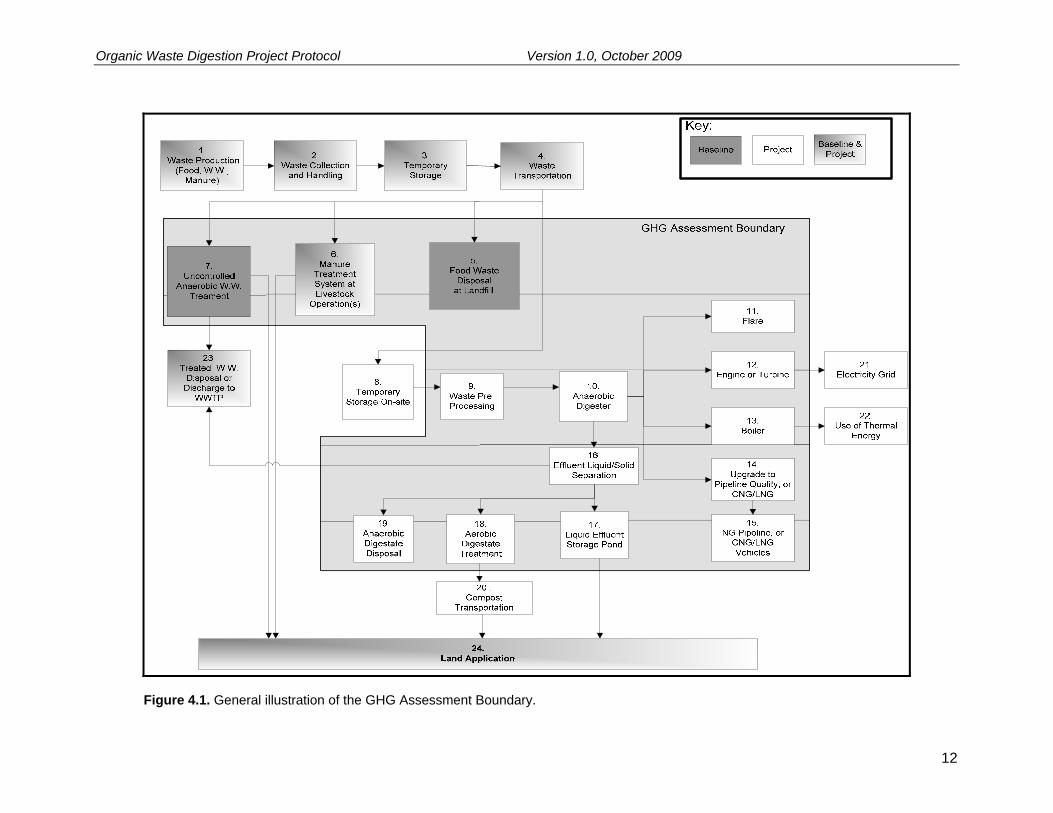
4 The GHG Assessment Boundary The GHG Assessment Boundary delineates the GHG Sources, Sinks, and Reservoirs (SSRs) that must be assessed by project developers in order to determine the net change in emissions caused by an OWD project. 11 CO2 emissions associated with the destruction of biogas are considered biogenic emissions12 (as opposed to anthropogenic) and are not included in the GHG Assessment Boundary. This is consistent with the Intergovernmental Panel on Climate Change’s (IPCC) guidelines.13 This protocol does not account for carbon dioxide reductions associated with displacing grid-delivered electricity. Combusting biogas to produce electricity for the grid would be defined as a complementary and separate renewable energy project. Likewise, this protocol does not account for carbon dioxide reductions associated with the displacement of fossil fuels used for mobile or stationary combustion sources. Utilizing biogas as replacement fuel for boilers, vehicles, or other equipment would be defined as a complementary and separate activity. Figure 4.1 below provides a general illustration of the GHG Assessment Boundary, indicating which SSRs are included or excluded from the boundary. Table 4.1 provides justification for the inclusion or exclusion of certain SSRs and gases from the GHG Assessment Boundary.
11 The definition and assessment of Sources, Sinks, and Reservoirs (SSRs) is consistent with ISO 14064-2 guidance. 12 The rationale is that carbon dioxide emitted during combustion represents the carbon dioxide that would have been emitted during natural decomposition of the solid waste. Emissions from the landfill gas control system do not yield a net increase in atmospheric carbon dioxide because they are theoretically equivalent to the carbon dioxide absorbed during plant growth. 13 IPCC Good Practice Guidance and Uncertainty Management in National Greenhouse Gas Inventories; pg 5.10, ftnt 4. The rationale is that carbon dioxide emitted during combustion represents carbon dioxide that would have been emitted during the natural decomposition of the waste.
11
Organic Waste Digestion Project Protocol Version 1.0, October 2009
Figure 4.1. General illustration of the GHG Assessment Boundary.
12

Organic Waste Digestion Project Protocol Version 1.0, October 2009
Table 4.1. Description of all Sources, Sinks, and Reservoirs.
SSR Source Description Gas
Included (I) or
Excluded (E)
Quantification Method Justification/Explanation
CO2 E N/A Excluded, as project activity is unlikely to affect emissions relative to baseline
activity
CH4 E N/A Excluded, as project activity is unlikely to impact emissions relative to baseline
activity 1. Waste
Production
Fossil fuel emissions associated with agro-
industrial activities that produce wastewater or
livestock manure, and/or fossil fuel emissions associated with the
distribution, preparation, and consumption of food that results in food waste
generation.
N2O E N/A Excluded, as project activity is unlikely to affect emissions relative to baseline
activity
CO2 E N/A Excluded, as project activity is unlikely to affect emissions relative to baseline
activity
CH4 E N/A Excluded, as project activity is unlikely to affect emissions relative to baseline
activity
2. Waste Collection and
Handling
Fossil fuel emissions from mechanical systems used to collect, handle, and/or
process waste prior to transportation(e.g. engines, pumps,
vacuums, tractors, compactors)
N2O E N/A
Excluded, as project activity is unlikely to affect emissions relative to baseline
activity
CO2 E N/A Biogenic emissions are excluded.
CH4 E N/A
Excluded for simplicity, as emissions from project activity are unlikely to be greater than emissions resulting from
baseline activity 3. Temporary
Storage
GHG emissions resulting from the temporary
storage of organic waste
N2O E N/A
Excluded for simplicity, as emissions from project activity are unlikely to be greater than emissions resulting from
baseline activity
CO2 E N/A
Excluded for simplicity, as emissions
from project activity will in most instances be less than or of
comparable magnitude to baseline transportation emissions due the
tendency to site digestion projects close to waste sources. The difference
between project and baseline waste transportation distance can be large
without significantly affecting a project’s total net GHG reductions.
CH4 E N/A
Excluded, as the net change in
emissions from this source is assumed to be very small.
4. Waste Transportation
Fossil Fuel emissions from transport of waste to final disposal/treatment system (e.g. garbage trucks, hauling trucks,
wastewater pumps, etc.)
N2O E N/A
Excluded, as the net change in
emissions from this source is assumed to be very small.
13

Organic Waste Digestion Project Protocol Version 1.0, October 2009
SSR Source Description
Included (I)
Gas or Quantification Justification/Explanation Excluded Method (E)
CO2 E N/A Biogenic emissions are excluded.
CH4 I
Baseline: Modeled w/ FOD model based on site-specific measurement of the quantity of food waste diverted to the BCS, food waste specific characteristic factors, and local climate Project: N/A
This is one of the primary sources of GHG emissions that may be affected
by an OWD project..
5. Food Waste
Disposal at Landfill
Emissions resulting from the anaerobic decay of
food waste disposed of at a landfill
N2O
E N/A
Excluded, as this emission source is assumed to be very small.
CO2 E N/A Biogenic emissions are excluded.
CH4 I
Baseline: Modeled according to LS Protocol using site-specific information Project: Modeled according to LS Protocol using site-specific information
This is one of the primary sources of GHG emissions that may be affected
by an OWD project, if the project is co-digesting manure with eligible organic
waste streams
6. Manure
Treatment System at Livestock
Operation(s)
Emissions resulting from the uncontrolled anaerobic
treatment of manure. Emissions from all
treatment and storage systems at each livestock
operation must be accounted for per the Reserve’s Livestock
Project Protocol N2O E N/A
Excluded; this is conservative as anaerobic digestion treatment of
manure is likely to reduce emissions.
CO2 E N/A Biogenic emissions are excluded.
CH4 I
Baseline: Modeled using W.W. stream specific COD samples and default values Project: N/A
This is one of the primary sources of GHG emissions that may be affected
by an OWD project..
7. Uncontrolled Anaerobic
Wastewater Treatment
Emissions resulting from the pre-project anaerobic
treatment of organic loaded agro-industrial
wastewater N2O E N/A Excluded, as this emission source is
assumed to be very small.
CO2 E N/A Biogenic emissions are excluded.
CH4 E N/A
Excluded, as this emission source is assumed to be very small. Waste is unlikely to be stored in uncontrolled
anaerobic conditions due to odor issues, and incentive to capture the
highest energy value of the feedstock.
8. Temporary Waste Storage
If waste is temporarily stored on-site before
digestion, GHG emissions may result if storage
conditions are anaerobic.
N2O E N/A Excluded, as this emission source is
assumed to be very small.
CO2 I
Baseline: N/A Project: Estimated using fossil fuel use or electricity use data and appropriate emission factors
Depending on the specifics of project
waste pre-processing practices, increases in GHG emissions from this
source could be significant.
9. Waste Pre-Processing
Emissions resulting from the use of fossil fuels or grid delivered electricity for waste pre-processing
equipment
CH4 E N/A Excluded, as this emission source is assumed to be very small..
14

Organic Waste Digestion Project Protocol Version 1.0, October 2009
SSR Source Description
Included (I)
Gas or Quantification Justification/Explanation Excluded Method (E)
N2O
E N/A Excluded, as this emission source is
assumed to be very small.
CO2 E N/A Biogenic emissions are excluded.
CH4 I
Baseline: N/A Project: Metered, assuming default digester gas collection efficiencies. Emissions from venting events are estimated based on metered data and digester design
Fugitive CH4 emissions in the project case may be significant depending on the BCS collection efficiency; venting
events must be quantified. 10. Anaerobic
Digester
Fugitive emissions from the anaerobic digester due to biogas collection inefficiency and unexpected biogas venting events
N2O E N/A
Excluded, as this emission source is
assumed to be very small.
CO2 E N/A
Biogenic emissions are excluded.
CH4 I
Baseline: N/A Project: Metered, assuming a default methane destruction efficiency
Project CH4 emissions may be significant. depending on destruction
efficiency of flare.
11. Flare
Emissions resulting from the destruction of biogas
in flare
N2O E N/A Excluded, as this emission source is assumed to be very small.
CO2 E N/A Biogenic emissions are excluded.
CH4 I
Baseline: N/A Project: Metered, assuming a default methane destruction efficiency
Project CH4 emissions may be
significant. depending on destruction efficiency of engine or turbine.
12. Engine or Turbine
Emissions resulting from the destruction of biogas
in engine or turbine
N2O E N/A
Excluded, as this emission source is
assumed to be very small.
CO2 E N/A Biogenic emissions are excluded.
CH4 I
Baseline: N/A Project: Metered, assuming a default methane destruction efficiency
Project CH4 emissions may be significant. depending on destruction efficiency of boiler or other device. 13. Boiler
Emissions resulting from the destruction of biogas
in boiler or other destruction device
N2O E N/A
Excluded, as this emission source is
assumed to be very small.***
CO2 I
Baseline: N/A Project: Estimated using fossil fuel use or electricity use data and appropriate emission factors
Project CO2 emissions resulting from on-site fossil fuel use and/or grid
delivered electricity may be significant.
CH4 E N/A Excluded, as this emission source is
assumed to be very small.
14. Upgrade to Pipeline
Quality or CNG/LNG
Emissions resulting from the use of fossil fuels or grid delivered electricity used to upgrade the quality of and transport the gas to the NG pipeline
N2O E N/A Excluded, as this emission source is assumed to be very small.
15

Organic Waste Digestion Project Protocol Version 1.0, October 2009
SSR Source Description
Included (I)
Gas or Quantification Justification/Explanation Excluded Method (E)
CO2 E N/A Excluded, as the change in emissions from this source is assumed to be very
small.
CH4 I
Baseline: N/A Project: Metered, assuming a default value representing the methane leakage in a NG pipeline and the end-use methane combustion efficiency
Project CH4 emissions may be significant. depending on efficiency of
end-user destruction, as well as processing, transmissions, and
distribution losses.
15. NG Pipeline, or CNG/LNG Vehicles
Emissions from compressors and other
equipment associated with transporting the natural gas through the pipeline
N2O E N/A Excluded, as this emission source is assumed to be very small.
CO2 I
Baseline: N/A Project: Estimated using fossil fuel use or electricity use data and appropriate emission factors
Project CO2 emissions resulting from on-site fossil fuel use and/or grid
delivered electricity may be significant.
CH4 E N/A Excluded, as this emission source is assumed to be very small.
16. Effluent Liquid/Solid Separation
Emissions resulting from the burning of fossil fuels or use of grid delivered electricity for effluent solid separation equipment
N2O E N/A Excluded, as this emission source is assumed to be very small.
CO2 E N/A Biogenic emissions are excluded.
CH4 I
Baseline: Modeled using effluent stream specific COD samples and default values Project: N/A
A potentially significant source of GHG emissions depending on the specifics
of the BCS system design
17. Liquid Effluent
Storage Pond
Emissions resulting from the open storage of the
liquid component of digester effluent
N2O E N/A Excluded, as this emission source is assumed to be very small
CO2 Fossil: I
Biogenic: E
Baseline: N/A Project: Estimated using fossil fuel use or electricity use data and appropriate emission factors
Project CO2 emissions resulting from on-site fossil fuel use and/or grid
delivered electricity may be significant..
Biogenic CO2 emissions from aerobic processing are excluded.
CH4 I
Baseline: N/A Project: Estimated using default emission factors based upon a tiered approach representing the risk of GHG emissions from the site-specific aerobic digestate treatment system
Project CH4 emissions could be very small, but depend on the management
of the composting process and feedstock, and are difficult to quantify on a standardized basis. Projects are
required to account for potential emissions based on project-specific
digestate management practices
18. Aerobic Digestate
Processing
Emissions resulting from the active composting of
digestate, either on-site or off-site
N2O I
Baseline: N/A Project: Estimated using default emission factors based upon a tiered approach representing the risk of GHG emissions from the site-specific aerobic digestate treatment system
Project N2O emissions could be very small, but depend on the management
of the composting process and feedstock, and are difficult to quantify on a standardized basis. Projects are
required to account for potential emissions based on project-specific
digestate management practices
16

Organic Waste Digestion Project Protocol Version 1.0, October 2009
SSR Source Description
Included (I)
Gas or Quantification Justification/Explanation Excluded Method (E)
CO2 E N/A Biogenic emissions are excluded.
CH4 I
Baseline: N/A Project:: Modeled w/ FOD model based on site-specific measurement of the quantity of digestate material disposed anaerobically, conservative default digestate characteristic factors, and local climate
If digestate is disposed of at a landfill, fugitive emissions under the project
could be significant
19. Anaerobic Digestate Disposal
Emissions from the disposal of digestate
material at a landfill or other anaerobic disposal
system
N2O E N/A Excluded, as this emission source is assumed to be very small
CO2 E N/A
Excluded because the difference in
baseline and project case emissions is expected to be insignificant, In the absence of compost, other fertilizer
products would be transported to the site of application.
CH4 E N/A
Excluded, as this emission source is assumed to be very small.
20. Compost Transport
Fossil fuel emissions from the transport of the
finished compost to the site of end-use
N2O E N/A
Excluded, as this emission source is assumed to be very small.
CO2 E N/A CH4 N/A 21. Electricity
Grid
Fossil fuel emissions from electricity generation
displaced by the project N2O N/A
This protocol does not cover displacement of GHG emissions from using biogas instead of fossil fuels in
electrical generating equipment.
CO2 E N/A
CH4 N/A 22. Use of Thermal Energy
Fossil fuel emissions from thermal energy generation
displaced by the project N2O N/A
This protocol does not cover displacement of GHG emissions from using biogas instead of fossil fuels in
thermal energy generating equipment.
CO2 E N/A
CH4 E N/A
23. Treated Wastewater Disposal or
Discharge to WWTP
Emissions from treated agro-industrial wastewater disposed of, or discharged
into, the natural environment or a sewer
system N2O E N/A
Excluded, as project activity is unlikely to increase emissions from wastewater
disposal relative to baseline.
CO2 E N/A
CH4 E N/A 24. Land
Application
Emissions and Sinks related to the Land
Application of treated manure, organic
wastewater, and finished compost.
N2O E N/A
Excluded, as project activity is unlikely
to increase emissions relative to baseline. Furthermore, the application of finished compost as soil amendment
or mulch on agricultural lands can result in significant GHG benefits due to avoided fossil based fertilizer use,
increased carbon sequestration, increased water retention in soils, and other impacts. This protocol does not address the GHG benefits of compost
end-use, which is considered a complementary and separate activity.
17

Organic Waste Digestion Project Protocol Version 1.0, October 2009
5 Quantifying GHG Emission Reductions GHG emission reductions from an OWD project are quantified by comparing actual project emissions to baseline emissions from anaerobic waste management of the eligible waste streams. Baseline emissions are an estimate of the GHG emissions from sources within the GHG Assessment Boundary (see Section 4) that would have occurred in the absence of the OWD project. Project emissions are actual GHG emissions that occur at sources within the GHG Assessment Boundary. Project emissions must be subtracted from the baseline emissions to quantify the project’s total net GHG emission reductions (Equation 5.1). GHG emission reductions must be quantified and verified on at least an annual basis. Project developers may choose to quantify and verify GHG emission reductions on a more frequent basis if they desire. The length of time over which GHG emission reductions are quantified and verified is called the “reporting period.” The Reserve requires all projects to compare the calculated baseline emissions for the reporting period, as calculated in Section 5.1, to the ex-post metered quantity of methane that is destroyed in the biogas control system over the same period. The lesser of the two values must be used to estimate total baseline emissions for the reporting period. Equation 5.1 below provides the quantification approach that shall be used for calculating the emission reductions from OWD project activities. 14 Equation 5.1. Calculating GHG Emission Reductions
yyy PEBEER −=
Where, Units
ERy = The total emission reductions for the reporting period MTCO2e/yr
BEy = The total baseline emissions for the reporting period, from all SSRs in the GHG Assessment Boundary
MTCO2e/yr
PEy = The total project emissions for the reporting period, from all SSRs in the GHG Assessment Boundary (as calculated in Section 5.2 )
MTCO2e/yr
=yBE The lesser of the two values : BEc,y or CH4, destroyed,y
Where, Units
BEc,y = The total calculated baseline emissions for the reporting period, from all SSRs in the GHG Assessment Boundary (as calculated in Section 5.1)
MTCO2e/yr
CH4,destroyed,y = The aggregated quantity of methane destroyed by the BCS during the reporting period (as calculated in Section 5.3)
MTCO2e/yr
14 The Reserve’s GHG reduction calculation method for OWD projects is derived from the Kyoto Protocol’s Clean Development Mechanism (AM0025 V.10, AM0073 V.1, ACM0014 V.2.1, AMS-III.E V.15.1, AMS-III.F V.6.0, and AMS-III.H V.9.0 ), and also draws from the Regional Greenhouse Gas Initiative (RGGI) Model Rule, the US EPA Inventory of US GHG Emissions and Sinks 1990-2006, and the 2006 IPCC Guidelines for National GHG Inventories
18

Organic Waste Digestion Project Protocol Version 1.0, October 2009
5.1 Quantifying Baseline Emissions Total baseline emissions must be estimated by calculating and summing the expected baseline emissions for all relevant SSRs (as indicated in Table 4.1), during the reporting period. The calculations used to estimate baseline emissions will depend on the management option(s) that would have been used to treat and/or dispose of eligible organic waste streams in the absence of an OWD project. Different baseline management options are assumed depending on the type of eligible waste stream involved:
MSW Food Waste: Uneaten food, spoiled food and food preparation wastes from homes, restaurants, kitchens, grocery stores, campuses, cafeterias, and similar institutions is predominantly disposed of at managed landfills. Nation-wide, less than 3% of MSW food waste is currently diverted from landfills.15 Thus, for the purposes of this protocol, the baseline emissions from MSW food waste streams are calculated based on the assumption that the waste would have been disposed of at a landfill in the absence of the project. See Section 5.1.1 for the calculation procedure that must be used to quantify baseline emissions for eligible food waste streams.
Agro-industrial Wastewater: Organic loaded wastewater from industrial or agricultural
processing operations, if treated on-site at the facility, may be treated in uncontrolled anaerobic or semi-anaerobic lagoons, ponds, or tanks. Thus, for the purposes of this protocol, the baseline emissions from agro-industrial wastewater streams are calculated based on the wastewater treatment system in place prior to the installation of the BCS. The project developer must demonstrate that the pre-project wastewater treatment system utilized anaerobic treatment processes, and did not incorporate methane capture and control technologies. If this cannot be demonstrated for a particular wastewater stream, baseline emissions for the particular wastewater stream are assumed to be zero. See Section 5.1.2 for the calculation procedure that must be used to quantify baseline emissions for eligible wastewater streams.
Livestock manure: For projects that co-digest eligible organic waste streams together with livestock manure, the baseline emissions for manure management draw from the Reserve’s Livestock Project Protocol. Each livestock operation contributing manure waste to the digestion project shall account for baseline emissions from all sources within the GHG Assessment Boundary. See Sections 0 of this protocol for requfor calculating baseline emissions from manure management
irements
If the OWD project co-digests ineligible waste streams together with eligible organic waste streams, baseline emissions for all ineligible waste streams are assumed to be zero. As shown in Equation 5.2, baseline emissions equal:
The methane emissions from the decay of food waste deposited in a landfill (SSR 5), plus
The methane emissions from anaerobic wastewater treatment of agro-industrial wastewaters (SSR 7), plus
The methane generated by pre-project manure management systems (SSR 6)
15 U.S. EPA, Municipal Solid Waste in the United States -2007 Facts and Figures. Table 2, pg. 36.
19
Organic Waste Digestion Project Protocol Version 1.0, October 2009
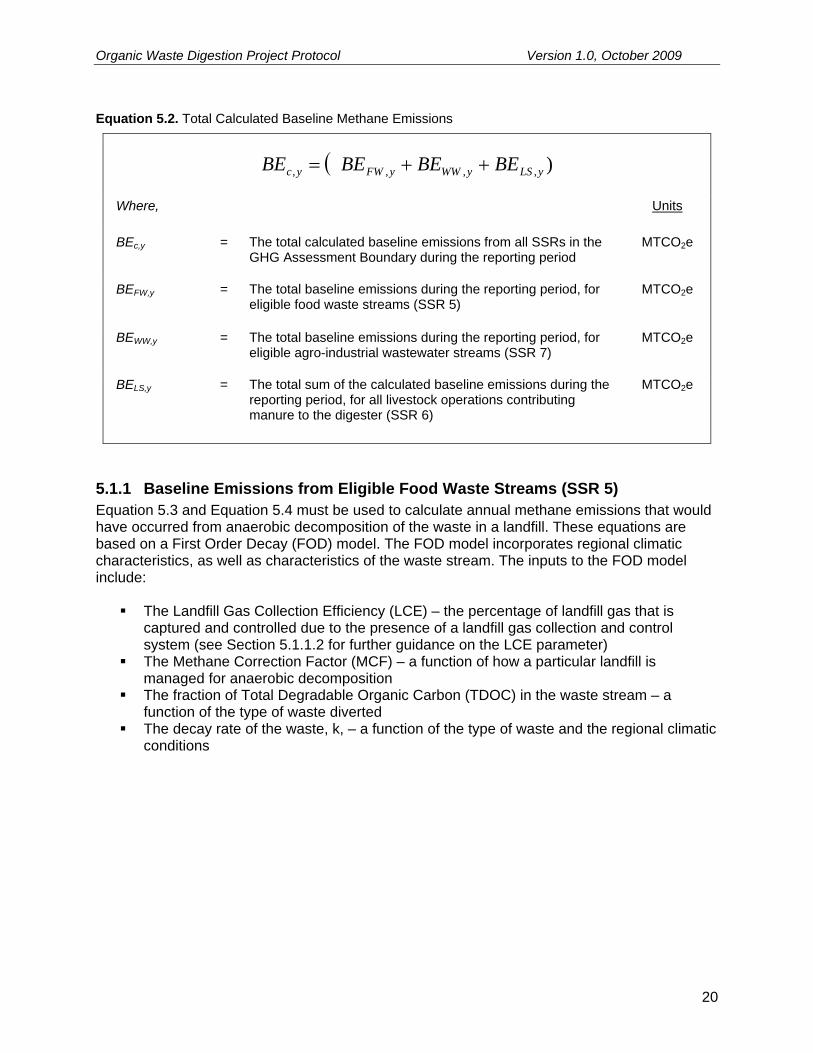
Equation 5.2. Total Calculated Baseline Methane Emissions
( ),,,, yLSyWWyFWyc BEBEBEBE ++=
Where, Units
BEc,y = The total calculated baseline emissions from all SSRs in the GHG Assessment Boundary during the reporting period
MTCO2e
BEFW,y = The total baseline emissions during the reporting period, for eligible food waste streams (SSR 5)
MTCO2e
BEWW,y = The total baseline emissions during the reporting period, for eligible agro-industrial wastewater streams (SSR 7)
MTCO2e
BELS,y = The total sum of the calculated baseline emissions during the reporting period, for all livestock operations contributing manure to the digester (SSR 6)
MTCO2e
5.1.1 Baseline Emissions from Eligible Food Waste Streams (SSR 5) Equation 5.3 and Equation 5.4 must be used to calculate annual methane emissions that would have occurred from anaerobic decomposition of the waste in a landfill. These equations are based on a First Order Decay (FOD) model. The FOD model incorporates regional climatic characteristics, as well as characteristics of the waste stream. The inputs to the FOD model include:
The Landfill Gas Collection Efficiency (LCE) – the percentage of landfill gas that is captured and controlled due to the presence of a landfill gas collection and control system (see Section 5.1.1.2 for further guidance on the LCE parameter)
The Methane Correction Factor (MCF) – a function of how a particular landfill is managed for anaerobic decomposition
The fraction of Total Degradable Organic Carbon (TDOC) in the waste stream – a function of the type of waste diverted
The decay rate of the waste, k, – a function of the type of waste and the regional climatic conditions
20

Organic Waste Digestion Project Protocol Version 1.0, October 2009
Equation 5.3 and Equation 5.4 present the FOD model calculation that must be used to estimate baseline emissions for all eligible food waste streams that are digested by the OWD project. For the calculation, the total weight of the waste from eligible waste streams must be aggregated for the entire reporting period. The FOD model estimates the methane emissions that would have been emitted to the atmosphere over a period of ten years following the year in which the waste is diverted to the project’s BCS.16 For convenience, the FOD calculation used to determine the baseline emissions from the decay of food waste is calculated according to the assumptions and parameters described below, and an emission factor look-up table of the resulting baseline emissions (in units of MTCO2e / MT of Waste) is provided in Table B.3 of Appendix B. Projects should use Table B.3 to calculate baseline emissions based on the quantities of eligible food waste digested through the end of the reporting period. Equation 5.3. Calculating Baseline Methane Emissions for Food Waste Streams (SSR 5)
ySFWCHS
yFW BEBE ,,,4, ∑=
Where, Units
BEFW,y = The total sum of the baseline emissions during the reporting period, from each eligible food waste stream
MTCO2e
BECH4,FW,S,y = The baseline methane emissions from food waste stream ‘S’ during the reporting period; calculated according to the FOD model (Equation 5.4)
MTCO2e
16 The FOD model used in Equation 5.4 is referenced from the UNFCCC Clean Development Mechanism (CDM) approved methodology for calculating avoided methane emissions from waste diversion (CDM Annex 10 – Tool to determine methane emissions avoided from dumping waste at a SWDS (V4.0)). However, the model has been adapted in order to quantify emissions from a full ten years of waste degradation upfront rather than distributed on an annual basis. Due to modeling uncertainty, it is conservative to limit the calculation time frame to ten years, although waste would likely continue to break down in a landfill situation for much longer than ten years.
21

Organic Waste Digestion Project Protocol Version 1.0, October 2009
Equation 5.4. FOD Model for Calculating Baseline Methane Emissions from Landfilled Food Waste Streams
∑=
−⋅−− −××−×××=10
1
)1(,,,,,4 )1()1(
xx
xkkSFWySFWySFWCH LCEeeTDOCMWBE Ss
Where, Units
BECH4,FW,S,y = The annual baseline methane emissions from eligible food waste stream ‘S’; calculated according to the FOD model run over a ten year time frame
MTCO2e/yr
WFW,S, y = The aggregated weight of food waste (on a wet basis) from food waste stream ‘S’ that is digested in the BCS during the reporting period. See Section 5.1.1.1 for guidance on determining the weight of eligible food waste
MT of Waste
MFW = A grouping of multiplier variables, calculated below MTCO2e / MT Carbon
TDOCS = The fraction of total degradable organic carbon (by weight) in the food waste stream ‘S’. The decimal value, which is a function of the type of waste, must be referenced from Table B.1 in Appendix B
Fraction (MT Carbon / MT Waste)
kS = The decay rate for the waste stream ‘S’. Referenced by waste origination county in Figure B.2 in Appendix B
yr-1
x = The placeholder for the iterative calculation. The FOD equation is calculated out for a period of ten years (x = 1 to 10) following the year in which the waste is initially diverted to the project’s BCS, and summed
None
e = A mathematical constant, approximately equal to 2.71828 None
LCE,x = The fraction of methane captured and destroyed by LFG collection systems in the year x, starting with the year that the waste is diverted to the project’s BCS (x =1) and ending with the year x = 10. All projects shall use a value of ‘0.0’ for the first three years of calculated waste decay (x=1 to 3) and a value of ‘0.75’ for the remaining years of decay until the end of the calculation period (x =4 to 10). See Section 5.1.1.2 for guidance on applying the LCE value. 17
Fraction
17 The Reserve will periodically re-assess the LCE default parameters in order to ensure that landfill gas collection assumptions remain conservative and accurate.
22

Organic Waste Digestion Project Protocol Version 1.0, October 2009
Equation 5.4. (Continued)
4)12/16()1(219.0 CHLFfFW FOXMCFDOCM ××−××××=
Where, Units
0.9 = Model correction factor to account for model uncertainties18
Fraction
DOCf = The fraction of the degradable organic carbon that decomposes under anaerobic conditions. The decimal value, which is a function of the type of waste, must be referenced from Table B.1 in Appendix B
Fraction
MCFLF = The Methane Correction Factor of the landfill where the waste would have gone. The MCF is a fraction between 0 and 1, and represents the anaerobic conditions present at the landfill. The MCF shall be equal to 1 for managed anaerobic landfills18
Fraction
21 = The Global Warming Potential (GWP) of methane MTCO2e / MTCH4
OX = Factor for the oxidation of methane by cover soil bacteria. A value of 0.1 shall be used18,19
Fraction
16/12 = The molar mass ratio of methane to carbon (CH4/C). Used to convert the quantity of decayed carbon to a quantity of methane
MTCH4 / MT Carbon
FCH4 = The default fraction of methane in the landfill gas. This factor reflects the fact that some degradable organic carbon does not degrade due to suboptimal conditions, or degrades very slowly under anaerobic conditions. A value of 0.5 shall be used18
Fraction
5.1.1.1 Determining the Weight of Eligible Food Waste
Mixed MSW Streams OWD projects may receive either source-separated or non-source-separated waste streams (mixed MSW). If receiving mixed MSW streams, it may be difficult to determine the weight of the food waste component of the mixed waste stream, even after the waste is separated into organic vs. non-organic components (due to other non-food waste organic wastes likely mixed with food waste). If an OWD project is receiving mixed MSW, the weight of food waste shall be determined by assuming that food waste is 18% of the total measured weight of the mixed MSW.20 Alternatively, a project developer may elect to use a food waste composition factor other than 18% based on a site-specific waste characterization study, or state, regional, or municipal published waste characterization studies. The waste characterization studies must have been conducted no more than 5 years prior to the current project reporting year.
18 As per CDM Annex 10 – Tool to determine methane emissions avoided from dumping waste at a SWDS (V4.0) http://cdm.unfccc.int/methodologies/PAmethodologies/tools/am-tool-04-v4.pdf/history_view 19 As per the Reserve Landfill Project Protocol V2.0. 20 Based on the EPA’s Municipal Solid Waste in the United States, 2007 Facts and Figures. Figure 13, pg. 64. (2008)
23

Organic Waste Digestion Project Protocol Version 1.0, October 2009
If using a site-specific food waste composition factor, the site-specific waste characterization study must be performed in accordance with guidance outlined in the following standard: ASTM D5231 - 92(2008) Standard Test Method for Determination of the Composition of Unprocessed Municipal Solid Waste.21 Additionally, field sorting and sampling events must occur at least quarterly for four consecutive seasons in order to account for seasonal variation in the composition of the MSW stream. A site-specific waste characterization study, performed in accordance with the above guidelines, shall be valid for a period of 5 years from the date at which the study is completed. See Section 6.1.1 for additional guidance on food waste monitoring.
Rejected Feedstock Successful digestion of food waste requires effective removal of contaminants (plastics, stones, grit, metals, batteries, etc.) in the pre-treatment process. If rejected material is removed from the project treatment process after the weight of the food waste delivery has been recorded, then the weight of this material (WRFS,y) must be recorded and subtracted from the total weight of food waste delivered to the project during the reporting period. See Section 6.1.1 for information on tracking this material.
Pre-Project Composting Activities If the project developer (or project facility owner) operates or owns a composting facility that has been active for more than a year prior to the project start date, and is composting food waste originating from the same municipal jurisdiction as the food waste digested in the project’s BCS, then the project developer must demonstrate that the composting activity is not affected by the OWD project. The project developer shall estimate the average quantity of food waste composted annually during the one year period prior to the start of the OWD project through weigh station records, receipts and/or other compost program documentation. The project developer must then demonstrate annually during the course of the project that the quantity of food waste composted is unaltered due to OWD project activity. Should the annual assessment show that the quantity of food waste composted has decreased relative to the pre-project average by greater than 10%, the weight of eligible food waste digested in the OWD project shall be discounted by amount equivalent to this decrease (MT).
5.1.1.2 Landfill Gas Collection Systems The Baseline emission calculation excludes methane that would have otherwise been captured and controlled by an active landfill gas collection system. The Reserve acknowledges that many landfills have active gas collection and control systems in operation, of which the majority are in place due to federal, state, or local regulations.22 Due to the uncertainty and difficulty associated with tracking and verifying pre-project waste disposal activities on a project-by-project basis, this protocol utilizes a conservative standardized approach to determining the landfill gas collection efficiency (LCE) parameter for food waste baseline emission calculations.
21 http://www.astm.org/Standards/D5231.htm 22 Per the Performance Standard Analysis conducted for the Reserve’s Landfill Project Protocol, V 2.0. See Appendix C of the Reserve’s Landfill Project Protocol.
24

Organic Waste Digestion Project Protocol Version 1.0, October 2009
For the purposes of this protocol, the baseline calculation shall reflect the following assumptions:
1. All landfills are assumed to have an active gas collection and combustion system that is collecting and destroying landfill gas. This is a very conservative assumption.
2. The Landfill Gas Collection Efficiency (LCE) parameter in the FOD calculation shall be assumed to be zero for a period of three full years following the year in which each food waste stream is initially diverted. This assumption implies that methane is not captured at the open cell of landfills, where waste is deposited, for a period of three years following the deposition of the waste, and is conservatively based on federal regulatory requirements that are applicable to a large percentage of U.S. landfills.23 Among other requirements, federal regulation requires regulated landfills (those that are required to have landfill gas collection systems) to expand their collection systems to capture landfill gas from new cells within five years from the time at which waste is first deposited in the new cell. Based on this requirement, methane may go un-captured for a period of up to five years after deposition at regulated landfills. Based on this information, it is conservative and appropriate to assume that methane will go un-captured for a period of at least three years from the time it is deposited, regardless of the specifics of the landfill.
3. The LCE parameter in the FOD calculation shall equal 0.75 (75%) for all remaining years of the calculation, beginning with the fourth year following the initial diversion.24
5.1.2 Baseline Emissions from Eligible Agro-industrial Wastewater Streams (SSR 7)
The calculations to determine the baseline methane emissions from agro-industrial wastewater streams that otherwise would have been treated in an anaerobic pond, lagoon, or tank are presented in Equation 5.5 and Equation 5.6 below. These equations shall be used to calculate the baseline emissions for each eligible wastewater stream that is digested in the project’s BCS for each reporting period. Baseline emissions will be zero for any wastewater streams that, in the absence of the project, would have been treated at a wastewater treatment plant that collects and combusts methane gas. The following equations calculate annual methane emissions that would have occurred from anaerobic decomposition of the waste in an anaerobic storage/treatment lagoon, pond, or tank by utilizing waste-specific inputs. The waste specific inputs include:
The Chemical Oxygen Demand (COD) of the wastewater as sampled – representing the organic load of the wastewater
The Methane Correction Factor (MCF) – a function of the baseline storage/treatment system
23 New Source Performance Standards (NSPS) for MSW Landfills - codified in 40 CFR 60 subpart WWW, Emission Guidelines (EG) for MSW Landfills - codified in 40 CFR 60 subpart Cc, and the National Emission Standards for Hazardous Air Pollutants (NESHAP) - codified in 40 CFR 63 subpart AAAA. 24 The 75% LFG collection efficiency is taken from the EPA Inventory of US Greenhouse Gas Emissions and Sinks, 1990-2007 (2009). In future updates to this protocol, the Reserve may consider requiring alternate values for this parameter based on state- or region-specific data.
25

Organic Waste Digestion Project Protocol Version 1.0, October 2009
The methane producing capacity of the wastewater (Bo) – a function of the type of wastewater
Equation 5.5 and Equation 5.6 present the calculations that shall be used to quantify baseline emissions from all eligible wastewater streams during the reporting period. Each wastewater stream ‘S’ shall be sampled for COD content monthly according the guidance provided in Section 6.1.2.1. Equation 5.5. Total Baseline Emissions for Eligible Agro-Industrial Wastewater Streams (SSR 7)
ySWWCHS
yWW BEBE ,,,4, ∑=
Where, Units
BEWW,y = The total sum for the reporting period of the baseline emissions from each eligible wastewater stream entering the digester
MTCO2e
BECH4,WW,S,y = The baseline methane emissions from wastewater stream ‘S’, for the reporting period, calculated per Equation 5.6 below
MTCO2e
26

Organic Waste Digestion Project Protocol Version 1.0, October 2009
Equation 5.6. Baseline Emissions for Each Eligible Wastewater Stream
)(21 ,,,,,,,,,,4 iSWWiSWWi
SATSWWoySWWCH CODQMCFBBE ××××= ∑
Where, Units
BECH4,WW,S,y = The baseline methane emissions, for the reporting period, from eligible wastewater stream ‘S’
MTCO2e
Bo,WW,S = The methane producing capacity of the wastewater stream ‘S’. Project developers may use site-specific values that are determined based on the sampling approach provided in Section 6.1.2.2. The wastewater stream must be sampled prior to mixing with other residues. Alternatively, a conservative default value of 0.21 may be used25
MTCH4 / MTCOD
MCFAT,S = The Methane Correction Factor of the anaerobic treatment lagoon, pond, or tank where the waste was treated pre- project, equal to the lower bound value for the treatment system as provided in Table B.4 in Appendix B
Fraction
21 = The global warming potential for methane MTCO2e/MTCH4
Qww,S,I = The volume of wastewater from stream ‘S’ in month ‘i’ m3
CODWW,S, i = The chemical oxygen demand of the untreated wastewater stream ‘S’ for month ‘i’. COD must be sampled prior to mixing with other residues, and must be sampled according to the guidance in Section 6.1.2.1 for each wastewater stream ‘S’ on a monthly basis
MTCOD/m3
5.1.3 Baseline Emissions from Manure Treatment Systems (SSR 6) For projects that are co-digesting manure alongside eligible organic waste streams, project developers calculate the annual baseline emissions from all manure waste streams according to the pre-project manure management system in place at the livestock operation from which the manure is sourced. All livestock operations contributing waste to the digester must calculate baseline emissions from all manure management systems in accordance with the Reserve Livestock Project Protocol’s baseline calculation approach. If a project developer can demonstrate that a particular manure management system is not affected by the project activity, then this system can be excluded from the baseline calculation. Baseline emissions from all livestock operations must be aggregated per Equation 5.7 below.
25 Per CDM ACM0014 V.2.1 and CDM AMS III.F V.6
27
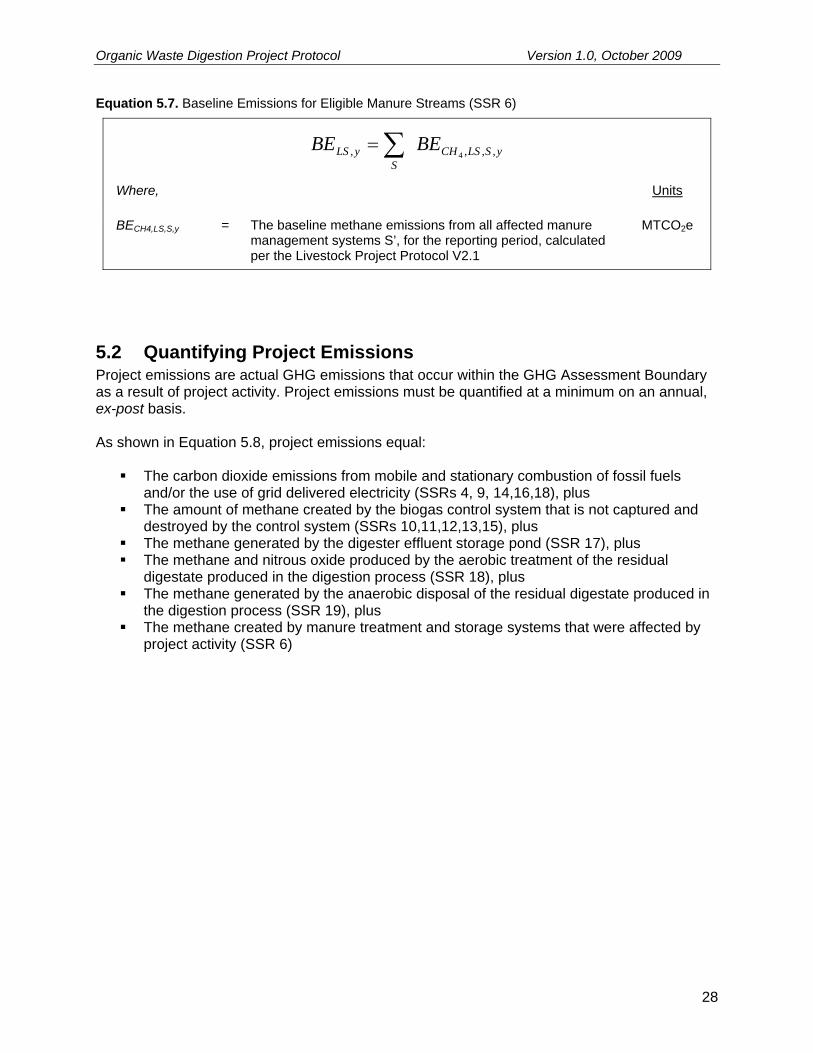
Organic Waste Digestion Project Protocol Version 1.0, October 2009
Equation 5.7. Baseline Emissions for Eligible Manure Streams (SSR 6)
ySLSCHS
yLS BEBE ,,,, 4∑=
Where, Units
BECH4,LS,S,y = The baseline methane emissions from all affected manure management systems S’, for the reporting period, calculated per the Livestock Project Protocol V2.1
MTCO2e
5.2 Quantifying Project Emissions Project emissions are actual GHG emissions that occur within the GHG Assessment Boundary as a result of project activity. Project emissions must be quantified at a minimum on an annual, ex-post basis. As shown in Equation 5.8, project emissions equal:
The carbon dioxide emissions from mobile and stationary combustion of fossil fuels and/or the use of grid delivered electricity (SSRs 4, 9, 14,16,18), plus
The amount of methane created by the biogas control system that is not captured and destroyed by the control system (SSRs 10,11,12,13,15), plus
The methane generated by the digester effluent storage pond (SSR 17), plus The methane and nitrous oxide produced by the aerobic treatment of the residual
digestate produced in the digestion process (SSR 18), plus The methane generated by the anaerobic disposal of the residual digestate produced in
the digestion process (SSR 19), plus The methane created by manure treatment and storage systems that were affected by
project activity (SSR 6)
28

Organic Waste Digestion Project Protocol Version 1.0, October 2009
Equation 5.8. Total Project Emissions from All Sources
( ),,4,,4,,2,4,,4,,4,2 yLSCHyADCHyATONCHyEFCHyBCSCHyCOy PEPEPEPEPEPEPE +++++=
Where, Units
PEy = The total project emissions, for the reporting period, from all SSRs within the GHG Assessment Boundary
MTCO2e
PECO2,y = The total project carbon dioxide emissions, for the reporting period, from fossil fuel and grid electricity sources included in the GHG Assessment Boundary (SSRs 9,14,16,18)
MTCO2e
PECH4,BCS,y = The project methane emissions, for the reporting period, from the biogas control system (SSRs 10,11,12,13,15)
MTCO2e
PECH4,EF,y = The project emissions, for the reporting period, from the digester effluent pond (SSR 17)
MTCO2e
PECH4,N2O,AT,y = The project emissions of CH4 and N2O, for the reporting period, from the aerobic treatment of digestate material (SSR 18)
MTCO2e
PECH4,AD,y = The project emissions, for the reporting period, from the anaerobic disposal of digestate material at a landfill (SSR 19)
MTCO2e
PECH4,LS,y = The total sum of project emissions, for the reporting period, from manure management systems affected by the project (SSR 6)
MTCO2e
5.2.1 Project CO2 Emissions from On-Site Fossil Fuel Combustion and Grid Delivered Electricity (SSRs 4, 9, 14, 16, 18)
On-Site Stationary Combustion and Grid Electricity Included in the GHG Assessment Boundary are carbon dioxide emissions resulting from fossil fuel combustion and/or the use of grid delivered electricity for on-site equipment that is used for:
the sorting and pre-processing of waste (SSR 9) the upgrading of biogas to pipeline quality natural gas, compressed natural gas (CNG),
or liquid natural gas (LNG) (SSR 14) the separation of liquid and solid components of the digestate (SSR 16) the aerobic treatment of digestate material (SSR 18)
If the project utilizes fossil fuel or grid electricity to power equipment necessary for performing the above processes, the resulting project carbon dioxide emissions shall be calculated per Equation 5.9 below.
29

Organic Waste Digestion Project Protocol Version 1.0, October 2009
Equation 5.9. Project Carbon Dioxide Emissions from Fossil Fuel and Grid Electricity
( ),,2,,2,2 yGECOyFFCOyCO PEPEPE +=
Where, Units
PECO2,FF,y = The total carbon dioxide emissions from the destruction of fossil fuel during the reporting period
MTCO2
PECO2,GE,y = The total indirect carbon dioxide emissions from the consumption of electricity from the grid during the reporting period
MTCO2
( )1000
* ,,
,,2
∑= i
iFFiPR
yFFCO
EFFFPE
Where, Units
FFPR,i = Total fossil fuel consumed by on-site combustion during the reporting period, by fuel type i
Volume Fossil Fuel
EFFF,i = Fuel specific emission factor, reference from Appendix B kgCO2 / Volume Fossil
Fuel 1000 = Kilograms per tonne kgCO2/tCO2
( )ELPRyGECO EFELPE *,,2 =
Where, Units
ELPR = Total electricity consumed by project operations over the reporting period
MWh
EFEL = Carbon emission factor for electricity used, referenced in Appendix B
MTCO2/MWh
5.2.2 Project Emissions from the Biogas Control System (SSRs 10,11,12,13,15) The biogas control system (consisting of the digester, the gas collection system, and the destruction devices) may be a significant source of methane emissions due to leakage of biogas from the digester and collection system (SSR 10) and incomplete destruction of methane in the various destruction devices (SSRs 11,12,13,15). Methane emissions from the biogas control system must calculated using Equation 5.10 below, using continuous biogas flow measurements and monthly methane concentration measurements. All flow measurement devices should internally correct to standard temperature and pressure (60oF and 1 atm). If the biogas flow metering equipment does not internally correct for temperature and pressure, both temperature and pressure must be measured continuously and the guidance provided in Equation 5.11 shall be used to adjust the flow for temperature and pressure.
30

Organic Waste Digestion Project Protocol Version 1.0, October 2009
Equation 5.10. Project Methane Emissions from the BCS (SSRs 10,11,12,13,15)
∑ ⎟⎟⎠
⎞⎜⎜⎝
⎛+⎟
⎟⎠
⎞⎜⎜⎝
⎛−××=
iiventiimeteryBCSCH CHBDE
BCECHPE ,,4,,4,,4
121
Where, Units
PECH4, BCS,y = The methane emissions from the Biogas Control System during the reporting period
MTCO2e
21 = The global warming potential for methane MTCO2e/MTCH4
CH4,meter,i = The total quantity of methane collected and metered in month ‘i’
MTCH4/month
BCE = The methane collection efficiency of the biogas control system, as referenced from Appendix B
Fraction
BDEi = The monthly methane destruction efficiency of the combustion device(s). In the event that there is more than one destruction device in operation in any given month, the weighted average destruction efficiency from all combustion devices is to be used (see BDE calculation below)
Fraction
CH4,vent,i = The monthly quantity of methane that is vented to the atmosphere due to BCS venting events, as quantified in Equation 5.12 below
Fraction
000454.004230.0,,4,,4 ×××= iconciimeter CHFCH
Where, Units
Fi = The total monthly measured volumetric flow of biogas to all destruction devices – see Equation 5.11 for additional guidance on adjusting the biogas flow for temperature and pressure
SCF/month
CH4,conc,i = The monthly measured methane concentration of the biogas. If methane concentration is continuously measured, the value is equal to the monthly average
Fraction
0.04230 = The density of methane gas at STP (1 atm, 60oF) lbsCH4/SCF
0.000454 = Conversion factor, lbs to metric tonnes MT/lb
31

Organic Waste Digestion Project Protocol Version 1.0, October 2009
Equation 5.10. (Continued)
( )
i
DDDDiDD
weightedi F
FBDEBDE
∑ ×=
,
,
Where, Units
BDEi,weighted = The monthly weighted average of all destruction devices used in month ‘i’
Fraction
BDEDD = The default methane destruction efficiency of a particular destruction device ‘DD’. Referenced from in Appendix B
Fraction
Fi,DD = The monthly flow of biogas to a particular destruction device ‘DD’ – see Equation 5.11 for additional guidance on adjusting the biogas flow for temperature and pressure
SCF/month
Fi = The total monthly measured volumetric flow of biogas to all destruction devices – see Equation 5.11 for additional guidance on adjusting the biogas flow for temperature and pressure
SCF/month
Equation 5.11. Adjusting the Biogas Flow for Temperature and Pressure
If the biogas flow metering equipment does not internally correct for the temperature and pressure of the biogas, separate pressure and temperature measurements must be used to correct the flow measurement. The temperature and pressure of the biogas must be measured continuously. Important: Apply the following equation only if the biogas flow metering equipment does not internally correct for temperature and pressure.
1520 PT
FF unadjustedscf ××=
Where, Units
FSCF = Adjusted volume of biogas collected for the given time interval, adjusted to 60° F and 1 atm
SCF/unit time
Funadjusted = Unadjusted volume of biogas collected for the given time interval ft3/unit time T = Measured temperature of the biogas for the given time period (°R
= °F + 459.67) °R
P = Measured pressure of the biogas in for the given time interval Atm
5.2.2.1 Biogas Venting Events Although not common under normal digester operation, it is possible that a venting event may occur due to failure of digester cover materials, the digester vessel, or the gas collection system, or due to a planned maintenance event. In the event that a system failure or planned operation results in the venting of biogas, the quantity of methane released to the atmosphere shall be estimated according to Equation 5.12 below.
32

Organic Waste Digestion Project Protocol Version 1.0, October 2009
Equation 5.12. Methane Release from Venting Events
( ) 000454.004230.0)( ,,4,,4 ××××+= iconcpwBCSivent CHtFMSCH
Where, Units
CH4,vent,i = The monthly quantity of methane that is vented to the atmosphere due to BCS venting events
MTCO2e
MSBCS = Maximum biogas storage of the BCS system SCF Fpw = The average total flow of biogas from the digester for the entire
week prior to the venting event SCF/day
t = The number of days of the month that biogas is venting uncontrolled from the project’s BCS
days
5.2.3 Project Methane Emissions from Liquid Digester Effluent Storage and Treatment (SSR 17)
Methane emissions from liquid digester effluent storage must be calculated using Equation 5.13 below. All projects sending the liquid portion of digester effluent to a storage pond shall use the following calculation approach to quantify project emissions from the effluent storage pond. If an OWD project recycles digester effluent, disposes of the effluent directly to a sewage system, or otherwise manages the effluent without the use of a liquid effluent storage pond, then this emission source is not applicable to the project. Because of the variable nature of the waste entering the digester, it is necessary to base calculations on quarterly COD measurements taken from the effluent exiting the digester prior to entering the effluent storage pond. See Section 6.1.2.1 for additional guidance on performing COD sampling.
33

Organic Waste Digestion Project Protocol Version 1.0, October 2009
Equation 5.13. Project Methane Emissions from the BCS Effluent Pond (SSR 17)
)(21 ,,,,,4 iEFiEFi
EFEFoyEFCH CODQMCFBPE ××××= ∑
Where, Units
PECH4,EF,y = The total project methane emissions from the biogas control system effluent pond over the reporting period
MTCO2e
Bo,EF = The methane producing capacity of the effluent stream ‘S’. Project developers may use site-specific values that are determined based on the sampling approach provided in Section 6.1.2.2. Alternatively, a value of 0.21 may be used for all effluent26
MTCH4 / MTCOD
MCFEF = The Methane Conversion Factor of the effluent storage pond. The value shall be equal to 0.3 27
Fraction
21 = The global warming potential for methane MTCO2e/MTCH4
QEF,i = The volume of effluent discharged into the effluent storage pond in month ‘i’
m3
CODEF,i = The chemical oxygen demand of the effluent discharged into the storage pond in month ‘i’. COD must be sampled quarterly according to the guidance provided in Section 6.1.2.1
MTCOD/m3
5.2.4 Project Emissions from Aerobic Treatment of Digestate (SSR 18) The digestion of organic waste may produce residual waste (digestate) that, depending on how it is treated, could result with material emissions of methane and/or nitrous oxide. The degree to which aerobic treatment of organics releases methane and/or nitrous oxide to the atmosphere is highly uncertain due the complicated GHG emission pathways for methane and nitrous oxide given various aerobic treatment methods. On a project-by-project basis, it is difficult to quantify the emissions of methane and nitrous oxide that occur from the composting of digestate material, however it is possible to place bounds on the emissions based on peer reviewed literature and internationally accepted GHG accounting methodologies.28 For the purposes of this protocol, a conservative approach is taken based on a range of possible emission factors and a range of potential composting techniques that either maximize or minimize the potential for GHG emissions. Table 5.1 outlines the tiered approach that must be followed to estimating the combined emissions of methane and nitrous oxide as a function of the amount of digestate going into the composting process (measured on a wet basis).29
26 Per CDM ACM0014 V.2.1 and CDM AMS III.F V.6 27 Equal to the higher bound MCF value for the Anaerobic shallow lagoon system. 2006 IPCC Guidelines for National GHG Inventories, Vol. 5 Ch. 6 Table 6.3 , 28 Bounds for potential emissions of N2O and CH4 were developed based upon estimates and empirical results of GHG emission from composting, taken from the following sources: 2006 IPCC Guidelines for National GHG Inventories, CDM AM0025 V10, U.S. EPA Solid Waste Management and Greenhouse Gases: A Life-Cycle Assessment of Emissions and Sinks (2006), and Brown et al. Greenhouse Gas Balance for Composting Operations (2008). 29 The GHG risk level is assessed based off of information obtained from: Brown et al. Greenhouse Gas Balance for Composting Operations (2008)
34

Organic Waste Digestion Project Protocol Version 1.0, October 2009
Table 5.1. Combined methane and nitrous oxide emission factors for aerobic treatment of digestate. Tier
(GHG Emission Risk Level) Emission Factor
(MTCO2e / MT (wet weight) of Digestate Aerobically Treated*)
High: Digestate treated on-site in uncovered non-
aerated static piles Material treated off-site at an
undocumented facility
0.10
Medium: Digestate treated on-site in aerated
systems (windrows or aerated static piles) Material treated off-site at a centralized
composting facility Non-aerated static piles covered with a
layer of finished compost that is kept moist
0.06
Low: Digestate treated on-site in an enclosed
system (in-vessel) utilizing a bio-filter or biogas scrubber
0.02
Zero: Materials thermally dried upon separation
from liquid effluent Materials used directly as animal bedding
material Digestate immediately blended as soil
amendment
0
* Project developers may use the site specific weight of waste going to aerobic treatment, or may use a conservative default value equal to 20% of the wet weight of the waste entering the digester. 30
OWD projects shall use Equation 5.14 to estimate the combined emissions of methane and nitrous oxide from aerobic digestate treatment, using the appropriate emission factor from Table 5.1 above. Equation 5.14. Methane and Nitrous Oxide Emissions from Aerobic Treatment of Digestate (SSR 18)
ATSyDATyATONCH EFWPE ×= ,,,2,4
Where, Units
WDAT,y = The total wet weight of digestate treated aerobically on-site, or sent off-site for aerobic treatment, over the reporting period. Project proponents may use site specific weights, or may use a default value of 20% of the wet weight of waste entering the digester
MT
EFATS = The emission factor for the appropriate aerobic treatment Tier, as provided in Table 5.1
MTCO2e / MTdigestate
30 Default weight based conservatively on expert feedback
35

Organic Waste Digestion Project Protocol Version 1.0, October 2009
Project carbon dioxide emissions from the use of fossil fuel or grid powered equipment during the aerobic digestate treatment process are calculated in Section 5.2.1.
5.2.5 Project Emissions from Anaerobic Disposal of Digestate produced in the digestion process (SSR 18)
If residual waste (digestate) is disposed of at a landfill, then the methane emissions from the landfilling of this waste must be accounted for. In order to quantify the emissions from the landfilling of digestate, the project developer must track the weight of digestate that goes to a landfill during the reporting period (WDLF,y). If digestate is disposed of anaerobically, the total emissions from disposal (PECH4,AD,y) over the reporting period shall be calculated using the FOD model (Equation 5.4), using the default TDOC value for the “sludge” waste category as referenced in Table B.1 in Appendix B. Project developers should use the look-up table (Table B.3 in Appendix B) to calculate the emissions from anaerobic disposal of digestate.
5.2.6 Project Emissions from Manure Treatment Systems (SSR 6) For projects that are co-digesting manure alongside eligible organic waste streams, it is necessary to account for the project emissions from all manure management systems that have been affected by project activity. This is necessary per the GHG accounting method used in the Reserve Livestock Project Protocol.31 If the baseline anaerobic system still receives a percentage of the manure stream on an ongoing basis, the emissions from this source could be significant. If a project developer can demonstrate that a particular manure management system has not been affected by project activity, then this system can be excluded from the project emissions calculation. The project emissions calculation must be performed in accordance with the Reserve Livestock Project Protocol’s project emissions guidance for non-BCS related sources, and aggregated for each livestock operation according to Equation 5.15 below. Equation 5.15. Project Emissions from Non-BCS Related Manure Treatment/Storage Systems
ySLSCHS
yLS PEPE ,,,4, ∑=
Where, Units
PECH4,LS,y = The total sum for the reporting period of the project methane emission calculation results for all manure management systems affected by project activity
MTCO2e
PECH4,LS,S,y = The project methane emissions from manure management system ‘S’, for the reporting period as calculated per the method described in the non-biogas control system related sources section of the Livestock Project Protocol
MTCO2e
31 The Reserve Livestock Project Protocol sums the entire methane emissions from the baseline anaerobic lagoon, assuming that all the manure sent to the baseline anaerobic lagoon pre-project is sent to the BCS in the project scenario, however if a project is sending less than 100% of the manure stream to the BCS, then the remaining portion that is still going to the anaerobic lagoon after project implementation must be accounted for as project emissions.
36

Organic Waste Digestion Project Protocol Version 1.0, October 2009
5.3 Calculating the Total Quantity of Methane Destroyed by the Project
The Reserve recognizes that there can be material differences between the calculated emission reductions and the actual quantity of methane that is captured and destroyed by the biogas control system. In most cases, the amount of metered methane that is destroyed by the project in any given year should greatly exceed the annual sum of the baseline emissions, due primarily to the incomplete degradation of waste as modeled in the FOD equation over a 10 year timeframe. In some instances, however, digester performance issues related to start-up periods, venting events, and other biogas control system operational issues may result in sub-optimal gas generation or destruction. These operational issues have the potential to result in substantially less methane destruction than is calculated, leading to an overestimation of emission reductions. To address this issue and maintain consistency with international best practice, the Reserve requires that calculated baseline emissions be compared to the ex-post metered quantity of methane that is captured and destroyed by the biogas control system. The lesser of the two values will represent the total baseline emissions for the reporting period.
Projects shall use Equation 5.16 to determine the total quantity of methane that is captured and destroyed by the project’s BCS. Equation 5.16. Metered Methane Destruction
21)( ,,4,4 ××= ∑i
iimeterdestroyed BDECHCH
Where, Units
CH4,destroyed,y = The aggregated quantity of methane collected and destroyed during the reporting period
MTCO2e
CH4,meter,i = The monthly quantity of methane collected and metered. See Equation 5.10 for calculation guidance
MTCH4/month
BDEi = The monthly methane destruction efficiency of the combustion device. In the event that there is more than one destruction device in operation in any given month, the weighted average destruction efficiency from all combustion devices is to be used.
Fraction
21 = The Global Warming Potential for methane
MTCO2e/MTCH4
37

Organic Waste Digestion Project Protocol Version 1.0, October 2009
6 Project Monitoring The Reserve requires a Monitoring Plan to be established for all monitoring and reporting activities associated with the project. The Monitoring Plan will serve as the basis for verifiers to confirm that the monitoring and reporting requirements in this section and Section 7 have been and will continue to be met, and that consistent, rigorous monitoring and record-keeping is ongoing at the project site. The Monitoring Plan must cover all aspects of monitoring and reporting contained in this protocol and must specify how data for all relevant parameters in Table 6.1 (below) will be collected and recorded. At a minimum the Monitoring Plan shall stipulate the frequency of data acquisition; a record keeping plan (see Section 7.2 for minimum record keeping requirements); the frequency of instrument field check and calibration activities; and the role of individuals performing each specific monitoring activity. The Monitoring Plan should include QA/QC provisions to ensure that data acquisition and meter calibration are carried out consistently and with precision. Finally, the Monitoring Plan must include procedures that the project developer will follow to ascertain and demonstrate that the project at all times passes the Legal Requirement Test (Section 3.5.2). Project developers are responsible for monitoring the performance of the project and ensuring that the operation of all project-related equipment is consistent with the manufacturer’s recommendations.
6.1 Organic Waste and Wastewater Monitoring Requirements There are numerous parameters related to OWD project activities that must be monitored and tracked in order to accurately quantify the baseline and project emissions. Below are the requirements that shall be met for the monitoring of OWD projects.
6.1.1 Food Waste Monitoring For OWD projects that digest eligible food waste streams, it is necessary to ensure that the quantity (by wet weight) of eligible food waste digested in the project’s BCS is accurately monitored and recorded for each food waste stream. The project developer shall weigh all truck loads of waste delivered to the project facility, and monitor and record the following data for each truckload:
The origination of the waste The weight (MT) on a wet basis of waste delivered to the OWD project (aggregated for
the reporting period) If deliveries consist of mixed MSW (non-source separated waste), the total weight of food waste shall be determined by applying the guidance in Section 5.1.1.1. Additionally, the project developer shall monitor truck loads of material leaving the facility, and shall monitor and record:
The weight (MT) of rejected feedstock that is re-directed back to a landfill or other system after initially being weighed upon delivery to the OWD facility (aggregated for the reporting period)
38

Organic Waste Digestion Project Protocol Version 1.0, October 2009
A QA/QC procedure for the inspection and calibration of weigh scales must be included in the Monitoring Plan. All weigh scales must be inspected and calibrated in accordance with manufacturer’s specifications.
6.1.2 Agro-Industrial Wastewater Monitoring For OWD projects that pump eligible agro-industrial wastewater streams into the digester, the project developer shall monitor and record the following data for each wastewater stream:
The daily volume of wastewater (m3/day) entering the digester (aggregated monthly) The monthly COD of the wastewater (MTCOD/m3) prior to mixing with other residues
The monthly COD of the wastewater must be determined by sampling. All COD sampling must be performed in accordance with the requirements in Section 6.1.2.1. A QA/QC procedure for the inspection, cleaning, and calibration of wastewater monitoring equipment must be included in the Monitoring Plan. Wastewater monitoring instruments must be inspected, cleaned, and calibrated in accordance with manufacturer’s specifications.
6.1.2.1 Requirements for Chemical Oxygen Demand (COD) Sampling The Chemical Oxygen Demand must be sampled and analyzed in accordance with the COD sampling and analysis technique detailed in the Standard Methods for the Examination of Water and Wastewater, 5220 – Chemical Oxygen Demand.32 COD sampling and analysis shall be done by professionals experienced with the procedures used to determine COD as described in the above mentioned Standard Method approach.
6.1.2.2 Requirements for Determining a Site-Specific Maximum Methane Potential (Bo)
For OWD projects that choose to determine a site-specific maximum methane potential value for one or more wastewater streams being digested in the project’s BCS, the following criteria must be met in order to ensure accuracy and consistency of the site-specific Bo values:
1. Wastewater samples for each eligible wastewater stream must be sampled prior to mixing with other residues.
2. For each eligible wastewater stream, a total of at least ten samples must be taken across the span of at least 1 week.
3. All samples must be analyzed at a laboratory that is familiar and experienced with the Biochemical Methane Potential (BMP) Assay procedure used to determine the maximum methane potential value of wastewaters.33
4. At least ten samples must be analyzed by the chosen laboratory, the highest and lowest outlier results shall be discarded, and the site-specific Bo value to be used for the sampled wastewater stream shall equal the 90% lower confidence limit of the remaining assay results.
A site-specific Bo value determined according to the requirements outlined above will be valid for a period of 1 year from the date of the initial sampling event.
32 http://www.standardmethods.org/store/ProductView.cfm?ProductID=37 33 For more information on BMP Assay analysis and procedures, see: Moody et al. “Use of Biochemical Methane Potential (BMP) Assays for Predicting and Enhancing Anaerobic Digester Performance.” (2009) http://sa.pfos.hr/sa2009/radovi/pdf/Radovi/r10-009.pdf
39

Organic Waste Digestion Project Protocol Version 1.0, October 2009
6.1.3 Digester Effluent and Digestate Monitoring
6.1.3.1 Liquid Effluent For OWD projects that send the liquid portion of the digester effluent to a temporary storage pond, the project developer is responsible for monitoring the effluent that is discharged from the digester in order to quantify the annual methane emissions from the effluent storage pond in accordance with Equation 5.13. This requires that the project developer directly monitor and record:
The daily volume of digester effluent wastewater (m3/day) that is exiting the digester prior to entering the effluent storage pond (aggregated monthly)
The quarterly COD (MTCOD/m3) of the effluent wastewater exiting the digester prior to entering the effluent storage pond
As an alternative to measuring the daily volume of digester effluent exiting the digester, the project developer may use the total daily measured influent volume of wastewater that enters the digester as a conservative approximation for daily digester effluent volume. The quarterly COD of the effluent must be determined by sampling. All COD sampling must be performed in accordance with the requirements in Section 6.1.2.1. Samples must be taken prior to effluent entering the storage pond, and must be taken after solids are removed from the effluent stream.
A QA/QC procedure for the inspection, cleaning, and calibration of wastewater monitoring equipment must be included in the Monitoring Plan. Effluent monitoring instruments shall be inspected, cleaned, and calibrated in accordance with manufacturer’s specifications.
6.1.3.2 Digestate Material For OWD projects that dispose of all or a portion of the project’s digestate material at a landfill, the project developer is responsible for monitoring the quantity of digestate that is disposed of. Emissions from the anaerobic disposal of digestate must be quantified in accordance with Section 5.2.5. This requires that the project developer directly monitor and record all vehicles delivering digestate to landfill systems and record:
The weight (MT) on a wet basis of digestate material that is disposed of at a landfill (aggregated for the reporting period)
6.2 Biogas Control System Monitoring Project developers are responsible for monitoring the performance of the project and operating each component of the biogas collection and destruction system (BCS) in a manner consistent with the manufacturer’s recommendations. The methane capture and control system must be monitored with measurement equipment that directly meters:
The total flow of biogas, measured continuously and recorded every 15 minutes or totalized and recorded at least daily, adjusted for temperature and pressure, prior to delivery to the destruction device(s)
The flow of biogas delivered to each destruction device, measured continuously and recorded every 15 minutes or totalized and recorded at least daily, adjusted for temperature and pressure
40

Organic Waste Digestion Project Protocol Version 1.0, October 2009
The fraction of methane in the biogas, measured with a continuous analyzer or, alternatively, with quarterly measurements
Flow data must be corrected for temperature and pressure at 60oF and 1 atm, either internally or by using Equation 5.11. Figure 6.1 represents the suggested arrangement of the biogas flow meters and methane concentration metering equipment.
Figure 6.1. Suggested arrangement of biogas metering equipment. Note: The number of flow meters must be sufficient to track the total flow as well as the flow to each combustion device. The above example includes one more flow meter than would be necessary to achieve this objective Operational activity of the destruction devices shall be monitored and documented at least hourly to ensure actual methane destruction. GHG reductions will not be accounted for or credited during periods in which the destruction device is not operational. If for any reason the destruction device or the operational monitoring equipment (for example, the thermal coupler on the flare) is inoperable, then all metered biogas going to the particular device shall be assumed to be released to atmosphere during the period of inoperability. During the period of inoperability, the destruction efficiency of the device must be assumed to be zero. In Equation 5.10, the monthly destruction efficiency (BDE) value shall be adjusted accordingly. See below for an example BDE adjustment.
41

Organic Waste Digestion Project Protocol Version 1.0, October 2009
Box 6.1. Example BDE Adjustment As an example, consider a situation where the primary destruction device is an open flare with a BDE of 96%, and it is found to be inoperable for a period of 5 days of a 30 day month. Assume that the total flow of biogas to the flare for the month is 3,000,000 scf, and that the total flow recorded for the 5 day period of inoperability is 500,000 SCF. In this case the monthly BDE would be adjusted as follows: BDE ={(0.96*2,500,000) +(0.0 * 500,000)} / 3,000,000 = 80%.
6.2.1 Biogas Measurement Instrument QA/QC All gas flow meters34 and continuous methane analyzers must be:
Cleaned and inspected on a quarterly basis, with the activities performed and as found/as left condition of the equipment documented
Field checked for calibration accuracy with the percent drift documented, using either a portable instrument (such as a pitot tube) or manufacturer specified guidance, at the end of but no more than two months prior to the end date of the reporting period35
Calibrated by the manufacturer or a certified calibration service per manufacturer’s guidance or every 5 years, whichever is more frequent
If the field check on a piece of equipment reveals accuracy outside of a +/- 5% threshold, calibration by the manufacturer or a certified service provider is required for that piece of equipment. For the interval between the last successful field check and any calibration event confirming accuracy below the +/- 5% threshold, all data from that meter or analyzer must be scaled according to the following procedure. These adjustments must be made for the entire period from the last successful field check until such time as the meter is properly calibrated.
1. For calibrations that indicate under-reporting (lower flow rates, or lower methane concentration), the metered values must be used without correction.
2. For calibrations that indicate over-reporting (higher flow rates, or higher methane concentration), the metered values must be adjusted based on the greatest calibration drift recorded at the time of calibration.
For example, if a project conducts field checks quarterly during a year-long reporting period, then only three months of data will be subject at any one time to the penalties above. However, if the project developer feels confident that the meter does not require field checks or calibration on a greater than annual basis, then failed events will accordingly require the penalty to be applied to the entire year’s data. Further, frequent calibration may minimize the total accrued drift (by zeroing out any error identified), and result in smaller overall deductions. In order to provide flexibility in verification, data monitored up to two months after a field check may be verified. As such, the end date of the reporting period must be no more than two months after the latest successful field check. 34 Field checks and calibrations of flow meters shall assess the volumetric output of the flow meter. 35 Instead of performing field checks, the project developer may instead have equipment calibrated by the manufacturer or a certified calibration service per manufacturer’s guidance, at the end of but no more than two months prior to the end date of the reporting period to meet this requirement.
42

Organic Waste Digestion Project Protocol Version 1.0, October 2009
If a portable calibration instrument is used (such as a pitot tube), the portable instrument shall be calibrated at least annually by the manufacturer or at an ISO 17025 accredited laboratory.
6.2.2 Missing Data In situations where the flow rate or methane concentration monitoring equipment is missing data, the project developer shall apply the data substitution methodology provided in Appendix D. If for any reason the destruction device monitoring equipment is inoperable (for example, the thermal coupler on the flare), then no emission reductions can be credited for the period of inoperability.
6.3 Monitoring Parameters Prescribed monitoring parameters necessary to calculate baseline and project emissions are provided in Table 6.1. Refer to the monitoring section of the Livestock Project Protocol for the prescribed monitoring parameters necessary for livestock manure baseline and project calculations. Table 6.1. Organic waste digestion project monitoring parameters.
Parameter Description Data unit
calculated (c) measured (m) reference(r) operating
records (o)
Measurement frequency Comment
General Project Parameters
Regulations
Project developer attestation of
compliance with regulatory
requirements relating to the digester project
Environmental regulations n/a Each verification
cycle
Information used to: 1) To demonstrate ability to meet the Legal Requirement Test – where regulation would require the installation of a biogas control system. 2) To demonstrate compliance with associated environmental rules, e.g. criteria pollutant and effluent discharge limits.
Baseline Calculation Parameters for Food Waste Streams
Origin of the Food Waste
The jurisdiction where the food waste
originates
Jurisdiction (municipality or
county) n/a
For each truckload of
waste
This information is necessary to track eligible food waste streams and ineligible food waste streams that are digested in the project’s BCS, as well as to determine appropriate decay rates (k values) to use in the calculation.
43

Organic Waste Digestion Project Protocol Version 1.0, October 2009
Parameter Description
calculated (c) measured (m) Measurement Data unit reference(r) Comment frequency operating
records (o)
WFW,S,y
The weight of eligible food waste streams
digested in the project’s BCS during the reporting period
MT of Waste m
Measured for each truckload of
waste, aggregated for
each waste stream over the reporting period
Must be measured for each truckload of solid waste, and aggregated over the reporting period.
TDOCS
The total degradable organic content of the waste, by waste type
MTCarbon / MTWaste r
Each reporting period for each waste stream
Must be applied to each waste stream over the reporting period. Reference from Table B.1 in Appendix B by waste type.
LCEs,x
The Landfill gas collection efficiency parameter for the
baseline FOD calculation
percent r Annually for each waste stream
Equal to 0.0 for the first three years of calculated emissions according to the FOD model, and equal to 0.75 (75%) for the remaining seven years of the calculated emissions.
WRFS,y
The rejected feedstock re-directed
to a landfill
Metric tones of waste M
Measured for each truckload of
rejected feedstock and
aggregated over the reporting
period
The material that, after being weighed upon entering the facility, is rejected and re-directed back to a landfill or other system must be quantified and subtracted from the total weight of waste digested in the project BCS during the reporting period.
kS
Decay rate of the waste, by waste type
yr-1 r N/A
Referenced from Table B.2 in Appendix B. Figure B.2 is used to determine the county-specific climate. The appropriate k value shall be chosen based on the k value applicable to the county where the waste originated.
Baseline Calculation Parameters for Agro-Industrial Wastewater Streams
Bo,WW,S
The methane producing capacity of
the wastewater stream ‘S’ .
MTCH4/MTCOD m,r Annually
A site specific value may be used, alternatively a value of 0.21 shall be used.36 See guidance in Section 6.1.2.2
36 Per CDM ACM0014 V.2.1, available at http://cdm.unfccc.int/methodologies/PAmethodologies/approved.html.
44
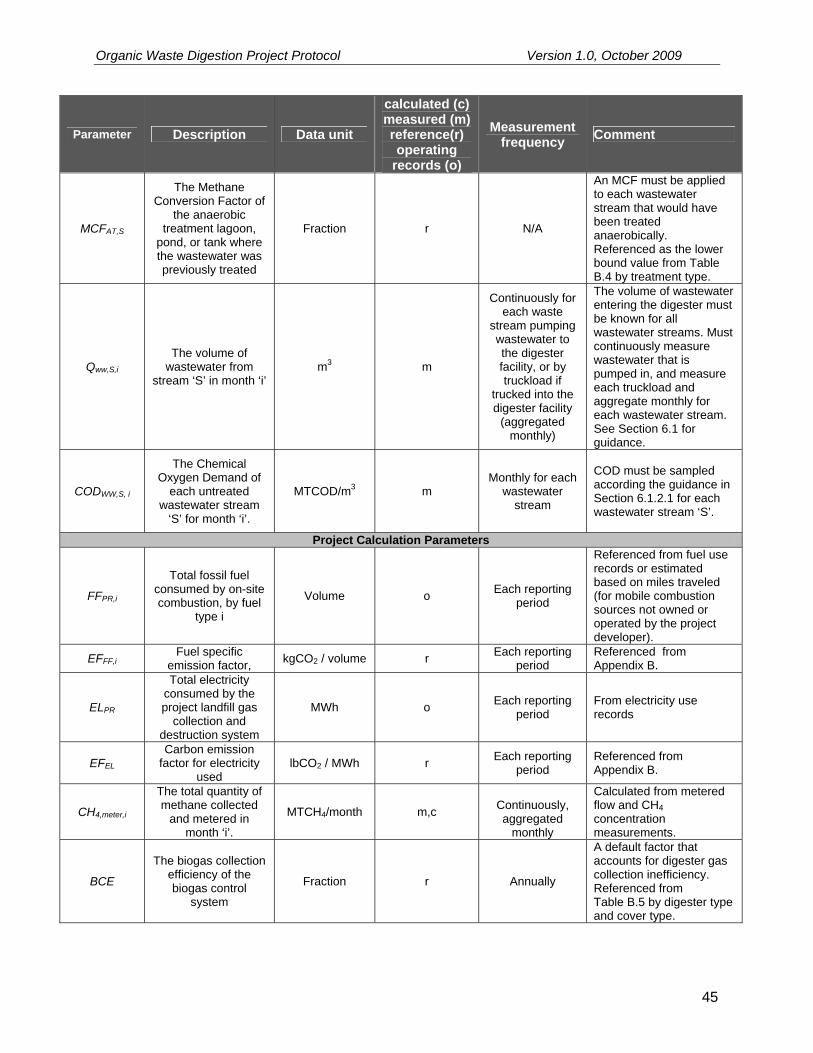
Organic Waste Digestion Project Protocol Version 1.0, October 2009
Parameter Description
calculated (c) measured (m) Measurement Data unit reference(r) Comment frequency operating
records (o)
MCFAT,S
The Methane Conversion Factor of
the anaerobic treatment lagoon,
pond, or tank where the wastewater was previously treated
Fraction r N/A
An MCF must be applied to each wastewater stream that would have been treated anaerobically. Referenced as the lower bound value from Table B.4 by treatment type.
Qww,S,i The volume of
wastewater from stream ‘S’ in month ‘i’
m3 m
Continuously for each waste
stream pumping wastewater to the digester facility, or by truckload if
trucked into the digester facility
(aggregated monthly)
The volume of wastewater entering the digester must be known for all wastewater streams. Must continuously measure wastewater that is pumped in, and measure each truckload and aggregate monthly for each wastewater stream. See Section 6.1 for guidance.
CODWW,S, i
The Chemical Oxygen Demand of
each untreated wastewater stream
‘S’ for month ‘i’.
MTCOD/m3 m Monthly for each
wastewater stream
COD must be sampled according the guidance in Section 6.1.2.1 for each wastewater stream ‘S’.
Project Calculation Parameters
FFPR,i
Total fossil fuel consumed by on-site combustion, by fuel
type i
Volume o Each reporting period
Referenced from fuel use records or estimated based on miles traveled (for mobile combustion sources not owned or operated by the project developer).
EFFF,i Fuel specific
emission factor, kgCO2 / volume r Each reporting period
Referenced from Appendix B.
ELPR
Total electricity consumed by the project landfill gas
collection and destruction system
MWh o Each reporting period
From electricity use records
EFEL Carbon emission
factor for electricity used
lbCO2 / MWh r Each reporting period
Referenced from Appendix B.
CH4,meter,i
The total quantity of methane collected
and metered in month ‘i’.
MTCH4/month m,c
Continuously, aggregated
monthly
Calculated from metered flow and CH4 concentration measurements.
BCE
The biogas collection efficiency of the biogas control
system
Fraction r Annually
A default factor that accounts for digester gas collection inefficiency. Referenced from Table B.5 by digester type and cover type.
45

Organic Waste Digestion Project Protocol Version 1.0, October 2009
Parameter Description
calculated (c) measured (m) Measurement Data unit reference(r) Comment frequency operating
records (o)
BDE
The monthly methane destruction
efficiency of the combustion device(s).
Fraction r,c Monthly
In the event that there is more than one destruction device in operation in any given month, the weighted average destruction efficiency from all combustion devices is to be used (see Equation 5.10).
Fi
The total monthly measured volumetric flow of biogas to all destruction devices
scf/month m Continuously, aggregated
monthly
See Equation 5.11 for additional guidance on adjusting the biogas flow for temperature and pressure.
Fi,DD The monthly flow of
biogas to a particular destruction device
scf/month m Continuously, aggregated
monthly
The flow of biogas to each combustion device must be known.
CH4,conc,i
The monthly measured methane concentration of the
biogas.
Fraction m Quarterly or Continuously
If methane concentration is continuously measured, the value is equal to the monthly average. If quarterly measurements are used, the value is equal to the most recent methane concentration measurement.
BDEi,weighted
The monthly weighted average of
all destruction devices used in
month ‘i’.
Fraction c Monthly
The weighted average for all destruction devices used to destroy biogas for a given month.
BDEDD
The default methane destruction efficiency
of a particular destruction device.
Fraction r Monthly
The default destruction efficiency for each type of destruction device. Referenced from Appendix B.
Funadjusted
Unadjusted volume of biogas collected for the given time
interval
ft3 / unit time m Continuously
Measured if gas flow meters do not internally correct for the temperature and pressure of the biogas. See Equation 5.11
T
Measured temperature of the
biogas for the given time period
°R (°R = °F + 459.67) m Continuously
Measured to adjust the flow of biogas. No separate monitoring of temperature is necessary when using flow meters that automatically adjust flow volumes for temperature and pressure, expressing biogas volumes in normalized cubic feet. See Equation 5.11.
46

Organic Waste Digestion Project Protocol Version 1.0, October 2009
Parameter Description
calculated (c) measured (m) Measurement Data unit reference(r) Comment frequency operating
records (o)
P Measured pressure of the biogas for the
given time period Atm m Continuously
Measured to adjust the flow of biogas. No separate monitoring of pressure is necessary when using flow meters that automatically measure adjust flow volumes for temperature and pressure, expressing biogas volumes in normalized cubic feet. See Equation 5.11.
MSBCS The maximum biogas storage of the BCS
system scf r Annually
Obtained from digester system design plans. Necessary to quantify the release of methane to the atmosphere due to an uncontrolled venting event.
Fpw
The average flow of biogas from the
digester for the entire week prior to the
uncontrolled venting event
scf/day m Weekly
The average flow of biogas can be determined from the daily records from the previous week.
t The number of days of the month that biogas is venting
uncontrolled from the project’s BCS.
Days
m,o Monthly
The approximate number of days that the BCS vented biogas to the atmosphere, down to the nearest 4 hours, as determined from metering evidence, personnel accounts, and energy production records.
Bo,EF The methane
producing capacity of the effluent.
MTCH4 / MTCOD r N/A A value of 0.21 must be
used for all effluent.
MCFEF
The Methane Conversion Factor of the effluent storage
pond.
Fraction r N/A
The Methane Conversion Factor of the effluent storage lagoon or the treatment system where digester effluent is stored/treated. Equal to 0.3.
QEF,i
The volume of effluent discharged
into the effluent storage pond in
month ‘i’
m3 m
Continuously, aggregated
monthly
The volume of effluent exiting the digester before entering the effluent storage pond or the wastewater treatment system. See Section 6.1.3 for guidance.
CODEF,i
The chemical oxygen demand of the
effluent discharged into the storage pond
in month ‘i’
MTCOD/m3 m Quarterly
COD of the digester effluent must be sampled quarterly; refer to the guidance provided in Section 6.1.2.1.
47

Organic Waste Digestion Project Protocol Version 1.0, October 2009
48
Parameter Description Data unit
calculated (c) measured (m) reference(r) operating
records (o)
Measurement frequency Comment
WDAT,y
The total annual wet weight of digestate treated aerobically on-site, or sent off-
site for aerobic treatment
MT/ yr m,r
Measured by truckload and aggregated
annually (if using site-specific
value)
From weigh station records or default value.
EF,AT,S
The combined N2O and CH4 emission
factor for the appropriate aerobic
treatment tier
MTCO2e / MT of Digestate r Each reporting
period
Referenced from Table 5.1 for appropriate aerobic treatment category.
WDLF,y
The total weight of the digestate material
disposed of at a landfill
MT/year m
Measured by truckload and aggregated for the reporting
period
From weigh station records or default value.
CH4,destroyed
The aggregated
quantity of methane collected and
destroyed during the reporting period
MTCH4 m,c Monthly
Measured in order to compare to modeled reductions (see Section 5.3).
EFCO2,f Fuel-specific
emission factor kgCO2/MMBTU or kgCO2/gallon r Each reporting
period Referenced from Appendix B.
QFc Quantity of fuel used
for stationary combustion sources
MMBTU Or
Gallon o,c Each reporting
period
Fuel used by project for stationary combustion sources including supplemental fossil fuels used in combustion device.

Organic Waste Digestion Project Protocol Version 1.0, October 2009
7 Reporting Parameters This section provides requirements and guidance on reporting rules and procedures. A priority of the Reserve is to facilitate consistent and transparent information disclosure among project developers. Project developers must submit verified emission reduction reports to the Reserve annually at a minimum.
7.1 Project Submittal Documentation Project developers must provide the following documentation to the Reserve in order to register an OWD project:
Completed project submittal form Signed Attestation of Title document Complete project Verification Report Positive Verification Opinion document Signed Regulatory Attestation form
Project developers must provide the following documentation each reporting period in order for the Reserve to issue CRTs for quantified GHG reductions:
Verification Report Verification Opinion document Signed Regulatory Attestation form
At a minimum, the above project documentation will be available to the public via the Reserve’s online registry. Further disclosure and other documentation may be made available on a voluntary basis through the Reserve. Project submittal forms can be found at http://www.climateactionreserve.org/how/projects/register/project-submittal-forms/.
7.2 Record Keeping For purposes of independent verification and historical documentation, project developers are required to keep all information outlined in this protocol for a period of 10 years after the information is generated or 7 years after the last verification. This information will not be publicly available, but may be requested by the verifier or the Reserve. System information the project developer should retain includes:
All data inputs for the calculation of GHG reductions, including all required sampled data Copies of all solid waste, air, water, and land use permits relevant to project activities;
Notices of Violations (NOVs) relevant to project activities; and any administrative or legal consent orders relevant to project activities dating back at least 3 years prior to the project start date, and for each subsequent year of project operation
Project developer attestation of compliance with regulatory requirements relating to the OWD project
Biogas flow meter information (model number, serial number, manufacturer’s calibration procedures)
Methane monitor information (model number, serial number, calibration procedures)
49

Organic Waste Digestion Project Protocol Version 1.0, October 2009
50
Destruction device monitor information (model number, serial number, calibration procedures)
Cleaning and inspection records for all biogas meters Field check results for all biogas meters Calibration results for all meters Destruction device monitoring data for each destruction device Biogas flow and methane concentration data Food waste weigh station information Food waste weight data Wastewater and digester effluent flow meter information (model number, serial number,
manufacturer’s calibration procedures) Wastewater and digester effluent flow data Results of CO2e annual reduction calculations Initial and annual verification records and results All maintenance records relevant to the biogas control system, monitoring equipment,
and destruction devices Calibrated portable gas analyzer information that the project developer should retain includes:
Date, time, and location of methane measurement Methane content of biogas (% by volume) for each measurement Methane measurement instrument type and serial number Date, time, and results of instrument calibration Corrective measures taken if instrument does not meet performance specifications
7.3 Reporting Period & Verification Cycle Project developers must report GHG reductions resulting from project activities during each reporting period. Although projects must be verified annually at a minimum, the Reserve will accept verified emission reduction reports on a sub-annual basis, should the project developer choose to have a sub-annual reporting period and verification schedule (e.g. monthly, quarterly, or semi-annually). A reporting period cannot exceed 12 months, and no more than 12 months of emission reductions can be verified at once, except during a project’s first verification, which may include historical emission reductions from prior years.

Organic Waste Digestion Project Protocol Version 1.0, October 2009
8 Verification Guidance This section provides verification bodies with guidance on verifying GHG emission reductions associated with the diversion of organic waste and/or wastewater away from anaerobic treatment and disposal systems and to a biogas control system (BCS). This verification guidance supplements the Reserve’s Verification Program Manual and describes verification activities specifically related to OWD projects. Verification bodies trained to verify organic waste diversion projects must be familiar with the following documents:
Climate Action Reserve Program Manual Climate Action Reserve Verification Program Manual Climate Action Reserve Livestock Project Protocol Climate Action Reserve Organic Waste Digestion Project Protocol
The Reserve’s Program Manual, Verification Program Manual, and project protocols are designed to be compatible with each other and are available on the Reserve’s website at http://www.climateactionreserve.org. Only ISO-accredited verification bodies trained by the Reserve for this project type are eligible to verify OWD project reports. However, verification bodies must also complete the Livestock Project Protocol verification training in order to perform verifications of OWD projects. Verification bodies approved under other project protocol types are not permitted to verify OWD projects. Information about verification body accreditation and Reserve project verification training can be found on the Reserve website at http://www.climateactionreserve.org.
8.1 Standard of Verification The Reserve’s standard of verification for OWD projects is the OWD Project Protocol (this document), the Livestock Project Protocol (for manure co-digestion projects), the Reserve Program Manual, and the Verification Program Manual. To verify an OWD project report, verification bodies apply the guidance in the Verification Program Manual and this section of the protocol to the standards described in Sections 2 through 7 of this protocol. Sections 2 through 7 provide eligibility rules, methods to calculate emission reductions, performance monitoring instructions and requirements, and procedures for reporting project information to the Reserve.
8.2 Monitoring Plan The Monitoring Plan serves as the basis for verification bodies to confirm that the monitoring and reporting requirements in Section 6 and Section 7 have been met, and that consistent, rigorous monitoring and record-keeping is ongoing at the project site. Verification bodies shall confirm that the Monitoring Plan covers all aspects of monitoring and reporting contained in this protocol and specifies how data for all relevant parameters in Table 6.1 are collected and recorded.
8.3 Verifying Project Eligibility Verification bodies must affirm an OWD project’s eligibility according to the rules described in this protocol. The table below outlines the eligibility criteria for OWD projects. This table does not present all criteria for determining eligibility comprehensively; verification bodies must also look to Section 3 and the verification items list in Table 8.2.
51

Organic Waste Digestion Project Protocol Version 1.0, October 2009
Table 8.1. Summary of eligibility criteria for an organic waste digestion project.
ELIGIBILITY Rule Eligibility Criteria Frequency of Rule Application
Start Date For 12 months following the Effective Date of this protocol, a pre-existing project with a start date on or after October 7, 2007 may be submitted for listing; after this 12 month period, projects must be submitted for listing within 6 months of the project start date
Once during first verification
Location United States and its territories, and U.S. tribal areas Once during first verification
Performance Standard
One of the following eligible waste streams must be consistently, periodically, or seasonally digested in the project’s biogas control system:
Municipal Solid Waste (MSW) Food Waste: Food waste commonly disposed into a MSW system, consisting of uneaten food, food scraps, spoiled food and food preparation wastes
Agro-Industrial Wastewater: Organic loaded wastewater from industrial or agricultural processing operations that, pre-project, was treated in an uncontrolled anaerobic lagoon, pond, or tank at a privately owned treatment facility
Once during first verification
Legal Requirement Test
Signed Regulatory Attestation form and monitoring procedures for ascertaining and demonstrating that the project passes the Legal Requirement Test
Every verification
Regulatory Compliance Test
Must be in material compliance with all applicable laws Every verification
Exclusions Grid electricity and fossil fuel displacement, wastewaters produced at breweries, ethanol plants, pharmaceutical production facilities, and pulp and paper plants
Every verification
8.4 Core Verification Activities The Organic Waste Digestion Project Protocol provides explicit requirements and guidance for quantifying the GHG reductions associated with the diversion of organic waste and/or wastewater away from anaerobic treatment and disposal systems and to a BCS. The Verification Program Manual describes the core verification activities that shall be performed by verification bodies for all project verifications. They are summarized below in the context of an OWD project, but verification bodies must also follow the general guidance in the Verification Program Manual. Verification is a risk assessment and data sampling effort designed to ensure that the risk of reporting error is assessed and addressed through appropriate sampling, testing, and review. The three core verification activities are:
1. Identifying emissions sources, sinks, and reservoirs (SSRs) 2. Reviewing GHG management systems and estimation methodologies 3. Verifying emission reduction estimates
52

Organic Waste Digestion Project Protocol Version 1.0, October 2009
53
Identifying emission sources, sinks, and reservoirs The verification body reviews for completeness the sources, sinks, and reservoirs identified for a project, such as, inter alia, food waste disposal at landfills, anaerobic wastewater treatment, and/or manure treatment at livestock operations (if co-digesting manure with waste streams).
Reviewing GHG management systems and estimation methodologies The verification body reviews and assesses the appropriateness of the methodologies and management systems that the OWD project operator uses to gather data and calculate baseline and project emissions.
Verifying emission reduction estimates The verification body further investigates areas that have the greatest potential for material misstatements and then confirms whether or not material misstatements have occurred. This involves site visits to the project to ensure the systems on the ground correspond to and are consistent with data provided to the verification body. In addition, the verification body recalculates a representative sample of the performance or emissions data for comparison with data reported by the project developer in order to double-check the calculations of GHG emission reductions.
8.5 OWD Verification Items The following tables provide lists of items that a verification body needs to address while verifying an OWD project. The tables include references to the section in the protocol where requirements are further specified. The table also identifies items for which a verification body is expected to apply professional judgment during the verification process. Verification bodies are expected to use their professional judgment to confirm that protocol requirements have been met in instances where the protocol does not provide (sufficiently) prescriptive guidance. For more information on the Reserve’s verification process and professional judgment, please see the Verification Program Manual. Note: These tables shall not be viewed as a comprehensive list or plan for verification activities, but rather guidance on areas specific to OWD projects that must be addressed during verification.
8.5.1 Project Eligibility and CRT Issuance Table 8.2 lists the criteria for reasonable assurance with respect to eligibility and CRT issuance for OWD projects. These requirements determine if a project is eligible to register with the Reserve and/or have CRTs issued for the reporting period. If any one requirement is not met, either the project may be determined ineligible or the GHG reductions from the reporting period (or sub-set of the reporting period) may be ineligible for issuance of CRTs, as specified in Sections 2,3 and 6.

Organic Waste Digestion Project Protocol Version 1.0, October 2009
Table 8.2. Eligibility verification items.
Protocol Section Eligibility Qualification Item
Apply Professional Judgment?
2.1 Verify that the project meets the definition of an OWD project No 2.2 Verify ownership of the reductions by reviewing Attestation of Title No 3.2 Verify eligibility of project start date No 3.2 Verify accuracy of project start date based on operational records Yes 3.3 Verify that project is within its 10 year crediting period No 3.4 Verify that all pre-project wastewater and/or manure treatment
lagoons/ponds/tanks were of sufficient depth to ensure an oxygen free bottom layer (> 1m)
No
3.4 If the project is a Greenfield project at a new facility, verify that uncontrolled anaerobic treatment is common practice for the industry in the geographic region where the project is located
Yes
3.5.1 Verify that the project meets the performance standard test No 3.5.1 If co-digesting manure with eligible organic waste, verify that all livestock
operations contributing manure to the digestion project meet eligibility requirements per the most recent Livestock Project Protocol(as of the time of project listing)
No
3.5.2 Confirm execution of the Regulatory Attestation form to demonstrate eligibility under the Legal Requirement Test No
3.5.2 Verify that the project Monitoring Plan contains a mechanism for ascertaining and demonstrating that the project passes the Legal Requirement Test at all times
No
3.5.2.3 Verify that the food waste stream is eligible per Section 3.5.2.3 if the project is digesting food waste originating from a jurisdiction that has a mandatory food waste diversion ordinance or regulation
Yes
3.6
Verify that the project activities comply with applicable laws by reviewing any instances of non-compliance provided by the project developer and performing a risk-based assessment to confirm the statements made by the project developer in the Regulatory Attestation form
Yes
6 Verify that monitoring meets the requirements of the protocol. If it does not, verify that variance has been approved for monitoring variations
No
6 Verify that all gas flow meters and continuous methane analyzers adhered to the inspection, cleaning, and calibration schedule specified in the protocol. If they do not, verify that variance has been approved for monitoring variations or that adjustments have been made to data per the protocol requirements
No
6 Verify that adjustments for failed calibrations were properly applied No 6,
Appendix D If used, verify that data substitution methodology was properly applied No
8.5.2 Quantification Table 8.3 lists the items that verification bodies shall include in their risk assessment and re-calculation of the project’s GHG emission reductions. These quantification items inform any determination as to whether there are material and/or immaterial misstatements in the project’s GHG emission reduction calculations. If there are material misstatements, the calculations must be revised before CRTs are issued.
54
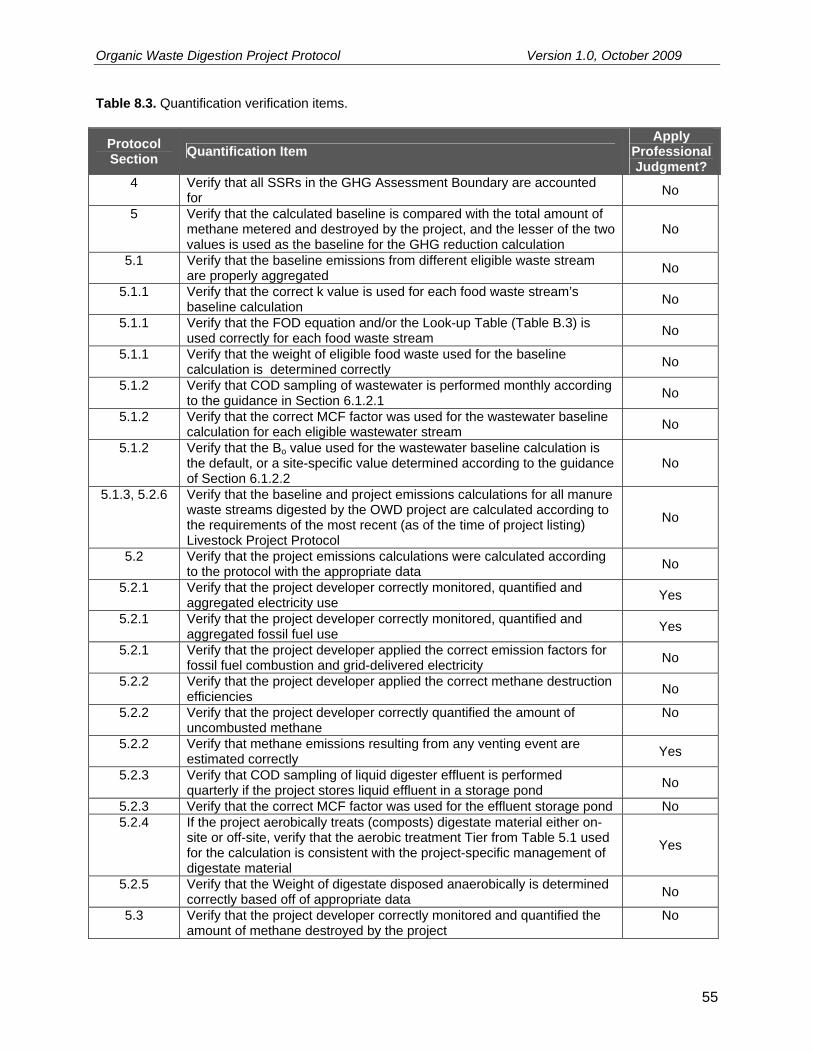
Organic Waste Digestion Project Protocol Version 1.0, October 2009
Table 8.3. Quantification verification items.
Protocol Section Quantification Item
Apply Professional Judgment?
4 Verify that all SSRs in the GHG Assessment Boundary are accounted for No
5 Verify that the calculated baseline is compared with the total amount of methane metered and destroyed by the project, and the lesser of the two values is used as the baseline for the GHG reduction calculation
No
5.1 Verify that the baseline emissions from different eligible waste stream are properly aggregated No
5.1.1 Verify that the correct k value is used for each food waste stream’s baseline calculation No
5.1.1 Verify that the FOD equation and/or the Look-up Table (Table B.3) is used correctly for each food waste stream No
5.1.1 Verify that the weight of eligible food waste used for the baseline calculation is determined correctly No
5.1.2 Verify that COD sampling of wastewater is performed monthly according to the guidance in Section 6.1.2.1
No
5.1.2 Verify that the correct MCF factor was used for the wastewater baseline calculation for each eligible wastewater stream No
5.1.2 Verify that the Bo value used for the wastewater baseline calculation is the default, or a site-specific value determined according to the guidance of Section 6.1.2.2
No
5.1.3, 5.2.6 Verify that the baseline and project emissions calculations for all manure waste streams digested by the OWD project are calculated according to the requirements of the most recent (as of the time of project listing) Livestock Project Protocol
No
5.2 Verify that the project emissions calculations were calculated according to the protocol with the appropriate data No
5.2.1 Verify that the project developer correctly monitored, quantified and aggregated electricity use Yes
5.2.1 Verify that the project developer correctly monitored, quantified and aggregated fossil fuel use Yes
5.2.1 Verify that the project developer applied the correct emission factors for fossil fuel combustion and grid-delivered electricity No
5.2.2 Verify that the project developer applied the correct methane destruction efficiencies No
5.2.2 Verify that the project developer correctly quantified the amount of uncombusted methane
No
5.2.2 Verify that methane emissions resulting from any venting event are estimated correctly Yes
5.2.3 Verify that COD sampling of liquid digester effluent is performed quarterly if the project stores liquid effluent in a storage pond No
5.2.3 Verify that the correct MCF factor was used for the effluent storage pond No 5.2.4 If the project aerobically treats (composts) digestate material either on-
site or off-site, verify that the aerobic treatment Tier from Table 5.1 used for the calculation is consistent with the project-specific management of digestate material
Yes
5.2.5 Verify that the Weight of digestate disposed anaerobically is determined correctly based off of appropriate data No
5.3 Verify that the project developer correctly monitored and quantified the amount of methane destroyed by the project
No
55

Organic Waste Digestion Project Protocol Version 1.0, October 2009
8.5.3 Risk Assessment Verification bodies will review the following items in Table 8.4 to guide and prioritize their assessment of data used in determining eligibility and quantifying GHG emission reductions. Table 8.4. Risk assessment verification items. Protocol Section Item that Informs Risk Assessment
Apply Professional Judgment?
6 Verify that the project Monitoring Plan is sufficiently rigorous to support the requirements of the protocol and proper operation of the project
Yes
6 Verify that the BCS was operated and maintained according to manufacturer specifications
No
6 Verify that appropriate monitoring equipment is in place to meet the requirements of the protocol
No
6 Verify that the individual or team responsible for managing and reporting project activities are qualified to perform this function
Yes
6 Verify that appropriate training was provided to personnel assigned to greenhouse gas reporting duties
Yes
6 Verify that all contractors are qualified for managing and reporting greenhouse gas emissions if relied upon by the project developer. Verify that there is internal oversight to assure the quality of the contractor’s work
Yes
6.1.2.1 Verify that the COD sampling and analysis was done by professionals experienced with the procedures used to determine COD as described in the Standard Method approach
Yes
6.1.2.2 Verify that all samples used to determine a site specific Bo factor are analyzed at a laboratory that is experienced with the Biochemical Methane Potential (BMP) Assay procedure used to determine the maximum methane potential value of wastewaters
Yes
7.2 Verify that all required records have been retained by the project developer No
8.6 Completing Verification The Verification Program Manual provides detailed information and instructions for verification bodies to finalize the verification process. It describes completing a Verification Report, preparing a Verification Opinion, submitting the necessary documents to the Reserve, and notifying the Reserve of the project’s verified status.
56

Organic Waste Digestion Project Protocol Version 1.0, October 2009
9 Glossary of Terms Accredited verifier A verification firm approved by the California Registry to provide
verification services for project developers.
Additionality Landfill management practices that are above and beyond business-as-usual operation, exceed the baseline characterization, and are not mandated by regulation.
Agro-industrial wastewater
Organic loaded wastewater from industrial or agricultural processing operations that, pre-project, was treated in an uncontrolled anaerobic lagoon, pond, or tank at a privately owned treatment facility. Excluded from eligibility based on the Reserve’s performance standard analysis are wastewaters produced at breweries, ethanol plants, pharmaceutical production facilities, and pulp and paper plants.
Anaerobic Pertaining to or caused by the absence of oxygen.
Anthropogenic emissions GHG emissions resultant from human activity that are considered to be an unnatural component of the Carbon Cycle (i.e. fossil fuel destruction, de-forestation, etc.).
Biogas Gas generated as a result of decomposition of organic materials under anaerobic conditions. Generally consists primarily of methane and carbon dioxide, with other trace gases.
Biogas Control System A waste management system consisting of an anaerobic digester, biogas collection and metering equipment, and biogas destruction device(s).
Biogenic CO2 emissions CO2 emissions resulting from the destruction and/or aerobic decomposition of organic matter. Biogenic emissions are considered to be a natural part of the Carbon Cycle, as opposed to anthropogenic emissions.
Carbon dioxide (CO2) The most common of the six primary greenhouse gases, consisting of a single carbon atom and two oxygen atoms.
CO2 equivalent (CO2e) The quantity of a given GHG multiplied by its total global warming potential. This is the standard unit for comparing the degree of warming which can be caused by different GHGs.
Chemical Oxygen Demand (COD)
The chemical oxygen demand (COD) is the amount of oxygen consumed to completely chemically oxidize the organic water constituents to inorganic end products. COD is an important, rapidly measured variable for the approximate determination of the organic matter content of water samples.
Digester effluent The largely decomposed residue material that has passed through the anaerobic digester system.
Digestate The solid residue material separated from the liquid digester effluent stream.
57

Organic Waste Digestion Project Protocol Version 1.0, October 2009
Direct emissions Greenhouse gas emissions from sources that are owned or controlled by the reporting entity.
Effective Date The date of adoption of this protocol by the Reserve board: October 7, 2009.
Emission factor (EF) A unique value for determining an amount of a greenhouse gas emitted for a given quantity of activity data (e.g. metric tons of carbon dioxide emitted per barrel of fossil fuel burned).
First Order Decay (FOD) model A calculation developed to model the decay of waste under anaerobic conditions, based off of first-order kinetic equations.
Flare A destruction device that uses an open flame to burn combustible gases with combustion air provided by uncontrolled ambient air around the flame.
Fossil fuel A fuel, such as coal, oil, and natural gas, produced by the decomposition of ancient (fossilized) plants and animals.
Greenfield project A project implemented at new industrial facilities that have no prior wastewater treatment system
Greenhouse gas (GHG) Carbon dioxide (CO2), methane (CH4), nitrous oxide (N2O), sulfur hexafluoride (SF6), hydrofluorocarbons (HFCs), or perfluorocarbons (PFCs).
GHG reservoir A physical unit or component of the biosphere, geosphere, or hydrosphere with the capability to store or accumulate a GHG that has been removed from the atmosphere by a GHG sink or a GHG captured from a GHG source.
GHG sink A physical unit or process that removes GHG from the atmosphere.
GHG source A physical unit or process that releases GHG into the atmosphere.
Global Warming Potential (GWP) The ratio of radiative forcing (degree of warming to the atmosphere) that would result from the emission of one unit of a given GHG compared to one unit of CO2.
Indirect emissions Reductions in GHG emissions that occur at a location other than where the reduction activity is implemented, and/or at sources not owned or controlled by project participants.
Landfill A defined area of land or excavation that receives or has previously received waste that may include household waste, commercial solid waste, non-hazardous sludge and industrial solid waste.
Landfill gas (LFG) Gas resulting from the decomposition of wastes placed in a landfill. Typically, landfill gas contains methane, carbon dioxide and other trace organic and inert gases.
58

Organic Waste Digestion Project Protocol Version 1.0, October 2009
Metric ton (MT) or “tonne” A common international measurement for the quantity of GHG emissions, equivalent to about 2204.6 pounds or 1.1 short tons.
Methane (CH4) A potent GHG with a GWP of 21, consisting of a single carbon atom and four hydrogen atoms.
MMBtu One million British thermal units.
Mobile combustion Emissions from the transportation of materials, products, waste, and employees resulting from the combustion of fuels in company owned or controlled mobile combustion sources (e.g. cars, trucks, tractors, dozers, etc.).
Mixed MSW Non-source separated waste consisting of organic and inorganic components, reflecting waste typically disposed of at a landfill.
MSW food waste Non-industrial food waste commonly disposed into a MSW system, consisting of uneaten food, spoiled food and food preparation wastes from homes, restaurants, kitchens, grocery stores, campuses, cafeterias, and similar institutions.
National Emission Standards for Hazardous Air Pollutants (NESHAP)
Federal emission control standards codified in 40 CFR 63. Subpart AAAA of Part 63 prescribes emission limitations for MSW landfills.
New Source Performance Standards (NSPS)
Federal emission control standards codified in 40 CFR 60. Subpart WWW of Part 60 prescribes emission limitations for MSW landfills.
Project baseline A business as usual GHG emission assessment against which GHG emission reductions from a specific GHG reduction activity are measured.
Project developer An entity that undertakes a GHG project, as identified in the OWD Project Protocol.
Resource Conservation and Recovery Act (RCRA)
Federal legislation under which solid and hazardous waste disposal facilities are regulated.
Stationary combustion source A stationary source of emissions from the production of electricity, heat, or steam, resulting from combustion of fuels in boilers, furnaces, turbines, kilns, and other facility equipment.
Verification The process used to ensure that a given participant’s greenhouse gas emissions or emission reductions have met the minimum quality standard and complied with the Reserve’s procedures and protocols for calculating and reporting GHG emissions and emission reductions.
Verification body A Reserve approved firm that is able to render a verification opinion and provide verification services for operators subject to reporting under this protocol.
59

Organic Waste Digestion Project Protocol Version 1.0, October 2009
Waste stream
For the purpose of this protocol, an eligible waste stream is defined as an eligible waste type per the eligibility requirements in Section 3.5.1 (Post consumer food waste or Agro-industrial wastewater), originating from a specific source. Examples:
MSW food waste from a specific county or municipal jurisdiction
Wastewater from a specific industrial plant
60
Organic Waste Digestion Project Protocol Version 1.0, October 2009
10 References Alberta Environment, Specified Gas Emitters Regulation. Quantification Protocol for the Anaerobic Decomposition of Agricultural Materials, Version 1 (2007). Brown, S., Kruger, C., & Subler, S. (2008). Greenhouse Gas Balance for Composting Operations. Journal of Environmental Quality, Volume 37, Pg 1396-1410. Chicago Climate Exchange, Draft Guidelines for Methane Avoidance Projects (2008). Climate Action Reserve, Landfill Project Protocol V2.0 (2008). Climate Action Reserve, Livestock Project Protocol V2.1 (2008). GE AES Greenhouse Gas Services, LLC. Methodology for Waste Water Treatment Methane Capture and Destruction Projects, Version 1.0 (2007). GE AES Greenhouse Gas Services, LLC. Methodology for Waste Water Treatment Methane Capture and Destruction Projects, Version 1.1 (2008). Hansen, T.L., Sommer, S.G., Gabriel, S., & Christensen, T.H. (2006). Methane Production During Storage of Anaerobically Digested Municipal Organic Waste. Journal of Environmental Quality, Volume 35, Pg 830-836. International Standards Organization (ISO). ISO14064-1 – Specification with guidance at the organization level for quantification and reporting of greenhouse gas emissions and removals (2006). International Standards Organization (ISO). ISO14064-2 – Specification with guidance at the project level for quantification, monitoring and reporting of greenhouse gas emission reductions or removal enhancements (2006). IPCC, 2006. Guidelines for National Greenhouse Gas Inventories. (Volume 4 - Agriculture, Forestry and Other Land Use). Webpage: http://www.ipcc-nggip.iges.or.jp/public/2006gl/index.htm IPCC 2006 Guidelines for National Greenhouse Gas Inventories. (Volume 5 – Waste). Webpage: http://www.ipcc-nggip.iges.or.jp/public/2006gl/index.htm Recycled Organics Unit (2003). Life Cycle Inventory and Life Cycle Assessment for Windrow Composting Systems. Report prepared for NSW Department of Environment and Conservation (Sustainability Programs Division), Published by Recycled Organics Unit, The University of New South Wales, Sydney. Regional Greenhouse Gas Initiative, Draft Model Rule (January 2007).
Smith, A., K. Brown, S. Ogilvie, K. Rushton, and J. Bates. (2001). Waste management options and climate change: Final report to the European Commission, DG Environment. Available at http://ec.europa.eu/environment/waste/studies/climate_change.htm
61

Organic Waste Digestion Project Protocol Version 1.0, October 2009
Spajic, R.; Burns, R.; Moody, L, Kralik, D. (2009). Use of Biochemical Methane Potential (BMP) Assays for Predicting and Enhancing Anaerobic Digester Performance. Available at: http://sa.pfos.hr/sa2009/radovi/pdf/Radovi/r10-009.pdf United Nations Food and Agriculture Organization, Chemical Oxygen Demand Definitions Webpage: http://www.fao.org/gtos/tems/variable_show.jsp?VARIABLE_ID=123 United Nations Framework Convention on Climate Change (UNFCCC), Approved Consolidated Baseline and Monitoring Methodology ACM0014, “Mitigation of greenhouse gas emissions from treatment of industrial wastewater,” Clean Development Mechanism Version 02.1, Sectoral Scopes 13 (2008). United Nations Framework Convention on Climate Change (UNFCCC), Approved Baseline and Monitoring Methodology AM0073, “GHG emission reductions through multi-site manure collection and treatment in a central plant,” Clean Development Mechanism Version 01, Sectoral Scopes 13 and 15 (2008). United Nations Framework Convention on Climate Change (UNFCCC), Approved Baseline and Monitoring Methodology AM0025, “Avoided emissions from organic waste through alternative waste treatment processes,” Clean Development Mechanism Version 11, Sectoral Scopes 01 and 13 (2008). United Nations Framework Convention on Climate Change (UNFCCC), Approved Small-Scale Methodology III.E, “Avoidance of methane production from decay of biomass through controlled combustion, gasification or mechanical/thermal treatment,” Clean Development Mechanism Version 15.1, Sectoral Scopes 13 (2007). United Nations Framework Convention on Climate Change (UNFCCC), Approved Small-Scale Methodology III.F, “Avoidance of methane emissions through controlled biological treatment of biomass,” Clean Development Mechanism Version 06, Sectoral Scopes 13 (2008). United Nations Framework Convention on Climate Change (UNFCCC), Annex 10 Methodological Tool, “Tool to determine methane emissions avoided from dumping waste at a solid waste disposal site,” Clean Development Mechanism Version 04, (2008). U.S. Environmental Protection Agency - Climate Leaders, Greenhouse Gas Inventory Protocol Offset Project Methodology for Project Type: Managing Manure with Biogas Recovery Systems (2008).
U.S. Environmental Protection Agency, Inventory of U.S. Greenhouse Gas Emissions and Sinks: 1990-2006, EPA-430-R-07-002 (April 2007). U.S. Environmental Protection Agency, Solid Waste Management and Greenhouse Gases; A Lifecycle Assessment of Emissions and Sinks, Third Edition (2006). Available at: http://epa.gov/climatechange/wycd/waste/SWMGHGreport.html U.S. Environmental Protection Agency Region 9, Anaerobic Digestion of Food Waste - Funding Opportunity No. EPA-R9-WST-06-004 Final Report. (2008) Available at: http://www.epa.gov/region09/waste/organics/ad/EBMUDFinalReport.pdf
62

Organic Waste Digestion Project Protocol Version 1.0, October 2009
Appendix A Associated Environmental Impacts Organic waste and manure digestion projects have many documented environmental benefits, including air emission reductions, water quality protection, and electricity generation. These benefits are the result of practices and technologies that are well managed, well implemented, and well designed. However, in cases where practices or technologies are poorly or improperly designed, implemented, and/or managed, local air and water quality could be compromised.
With regard to air quality, there are a number of factors that must be considered and addressed to realize the environmental benefits of a biogas project and reduce or avoid potential negative impacts. Uncontrolled emissions from combustion of biogas may contain between 200 to 300 ppm NOX. The anaerobic treatment process creates intermediates such as ammonia, hydrogen sulfide, orthophosphates, and various salts, all of which must be properly controlled or captured. In addition, atmospheric releases at locations off-site where bio-gas is shipped may negate or decrease the benefit of emissions controls on-site. Thus, while devices such as Selective Catalyst Reduction (SCR) units can reduce NOX emissions and proper treatment system operation can control intermediates, improper design or operation may lead to violations of federal, state, and local air quality regulations as well as release of toxic air contaminants.
With regard to water quality, it is critical that project developers and managers ensure digester integrity and fully consider and address post-digestion management of the effluent in order to adequately manage nutrient loading and avoid contamination of local waterways and groundwater resources. Catastrophic digester failures; leakage from pipework and tanks; and lack of containment in waste storage areas are all examples of potential problems. Further, application of improperly treated digestate and/or improper application timing or rates of digestate to agricultural land may lead to increased nitrogen oxide emissions, soil contamination, and/or nutrient leaching, thus negating or reducing benefits of the project overall.
As specified in Section 3.6, Project developers must comply with all local, state, and national air and water quality regulations pertaining to project activity. Projects must be designed and implemented to mitigate potential releases of pollutants such as those described, and project managers must acquire the appropriate local permits prior to installation to prevent violation of the law.
The Reserve agrees that GHG emission reduction projects should not undermine air and water quality efforts and will work with stakeholders to establish initiatives to meet both climate-related and localized environmental objectives.
63

Organic Waste Digestion Project Protocol Version 1.0, October 2009
Appendix B Data Lookup Tables Table B.1. TDOCs and DOCf fractions by waste type.
Waste Type
TDOCs
DOCf Source
Food 0.137 0.840 EPA Sludge * 0.050 0.500 IPCC
Source: U.S. EPA Solid Waste Management and Greenhouse Gases: A Lifecycle Assessment of Emissions and Sinks, Chapter 6, Exhibit 6.2, 6.3, and 6.4. Third Edition (2006). IPCC Guidelines for National Greenhouse Gas Inventories, Chapter 2, Table 2.4, 2.5 and 2.6 (2006). * To be used only for estimating emissions from the anaerobic disposal of digestate material
Table B.2. Decay rate (K value) by waste type and climate.
Temperate Climate (Mean Annual Temperature ≤ 20oC)
Tropical Climate (Mean Annual Temperature > 20oC)
Waste Type DRY (MAP/PET<1)* WET
(MAP/PET>1)*
Dry (MAP < 39
inches)
Wet (MAP < 39 inches)
Food waste 0.06 0.185 0.085 0.40
Source: UNFCCC Clean Development Mechanism: Tool to determine methane emissions avoided from dumping waste at a solid waste disposal site V.2. * MAP/PET corresponds to the ratio between the Mean Annual Precipitation (MAP) and the Potential Evapotranspiration (PET) for a given location. MAP/PET is commonly referred to as the ‘aridity index’. To determine the appropriate decay rate for a particular food waste stream, refer to Figure B.2, and select the appropriate k value based on the county that the food waste is originating from. If needed, the Reserve will provide an excel-based table containing the county specific data upon request.
64

Organic Waste Digestion Project Protocol Version 1.0, October 2009
Table B.3. Emissions from the decay of organic wastes (MTCO2e/MT Waste) – Calculated using
Equation 5.4.
Decay Rate (k Value)
Food Waste Digestate* Temperate, Dry: 0.060 0.308 0.067
Temperate, Wet: 0.185 0.692 0.150 Tropical, Dry: 0.085 0.407 0.088 Tropical, Wet: 0.400 1.004 0.218
*The digestate calculation assumes a TDOC value equivalent to the default IPCC value for sludge Table B.4. Methane Correction Factor (MCF) for wastewater treatment systems.
Type of Wastewater
treatment system
MCF Lower Bound MCF Higher Bound
Anaerobic reactor without methane capture 0.8 1.0
Anaerobic shallow lagoon (depth < 2 m) 0.1* 0.3
Anaerobic deep lagoon (depth > 2m) 0.8 1.0
Source: IPCC Guidelines for National GHG Inventories, Volume 5, Chapter 6 (2006) * A lower bound value of 0.1 is used instead of 0.0, the lower bound in the IPCC guidelines. Table B.5. Biogas Collection Efficiency (BCE) by digester type.
Digester Type Cover Type Biogas Collection
Efficiency (BCE) as a decimal
Covered Anaerobic Lagoon Bank-to-Bank, impermeable 95% Complete mix, plug flow, or fixed film digester
Enclosed vessel 98%
Source: US EPA Climate Leaders, Offset Project Methodology for Managing Manure and Biogas Recovery Systems, 2008. Table IIf.
65

Organic Waste Digestion Project Protocol Version 1.0, October 2009
Table B.6. Biogas Destruction Efficiency default values by destruction device.
Biogas Destruction Device
Biogas Destruction Efficiency (BDE)*
Open Flare 0.96 Enclosed Flare 0.995 Lean-burn Internal Combustion Engine 0.936 Rich-burn Internal Combustion Engine 0.995 Boiler 0.98 Microturbine or large gas turbine 0.995 Upgrade and use of gas as CNG/LNG fuel 0.95 Upgrade and injection into natural gas pipeline 0.98** Source: The Climate Action Reserve Livestock Project Protocol V2.1, Equation 3a. * If available, the official source tested methane destruction efficiency shall be used in place of the default methane destruction efficiency. Otherwise, project developers have the option to use either the default methane destruction efficiencies provided, or the site specific methane destruction efficiencies as provided by a state or local agency accredited source test service provider, for each of the combustion devices used in the project case. ** The Revised 1996 IPCC Guidelines for National Greenhouse Gas Inventories gives a standard value for the fraction of carbon oxidized for gas destroyed of 99.5% (Reference Manual, Table 1.6, page 1.29). It also gives a value for emissions from processing, transmission and distribution of gas which would be a very conservative estimate for losses in the pipeline and for leakage at the end user (Reference Manual, Table 1.58, page 1.121). These emissions are given as 118,000kgCH4/PJ on the basis of gas consumption, which is 0.6%. Leakage in the residential and commercial sectors is stated to be 0 to 87,000kgCH4/PJ, which equates to 0.4%, and in industrial plants and power station the losses are 0 to 175,000kg/CH4/PJ, which is 0.8%. These leakage estimates are compounded and multiplied. The methane destruction efficiency for landfill gas injected into the natural gas transmission and distribution system can now be calculated as the product of these three efficiency factors, giving a total efficiency of (99.5% * 99.4% * 99.6%) 98.5% for residential and commercial sector users, and (99.5% * 99.4% * 99.2%) 98.1% for industrial plants and power stations.37
37 GE AES Greenhouse Gas Services, Landfill Gas Methodology, Version 1.0 (July 2007).
66

Organic Waste Digestion Project Protocol Version 1.0, October 2009
Table B.7. CO2 emission factors for fossil fuel use.
Fuel Type Heat Content
Carbon Content
(Per Unit Energy) Fraction Oxidized
CO2 Emission Factor
(Per Unit Energy)
CO2 Emission Factor
(Per Unit Mass or Volume)
Coal and Coke MMBtu / Short ton kg C / MMBtu kg CO2 / MMBtu kg CO2 / Short
ton Anthracite Coal 25.09 28.26 1.00 103.62 2,599.83 Bituminous Coal 24.93 25.49 1.00 93.46 2,330.04 Sub-bituminous Coal 17.25 26.48 1.00 97.09 1,674.86 Lignite 14.21 26.30 1.00 96.43 1,370.32 Unspecified (Residential/ Commercial) 22.05 26.00 1.00 95.33 2,102.29 Unspecified (Industrial Coking) 26.27 25.56 1.00 93.72 2,462.12 Unspecified (Other Industrial) 22.05 25.63 1.00 93.98 2,072.19 Unspecified (Electric Utility) 19.95 25.76 1.00 94.45 1,884.53 Coke 24.80 31.00 1.00 113.67 2,818.93
Natural Gas (By Heat Content) Btu / Standard cubic foot kg C / MMBtu kg CO2 / MMBtu kg CO2 /
Standard cub. ft. 975 to 1,000 Btu / Std cubic foot 975 – 1,000 14.73 1.00 54.01 Varies 1,000 to 1,025 Btu / Std cubic foot 1,000 – 1,025 14.43 1.00 52.91 Varies 1,025 to 1,050 Btu / Std cubic foot 1,025 – 1,050 14.47 1.00 53.06 Varies 1,050 to 1,075 Btu / Std cubic foot 1,050 – 1,075 14.58 1.00 53.46 Varies 1,075 to 1,100 Btu / Std cubic foot 1,075 – 1,100 14.65 1.00 53.72 Varies Greater than 1,100 Btu / Std cubic foot > 1,100 14.92 1.00 54.71 Varies Weighted U.S. Average 1,029 14.47 1.00 53.06 0.0546 Petroleum Products MMBtu / Barrel kg C / MMBtu kg CO2 / MMBtu kg CO2 / gallon Asphalt & Road Oil 6.636 20.62 1.00 75.61 11.95 Aviation Gasoline 5.048 18.87 1.00 69.19 8.32 Distillate Fuel Oil (#1, 2 & 4) 5.825 19.95 1.00 73.15 10.15 Jet Fuel 5.670 19.33 1.00 70.88 9.57 Kerosene 5.670 19.72 1.00 72.31 9.76 LPG (average for fuel use) 3.849 17.23 1.00 63.16 5.79 Propane 3.824 17.20 1.00 63.07 5.74 Ethane 2.916 16.25 1.00 59.58 4.14 Isobutene 4.162 17.75 1.00 65.08 6.45 n-Butane 4.328 17.72 1.00 64.97 6.70 Lubricants 6.065 20.24 1.00 74.21 10.72 Motor Gasoline 5.218 19.33 1.00 70.88 8.81 Residual Fuel Oil (#5 & 6) 6.287 21.49 1.00 78.80 11.80 Crude Oil 5.800 20.33 1.00 74.54 10.29 Naphtha (<401 deg. F) 5.248 18.14 1.00 66.51 8.31 Natural Gasoline 4.620 18.24 1.00 66.88 7.36 Other Oil (>401 deg. F) 5.825 19.95 1.00 73.15 10.15 Pentanes Plus 4.620 18.24 1.00 66.88 7.36 Petrochemical Feedstocks 5.428 19.37 1.00 71.02 9.18 Petroleum Coke 6.024 27.85 1.00 102.12 14.65 Still Gas 6.000 17.51 1.00 64.20 9.17 Special Naphtha 5.248 19.86 1.00 72.82 9.10 Unfinished Oils 5.825 20.33 1.00 74.54 10.34 Waxes 5.537 19.81 1.00 72.64 9.58 Source: EPA Climate Leaders, Stationary Combustion Guidance (2007), Table B-2 except: Default CO2 emission factors (per unit energy) are calculated as: Carbon Content × Fraction Oxidized × 44/12. Default CO2 emission factors (per unit mass or volume) are calculated as: Heat Content x Carbon Content × Fraction Oxidized × 44/12× Conversion Factor (if applicable). Heat content factors are based on higher heating values (HHV).
67

Organic Waste Digestion Project Protocol Version 1.0, October 2009
68
Table B.8. CO2 electricity emission factors.
eGRID subregion
Annual output emission rates
acronym eGRID subregion name
(lb CO2/MWh) (metric ton CO2/MWh)* AKGD ASCC Alaska Grid 1,232.36 0.559 AKMS ASCC Miscellaneous 498.86 0.226 AZNM WECC Southwest 1,311.05 0.595 CAMX WECC California 724.12 0.328 ERCT ERCOT All 1,324.35 0.601 FRCC FRCC All 1,318.57 0.598 HIMS HICC Miscellaneous 1,514.92 0.687 HIOA HICC Oahu 1,811.98 0.822 MROE MRO East 1,834.72 0.832 MROW MRO West 1,821.84 0.826 NEWE NPCC New England 927.68 0.421 NWPP WECC Northwest 902.24 0.409 NYCW NPCC NYC/Westchester 815.45 0.370 NYLI NPCC Long Island 1,536.80 0.697 NYUP NPCC Upstate NY 720.80 0.327 RFCE RFC East 1,139.07 0.517 RFCM RFC Michigan 1,563.28 0.709 RFCW RFC West 1,537.82 0.698 RMPA WECC Rockies 1,883.08 0.854 SPNO SPP North 1,960.94 0.889 SPSO SPP South 1,658.14 0.752 SRMV SERC Mississippi Valley 1,019.74 0.463 SRMW SERC Midwest 1,830.51 0.830 SRSO SERC South 1,489.54 0.676 SRTV SERC Tennessee Valley 1,510.44 0.685 SRVC SERC Virginia/Carolina 1,134.88 0.515 Source: U.S. EPA eGRID2007, Version 1.1 Year 2005 GHG Annual Output Emission Rates (December 2008). * Converted from lbs CO2/ MWh to metric tons CO2/MWH using conversion factor 1 metric ton = 2,204.62 lbs.
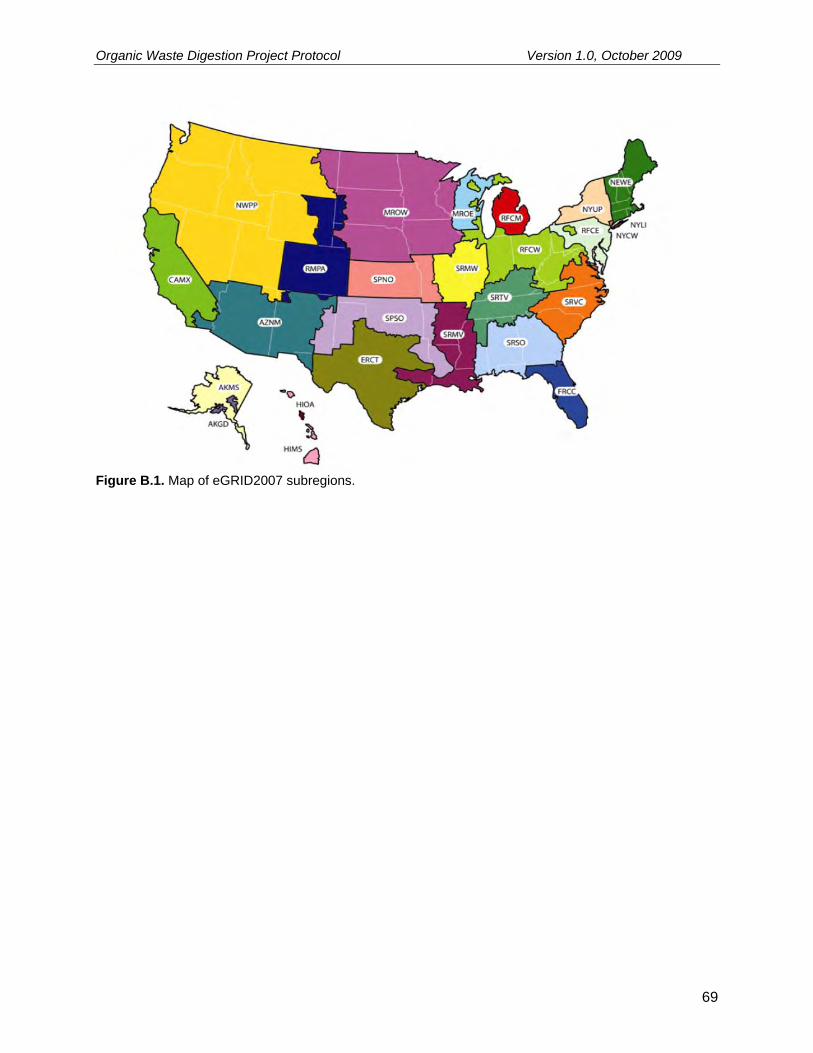
Organic Waste Digestion Project Protocol Version 1.0, October 2009
Figure B.1. Map of eGRID2007 subregions.
69

LegendK-Value Categories
Dry Temperate
Wet Temperate
Dry Tropical
Wet Tropical
Figure B.2: K-Value Categories in the U.S., by County
Source: USGS, Hydrologic landscape regions of the United States (2003)

Organic Waste Digestion Project Protocol Version 1.0, October 2009
Appendix C Summary of the Performance Standard Paper The analysis to establish a Performance Standard for the Organic Waste Digestion Project Protocol was undertaken by Science Applications International Corporation (SAIC). It took place in January to May of 2009. The analysis culminated in two papers that provided performance standard options and recommendations to support the Reserve’s protocol development process, which the Reserve has incorporated into the protocol’s eligibility rules (see Section 3). The purpose of a Performance Standard is to establish a threshold that is significantly better than average greenhouse gas (GHG) production for a specified service, which, if met or exceeded by a project developer, satisfies the criterion of “additionality.” The Reserve’s project protocol focuses on the following emission reduction activity: the anaerobic digestion of organic wastes that were previously treated in uncontrolled anaerobic waste treatment systems. The analysis to establish the Performance Standard evaluated organic waste management practices in the specified categories of waste streams. The paper did not provide a detailed quantitative analysis of organic waste practices or volumes in the U.S. but rather provides a qualitative review of current practices and regulations for the identified waste categories. It did not provide a performance “threshold” or baseline of GHG emissions from organic waste. Ultimately, it recommended for each waste category whether a performance standard to improve GHG emissions can be established. The paper had the following sections:
Organic waste source industries in the U.S. The process for which organic wastes are generated from each identified waste stream;
their respective ‘Business as Usual’ and alternative (or better practice) management practices and potential GHG reductions for these management practices
Current and anticipated federal and state regulations impacting organic waste management practices
Recommendations for regulatory additionality Recommendations for OWD performance standard options Digestion economics
C.1. Selected Waste Generating Industries As organic waste sources span across a range of different point sources and disposal locations, an industry-based approach was utilized to inform the performance standard. A list of 82 industries was identified using the North American Industry Classification System (NAICS), the standard used by Federal statistical agencies in classifying business establishments.38 The list of 82 industries was then shortlisted based on their organic waste and greenhouse gas potential. Thirty-one industries were shortlisted for detailed analysis. These were organized under the three categories of organic waste:
Food and food-processing solid waste sources Agricultural solid waste sources Industrial/agricultural wastewater sources (including wastewater coming from on-site
agro-industrial and food processing industries)
Table C.1 shows the major organic waste generating industries considered in the paper. 38 http://www.census.gov/eos/www/naics/
70

Organic Waste Digestion Project Protocol Version 1.0, October 2009
Table C.1. Selected organic waste source industries studied.
Organic Waste Source Categories
Category Industry
Food & Food
Processing Solid W
aste
Agricultural
Solid Waste
Industrial/ A
gricultural W
astewater
Primary M
anuf.
Secondary Manuf.
Grain Manufacturing
1. Rice Milling
2. Malt Manufacturing
3. Wet Corn Milling
X X X
Oilseed Processing
4. Soybean Processing
5. Other Oilseed Processing X X X
Sugar Manufacturing
6. Sugarcane Mills
7. Cane Sugar Refining
8. Beet Sugar Manufacturing
X X X X X
Fruit and Vegetable Manufacturing
9. Frozen Fruit, Juice, and Vegetable Manufacturing
10. Fruit and Vegetable Canning
X X X X
Pre-Cooked Foods
11. Frozen Specialty Food Manufacturing
12. Specialty Canning
13. Commercial Bakeries
X X X
Dairies 14. Fluid Milk Manufacturing
15. Creamery Butter Manufacturing
16. Cheese Manufacturing
X X X
Animal/ Seafood Processing
17. Animal (except Poultry) Slaughtering
18. Meat Processed from Carcasses
19. Rendering and Meat Byproduct Processing
20. Poultry Processing
21. Seafood Canning
X X X X
Beverage Manufacturing
22. Soft Drink Manufacturing
23. Breweries
24. Wineries
X X X
71

Organic Waste Digestion Project Protocol Version 1.0, October 2009
Organic Waste Source Categories
Category Industry
Food & Food
Processing Solid W
aste
Agricultural
Solid Waste
Primary M
anuf.
Secondary Manuf.
Industrial/ A
gricultural W
astewater
Paper Milling 25. Paper (except Newsprint) Mills
26. Paperboard Mills
27. Cellulosic Organic Fiber Manufacturing
X* X X
Fertilizer Manufacturing
28. Nitrogenous Fertilizer Manufacturing
29. Phosphatic Fertilizer Manufacturing
30. Fertilizer (Mixing Only) Manufacturing + Compost Manufacturing
X* X X X
Medicinal Manufacturing
31. Medicinal and Botanical Manufacturing
X* X X
* Non-food industries that generate organic wastes (note, for the purposes of this study, these industries were grouped with the food processing for research, analysis and discussion) Primary manufacturing is characterized by industries that process an agricultural or forestry product. These manufacturing plants or operations will generally be largest, and will produce the greatest quantities of waste per plant. Because of their large waste volumes and the producers’ motivation to sell products to their highest use (and value), manufacturers will typically sell waste products to buyers who use them as feedstock for secondary products. Secondary manufacturing, on the other hand, is producing a more finished product from the primary manufacturing products. In addition to these “pre-consumer” industries, SAIC also uncovered relevant information on “post-consumer” organic wastes from the Municipal Solid Waste (MSW) streams in the U.S. such as food scraps and yard trimmings. Data was also obtained and analyzed for Fats, Oils, and Grease (FOG) wastes from pre and post-consumer sources.
C.2. Organic Waste Generation and Management and OWD Performance Standard Options
SAIC looked at three categories of organic wastes: 1) solid food waste, 2) agricultural solid waste, and 3) agro-industrial wastewater and determined the types of waste and industries associated with each category, as well as waste quantities for each type of the waste and any seasonal and geographical variations. SAIC then looked at waste management practices in the U.S. for each of these categories and provided an overview of how waste emissions arise, the methane potential of the waste, how it is managed in a “business as usual” setting and alternative management technologies.
72

Organic Waste Digestion Project Protocol Version 1.0, October 2009
The gathered evidence showed that for the first two categories (industrial food wastes and agricultural waste), there is a strong economic incentive to extract and recover solids from waste streams and convert these into by-products or to burn wastes for energy.39 Thus, the common practices of activity for these waste streams are already those with very low GHG emission potentials. However, there are a few solid food wastes that cannot be reused as byproducts and inevitably end up in landfill. Some examples of landfilled solid food waste identified in the research include milk solids, condemned animal carcasses, meat scraps and pomace wastes from winery. Further studies should be conducted to determine if these niche pre-consumer waste streams can be better characterized and included into a food waste offset methodology. The Reserve will continue to research this topic for future revisions to the protocol.
Post-Consumer Food Waste Studies by the U.S. EPA identified that 31.7 million tons of post-consumer food waste was generated in 2007, or 12.5% of total national MSW waste generated. In addition, studies by Biocycle Magazine estimate that just 0.8 million tons or 2.6% of this quantity was diverted from landfill to compost in 2007. Since only 2.6% of this waste is currently being diverted, this would typically qualify as achieving significantly improved GHG performance and meeting a stringent performance threshold.
FOG Wastes FOG wastes (Fats, Oils, and Grease) were also studied for their generation and disposal practices. It was discovered that yellow grease is a valuable product which is almost all recycled into by-products such as biofuels and rendered animal fats are also converted into valuable products such as soap and cosmetics. Brown grease (or grease trap grease) is mostly sent to POTWs with some individual practices being identified which involve solids being separated and sent to landfill. However, this is estimated to be a very small amount and in leading states, reuse of brown grease as biofuel feedstock is becoming common, as well as hauling to rendering plants for extraction of valuable components for reuse. Common practice therefore recognizes FOG waste as a recyclable resource and only small quantities are being sent to landfill, so it is concluded that these waste types would not typically qualify as achieving significantly improved GHG performance through application in digestion projects.
Yard Waste Another organic waste category studied is yard waste. An estimated 32.6 million tons of yard trimmings were generated in 2007, or 12.8% of total national MSW generated. Unlike post-consumer food waste, an EPA estimate of 20.9 million tons or 64.1% of this quantity was diverted from landfill for composting or mulching in 2007. This is then the common practice and for the same reasons as were given for pre-consumer solid waste, there would appear to be no incentive to develop technologies to further reduce GHG emissions. Therefore, a performance standard showing significantly improved performance above common practice cannot be established for yard waste.
39 The burning of agricultural solids generates biogenic carbon in the form of CO2 and is therefore considered carbon neutral. However, open burning of these wastes is an incomplete combustion process and can generate soot, carbon monoxide, and other pollutants of concern. There could be some GHG benefits from reducing open burning by reducing carbon black formation and some N20 formed during incomplete combustion, since these would be considered anthropogenic. Further study would be needed to establish if GHG emissions from carbon black and N20 resulting from open burning are significant.
73

Organic Waste Digestion Project Protocol Version 1.0, October 2009
Composting Composting of organic waste from the first two general categories is often considered a GHG reduction measure since aerobic degradation processes of the organic material tend to dominate over anaerobic processes. However, methane conversion potential (referred to as Methane Conversion Factors or MCFs, for which tables has been developed by the IPCC) of compost piles for manure are very low – ranging from zero to a maximum of 1.5% in a higher temperature setting. With such a low methane emission potential for the common practice case, there would appear to be no incentive to develop technologies to further reduce GHG emissions. Therefore, a performance standard showing significantly improved performance cannot be established for composted food and agricultural wastes.
Industrial and Agricultural Wastewater The third category of waste studied was industrial/agricultural wastewater. SAIC found that residual wastewater was, in most cases, sent to a POTW after solids were reduced to a level acceptable to the POTW. The POTW, in turn, manages the residual wastewater in various ways. As noted earlier, the 2004 U.S. EPA identified that 59% of wastewater flow in the U.S. goes to facilities with anaerobic digestion and 20 % of flow in the U.S. goes to facilities that have anaerobic digestion and utilize the off-gas. Facilities without gas utilization are typically equipped with flares to combust the methane. According to U.S. EPA and California Integrated Waste Management Board studies, 60-70% of biosolids from POTW’s are either composted or land applied. Both of these practices involve predominantly aerobic decomposition processes, although in some cases the biosolids could be temporarily stored in an anaerobic condition prior to composting or land treatment. Overall, the statistics indicate that a majority of POTW sludges are already treated in a way that generates little or no methane from aerobic processes or from biodigestion. The overall GHG emission baseline is then very low for the POTW sludges and there is little incentive to develop a performance standard to further reduce emissions. However, based on follow-up research, SAIC identified that agro-industrial wastewater treatment does occur on-site at many food and agricultural processing operations. There are many agro-industrial industries and facilities in the U.S. with varying on-site wastewater management practices in the U.S. The variations are largely a consequence of the industry segment as some will inherently have higher organic material loading such as those identified by EPA in current U.S. inventories as significant methane emitters – i.e. pulp and paper manufacturing, meat and poultry processing, vegetables, fruits, and juices processing, starch-based ethanol production, and petroleum refining. Additionally, variations will occur geographically in the U.S. depending on the allowable organic discharge limits (post treatment) in any specific area, and the feasibility of discharging wastewaters to a public treatment system. Even with these limitations, several important trends have emerged that will inform a performance standard for digestion in several industry segments. Meat and poultry processing are the best candidates at this time for an OWD performance standard to create additional GHG reductions. On-site anaerobic wastewater management is a common practice in these industry segments and the market penetration data do not indicate any significant uptake of digesters and methane collection systems in these segments. For the remaining industry segments reviewed, important questions remain. For fruit, vegetable, and juice processing, the market data indicate that some sub-categories (juice) have more AD system uptake than others (vegetable). In addition, EPA data indicate only 11% of these facilities have on-site wastewater systems. This appears to be attributable to a number of factors, including wide variations in the COD content of wastewater between different producer types within this diverse industry segment, and significant seasonal changes in wastewater
74

Organic Waste Digestion Project Protocol Version 1.0, October 2009
composition and volume at individual facilities. This leads to a mixed conclusion that facilities in this segment, if they can demonstrate a sufficient history of past anaerobic lagoon operation and low market penetration (e.g. vegetable processing), could be eligible for inclusion in the performance threshold. These outstanding questions indicate that it appears to be preferable to further break this industry segment down into sub-categories rather than to apply a uniform performance standard across it. For breweries and the emerging corn/biofuel ethanol industry segments, the market data suggest that AD systems are becoming more common place, although specific market penetration percentages could not be determined. This raises questions about the additionality of AD system projects in corn ethanol plants and breweries until a better understanding of the market penetration of AD systems in these segments is developed. Pulp and paper was not studied in the initial research as it is a complex industry that involves some chemical processes. However, the data obtained from EPA in this current research (high methane emissions, no indication of significant penetration of AD systems) would indicate potential for further investigation of the applicability of a performance standard for reducing methane emissions from anaerobic degradation processes. Specifically a separate evaluation of their on-site wastewater practices and AD system penetration appears warranted. A similar conclusion can be made for the pharmaceutical industry in that it can involve a variety of processes not studied in the original research but appear to have low penetration of digesters. There are several other industrial segments for which the market data indicate the plausibility as well as low penetration of anaerobic digestion projects, including dairy foods processing, candy, sugar, and yeast production. For each of these industries, more information on existing wastewater practices and the relative prevalence of AD systems is needed before determining the applicability of a performance standard for reducing methane emissions from anaerobic degradation processes. Based on the conclusions above, SAIC recommends categorizing the various industries examined according to their suitability for the development of an anaerobic digestion with methane recovery performance standard as follows:
Include as an Eligible Project Type Meat and poultry processing Vegetable processing
Exclude as an Eligible Project Type Breweries and ethanol industry segments
Promising: Needs Further Information to Ensure Consistency with Eligible Project Types Pulp and paper Dairy foods processing Sugar production Candy manufacturing Yeast production Fruit and juice processing Pharmaceuticals
75

Organic Waste Digestion Project Protocol Version 1.0, October 2009
C.3. Regulatory Conditions and Regulatory Additionality Recommendations
In order to properly credit emission reductions from digester projects, it is important to establish regulatory additionality that determines whether a project fulfills a regulatory obligation or if a project provides additional emission reductions beyond what is required by law. All GHG reduction projects are subject to a Legal Requirement Test to ensure that the emission reductions achieved by a project would not otherwise have occurred due to federal, state or local regulations. In the study, SAIC found that there are no federal or state regulations currently in place that obligate waste source producers or wastewater management entities to invest in a biogas control system or a bio-digester. For landfills, Federal and State laws have long required methane collection systems. In California, starting in 2010, AB32 will also require any remaining uncontrolled MSW landfills to install emission control systems to manage methane emissions from the decomposition of organic matter. Through AB939, California also calls for all municipalities to currently divert 50% of their waste stream from landfills, with an increase to a 75% diversion rate under consideration. Other States such as North Carolina and Missouri have similar landfill diversion laws. Thus, any municipality that has already achieved its landfill diversion goal would meet the Legal Requirement Test for additional landfill diversions of food wastes, for example. Conversely, a municipality that has not yet met its landfill diversion target may not fulfill the Legal Requirement Test for additional landfill diversions (at least until the target is achieved). With a myriad of regulations that wholly or partly apply to activities involved with organic waste disposal (e.g. air quality, wastewater, compost management) and with a wide variety of industries that generate organic wastes, digestion project owners need to ensure their diversion of organics to digestion continues to meet relevant regulatory requirements for disposal. This will most likely need to be done on a case by case basis depending on the location, quantity of waste, and the operation that is generating the waste in order to properly account for any additional emission reductions that occur beyond what is required by law.
C.4. Digestion Economics The SAIC study found that the dominant economic factor regarding adoption of digestion technology is capital and O&M costs for a digestion reactor, managing the solid, liquid and gaseous byproducts of digestion (e.g. send to landfill, land spreading, commodity byproduct, etc.). Table C.2 outlines general guidelines to evaluate the capital and O&M costs of different types of feedstock for digestion. Table C.2. Economic Evaluation Guidelines for Digestion Feedstock Type of Feedstock Capital Costs Operation and Maintenance
Anaerobic digestion of liquids $10-15 /gal of wastewater treated
$0.005 gallon treated (with energy recovery)
76
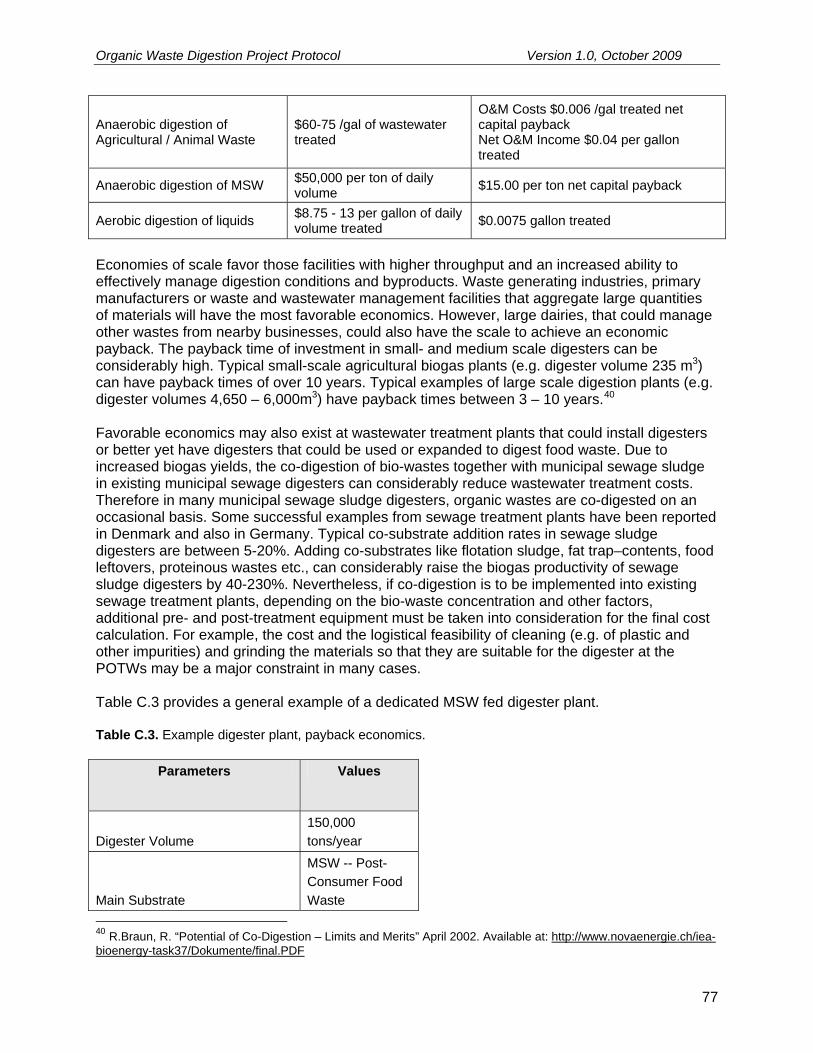
Organic Waste Digestion Project Protocol Version 1.0, October 2009
Anaerobic digestion of Agricultural / Animal Waste
$60-75 /gal of wastewater treated
O&M Costs $0.006 /gal treated net capital payback Net O&M Income $0.04 per gallon treated
Anaerobic digestion of MSW $50,000 per ton of daily volume $15.00 per ton net capital payback
Aerobic digestion of liquids $8.75 - 13 per gallon of daily volume treated $0.0075 gallon treated
Economies of scale favor those facilities with higher throughput and an increased ability to effectively manage digestion conditions and byproducts. Waste generating industries, primary manufacturers or waste and wastewater management facilities that aggregate large quantities of materials will have the most favorable economics. However, large dairies, that could manage other wastes from nearby businesses, could also have the scale to achieve an economic payback. The payback time of investment in small- and medium scale digesters can be considerably high. Typical small-scale agricultural biogas plants (e.g. digester volume 235 m3) can have payback times of over 10 years. Typical examples of large scale digestion plants (e.g. digester volumes 4,650 – 6,000m3) have payback times between 3 – 10 years.40 Favorable economics may also exist at wastewater treatment plants that could install digesters or better yet have digesters that could be used or expanded to digest food waste. Due to increased biogas yields, the co-digestion of bio-wastes together with municipal sewage sludge in existing municipal sewage digesters can considerably reduce wastewater treatment costs. Therefore in many municipal sewage sludge digesters, organic wastes are co-digested on an occasional basis. Some successful examples from sewage treatment plants have been reported in Denmark and also in Germany. Typical co-substrate addition rates in sewage sludge digesters are between 5-20%. Adding co-substrates like flotation sludge, fat trap–contents, food leftovers, proteinous wastes etc., can considerably raise the biogas productivity of sewage sludge digesters by 40-230%. Nevertheless, if co-digestion is to be implemented into existing sewage treatment plants, depending on the bio-waste concentration and other factors, additional pre- and post-treatment equipment must be taken into consideration for the final cost calculation. For example, the cost and the logistical feasibility of cleaning (e.g. of plastic and other impurities) and grinding the materials so that they are suitable for the digester at the POTWs may be a major constraint in many cases. Table C.3 provides a general example of a dedicated MSW fed digester plant. Table C.3. Example digester plant, payback economics.
Parameters Values
Digester Volume 150,000 tons/year
Main Substrate
MSW -- Post-Consumer Food Waste
40 R.Braun, R. “Potential of Co-Digestion – Limits and Merits” April 2002. Available at: http://www.novaenergie.ch/iea-bioenergy-task37/Dokumente/final.PDF
77

Organic Waste Digestion Project Protocol Version 1.0, October 2009
Investment Costs $15,000,000 Annual Capital Repayment Costs $3,500,000 Other Operating Costs (year) $2,500,000 Total Annual Costs $6,000,000 Total Revenue $9,056,000 Net Income (before Taxes) $3,056,000 Source: SAIC The simple payback for this investment of $15 million is 4.9 years. If one considers the value of GHG credits (of avoided methane emissions from MSW being landfilled) estimated at between $1 and $1.5 million annually,41 the simple payback ranges from 3.2 years to 3.7 years. However, if the landfill is required to have methane controls, this reduces the methane emand therefore the value of GHG credits to $450,000 annually,
itted
ears.
42 increasing the payback to 4.3 y
41 Based on EPA emissions factors for methane emissions from MSW in landfill (sourced from AP 42, Fifth Edition, Volume I Chapter 2: Solid Waste Disposal http://www.epa.gov/ttn/chief/ap42/ch02/index.html) and estimating carbon credit value at $8/ton (sourced from New Carbon Finance, Voluntary Market Research Note 13th January 2008 at www.newcarbonfinance.com/download.php?n=NCF_Voluntary_VCI_01_091.pdf&f=fileName&t=NCF_downloads 42 Based on 70% methane control efficiency rate
78

Organic Waste Digestion Project Protocol Version 1.0, October 2009
79
Appendix D Data Substitution This appendix provides guidance on calculating emission reductions when data integrity has been compromised due to missing data points. No data substitution is permissible for equipment such as thermocouples which monitor the proper functioning of destruction devices. Rather, the methodologies presented below are to be used only for the methane concentration and flow metering parameters. The Reserve expects that projects will have continuous, uninterrupted data for the entire verification period. However, the Reserve recognizes that unexpected events or occurrences may result in brief data gaps. The following data substitution methodology may be used only for flow and methane concentration data gaps that are discrete, limited, non-chronic, and due to unforeseen circumstances. Data substitution can only be applied to methane concentration or flow readings, but not both simultaneously. If data is missing for both parameters, no reductions can be credited. Further, substitution may only occur when two other monitored parameters corroborate proper functioning of the destruction device and system operation within normal ranges. These two parameters must be demonstrated as follows:
1. Proper functioning can be evidenced by thermocouple readings for flares, energy output for engines, etc.
2. For methane concentration substitution, flow rates during the data gap must be consistent with normal operation.
3. For flow substitution, methane concentration rates during the data gap must be consistent with normal operations.
If corroborating parameters fail to demonstrate any of these requirements, no substitution may be employed. If the requirements above can be met, the following substitution methodology maybe applied: Duration of Missing Data Substitution Methodology
Less than six hours Use the average of the four hours immediately before and following the outage
Six to 24 hours Use the 90% lower or upper confidence limit of the 24 hours prior to and after the outage, whichever results in greater conservativeness.
One to seven days Use the 95% lower or upper confidence limit of the 72 hours prior to and after the outage, whichever results in greater conservativeness.
Greater than one week No data may be substituted and no credits may be generated
Note: It is conservative to use the upper confidence limit when calculating emissions from the BCS (Equation 5.10); however, it is conservative to use the lower confidence limit when calculating the total amount of methane that is destroyed in the BCS (Equation 5.16).