organic nitrate chemistry and its implications for
TRANSCRIPT
Organic nitrate chemistry and its implications for nitrogen budgetsin an isoprene- and monoterpene-rich atmosphere: constraints fromaircraft (SEAC4RS) and ground-based (SOAS) observations in theSoutheast USJ. A. Fisher1,2, D. J. Jacob3,4, K. R. Travis3, P. S. Kim4, E. A. Marais3, C. Chan Miller4, K. Yu3, L. Zhu3,R. M. Yantosca3, M. P. Sulprizio3, J. Mao5,6, P. O. Wennberg7,8, J. D. Crounse7, A. P. Teng7, T.B. Nguyen7,a, J. M. St. Clair7,b, R. C. Cohen9,10, P. Romer9, B. A. Nault10,c, P. J. Wooldridge9, J.L. Jimenez11,12, P. Campuzano-Jost11,12, D. A. Day11,12, W. Hu11,12, P. B. Shepson13,14, F. Xiong13, D.R. Blake15, A. H. Goldstein16,17, P. K. Misztal16, T. F. Hanisco18, G. M. Wolfe18,19, T. B. Ryerson20,A. Wisthaler21,22, and T. Mikoviny21
1Centre for Atmospheric Chemistry, School of Chemistry, University of Wollongong, Wollongong, NSW, Australia2School of Earth and Environmental Sciences, University of Wollongong, Wollongong, NSW, Australia3Harvard John A. Paulson School of Engineering and Applied Sciences, Harvard University, Cambridge, MA, USA4Department of Earth and Planetary Sciences, Harvard University, Cambridge, MA, USA5Program in Atmospheric and Oceanic Sciences, Princeton University, Princeton, NJ, USA6Geophysical Fluid Dynamics Laboratory/National Oceanic and Atmospheric Administration, Princeton, NJ, USA7Division of Geological and Planetary Sciences, California Institute of Technology, Pasadena, CA, USA8Division of Engineering and Applied Science, California Institute of Technology, Pasadena, CA, USA9Department of Chemistry, University of California at Berkeley, Berkeley, CA, USA10Department of Earth and Planetary Science, University of California at Berkeley, Berkeley, CA, USA11Department of Chemistry and Biochemistry, University of Colorado, Boulder, CO, USA12Cooperative Institute for Research in Environmental Sciences, University of Colorado, Boulder, CO, USA13Department of Chemistry, Purdue University, West Lafayette, IN, USA14Department of Earth, Atmospheric and Planetary Sciences, Purdue University, West Lafayette, IN, USA15Department of Chemistry, University of California Irvine, Irvine, CA, USA16Department of Environmental Science, Policy, and Management, University of California at Berkeley, Berkeley, CA, USA17Department of Civil and Environmental Engineering, University of California at Berkeley, Berkeley, CA, USA18Atmospheric Chemistry and Dynamics Laboratory, NASA Goddard Space Flight Center, Greenbelt, MD, USA19Joint Center for Earth Systems Technology, University of Maryland Baltimore County, Baltimore, MD, USA20Chemical Sciences Division, Earth System Research Lab, National Oceanic and Atmospheric Administration, Boulder, CO,USA21Department of Chemistry, University of Oslo, Oslo, Norway22Institute for Ion Physics and Applied Physics, University of Innsbruck, Innsbruck, AustriaaNow at Department of Environmental Toxicology, University of California at Davis, Davis, CA, USAbNow at Atmospheric Chemistry and Dynamics Laboratory, NASA Goddard Space Flight Center, Greenbelt, MD, USA andJoint Center for Earth Systems Technology, University of Maryland Baltimore County, Baltimore, MD, USAcNow at Department of Chemistry and Biochemistry and Cooperative Institute for Research in Environmental Sciences,University of Colorado, Boulder, CO, USA
Correspondence to: J.A. Fisher ([email protected])
1
Abstract. Formation of organic nitrates (RONO2) during oxidation of biogenic volatile organic compounds (BVOCs: isoprene,
monoterpenes) is a significant loss pathway for atmospheric nitrogen oxide radicals (NOx), but the chemistry of RONO2 for-
mation and degradation remains uncertain. Here we implement a new BVOC oxidation mechanism (including updated isoprene
chemistry, new monoterpene chemistry, and particle uptake of RONO2) in the GEOS-Chem global chemical transport model
with∼25×25 km2 resolution over North America. We evaluate the model using aircraft (SEAC4RS) and ground-based (SOAS)5
observations of NOx, BVOCs, and RONO2 from the Southeast US in summer 2013. The updated simulation successfully re-
produces the concentrations of individual gas- and particle-phase RONO2 species measured during the campaigns. Gas-phase
isoprene nitrates account for 25-50% of observed RONO2 in surface air, and we find that another 10% is contributed by
gas-phase monoterpene nitrates. Observations in the free troposphere show an important contribution from long-lived nitrates
derived from anthropogenic VOCs. During both campaigns, at least 10% of observed boundary layer RONO2 were in the par-10
ticle phase. We find that aerosol uptake followed by hydrolysis to HNO3 accounts for 60% of simulated gas-phase RONO2 loss
in the boundary layer. Other losses are 20% by photolysis to recycle NOx and 15% by dry deposition. RONO2 production ac-
counts for 20% of the net regional NOx sink in the Southeast US in summer, limited by the spatial segregation between BVOC
and NOx emissions. This segregation implies that RONO2 production will remain a minor sink for NOx in the Southeast US
in the future even as NOx emissions continue to decline.15
1 Introduction
Nitrogen oxide radicals (NOx ≡ NO + NO2) are critical in controlling tropospheric ozone production (Monks et al., 2015, and
references therein) and influencing aerosol formation (Rollins et al., 2012; Ayres et al., 2015; Xu et al., 2015), with indirect
impacts on atmospheric oxidation capacity, air quality, climate forcing, and ecosystem health. The ability of NOx to influence
ozone and aerosol budgets is tied to its atmospheric fate. In continental regions, a significant loss pathway for NOx is reaction20
with peroxy radicals derived from biogenic volatile organic compounds (BVOCs) to form organic nitrates (Liang et al., 1998;
Browne and Cohen, 2012). NOx loss to organic nitrate formation is predicted to become increasingly important as NOx
abundance declines (Browne and Cohen, 2012), as has occurred in the US over the past two decades (Hidy et al., 2014; Simon
et al., 2015). Despite this increasing influence on the NOx budget, the chemistry of organic nitrates remains the subject of
debate, with key uncertainties surrounding the organic nitrate yield from BVOC oxidation, the recycling of NOx from organic25
nitrate degradation, and the role of organic nitrates in secondary organic aerosol formation (Paulot et al., 2012; Perring et al.,
2013). Two campaigns in the Southeast US in summer 2013 provided datasets of unprecedented chemical detail for addressing
these uncertainties: the airborne NASA SEAC4RS (Studies of Emissions and Atmospheric Composition, Clouds, and Climate
Coupling by Regional Surveys; Toon et al., 2016) and the ground-based SOAS (Southern Oxidants and Aerosols Study). Here
we use a ∼25×25 km2 resolution 3-D chemical transport model (GEOS-Chem) to interpret organic nitrate observations from30
both campaigns, with focus on their impacts on atmospheric nitrogen (N) budgets.
Nitrogen oxides are emitted from natural and anthropogenic sources primarily as NO, which rapidly achieves steady state
with NO2. Globally, the dominant loss pathway for NOx is reaction with the hydroxyl radical (OH) to form nitric acid (HNO3).
2
In the presence of VOCs, NOx can also be lost by reaction with organic peroxy radicals (RO2) to form peroxy nitrates
(RO2NO2) and alkyl and multifunctional nitrates (RONO2) (O’Brien et al., 1995). Their daytime formation temporarily
sequesters NOx, facilitating its export to more remote environments (Horowitz et al., 1998; Paulot et al., 2012; Mao et al.,
2013). RO2NO2 species are thermally unstable at boundary layer temperatures and decompose back to NOx on a time scale
of minutes, except for the longer-lived peroxyacylnitrates (PANs) (Singh and Hanst, 1981). RONO2 species can dominate5
NOx loss when BVOC emissions are high and NOx emissions are low (Browne and Cohen, 2012; Paulot et al., 2012; Browne
et al., 2014) and may be more efficient for reactive N export than PANs (Mao et al., 2013). The amount of NOx sequestered
by RONO2 depends on the interplay between BVOC and NOx emissions, the RONO2 yield from BVOC oxidation, and the
eventual RONO2 fate.
RONO2 chemistry and impacts are illustrated schematically in Fig. 1, starting from reaction of NOx with BVOCs (mainly10
isoprene and monoterpenes) to form RONO2. The RONO2 yield (α) from isoprene oxidation by OH has been inferred from
laboratory and field experiments to be 4-15% (Tuazon and Atkinson, 1990; Chen et al., 1998; Sprengnether et al., 2002; Patchen
et al., 2007; Perring et al., 2009a; Paulot et al., 2009; Nguyen et al., 2014; Xiong et al., 2015). Models have shown nearly this
full range of yields to be compatible with RONO2 observations, depending on the chemical mechanism assumed. For example,
two models using different isoprene reaction schemes both successfully reproduced observations from a 2004 aircraft campaign15
(ICARTT) - one assuming a 4% molar yield (Horowitz et al., 2007) and the other assuming an 11.7% molar yield (Mao et al.,
2013). The RONO2 yield from monoterpene oxidation by OH is even more uncertain. Laboratory measurements exist only
for α-pinene, and these show divergent results: 26% (Rindelaub et al., 2015), 18% (Nozière et al., 1999), and 1% (Aschmann
et al., 2002, a lower limit due to significant wall losses). RONO2 yields remain a significant uncertainty in BVOC oxidation
schemes, with implications for their impacts on NOx sequestration.20
The fate of RONO2 is of central importance in determining whether sequestered NOx is returned to the atmosphere or
removed irreversibly. Many first generation RONO2 (i.e., those formed from NO reaction with BVOC-derived peroxy radicals)
have a short lifetime against further oxidation to form a suite of second generation RONO2 (Beaver et al., 2012; Mao et al.,
2013; Browne et al., 2014), especially if they are produced from di-olefins such as isoprene or limonene. Laboratory studies
indicate little NOx release during this process (Lee et al., 2014); however, NOx can be recycled by subsequent oxidation and25
photolysis of second generation species (Müller et al., 2014). Estimates of the NOx recycling efficiency, defined as the mean
molar percentage of RONO2 loss that releases NOx, range from <5% to >50% for isoprene nitrates (INs) (Horowitz et al.,
2007; Paulot et al., 2009), and best estimates depend on assumptions about the IN yield (Perring et al., 2009a). NOx recycling
efficiencies from monoterpene nitrates (MTNs) have not been observed experimentally, but model sensitivity studies have
shown a 14% difference in boundary layer NOx between scenarios assuming 0% versus 100% recycling (assuming an initial30
18% MTN yield, Browne et al., 2014). Uncertainty in the NOx recycling efficiency has a bigger impact on simulation of NOx
and ozone than uncertainty in the RONO2 yield (Xie et al., 2013).
Organic nitrates are more functionalized and less volatile than their BVOC precursors and are therefore more likely to
partition to the particle phase. In the Southeast US, Xu et al. (2015) recently showed that particulate RONO2 (pRONO2)
make an important contribution to total organic aerosol (5-12%), consistent with in situ observations from other environments35
3
(Brown et al., 2009, 2013; Fry et al., 2013; Rollins et al., 2012, 2013). Chamber experiments have shown high mass yields
of aerosol from NO3-initiated oxidation of isoprene (15-25%; Ng et al., 2008; Rollins et al., 2009) and some monoterpenes
(33-65%; Fry et al., 2014). There is evidence that RONO2 from OH-initiated oxidation also form aerosol, although with lower
yields, possibly via multi-functionalized oxidation products (Kim et al., 2012; Lin et al., 2012; Rollins et al., 2012; Lee et al.,
2014). pRONO2 are removed either by deposition or by hydrolysis to form HNO3 (Jacobs et al., 2014; Rindelaub et al., 2015).5
Both losses augment N deposition to ecosystems (Lockwood et al., 2008). Aerosol partitioning competes with photochemistry
as a loss for gas-phase RONO2 with impacts for NOx recycling. Partitioning also competes with gas-phase deposition, and
because lifetimes against deposition are much longer for organic aerosols than for gas-phase precursors (Wainwright et al.,
2012; Knote et al., 2015), this process may shift the enhanced N deposition associated with RONO2 (Zhang et al., 2012;
Nguyen et al., 2015) to ecosystems further downwind of sources.10
The 2013 SEAC4RS and SOAS campaigns provide a unique resource for evaluating the impact of BVOC-derived organic ni-
trates on atmospheric NOx. Both campaigns provided datasets of unprecedented chemical detail, including isoprene, monoter-
penes, total and particle-phase RONO2, and speciated INs; during SOAS these were further augmented by measurements
of MTNs. Continuous measurements from the SOAS ground site provide high temporal resolution and constraints on diurnal
variability (e.g., Nguyen et al., 2015; Xiong et al., 2015). These are complemented by extensive boundary layer profiling across15
a range of chemical environments from the SEAC4RS airborne measurements (Toon et al., 2016). Combined, the campaigns
covered the summer period when BVOC emissions in the Southeast US are at a maximum (Palmer et al., 2006). These data
offer new constraints for testing models of organic nitrate chemistry, with implications for our understanding of NOx, ozone,
and aerosol budgets in BVOC-dominated environments worldwide.
We examine here the impact of BVOC oxidation on atmospheric NOx, using the 2013 campaign data combined with the20
GEOS-Chem model. The version of GEOS-Chem used in this work represents a significant advance over previous studies,
with higher spatial resolution (∼25×25 km2) that better captures the spatial segregation of BVOC and NOx emissions (Yu
et al., 2016); updated isoprene nitrate chemistry incorporating new experimental and theoretical findings (e.g., Lee et al., 2014;
Müller et al., 2014; Peeters et al., 2014; Xiong et al., 2015); addition of monoterpene nitrate chemistry (Browne et al., 2014;
Pye et al., 2015); and consideration of particle uptake of gas-phase isoprene and monoterpene nitrates. We first evaluate the25
updated GEOS-Chem simulation using SOAS and SEAC4RS observations of BVOCs, organic nitrates, and related species. We
then use GEOS-Chem to quantify the fates of BVOC-derived organic nitrates in the Southeast US. Finally, we investigate the
impacts of organic nitrate formation on the NOx budget.
2 Updates to GEOS-Chem simulation of organic nitrates
We use a new high resolution version of the GEOS-Chem CTM (www.geos-chem.org) v9-02, driven by assimilated meteorol-30
ogy from the NASA Global Modeling and Assimilation Office (GMAO) Goddard Earth Observing System Forward Processing
(GEOS-FP) product. The model is run in a nested configuration (Wang et al., 2004), with native GEOS-FP horizontal reso-
lution of 0.25◦ latitude by 0.3125◦ longitude over North America (130-60◦W, 9.75-60◦N). Boundary conditions are provided
4
from a 4◦× 5◦ global simulation, also using GEOS-Chem. The native GEOS-FP product includes 72 vertical layers of which
∼38 are in the troposphere. Temporal resolution of GEOS-FP is hourly for surface variables and 3-hourly for all others. Our
simulations use a time step of 5 minutes for transport and 10 minutes for emissions and chemistry.
GEOS-Chem has been applied previously to simulation of organic nitrates in the Southeast US (e.g., Fiore et al., 2005;
Zhang et al., 2011; Mao et al., 2013). Mao et al. (2013) recently updated the GEOS-Chem isoprene oxidation mechanism to5
include explicit production and loss of a suite of second generation isoprene nitrates and nighttime oxidation by nitrate radicals.
While their updated simulation showed good agreement with aircraft observations from the 2004 ICARTT campaign over the
eastern US, we find that the more detailed chemical payloads available during SOAS and SEAC4RS highlight deficiencies in
that mechanism, resulting in large model biases in RONO2.
A major component of this work is modification of the organic nitrate simulation in GEOS-Chem. Our focus here is on10
the BVOC-derived nitrates for which field measurements are newly available. GEOS-Chem simulation of PANs was recently
updated by Fischer et al. (2014) and is not discussed here. Our improvements to the RONO2 simulation are detailed below
and include updates to isoprene oxidation chemistry, addition of monoterpene oxidation chemistry, and inclusion of aerosol
uptake of RONO2 followed by particle-phase hydrolysis. Other updates from GEOS-Chem v9-02 and comparison to Southeast
US observations are presented in several companion papers. Kim et al. (2015) describe the aerosol simulation and Travis15
et al. (2016) the gas-phase oxidant chemistry. Constraints on isoprene emissions from satellite formaldehyde observations are
described by Zhu et al. (2016). The low-NOx isoprene oxidation pathway and implications for organic aerosols are described
by Marais et al. (2016). Finally, Yu et al. (2016) evaluate the impact of model resolution and spatial segregation of NOx and
BVOC emissions on isoprene oxidation. Our simulation is identical to that used in Travis et al. (2016), Yu et al. (2016), and
Zhu et al. (2016).20
2.1 Isoprene oxidation chemical mechanism
The basic structure of the GEOS-Chem isoprene oxidation mechanism is described by Mao et al. (2013), with updates to low-
NOx pathways described and validated by Travis et al. (2016). All updates to the isoprene oxidation mechanism are provided
in Travis et al. (2016) Tables S1 and S2. Figure 2 shows our updated implementation of OH-initiated isoprene oxidation in
the presence of NOx leading to isoprene nitrate (IN) formation. Isoprene oxidation by OH produces isoprene peroxy radicals25
(ISOPO2) in either β- or δ-hydroxy peroxy configurations depending on the location of OH addition. In the presence of
NOx, ISOPO2 reacts with NO to either produce NO2 (the dominant fate; Perring et al., 2013) or form INs, with the yield
of INs (α) defined as the branching ratio between these two channels. Early laboratory measurements of α suggested an IN
yield between 4.4 and 12% (Tuazon and Atkinson, 1990; Chen et al., 1998; Sprengnether et al., 2002; Patchen et al., 2007;
Paulot et al., 2009; Lockwood et al., 2010). More recent experiments indicate continuing uncertainty in α, with a measured30
yield of α= 9± 4% from the Purdue Chemical Ionization Mass Spectrometer (CIMS; Xiong et al., 2015) and α= 13± 2%
from the Caltech CF3O− Time-of-Flight CIMS (CIT-ToF-CIMS; Teng et al., in preparation), despite excellent agreement
during calibrated intercomparison exercises using one isoprene nitrate isomer (4,3 ISOPN). The sensitivity of the CIT-ToF-
CIMS is similar for all isomers of ISOPN (Lee et al., 2014), while the Purdue instrument is less sensitive to the major isomer
5
(1,2 ISOPN) (Xiong et al., 2015). Here, we use a first generation IN yield of α= 9%, which we find provides a reasonable
simulation of the SOAS observations and is also consistent with the SOAS box model simulations of Xiong et al. (2015). We
discuss the model sensitivity to the choice of α in Sect. 3.
For the oxidation of isoprene by OH, the mechanism described in Mao et al. (2013) assumed a first generation IN composition
of 40% β-hydroxyl INs (β-ISOPN) and 60% δ-hydroxyl INs (δ-ISOPN). However, new theoretical constraints show that under5
atmospheric conditions, δ-channel peroxy radicals are only a small fraction of the total due to fast redissociation of peroxy
radicals that fosters interconversion between isomers and tends towards an equilibrium population with more than 95% β-
isomers (Peeters et al., 2014). Using a simplified box model based on the extended Leuven Isoprene Mechanism LIM1, we
found δ-isomers were 4-8% of the total peroxy pool in representative Southeast US boundary layer conditions (temperature
∼295-300 K, ISOPO2 lifetime ∼20-60 seconds). In what follows, we use an IN distribution of 90% β-ISOPN and 10%10
δ-ISOPN. Our box modeling suggests 10% is an upper limit for the δ-ISOPN pool; however, we maintain this value as it
allows improved simulation of species with predominantly δ-pathway origins, including glyoxal and the second generation INs
propanone nitrate (PROPNN) and ethanal nitrate (ETHLN).
First generation ISOPN isomers formed via OH oxidation of isoprene have a short photochemical lifetime against atmo-
spheric oxidation (Paulot et al., 2009; Lockwood et al., 2010; Lee et al., 2014). Here we use updated reaction rate constants15
and products from Lee et al. (2014) that increase the β-ISOPN+OH reaction by roughly a factor of two and decrease ozonol-
ysis by three orders of magnitude (relative to the previous mechanism based on Lockwood et al., 2010; Paulot et al., 2009).
Changes in δ-ISOPN reaction rate constants are more modest but in the same direction. For both isomers, reaction with OH
forms a peroxy radical (ISOPNO2) along with a small (10%) yield of isoprene epoxy diols (Jacobs et al., 2014). Rate constants
and products of the subsequent oxidation of ISOPNO2 to form a suite of second generation INs follow the Lee et al. (2014)20
mechanism. We explicitly simulate methylvinylketone nitrate (MVKN) and methacrolein nitrate (MACRN), which are primar-
ily from the β-pathway; PROPNN and ETHLN, which are primarily from the δ-pathway (and NO3-initiated oxidation); and
C5 dihydroxy dinitrate (DHDN), formed from both isomers (Lee et al., 2014).
Isoprene reaction with NO3 is the dominant isoprene sink at night and can also be significant during the day (Ayres et al.,
2015), producing INs with high yield (Perring et al., 2009b; Rollins et al., 2009). This reaction can account for more than25
20% of isoprene loss in some environments (Brown et al., 2009) and may explain 40-50% of total RONO2 in the Southeast
(Mao et al., 2013; Xie et al., 2013). The mechanism used here is identical to that described by Mao et al. (2013). Reaction
of isoprene with NO3 forms a nitrooxy peroxy radical (INO2). Subsequent reaction of INO2 with NO, NO3, itself, or other
peroxy radicals forms a first generation C5 carbonyl nitrate (ISN1) with 70% yield, while reaction with HO2 forms a C5
nitrooxy hydroperoxide (INPN) with 100% yield. In this simplified scheme, we do not distinguish between β- and δ- isomers30
for ISN1 and INPN, nor do we include the C5 hydroxy nitrate species recently identified in chamber experiments (Schwantes
et al., 2015). Mao et al. (2013) lumped all second generation nitrates derived from ISN1 and INPN into a single species (R4N2),
but here we assume that the lumped species is PROPNN on the basis of recent chamber experiments that show PROPNN to
be a high-yield photooxidation product of INs from NO3-initiated oxidation (Schwantes et al., 2015). This effectively assumes
6
instantaneous conversion of INs to PROPNN, a simplification that results in a shift in the simulated diurnal cycle of PROPNN
(see Sect. 3). We do not include here the nitrooxy hydroxyepoxide product recently identified by Schwantes et al. (2015).
Possible fates for second generation INs include further oxidation, photolysis, uptake to the aerosol phase followed by
hydrolysis (Sect. 2.3), and removal via wet and dry deposition. Müller et al. (2014) show that photolysis is likely significantly
faster than reaction with OH for carbonyl nitrates (e.g., MVKN, MACRN, ETHLN, PROPNN) due to enhanced absorption5
cross sections and high quantum yields caused by the proximity of the carbonyl group (a strongly absorbing chromophore) to
the weakly-bound nitrate group. Here we increase the absorption cross sections of the carbonyl INs following the methodology
of Müller et al. (2014, Sect. 2). Briefly, we first use the PROPNN cross section measured by Barnes et al. (1993) to calculate a
wavelength-dependent cross section enhancement ratio (rnk), defined as the ratio of the measured cross section to the sum of the
IUPAC-recommended cross sections for associated monofunctional nitrates and ketones. We then calculate new cross sections10
for ETHLN, MVKN, and MACRN by multiplying rnk by the sum of cross sections from appropriate monofunctional analogues
(Table S5). The new cross sections are 5-15 times larger than in the original model, which used the IUPAC-recommended cross
section of the monofunctional analogue tert-butyl nitrate for all carbonyl nitrates (Roberts and Fajer, 1989). For all species, we
calculate photolysis rates assuming unity quantum yields, whereby the weak O−NO2 bond dissociates upon a rearrangement
after photon absorption to the carbonyl chromophore (Müller et al., 2014). Peak midday photolysis rates now range from15
∼ 3× 10⁻⁵ s−1 (PROPNN) to ∼ 3× 10⁻⁴ s−1 (MACRN).
Removal by dry deposition has been updated based on new observations from the SOAS ground site. The dry deposition
calculation is now constrained to match observed deposition velocities for ISOPN, MVKN, MACRN, and PROPNN (Nguyen
et al., 2015; Travis et al., 2016), with all other RONO2 deposition velocities scaled to that of ISOPN. Wet scavenging of gases
is described in Amos et al. (2012) and has been modified here to use the same Henry’s Law coefficients as for dry deposition.20
Aerosol partitioning is described in Sect. 2.3 below.
2.2 Monoterpene oxidation chemical mechanism
Monoterpene chemistry is not included in the standard GEOS-Chem gas-phase chemical mechanism. Here we implement a
monoterpene nitrate scheme developed by Browne et al. (2014) that was built on the RACM2 chemical mechanism (Goliff
et al., 2013) and evaluated using aircraft observations over the Canadian boreal forest (Browne et al., 2014). Our implementa-25
tion is summarized in Fig. 3 and described briefly below, with the full mechanism available in the Supplement (Tables S1-S3)
and at http://wiki.seas.harvard.edu/geos-chem/index.php/Monoterpene_nitrate_scheme. We include two lumped monoterpene
tracers: API representing monoterpenes with one double bond (α-pinene, β-pinene, sabinene, and ∆-3-carene) and LIM repre-
senting monoterpenes with two double bonds (limonene, myrcene, and ocimene). Combined, these species account for roughly
90% of all monoterpene emissions (Guenther et al., 2012), and we neglect other terpenes here. During the day, LIM and API are30
oxidized by OH to form peroxy radicals. Subsequent reaction with NO forms first generation monoterpene nitrates with a yield
of 18% (Nozière et al., 1999). These can be either saturated (MONITS) or unsaturated (MONITU), with precursor-dependent
partitioning as shown in Fig. 3. For all subsequent discussion, we refer to their sum MONIT = MONITU + MONITS.
7
At night, both LIM and API react with NO3 to form a nitrooxy peroxy radical that either decomposes to release NO2 or
retains the nitrate functionality to form MONIT. The branching ratio between these two fates is 50% nitrate-retaining for LIM
+ NO3 (Fry et al., 2014) and 10% nitrate-retaining for API + NO3 (Browne et al., 2014). The 10% nitrate yield from API +
NO3 is on the low end of the observed range (Fry et al., 2014), so simulated pinene-derived MONIT should be considered
a lower bound. In Browne et al. (2014), the API + NO3 reaction used the α-pinene + NO3 rate constant from the Master5
Chemical Mechanims (MCMv3.2). We have updated this rate constant to kAPI+NO3= 8.33× 10⁻¹³e490/T , a rough average
of the MCMv3.3 α- and β-pinene values, as API comprises both α- and β-pinenes (the dominant API components, present in
roughly equal amounts during both SEAC4RS and SOAS). API and LIM also react with O3, but this reaction does not lead to
RONO2 formation.
We do not distinguish between OH-derived and NO3-derived MTN species. MONIT are subject to removal via wet and10
dry scavenging, aerosol uptake, photolysis, ozonolysis (MONITU only) and oxidation by OH. Here, we also add MONIT
reaction with NO3 with the same rate constant as used for nighttime isoprene nitrates. The products of MONIT oxidation are
currently unknown; here we follow Browne et al. (2014) and assume oxidation produces a second generation monoterpene
nitrate (HONIT) that undergoes dry deposition, photolysis, and oxidative loss. In our simulation, HONIT is also removed via
aerosol uptake (Sect. 2.3).15
2.3 Aerosol partitioning of RONO2
Evidence from laboratory and field studies suggests aerosol uptake is a potentially significant loss pathway for gas-phase
RONO2 (e.g., Day et al., 2010; Rollins et al., 2010; Darer et al., 2011; Fry et al., 2013, 2014). In particular, BVOC oxidation
by NO3 radicals has been shown to result in high organic aerosol yields (Ng et al., 2008; Fry et al., 2009; Rollins et al., 2012).
Recent work from SOAS highlighted the role of the monoterpenes + NO3 reaction, with an estimated 23-44% yield of organic20
nitrate aerosol (Ayres et al., 2015) that can explain roughly half of nighttime secondary organic aerosol production (Xu et al.,
2014). Isoprene + NO3 results in smaller but still significant yields; Xu et al. (2014) estimate that isoprene was responsible for
20% of nighttime NO3-derived organic aerosol observed during SOAS. Organic nitrate aerosol yields from daytime oxidation
by OH are lower but non-negligible. At Bakersfield, for example, Rollins et al. (2013) found 21% of RONO2 partitioned to
the aerosol phase during the day, and that these could explain 5% of the total daytime organic aerosol mass.25
Aerosol partitioning of RONO2 has not previously been considered in GEOS-Chem. Here we add this process using a
reactive uptake coefficient (γ) parameterization. Our parameterization was designed to provide a necessary sink for gas-phase
RONO2 species (overestimated in earlier iterations of our model), and therefore makes a number of simplifying assumptions.
In particular, we do not allow pRONO2 to re-partition to the gas phase (likely to impact the more volatile isoprene-derived
nitrates), and uptake coefficients are defined to fit the measurements of gas-phase species. More accurate simulation of organic30
nitrate aerosols would require additional updates that take into account vapor pressure differences between species (as done
recently by Pye et al., 2015) and incorporate new findings from SOAS (Ayres et al., 2015; Lee et al., 2016). For our simulation,
we apply reactive uptake to all BVOC-derived RONO2 except PROPNN and ETHLN, which lack hydroxyl groups and are
therefore expected to be significantly less soluble. We assume an uptake coefficient of γ=0.005 for isoprene nitrates (from both
8
daytime and nighttime chemistry) and γ=0.01 for all monoterpene nitrates (Table S4). Our isoprene nitrate uptake coefficient is
in the middle of the range predicted by Marais et al. (2016) using a mechanistic formulation, and is a factor of 4 lower than the
upper limit for ISOPN inferred by Wolfe et al. (2015) using SEAC4RS flux measurements. Although simplified, we find this
parameterization provides a reasonable fit to the SEAC4RS and SOAS observations of individual gas-phase RONO2 species
measured by the CIT-ToF-CIMS and total pRONO2 measured by an Aerosol Mass Spectrometer (AMS) (see Sect. 3 and 4).5
After partitioning to the aerosol, laboratory experiments have shown that pRONO2 can hydrolyze to form alcohols and
nitric acid via pRONO2 + H2O→ ROH + HNO3. Some pRONO2 species hydrolyze rapidly under atmospherically-relevant
conditions, while others are stable against hydrolysis over timescales significantly longer than the organic aerosol lifetime
against deposition (Darer et al., 2011; Hu et al., 2011; Liu et al., 2012; Jacobs et al., 2014; Rindelaub et al., 2015). Lifetimes
against hydrolysis inferred from bulk aqueous and reaction chamber studies range widely from minutes (Darer et al., 2011;10
Rindelaub et al., 2015) to a few hours (Liu et al., 2012; Lee et al., 2016) to nearly a day (Jacobs et al., 2014). Here we apply
a bulk lifetime against hydrolysis for the entire population of pRONO2 (similar to Pye et al., 2015). In other words, our
implementation of aerosol partitioning involves a two-step process of (1) uptake of gas-phase RONO2 to form a simplified
non-volatile pRONO2 species, with rate determined by γ, followed by (2) hydrolysis of the simplified pRONO2 species to
form HNO3, with rate determined by the lifetime against hydrolysis. These steps are de-coupled, and we do not include any15
dependence of γ on the hydrolysis rate (unlike the more detailed formulation of Marais et al. (2016)). In subsequent sections, we
compare the simplified pRONO2 formed as an intermediate during this process to total pRONO2 derived from observations.
The assumption of a single hydrolysis lifetime overestimates the loss rate of non-tertiary nitrates (Darer et al., 2011; Hu et al.,
2011) and may lead to model bias in total pRONO2, particularly in the free troposphere where the longer-lived species would
be more prevalent (see Sect. 4).20
We assume here a bulk lifetime against hydrolysis of 1 h, which we found in preliminary simulations to provide a better
simulation of pRONO2 than longer lifetimes. Our 1 h bulk hydrolysis lifetime is shorter than the 2-4 h lifetime found in recent
analysis of SOAS data and laboratory experiments (Boyd et al., 2015; Lee et al., 2016; Pye et al., 2015) - likely reflecting
the simplifying assumptions of our uptake parameterization. In any case, the choice of hydrolysis lifetime does not affect the
concentration of gas-phase RONO2 species (because pRONO2 cannot re-partition to the gas phase in the model), and we find25
this value provides a reasonable match to AMS measurements of total pRONO2 at the surface during SOAS and SEAC4RS
(see Sect. 3 and 4). Impacts on HNO3 are minor: compared to a simulation without hydrolysis, our simulation with a 1 h
lifetime against hydrolysis increased boundary layer HNO3 by 20 ppt, or 2.4%.
3 BVOCs and organic nitrates in the Southeast US
We evaluate the updated GEOS-Chem simulation using Southeast US measurements of isoprene, monoterpenes, and a suite30
of oxidation products from two field campaigns in summer 2013. SEAC4RS was a NASA aircraft campaign that took place in
August-September 2013 (Toon et al., 2016). All observations discussed in this work were taken onboard the NASA DC-8 (data
doi: 10.5067/Aircraft/SEAC4RS/Aerosol-TraceGas-Cloud), which was based in Houston, Texas with an ∼8-hour flight range.
9
SOAS was a ground-based campaign that took place in June-July 2013 at the Centreville monitoring site near Brent, Alabama
(32.903◦N, 87.250◦W).
3.1 Isoprene and monoterpenes
Understanding BVOC sources and chemistry was a primary goal of SEAC4RS, resulting in a large number of boundary layer
flights over regions of enhanced biogenic emissions (Kim et al., 2015). Isoprene and monoterpene distributions in Southeast US5
surface air (80-94.5◦W, 29.5-40◦N, and below 1 km) measured by PTR-MS are shown in Fig. 4, and their campaign-median
vertical profiles are shown in Fig. 5(b,c). Whole Air Sampler (WAS) measurements of isoprene and α-pinene + β-pinene (Fig.
S1) are similar, but with more limited sampling than the PTR-MS. All observations have been averaged to the spatial and
temporal resolution of the model.
The SOAS site is located at the edge of a mixed coniferous and deciduous forest (Nguyen et al., 2015). SOAS observations of10
isoprene and monoterpenes, measured by PTR-ToF-MS and averaged to hourly mean values, are shown in Fig. 6. Both species
display a clear diurnal cycle with peak isoprene during day, reflecting the light- and temperature-dependent source, and peak
monoterpenes at night. For monoterpenes, the figure also shows the sum of α-pinene + β-pinene as measured by 2D-GC-FID,
which indicates that these are the dominant monoterpenes.
Figures 4, 5, and 6 compare observed BVOCs from both campaigns to the GEOS-Chem simulation, sampled to match the15
observations. Similar figures for NOx can be found in Travis et al. (2016) and in Fig. S2. Model bias relative to observations
is quantified using the normalized mean bias NMB= 100%× [∑i
(Mi−Oi)/∑i
(Oi)], where Oi and Mi are the observed and
modeled values and the summation is over all hours (SOAS) or unique gridbox-timestep combinations along the flight tracks
(SEAC4RS). BVOC emissions are from MEGANv2.1 (Guenther et al., 2012) and have been decreased by 15% for isoprene
and doubled for monoterpenes to better match aircraft (isoprene, monoterpene) and satellite (formaldehyde) observations (Kim20
et al., 2015; Zhu et al., 2016). With these scalings applied, simulated surface isoprene and monoterpenes overestimate somewhat
the SEAC4RS data (Fig. 4, mainly due to a few simulated high-BVOC events), but the medians are well within the observed
variability (Fig. 5). Model high bias above 500 m is likely caused by excessive vertical mixing through the simulated boundary
layer (Travis et al., 2016). Relative to the SOAS data, simulated monoterpenes are biased low by a factor of two, while
isoprene falls within the interquartile range of the measurements. The opposite sign of the SOAS monoterpene bias relative to25
the more spatially representative SEAC4RS data suggests a low bias in MEGANv2.1 monoterpene emissions that is unique to
the Centreville gridbox; errors in vertical mixing may also contribute. For isoprene, the model reproduces both the observed
nighttime decline and the subsequent morning growth with a small delay (∼1 hour).
The observed declines in isoprene at night (Fig. 6) and above the boundary layer (Fig. 5) reflect its short lifetime against
oxidation. We find in the model that OH oxidation accounts for 90% of isoprene loss (Marais et al., 2016), but only 65%30
of monoterpenes loss (with NO3 responsible for most of the rest). For isoprene, the subsequent fate of the peroxy radicals
(ISOPO2) has been evaluated in detail by Travis et al. (2016), who also present an in-depth analysis of the NOx budget and
impacts on ozone. They show that on average 56% of ISOPO2 reaction during SEAC4RS is with NO, and that there is large
10
spatial variability in this term that is accurately reproduced by the high-resolution GEOS-Chem simulation. Here we focus
exclusively on this pathway and the resultant formation of RONO2 from both isoprene and monoterpenes.
3.2 First generation RONO2
Observed near-surface mixing ratios of first generation isoprene nitrates (ISOPN) during SEAC4RS are shown in Fig. 7 and
are generally well represented by GEOS-Chem (r = 0.61; NMB = -0.6%). ISOPN vertical profiles in Fig. 5e indicate a rapid5
decline from the boundary layer to the free troposphere, reflecting the short atmospheric lifetime (2-4 h in our simulation;
Table 1). Comparing the lowest altitude SEAC4RS observations to the SOAS median from the CIT-ToF-CIMS (black triangle)
indicates an apparent vertical gradient from the surface to ∼500 m. This could be caused by spatial variability between the
campaigns, or could reflect rapid dry deposition of ISOPN with limited vertical mixing. GEOS-Chem does not simulate this
SOAS-SEAC4RS difference, possibly due to overly strong vertical mixing through the modeled boundary layer as identified10
by Travis et al. (2016) from model comparison to SEACIONS ozonesonde observations.
During SOAS, ISOPN was measured simultaneously by the CIT-ToF-CIMS (Crounse et al., 2006; Nguyen et al., 2015)
and the Purdue CIMS (Xiong et al., 2015), and Fig. 6 shows the diurnal cycles from both. Median ISOPN from the Purdue
CIMS is a factor of two higher than that from the CIT-ToF-CIMS during daylight hours, with the most significant differences
in mid-late morning. In both datasets, ISOPN peaks around 10:00 am local time, is elevated until early evening, and declines15
to a pre-dawn minimum. Simulated ISOPN from GEOS-Chem is in good agreement with the Purdue CIMS measurements
except in the afternoon when modeled ISOPN shows a broad peak (rather than the observed decline) coincident with simulated
peak isoprene (Fig. 6). After ∼7:00 pm, the model captures the observed timing of the nighttime ISOPN decline seen in both
datasets, as well as the rapid morning growth seen in the Purdue CIMS measurements.
As described in Sect. 2.1, there is considerable uncertainty in the ISOPN yield. We find here that a 9% yield provides the20
best simulation of the ensemble of SEAC4RS and SOAS observations, given experimental constraints on oxidative loss rates
(Lee et al., 2014) and dry deposition fluxes (Nguyen et al., 2015). Using model sensitivity studies, we found that applying
a lower yield of 7% improved the agreement with the CIT-ToF-CIMS during SOAS, but worsened agreement with the other
datasets and is inconsistent with the yields from laboratory experiments (Teng et al., in preparation). We also tested a higher
yield of 12%, and found the model overestimated observed SEAC4RS and SOAS ISOPN (from both instruments) unless25
we invoked much larger aerosol uptake and/or added another ISOPN sink. ISOPN sinks (especially aerosol uptake) remain
poorly constrained, and the uncertain parameter space describing these processes likely contains multiple solutions that fit the
observations equally well (i.e., a higher yield could be accommodated by faster ISOPN loss to aerosol).
Our finding that GEOS-Chem can reproduce the Purdue CIMS ISOPN observations using a 9% ISOPN yield is consistent
with the box model of Xiong et al. (2015). The chemical mechanisms used in both studies are similar. In both simulations,30
modeled ISOPN was overestimated unless an extra sink was included (also consistent with Wolfe et al., 2015, who inferred
a missing sink based on SEAC4RS flux measurements). While we assumed this sink was due to aerosol uptake, Xiong et al.
(2015) invoked enhanced ISOPN photolysis. They argued that models typically underestimate the ISOPN absorption cross
section by not taking into account the combined influence of the double bond and hydroxyl group in the ISOPN structure
11
(Fig. 2). Xiong et al. (2015) were better able to reproduce the observed ISOPN morning peak and afternoon decline when
they increased the MCMv3.2 photolysis rate constant by a factor of 5. Including both faster ISOPN photolysis and uptake to
the aerosol phase could be a means to accommodate a higher initial ISOPN yield, such as the 12-14% yield inferred from
laboratory experiments with the CIT-ToF-CIMS (Teng et al., in preparation), although both sinks remain unverified. The nature
of the sink has implications for NOx recycling from isoprene nitrates (photolysis recycles NOx while uptake removes it), and5
this remains a source of uncertainty in our estimates of the impacts of RONO2 on the NOx budget.
Even more uncertain than ISOPN are the first generation monoterpene nitrates (MONIT). MONIT in GEOS-Chem is a
lumped species that represents the sum of monoterpene nitrates from both daytime OH-initiated and nighttime NO3-initiated
oxidation (Sect. 2.2). The nighttime oxidation cascade involves a diversity of reactants (including NO, HO2, NO3, and other
peroxy radicals) and produces a diversity of monoterpene nitrate species (Lee et al., 2016) that we do not distinguish here. In10
the model, most MONIT is produced from the NO3-initiated chemistry, resulting in mean MONIT concentrations of 30-60 ppt
at night and ∼10-20 ppt during the day.
During SOAS, two monoterpene nitrates were measured by the CIT-ToF-CIMS: C10H17NO4 and C10H17NO5. We find
that simulated MONIT shows the same diurnal pattern as the sum of the two measured species (with peak concentrations at
night) but is a factor of 2-3 higher (Fig. S3). Pye et al. (2015) similarly found simulated MONIT was a factor of 7 higher15
than observations using a version of the CMAQ model with explicit MONIT chemistry. The higher modeled values in both
studies presumably reflect inclusion in modeled MONIT of many species that were not measured by CIT-ToF-CIMS (including
several identified during SOAS by Lee et al., 2016), as well as biases in the model mechanisms (most of the rate constants
and products have not been measured). NO3-initiated monoterpene oxidation is particularly uncertain and is likely too strong
in GEOS-Chem, as indicated by large nighttime MONIT overestimates (Fig. S3) combined with monoterpene underestimates20
(Fig. 6). Simulated nighttime peak values of NO3-derived isoprene nitrates (ISN1) during SOAS are also up to a factor of 2
higher than the observations reported by Schwantes et al. (2015). This suggests that model biases in nighttime PBL heights
and associated vertical mixing may also contribute to simulated nighttime overestimates for some RONO2 species.
3.3 Second generation RONO2 and pRONO2
First generation ISOPN and MONIT undergo further oxidation to form a suite of second generation RONO2 species that retain25
the nitrate functionality (Figs. 2, 3). Four of these species (MVKN, MACRN, PROPNN, and ETHLN) were measured by the
CIT-ToF-CIMS, with vertical profiles shown in Fig. 5 (f-h) and spatial distribution shown in Fig. 7. The model provides a
good simulation of SEAC4RS MVKN+MACRN but underestimates the variability of PROPNN and ETHLN. In contrast, all
three species show positive mean model biases relative to the SOAS surface observations. The model tends to overestimate
PROPNN and ETHLN at night but underestimate them during the day (Fig. S3), reflecting the assumption in our mechanism30
that PROPNN is produced at night during NO3-initiated isoprene oxidation. In reality, the nighttime chemistry produces
INs that only photo-oxidize to PROPNN after sunrise (Schwantes et al., 2015). This missing delay between nighttime NO3
addition and subsequent daytime photo-oxidation likely also explains the model bias relative to the SEAC4RS observations,
which mostly took place during daytime. Additional simplifications in the NO3-initiated chemistry could also contribute to
12
the biases, and preliminary simulations conducted with the AM3 model show that including more details of this chemistry
improves model ability to match observed PROPNN (Li et al., in preparation). Some of the bias may also be due to error in
the assumed distribution between β- and δ-channel OH-initiated oxidation, as both PROPNN and ETHLN are produced by the
latter channel only.
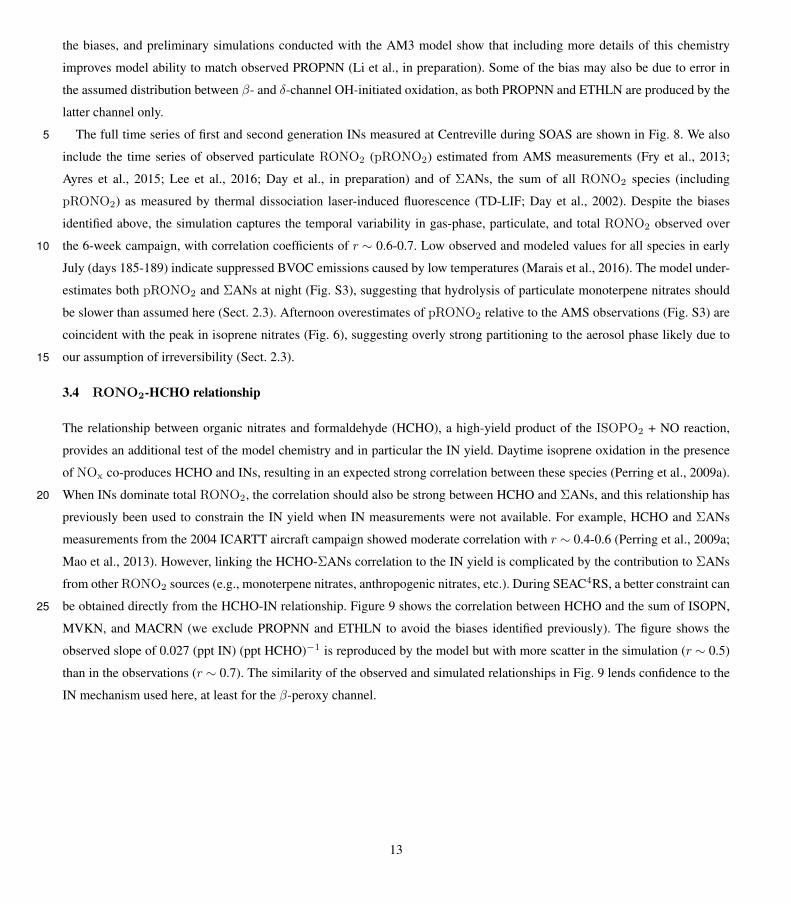
The full time series of first and second generation INs measured at Centreville during SOAS are shown in Fig. 8. We also5
include the time series of observed particulate RONO2 (pRONO2) estimated from AMS measurements (Fry et al., 2013;
Ayres et al., 2015; Lee et al., 2016; Day et al., in preparation) and of ΣANs, the sum of all RONO2 species (including
pRONO2) as measured by thermal dissociation laser-induced fluorescence (TD-LIF; Day et al., 2002). Despite the biases
identified above, the simulation captures the temporal variability in gas-phase, particulate, and total RONO2 observed over
the 6-week campaign, with correlation coefficients of r ∼ 0.6-0.7. Low observed and modeled values for all species in early10
July (days 185-189) indicate suppressed BVOC emissions caused by low temperatures (Marais et al., 2016). The model under-
estimates both pRONO2 and ΣANs at night (Fig. S3), suggesting that hydrolysis of particulate monoterpene nitrates should
be slower than assumed here (Sect. 2.3). Afternoon overestimates of pRONO2 relative to the AMS observations (Fig. S3) are
coincident with the peak in isoprene nitrates (Fig. 6), suggesting overly strong partitioning to the aerosol phase likely due to
our assumption of irreversibility (Sect. 2.3).15
3.4 RONO2-HCHO relationship
The relationship between organic nitrates and formaldehyde (HCHO), a high-yield product of the ISOPO2 + NO reaction,
provides an additional test of the model chemistry and in particular the IN yield. Daytime isoprene oxidation in the presence
of NOx co-produces HCHO and INs, resulting in an expected strong correlation between these species (Perring et al., 2009a).
When INs dominate total RONO2, the correlation should also be strong between HCHO and ΣANs, and this relationship has20
previously been used to constrain the IN yield when IN measurements were not available. For example, HCHO and ΣANs
measurements from the 2004 ICARTT aircraft campaign showed moderate correlation with r ∼ 0.4-0.6 (Perring et al., 2009a;
Mao et al., 2013). However, linking the HCHO-ΣANs correlation to the IN yield is complicated by the contribution to ΣANs
from other RONO2 sources (e.g., monoterpene nitrates, anthropogenic nitrates, etc.). During SEAC4RS, a better constraint can
be obtained directly from the HCHO-IN relationship. Figure 9 shows the correlation between HCHO and the sum of ISOPN,25
MVKN, and MACRN (we exclude PROPNN and ETHLN to avoid the biases identified previously). The figure shows the
observed slope of 0.027 (ppt IN) (ppt HCHO)−1 is reproduced by the model but with more scatter in the simulation (r ∼ 0.5)
than in the observations (r ∼ 0.7). The similarity of the observed and simulated relationships in Fig. 9 lends confidence to the
IN mechanism used here, at least for the β-peroxy channel.
13

4 Total alkyl and multifunctional nitrates (ΣANs)
4.1 Speciated versus total RONO2
SEAC4RS represents one of the first airborne campaigns to make measurements of individual BVOC-derived RONO2 species.
Without these speciated measurements, previous model evaluations of isoprene nitrate chemistry have relied on TD-LIF obser-
vations of ΣANs (total RONO2), with the assumption that gas-phase INs account for the majority of ΣANs (Horowitz et al.,5
2007; Perring et al., 2009a; Mao et al., 2013; Xie et al., 2013). Figure 10a compares the TD-LIF ΣANs measurement (solid
line) to the sum of explicitly measured gas-phase RONO2 species and total pRONO2 (dashed line, combined CIT-ToF-CIMS,
WAS, and AMS measurements) during SEAC4RS. The figure shows a large gap between measured ΣANs and the total of
speciated RONO2 (including both gas-phase and aerosol contributions), especially near the surface (ΣANs = 409 ppt, total
speciated RONO2 = 198 ppt). Figure 10a also shows the median surface ΣANs measured during SOAS (198 ppt; black trian-10
gle). As for SEAC4RS, SOAS total speciated RONO2 is much lower (82 ppt) when calculated from the CIT-ToF-CIMS and
AMS measurements. The gap is smaller, but still exists, when calculated using ISOPN from the Purdue CIMS (total RONO2
= 102 ppt) or pRONO2 from the TD-LIF (total RONO2 = 139 ppt). An independent thermal dissociation instrument operated
by the SouthEastern Aerosol Research and Characterization (SEARCH) Network also measured ΣANs at the SOAS site and
showed values that were 80 ppt higher than measured by the TD-LIF (but generally well correlated, with slope close to 1 and15
r ∼ 0.8).
Some of the difference between the total speciated RONO2 and ΣANs measurements can be attributed to gas-phase nitrates
not measured by CIT-ToF-CIMS or WAS. A number of these were identified during SOAS using a second ToF-CIMS operated
by the University of Washington (Lee et al., 2016). In addition, SEAC4RS observations of total NOy (≡NOx+HNO3+PAN+RONO2,
including pRONO2) are better balanced by including the ΣANs than the speciated RONO2 components (≈81% vs. 70% of20
surface NOy, compared to 56% with no RONO2 contribution). Also contributing to the discrepancy are the large uncertainties
still associated with RONO2 measurement techniques. Lee et al. (2016) found that SOAS measurements of pRONO2 differ
by factors of 2-4, as also shown in Fig. S3, with the AMS lower than TD-LIF. Similarly, we showed in Sect. 3 that the two
SOAS measurements of ISOPN differ by up to a factor of 2 (CIT-ToF-CIMS lower than Purdue CIMS, for reasons that remain
unclear). Assuming similar uncertainties characterize the SEAC4RS RONO2 measurements, these could readily explain some25
of the inability of the speciated measurements to close the ΣANs budget in Fig. 10a.
Comparison of GEOS-Chem to the two total RONO2 estimates in Fig. 10a shows that the model greatly underestimates
SEAC4RS ΣANs relative to the TD-LIF measurement, with a much smaller underestimate relative to the speciated sum. The
better fit to the speciated measurements than to the ΣANs is consistent with the model’s ability to match both individual gas-
phase RONO2 species measured by the CIT-ToF-CIMS and total pRONO2 measured by the AMS (Sect. 3). During SOAS,30
Fig. 8 shows that GEOS-Chem can reproduce much of the temporal variability in the ΣANs (r = 0.57) with little bias.
14

4.2 RONO2 composition
Figure 10b compares the observed and simulated RONO2 composition in the Southeast US during SEAC4RS. For clarity, only
the speciated measurements are shown in the figure. The observations show a constant 20-30 ppt background at all altitudes
from small (C1-C3) RONO2 produced from anthropogenic VOCs. The contributions of these small nitrates are consistent
with the observed concentrations of their parent VOCs and with known reaction rate constants (Atkinson and Arey, 2003),5
RONO2 yields (Perring et al., 2013), and RONO2 lifetimes (Talukdar et al., 1997; Dahl et al., 2005; Worton et al., 2010)
assuming steady state. GEOS-Chem does not simulate these nitrates under the assumption that their contributions to total
NOy are insignificant. The SEAC4RS data clearly show that this assumption is not valid, at least for the US where natural
gas production is a large alkane source, and is contributing to model bias in both RONO2 and NOy. Given the long lifetimes
(weeks-months) of the small nitrates, the bias is particularly acute in the free troposphere and has implications for global N10
export.
In both observations and model, gas-phase INs (orange) account for half of speciated RONO2 (25% of ΣANs), split roughly
equally between 1st and 2nd generation species. The model underestimates somewhat the 2nd generation INs, as seen previ-
ously in Figs. 5 and 7. In the model, gas-phase MTNs from monoterpenes (blue; not measured during SEAC4RS) account for
an additional 10% of simulated RONO2 (∼5% relative to ΣANs). Previous studies during ICARTT also found a 10% MTN15
contribution to RONO2 (Horowitz et al., 2007; Perring et al., 2009a), although MTNs have been neglected in more recent
simulations (e.g., Mao et al., 2013; Xie et al., 2013). Other C4-C5 nitrates (yellow, including alkyl nitrates from WAS and
alkene hydroxynitrates from CIT-ToF-CIMS) similarly contribute 5-10% of observed RONO2; these are underestimated by
50% in GEOS-Chem because the model does not include nitrate formation from anthropogenic alkenes.
A significant fraction (10-20%) of RONO2 was in the aerosol phase during SEAC4RS. The model underestimates the20
observed pRONO2 contribution in the free troposphere; however, some caution should be used when interpreting these data.
Observed pRONO2 is the product of measured total aerosol nitrate and the measured organic fraction of the nitrate aerosol,
but during SEAC4RS the organic fraction was often not reported in the free troposphere due to interference from dust layers
and instrumental issues. In these instances, the organic fraction of measured nitrate is assumed to be 0.8, based largely on
surface measurements from multiple campaigns (Day et al., in preparation). In the free troposphere (>1.5 km), this assumption25
is applied to 85% of the SEAC4RS 1-minute data, and could lead to a high bias in the pRONO2 observations. Nonetheless, it
is also likely that simulated pRONO2 is underestimated because of our assumption that all pRONO2 species undergo rapid
hydrolysis. In fact, many of the nitrates produced from BVOC oxidation are not expected to hydrolyze at all (Boyd et al., 2015;
Pye et al., 2015) and so would have lifetimes sufficiently long for export out of the boundary layer.
Our simulated RONO2 composition in Fig. 10b suggests a less important role for INs than identified from recent simulations30
of the ICARTT data. In an earlier version of GEOS-Chem, INs alone could explain all measured ΣANs during ICARTT (∼200
ppt at the surface; Mao et al., 2013), and both that model and a CMAQ simulation (Xie et al., 2013) suggested INs were
dominated by 2nd generation species (70-90% of total INs). These earlier simulations did not account for either aerosol uptake
and possible hydrolysis (Darer et al., 2011; Jacobs et al., 2014) or fast photolysis (Müller et al., 2014) of 2nd generation
15
INs, and so lifetimes were significantly longer than in our simulation. We performed sensitivity simulations without these
additional IN sinks and found that the model overestimated observed 2nd generation INs by a factor of 3-5 during SEAC4RS.
It seems likely that 2nd generation IN overestimates in previous work were compensated for by omitting the contributions
from MTNs and pRONO2. Here, we find MTN and pRONO2 combined contribute as much to total RONO2 as either 1st or
2nd generation INs alone, and that excluding them would lead to major model shortcomings. The pRONO2 contribution is5
especially important as different removal processes for gas-phase versus particulate species would have different implications
for NOx budgets and N deposition.
5 Fate of organic nitrates and implications for nitrogen budgets
Table 1 summarizes the dominant fates and lifetimes of individual gas-phase RONO2 in the Southeast US boundary layer
during the SEAC4RS campaign (12 Aug - 23 Sep) as calculated from GEOS-Chem. The contribution of different fates to total10
gas-phase RONO2 loss is illustrated in Fig. 11a. Loss processes that recycle RONO2 by converting between RONO2 species
(e.g., from first to second generation) are not included. Total simulated RONO2 loss is dominated by aerosol hydrolysis, with
an additional large loss to deposition that is consistent with the rapid deposition fluxes of both INs and MTNs observed during
SOAS (Nguyen et al., 2015). The large predicted losses to aerosol influence simulation of both pRONO2 (for which uptake is
the only source in the model) and HNO3 (which is produced during pRONO2 hydrolysis). We find here that our simulation15
including a large sink to aerosol is consistent with observed surface pRONO2 concentrations and variability (Figs. 8 and
10), HNO3 concentrations (Travis et al., 2016, Fig. 2), and nitrate wet deposition fluxes (Travis et al., 2016, Fig. 3) during
SEAC4RS and SOAS.
Overall, more than 80% of simulated gas-phase RONO2 are lost via processes that irreversibly remove nitrogen from the
atmosphere (deposition, aerosol hydrolysis). The remainder is primarily lost via photolysis, driven largely by the fast photolysis20
of 2nd generation carbonyl INs (Müller et al., 2014). Romer et al. (2016) similarly found that terminal NOx sinks dominated
RONO2 loss processes during SOAS, responsible for 55% ± 20% of total loss, primarily due to aerosol hydrolysis. RONO2
lifetimes are too short (minutes-hours, Table 1 and Romer et al., 2016) for significant transport to occur, and simulated RONO2
loss typically occurs only a short distance from sources. Summed over the Southeast US domain, we find gross RONO2
production and loss are roughly balanced (640 Mg N d−1). This balance implies that BVOC-derived gas-phase RONO2 are25
not generally exported from the Southeast US, in agreement with earlier work (Horowitz et al., 2007; Hudman et al., 2007; Fang
et al., 2010; Mao et al., 2013). However, this calculation excludes the longer-lived small alkyl nitrates and non-hydrolyzing
particulate nitrates not simulated in GEOS-Chem (Sect. 4). These may be an important source of exported reactive nitrogen,
and their inclusion should be a priority for future model development.
The impacts of RONO2 production and other loss processes on the NOx budget are shown in Fig. 11b for the Southeast US30
boundary layer in August-September 2013. Non-RONO2 losses in the figure are mainly HNO3 formation, with an additional
contribution from PANs (relevant in regions with elevated NOx; Browne and Cohen, 2012). We find in the model that gross
NOx loss due to RONO2 production is 35 Gg N over this period. As shown in Fig. 11a, only 23% of this RONO2 (8 Gg N)
16
goes on to recycle NOx. We therefore find that RONO2 production serves as a net NOx sink of 27 Gg N in the Southeast US
in summer, equivalent to 21% of NOx emitted in this region and season.
These regional-scale averages conceal important spatial variability. Figure 12 shows how the NOx sink due to RONO2
production varies spatially across the Southeast US in summer, and how this depends on the ratio between BVOC and NOx
emissions (EBV OC/ENOx). The fractional NOx sink to RONO2 is strongly correlated (r = 0.90) to the EBV OC/ENOx ratio.5
Our finding that RONO2 production dominates NOx loss in very low NOx environments is consistent with an earlier analysis
for boreal Canada (Browne and Cohen, 2012), which found the fractional sink to RONO2 approached unity for [NOx] < 50
ppt, and with analysis of a subset of the SEAC4RS data from the low-NOx Ozarks Mountains (Wolfe et al., 2015).
Figure 12c shows how the fractional NOx sink to RONO2 (blue) and the EBV OC/ENOx emission ratio (red) vary as a
function of NOx emissions (gray, shown as their cumulative distribution binned into 5% quantiles). Both are inversely related10
to NOx emissions. We see from the figure that RONO2 production is the dominant NOx sink for regions that account for the
lowest 5% of total Southeast US NOx emissions (leftmost bar in Fig. 12c), but the importance of the sink drops off rapidly as
NOx emissions increase. By the time 30% of the regional NOx emissions are accounted for, the fractional sink has dropped to
0.2, and from there continues to decline to a minimum of 0.03 in the highest-emitting regions.
The mean EBV OC/ENOx ratio averaged over the Southeast US is 5.3 and is highlighted as the white point in Fig. 12c. The15
figure shows that most Southeast US NOx emission (∼65%) occurs at EBV OC/ENOx ratios that are significantly lower than
the regional mean, highlighting the significant spatial segregation between NOx and BVOC emissions in this region (Yu et al.,
2016).
Emissions projections for the Southeast US anticipate continued decreases in NOx emissions (and concomitant increases in
theEBV OC/ENOx ratio). While these changes should increase the importance of RONO2 for the NOx budget, the relationship20
shown in Fig. 12c suggests very large emissions decreases will be necessary before RONO2 becomes a major regional sink
for NOx. The figure shows that the sink to RONO2 is only sensitive to NOx emissions in regions where they are already
low: a 10% decrease in total Southeast US NOx emissions (e.g., a leftward shift by two bars in the figure) would increase the
importance of the sink by less than 0.5%. The actual rate at which NOx emissions in the Southeast US will decrease varies
widely among different projections. Under the Representative Concentration Pathway 8.5 (RCP8.5), for example, the Southeast25
US would see a decrease (relative to 2013 emissions) of 45% by 2050 to ∼1300 Mg N d−1; according to Fig. 12, the RONO2
sink would still only account for about 10% of the loss in the highest emitting regions. Under the more aggressive RCP4.5,
emissions would decline by 65% to ∼800 Mg N day−1 in 2050. At this stage, the RONO2 sink would become significant
(>20%) throughout the region.
6 Conclusions30
We have used airborne and ground-based observations from two summer 2013 campaigns in the Southeast US (SEAC4RS,
SOAS) to better understand the chemistry and impacts of alkyl and multi-functional organic nitrates (RONO2). We used
the observations, along with findings from recent laboratory, field, and modeling studies, to update and evaluate biogenic
17
volatile organic compound (BVOC) oxidation schemes in the GEOS-Chem chemical transport model (CTM). From there, we
used the updated CTM with 0.25◦× 0.3125◦ (∼ 25× 25 km2) horizontal resolution to examine RONO2 speciation, chemical
production/loss processes, and importance as a sink for NOx.
Our improved mechanism provides a state-of-the-science description of isoprene oxidation in the presence of NOx, with
updates including a 9% isoprene nitrate (IN) yield (Xiong et al., 2015), an increase in the population of β- vs δ-hydroxyl5
isomers (Peeters et al., 2014), revised IN reaction rate constants and products (Jacobs et al., 2014; Lee et al., 2014), fast
photolysis of carbonyl INs (Müller et al., 2014), rapid IN dry deposition (Nguyen et al., 2015), and a simplified scheme for
aerosol partitioning of soluble INs (Xu et al., 2014; Marais et al., 2016) followed by particle-phase hydrolysis (Jacobs et al.,
2014; Rindelaub et al., 2015). For the first time in GEOS-Chem, we have also added both OH- and NO3-initiated monoterpene
oxidation leading to the formation of monoterpene nitrates (MTNs), with similar loss processes as for INs. With these updates,10
GEOS-Chem simulates surface-level BVOC and RONO2 mixing ratios that are generally within the observed variability of
the SEAC4RS and SOAS data.
Observed first generation IN (ISOPN) variability is generally reproduced without bias by GEOS-Chem, except at midday
when modeled ISOPN peaks while SOAS observations indicate a gradual decline. For second generation INs, the model
shows more skill for species produced primarily from β–hydroxyl isomers (MVKN+MACRN) than those from δ-hydroxyl15
isomers and NO3-initiated chemistry (PROPNN+ETHLN). For the latter, GEOS-Chem underestimates both magnitudes and
variability relative to the SEAC4RS observations. While this could imply a more important role for δ-channel oxidation than
included in our mechanism, theoretical considerations suggest that our assumed δ-hydroxyl contribution is already an upper
limit (Peeters et al., 2014), and more measurements are needed to reconcile these theoretical and observational constraints.
Better understanding of nighttime NO3-initiated isoprene oxidation could also play an important role in improving simulation20
of second generation INs.
The SEAC4RS observations imply that gas-phase INs account for 25-50% of total surface RONO2, much less than inferred
from previous modeling studies (Mao et al., 2013; Xie et al., 2013). GEOS-Chem reproduces this contribution and attributes
an additional 10% of RONO2 to MTNs. Both observations and model show 10-20% of the remaining RONO2 at the surface
is in the particle phase (pRONO2). In the free troposphere, GEOS-Chem greatly underestimates total RONO2 by ignoring25
contributions from small, long-lived nitrates derived from anthropogenic VOCs and from non-hydrolyzing particulate species.
This has a significant impact on simulation of reactive nitrogen export from the United States and should be remedied in future
model development.
We find in the model that formation of pRONO2 via aerosol uptake, followed by particle-phase hydrolysis, is the dominant
loss process for gas-phase RONO2. Including this large sink to aerosol results in simulated RONO2, pRONO2 and HNO330
mixing ratios and nitrate deposition fluxes that are consistent with observations. RONO2 loss via deposition is also significant,
with RONO2 (both gas-phase and particulate) responsible for ∼3% of total N deposition over the Southeast US in summer.
Overall, less than a quarter of simulated gas-phase RONO2 loss recycles atmospheric NOx. We find in the model that
RONO2 production accounts for 21% of the net sink of NOx emitted in the Southeast US in summer. RONO2 production is
the dominant NOx sink only in regions where elevated BVOC emissions are paired with very low NOx emissions. Elsewhere,35
18
the importance of the sink declines rapidly as a function of NOx emissions. Most of the Southeast US NOx is emitted in
locations where BVOC emissions are relatively low, limiting the importance of RONO2 as a NOx sink.
Southeast US NOx emissions have been declining for the past two decades (Hidy et al., 2014; Simon et al., 2015) and further
reductions are projected (Lamarque et al., 2011; EPA, 2014). Previous studies have suggested these declines will trigger a more
important role for RONO2 as a NOx sink in future (Browne and Cohen, 2012). In contrast, we find here that the NOx sink to5
RONO2 is only sensitive to NOx emissions in regions where they are already low because of the spatial segregation between
NOx and BVOC emissions. We find that a 10% decrease in Southeast US NOx emissions would enhance the importance of this
sink by less than 0.5%. HNO3 formation and deposition is likely to remain the dominant sink for NOx even as NOx emissions
decrease.
Acknowledgements. We are grateful to the entire NASA SEAC4RS team for their help in the field, and we thank Eleanor Browne and Fabien10
Paulot for helpful discussions about the monoterpene nitrate scheme. This work was funded by a University of Wollongong Vice Chancellor’s
Postdoctoral Fellowship to JAF and by the NASA Tropospheric Chemistry Program. This research was undertaken with the assistance of
resources provided at the NCI National Facility systems at the Australian National University through the National Computational Merit
Allocation Scheme supported by the Australian Government. JM acknowledge supports from the NOAA Climate Program Office grant
NA13OAR4310071. JLJ, PCJ, WH, and DAD were supported by NASA NNX15AH33A and NNX15AT96G, NSF AGS-1243354 and AGS-15
1360834, and EPRI 10004734. Isoprene and monoterpene measurements during SEAC4RS were supported by the Austrian Federal Ministry
for Transport, Innovation and Technology (bmvit) through the Austrian Space Applications Programme (ASAP) of the Austrian Research
Promotion Agency (FFG). AW and TM received support from the Visiting Scientist Program at the National Institute of Aerospace (NIA).
19
References
Amos, H. M., Jacob, D. J., Holmes, C. D., Fisher, J. A., Wang, Q., Yantosca, R. M., Corbitt, E. S., Galarneau, E., Rutter, A. P., Gustin,
M. S., Steffen, A., Schauer, J. J., Graydon, J. A., Louis, V. L. S., Talbot, R. W., Edgerton, E. S., Zhang, Y., and Sunderland, E. M.: Gas-
particle partitioning of atmospheric Hg(II) and its effect on global mercury deposition, Atmospheric Chemistry and Physics, 12, 591–603,
doi:10.5194/acp-12-591-2012, http://www.atmos-chem-phys.net/12/591/2012/, 2012.5
Aschmann, S. M., Atkinson, R., and Arey, J.: Products of reaction of OH radicals with alpha-pinene, J. Geophys. Res., 107,
doi:10.1029/2001jd001098, http://dx.doi.org/10.1029/2001JD001098, 2002.
Atkinson, R. and Arey, J.: Atmospheric Degradation of Volatile Organic Compounds, Chemical Reviews, 103, 4605–4638,
doi:10.1021/cr0206420, http://dx.doi.org/10.1021/cr0206420, pMID: 14664626, 2003.
Ayres, B. R., Allen, H. M., Draper, D. C., Brown, S. S., Wild, R. J., Jimenez, J. L., Day, D. A., Campuzano-Jost, P., Hu, W., de Gouw, J.,10
Koss, A., Cohen, R. C., Duffey, K. C., Romer, P., Baumann, K., Edgerton, E., Takahama, S., Thornton, J. A., Lee, B. H., Lopez-Hilfiker,
F. D., Mohr, C., Wennberg, P. O., Nguyen, T. B., Teng, A., Goldstein, A. H., Olson, K., and Fry, J. L.: Organic nitrate aerosol formation via
NO3 + biogenic volatile organic compounds in the southeastern United States, Atmospheric Chemistry and Physics, 15, 13 377–13 392,
doi:10.5194/acp-15-13377-2015, http://www.atmos-chem-phys.net/15/13377/2015/, 2015.
Barnes, I., Becker, K. H., and Zhu, T.: Near UV absorption spectra and photolysis products of difunctional organic nitrates: Possible15
importance as NO x reservoirs, Journal of Atmospheric Chemistry, 17, 353–373, doi:10.1007/BF00696854, http://dx.doi.org/10.1007/
BF00696854, 1993.
Beaver, M. R., St. Clair, J. M., Paulot, F., Spencer, K. M., Crounse, J. D., LaFranchi, B. W., Min, K. E., Pusede, S. E., Wooldridge, P. J.,
Schade, G. W., Park, C., Cohen, R. C., and Wennberg, P. O.: Importance of biogenic precursors to the budget of organic nitrates: ob-
servations of multifunctional organic nitrates by CIMS and TD-LIF during BEARPEX 2009, Atmospheric Chemistry and Physics, 12,20
5773–5785, doi:10.5194/acp-12-5773-2012, http://www.atmos-chem-phys.net/12/5773/2012/, 2012.
Boyd, C. M., Sanchez, J., Xu, L., Eugene, A. J., Nah, T., Tuet, W. Y., Guzman, M. I., and Ng, N. L.: Secondary organic aerosol forma-
tion from the β-pinene+NO3 system: effect of humidity and peroxy radical fate, Atmospheric Chemistry and Physics, 15, 7497–7522,
doi:10.5194/acp-15-7497-2015, http://www.atmos-chem-phys.net/15/7497/2015/, 2015.
Brown, S. S., deGouw, J. A., Warneke, C., Ryerson, T. B., Dubé, W. P., Atlas, E., Weber, R. J., Peltier, R. E., Neuman, J. A., Roberts,25
J. M., Swanson, A., Flocke, F., McKeen, S. A., Brioude, J., Sommariva, R., Trainer, M., Fehsenfeld, F. C., and Ravishankara, A. R.:
Nocturnal isoprene oxidation over the Northeast United States in summer and its impact on reactive nitrogen partitioning and secondary
organic aerosol, Atmospheric Chemistry and Physics, 9, 3027–3042, doi:10.5194/acp-9-3027-2009, http://www.atmos-chem-phys.net/9/
3027/2009/, 2009.
Brown, S. S., Dubé, W. P., Bahreini, R., Middlebrook, A. M., Brock, C. A., Warneke, C., de Gouw, J. A., Washenfelder, R. A., Atlas, E.,30
Peischl, J., Ryerson, T. B., Holloway, J. S., Schwarz, J. P., Spackman, R., Trainer, M., Parrish, D. D., Fehshenfeld, F. C., and Ravishankara,
A. R.: Biogenic VOC oxidation and organic aerosol formation in an urban nocturnal boundary layer: aircraft vertical profiles in Hous-
ton, TX, Atmospheric Chemistry and Physics, 13, 11 317–11 337, doi:10.5194/acp-13-11317-2013, http://www.atmos-chem-phys.net/13/
11317/2013/, 2013.
Browne, E. C. and Cohen, R. C.: Effects of biogenic nitrate chemistry on the NOx lifetime in remote continental regions, Atmospheric35
Chemistry and Physics, 12, 11 917–11 932, doi:10.5194/acp-12-11917-2012, http://dx.doi.org/10.5194/acp-12-11917-2012, 2012.
20
Browne, E. C., Wooldridge, P. J., Min, K.-E., and Cohen, R. C.: On the role of monoterpene chemistry in the remote continental boundary
layer, Atmospheric Chemistry and Physics, 14, 1225–1238, doi:10.5194/acp-14-1225-2014, http://dx.doi.org/10.5194/acp-14-1225-2014,
2014.
Chen, X., Hulbert, D., and Shepson, P. B.: Measurement of the organic nitrate yield from OH reaction with isoprene, Journal of Geophysical
Research: Atmospheres (1984–2012), 103, 25 563–25 568, 1998.5
Crounse, J. D., McKinney, K. A., Kwan, A. J., and Wennberg, P. O.: Measurement of Gas-Phase Hydroperoxides by Chemical Ioniza-
tion Mass Spectrometry, Analytical Chemistry, 78, 6726–6732, doi:10.1021/ac0604235, http://dx.doi.org/10.1021/ac0604235, pMID:
17007490, 2006.
Dahl, E. E., Yvon-Lewis, S. A., and Saltzman, E. S.: Saturation anomalies of alkyl nitrates in the tropical Pacific Ocean, Geophysical
Research Letters, 32, n/a–n/a, doi:10.1029/2005GL023896, http://dx.doi.org/10.1029/2005GL023896, l20817, 2005.10
Darer, A. I., Cole-Filipiak, N. C., O’Connor, A. E., and Elrod, M. J.: Formation and Stability of Atmospherically Relevant Isoprene-Derived
Organosulfates and Organonitrates, Environmental Science & Technology, 45, 1895–1902, doi:10.1021/es103797z, http://dx.doi.org/10.
1021/es103797z, pMID: 21291229, 2011.
Day, D. A., Wooldridge, P. J., Dillon, M. B., Thornton, J. A., and Cohen, R. C.: A thermal dissociation laser-induced fluorescence instrument
for in situ detection of NO2, peroxy nitrates, alkyl nitrates, and HNO3, Journal of Geophysical Research: Atmospheres, 107, ACH 4–1–15
ACH 4–14, doi:10.1029/2001JD000779, http://dx.doi.org/10.1029/2001JD000779, 2002.
Day, D. A., Liu, S., Russell, L. M., and Ziemann, P. J.: Organonitrate group concentrations in submicron particles
with high nitrate and organic fractions in coastal southern California, Atmospheric Environment, 44, 1970 – 1979,
doi:http://dx.doi.org/10.1016/j.atmosenv.2010.02.045, http://www.sciencedirect.com/science/article/pii/S1352231010001846, 2010.
Day, D. A., Campuzano-Jost, P., Palm, B. B., Hu, W., Nault, B. A., Wooldridge, P. J., Cohen, R. C., Docherty, K. S., Wagner, N. L., and20
Jimenez, J.-L.: Observations of particle organic nitrate from airborne and ground platforms in North America: Insights into vertical and
geographical distributions, gas/particle partitioning, losses, and contributions to total particle nitrate, in preparation.
EPA: U.S. Environmental Protection Agency, Technical Support Document (TSD): preparation of Emissions Inventories for the Version 6.1,
2011 Emissions Modeling Platform, Tech. rep., U.S. Environmental Protection Agency, 2014.
Fang, Y., Fiore, A. M., Horowitz, L. W., Levy, H., Hu, Y., and Russell, A. G.: Sensitivity of the NOy budget over the United States to25
anthropogenic and lightning NOx in summer, Journal of Geophysical Research: Atmospheres, 115, n/a–n/a, doi:10.1029/2010JD014079,
http://dx.doi.org/10.1029/2010JD014079, d18312, 2010.
Fiore, A. M., Horowitz, L. W., Purves, D. W., Levy, H., Evans, M. J., Wang, Y., Li, Q., and Yantosca, R. M.: Evaluating the contribution
of changes in isoprene emissions to surface ozone trends over the eastern United States, Journal of Geophysical Research: Atmospheres,
110, n/a–n/a, doi:10.1029/2004JD005485, http://dx.doi.org/10.1029/2004JD005485, d12303, 2005.30
Fischer, E. V., Jacob, D. J., Yantosca, R. M., Sulprizio, M. P., Millet, D. B., Mao, J., Paulot, F., Singh, H. B., Roiger, A., Ries, L., Talbot,
R., Dzepina, K., and Pandey Deolal, S.: Atmospheric peroxyacetyl nitrate (PAN): a global budget and source attribution, Atmospheric
Chemistry and Physics, 14, 2679–2698, doi:10.5194/acp-14-2679-2014, http://www.atmos-chem-phys.net/14/2679/2014/, 2014.
Fry, J. L., Kiendler-Scharr, A., Rollins, A. W., Wooldridge, P. J., Brown, S. S., Fuchs, H., Dubé, W., Mensah, A., dal Maso, M., Tillmann, R.,
Dorn, H.-P., Brauers, T., and Cohen, R. C.: Organic nitrate and secondary organic aerosol yield from NO3 oxidation of β-pinene evaluated35
using a gas-phase kinetics/aerosol partitioning model, Atmospheric Chemistry and Physics, 9, 1431–1449, doi:10.5194/acp-9-1431-2009,
http://www.atmos-chem-phys.net/9/1431/2009/, 2009.
21
Fry, J. L., Draper, D. C., Zarzana, K. J., Campuzano-Jost, P., Day, D. A., Jimenez, J. L., Brown, S. S., Cohen, R. C., Kaser, L., Hansel,
A., Cappellin, L., Karl, T., Hodzic Roux, A., Turnipseed, A., Cantrell, C., Lefer, B. L., and Grossberg, N.: Observations of gas- and
aerosol-phase organic nitrates at BEACHON-RoMBAS 2011, Atmospheric Chemistry and Physics, 13, 8585–8605, doi:10.5194/acp-13-
8585-2013, http://www.atmos-chem-phys.net/13/8585/2013/, 2013.
Fry, J. L., Draper, D. C., Barsanti, K. C., Smith, J. N., Ortega, J., Winkler, P. M., Lawler, M. J., Brown, S. S., Edwards, P. M., Cohen,5
R. C., and Lee, L.: Secondary Organic Aerosol Formation and Organic Nitrate Yield from NO 3 Oxidation of Biogenic Hydrocarbons,
Environmental Science & Technology, 48, 11 944–11 953, doi:10.1021/es502204x, http://dx.doi.org/10.1021/es502204x, 2014.
Goliff, W. S., Stockwell, W. R., and Lawson, C. V.: The regional atmospheric chemistry mechanism, version 2, Atmospheric Environment, 68,
174 – 185, doi:http://dx.doi.org/10.1016/j.atmosenv.2012.11.038, http://www.sciencedirect.com/science/article/pii/S1352231012011065,
2013.10
Guenther, A. B., Jiang, X., Heald, C. L., Sakulyanontvittaya, T., Duhl, T., Emmons, L. K., and Wang, X.: The Model of Emissions of Gases
and Aerosols from Nature version 2.1 (MEGAN2.1): an extended and updated framework for modeling biogenic emissions, Geoscientific
Model Development, 5, 1471–1492, doi:10.5194/gmd-5-1471-2012, http://www.geosci-model-dev.net/5/1471/2012/, 2012.
Hidy, G. M., Blanchard, C. L., Baumann, K., Edgerton, E., Tanenbaum, S., Shaw, S., Knipping, E., Tombach, I., Jansen, J., and Wal-
ters, J.: Chemical climatology of the southeastern United States, 1999-2013, Atmospheric Chemistry and Physics, 14, 11 893–11 914,15
doi:10.5194/acp-14-11893-2014, http://dx.doi.org/10.5194/acp-14-11893-2014, 2014.
Horowitz, L. W., Liang, J., Gardner, G. M., and Jacob, D. J.: Export of reactive nitrogen from North America during summertime: Sensitivity
to hydrocarbon chemistry, Journal of Geophysical Research: Atmospheres (1984–2012), 103, 13 451–13 476, 1998.
Horowitz, L. W., Fiore, A. M., Milly, G. P., Cohen, R. C., Perring, A., Wooldridge, P. J., Hess, P. G., Emmons, L. K., and Lamar-
que, J.-F.: Observational constraints on the chemistry of isoprene nitrates over the eastern United States, J. Geophys. Res., 112,20
doi:10.1029/2006jd007747, http://dx.doi.org/10.1029/2006JD007747, 2007.
Hu, K. S., Darer, A. I., and Elrod, M. J.: Thermodynamics and kinetics of the hydrolysis of atmospherically relevant organonitrates and
organosulfates, Atmospheric Chemistry and Physics, 11, 8307–8320, doi:10.5194/acp-11-8307-2011, http://www.atmos-chem-phys.net/
11/8307/2011/, 2011.
Hudman, R. C., Jacob, D. J., Turquety, S., Leibensperger, E. M., Murray, L. T., Wu, S., Gilliland, A. B., Avery, M., Bertram, T. H., Brune,25
W., Cohen, R. C., Dibb, J. E., Flocke, F. M., Fried, A., Holloway, J., Neuman, J. A., Orville, R., Perring, A., Ren, X., Sachse, G. W.,
Singh, H. B., Swanson, A., and Wooldridge, P. J.: Surface and lightning sources of nitrogen oxides over the United States: Magnitudes,
chemical evolution, and outflow, Journal of Geophysical Research: Atmospheres, 112, n/a–n/a, doi:10.1029/2006JD007912, http://dx.doi.
org/10.1029/2006JD007912, d12S05, 2007.
Jacobs, M. I., Burke, W. J., and Elrod, M. J.: Kinetics of the reactions of isoprene-derived hydroxynitrates: gas phase epoxide forma-30
tion and solution phase hydrolysis, Atmospheric Chemistry and Physics, 14, 8933–8946, doi:10.5194/acp-14-8933-2014, http://www.
atmos-chem-phys.net/14/8933/2014/, 2014.
Kim, H., Barkey, B., and Paulson, S. E.: Real Refractive Indices and Formation Yields of Secondary Organic Aerosol Generated from
Photooxidation of Limonene and α-Pinene: The Effect of the HC/NO x Ratio, J. Phys. Chem. A, 116, 6059–6067, doi:10.1021/jp301302z,
http://dx.doi.org/10.1021/jp301302z, 2012.35
Kim, P. S., Jacob, D. J., Fisher, J. A., Travis, K., Yu, K., Zhu, L., Yantosca, R. M., Sulprizio, M. P., Jimenez, J. L., Campuzano-Jost, P., Froyd,
K. D., Liao, J., Hair, J. W., Fenn, M. A., Butler, C. F., Wagner, N. L., Gordon, T. D., Welti, A., Wennberg, P. O., Crounse, J. D., St. Clair,
J. M., Teng, A. P., Millet, D. B., Schwarz, J. P., Markovic, M. Z., and Perring, A. E.: Sources, seasonality, and trends of southeast US
22
aerosol: an integrated analysis of surface, aircraft, and satellite observations with the GEOS-Chem chemical transport model, Atmospheric
Chemistry and Physics, 15, 10 411–10 433, doi:10.5194/acp-15-10411-2015, http://www.atmos-chem-phys.net/15/10411/2015/, 2015.
Knote, C., Hodzic, A., and Jimenez, J. L.: The effect of dry and wet deposition of condensable vapors on secondary organic aerosols
concentrations over the continental US, Atmospheric Chemistry and Physics, 15, 1–18, doi:10.5194/acp-15-1-2015, http://www.
atmos-chem-phys.net/15/1/2015/, 2015.5
Lamarque, J.-F., Kyle, G., Meinshausen, M., Riahi, K., Smith, S., van Vuuren, D., Conley, A., and Vitt, F.: Global and regional evolu-
tion of short-lived radiatively-active gases and aerosols in the Representative Concentration Pathways, Climatic Change, 109, 191–212,
doi:10.1007/s10584-011-0155-0, http://dx.doi.org/10.1007/s10584-011-0155-0, 2011.
Lee, B. H., Mohr, C., Lopez-Hilfiker, F. D., Lutz, A., Hallquist, M., Lee, L., Romer, P., Cohen, R. C., Iyer, S., Kurten, T., Hu, W. W., Day,
D. A., Campuzano-Jost, P., Jimenez, J. L., Xu, L., Ng, N. L., Guo, H., Weber, R. J., Wild, R. J., Brown, S. S., Koss, A., de Gouw, J.,10
Olson, K., Goldstein, A. H., Seco, R., Kim, S., McAvey, K. M., Shepson, P. B., Starn, T., Baumann, K., Edgerton, E., Liu, J., Shilling,
J. E., Miller, D. O., Brune, W. H., Schobesberger, S., D’Ambro, E. L., and Thornton, J. A.: Highly functionalized organic nitrates in
the Southeast U.S.: contribution to secondary organic aerosol and reactive nitrogen budgets, Proceedings of the National Academy of
Sciences, 113, 1516–1521, doi:10.1073/pnas.1508108113, 2016.
Lee, L., Teng, A. P., Wennberg, P. O., Crounse, J. D., and Cohen, R. C.: On Rates and Mechanisms of OH and O 3 Reactions with Isoprene-15
Derived Hydroxy Nitrates, J. Phys. Chem. A, 118, 1622–1637, doi:10.1021/jp4107603, http://dx.doi.org/10.1021/jp4107603, 2014.
Li, J., Mao, J., Pollack, I. B., Ryerson, T. B., Wolfe, G. M., Cohen, R. C., and Horowitz, L. W.: Decadal change of organic nitrates and ozone
over eastern US, in preparation.
Liang, J., Horowitz, L. W., Jacob, D. J., Wang, Y., Fiore, A. M., Logan, J. A., Gardner, G. M., and Munger, J. W.: Seasonal budgets of
reactive nitrogen species and ozone over the United States, and export fluxes to the global atmosphere, Journal of Geophysical Research:20
Atmospheres (1984–2012), 103, 13 435–13 450, 1998.
Lin, G., Penner, J. E., Sillman, S., Taraborrelli, D., and Lelieveld, J.: Global modeling of SOA formation from dicarbonyls, epox-
ides, organic nitrates and peroxides, Atmospheric Chemistry and Physics, 12, 4743–4774, doi:10.5194/acp-12-4743-2012, http://www.
atmos-chem-phys.net/12/4743/2012/, 2012.
Liu, S., Shilling, J. E., Song, C., Hiranuma, N., Zaveri, R. A., and Russell, L. M.: Hydrolysis of Organonitrate Functional Groups in Aerosol25
Particles, Aerosol Science and Technology, 46, 1359–1369, doi:10.1080/02786826.2012.716175, http://dx.doi.org/10.1080/02786826.
2012.716175, 2012.
Lockwood, A. L., Filley, T. R., Rhodes, D., and Shepson, P. B.: Foliar uptake of atmospheric organic nitrates, Geophysical Research Letters,
35, doi:10.1029/2008GL034714, http://dx.doi.org/10.1029/2008GL034714, l15809, 2008.
Lockwood, A. L., Shepson, P. B., Fiddler, M. N., and Alaghmand, M.: Isoprene nitrates: preparation, separation, identification,30
yields, and atmospheric chemistry, Atmospheric Chemistry and Physics, 10, 6169–6178, doi:10.5194/acp-10-6169-2010, http://www.
atmos-chem-phys.net/10/6169/2010/, 2010.
Mao, J., Paulot, F., Jacob, D. J., Cohen, R. C., Crounse, J. D., Wennberg, P. O., Keller, C. A., Hudman, R. C., Barkley, M. P., and Horowitz,
L. W.: Ozone and organic nitrates over the eastern United States: Sensitivity to isoprene chemistry, Journal of Geophysical Research:
Atmospheres, 118, 11,256–11,268, doi:10.1002/jgrd.50817, http://dx.doi.org/10.1002/jgrd.50817, 2013.35
Marais, E. A., Jacob, D. J., Jimenez, J. L., Campuzano-Jost, P., Day, D. A., Hu, W., Krechmer, J., Zhu, L., Kim, P. S., Miller, C. C., Fisher,
J. A., Travis, K., Yu, K., Hanisco, T. F., Wolfe, G. M., Arkinson, H. L., Pye, H. O. T., Froyd, K. D., Liao, J., and McNeill, V. F.: Aqueous-
23
phase mechanism for secondary organic aerosol formation from isoprene: application to the Southeast United States and co-benefit of SO2
emission controls, Atmospheric Chemistry and Physics, 16, 1603–1618, doi:10.5194/acp-16-1603-2016, 2016.
Monks, P. S., Archibald, A. T., Colette, A., Cooper, O., Coyle, M., Derwent, R., Fowler, D., Granier, C., Law, K. S., Mills, G. E., Stevenson,
D. S., Tarasova, O., Thouret, V., von Schneidemesser, E., Sommariva, R., Wild, O., and Williams, M. L.: Tropospheric ozone and its
precursors from the urban to the global scale from air quality to short-lived climate forcer, Atmospheric Chemistry and Physics, 15,5
8889–8973, doi:10.5194/acp-15-8889-2015, http://dx.doi.org/10.5194/acp-15-8889-2015, 2015.
Müller, J.-F., Peeters, J., and Stavrakou, T.: Fast photolysis of carbonyl nitrates from isoprene, Atmospheric Chemistry and Physics, 14,
2497–2508, doi:10.5194/acp-14-2497-2014, http://www.atmos-chem-phys.net/14/2497/2014/, 2014.
Ng, N. L., Kwan, A. J., Surratt, J. D., Chan, A. W. H., Chhabra, P. S., Sorooshian, A., Pye, H. O. T., Crounse, J. D., Wennberg, P. O., Flagan,
R. C., and Seinfeld, J. H.: Secondary organic aerosol (SOA) formation from reaction of isoprene with nitrate radicals (NO3), Atmospheric10
Chemistry and Physics, 8, 4117–4140, doi:10.5194/acp-8-4117-2008, http://www.atmos-chem-phys.net/8/4117/2008/, 2008.
Nguyen, T. B., Crounse, J. D., Schwantes, R. H., Teng, A. P., Bates, K. H., Zhang, X., St. Clair, J. M., Brune, W. H., Tyndall, G. S., Keutsch,
F. N., Seinfeld, J. H., and Wennberg, P. O.: Overview of the Focused Isoprene eXperiment at the California Institute of Technology
(FIXCIT): mechanistic chamber studies on the oxidation of biogenic compounds, Atmospheric Chemistry and Physics, 14, 13 531–13 549,
doi:10.5194/acp-14-13531-2014, http://www.atmos-chem-phys.net/14/13531/2014/, 2014.15
Nguyen, T. B., Crounse, J. D., Teng, A. P., Clair, J. M. S., Paulot, F., Wolfe, G. M., and Wennberg, P. O.: Rapid deposition of oxidized biogenic
compounds to a temperate forest, Proceedings of the National Academy of Sciences, 112, E392–E401, doi:10.1073/pnas.1418702112,
http://dx.doi.org/10.1073/pnas.1418702112, 2015.
Nozière, B., Barnes, I., and Becker, K.-H.: Product study and mechanisms of the reactions of α-pinene and of pinonaldehyde with OH
radicals, Journal of Geophysical Research: Atmospheres (1984–2012), 104, 23 645–23 656, 1999.20
O’Brien, J., Shepson, P., Muthuramu, K., Hao, C., Niki, H., Hastie, D., Taylor, R., and Roussel, P.: Measurements of alkyl and multifunctional
organic nitrates at a rural site in Ontario, Journal of Geophysical Research, 1995.
Palmer, P. I., Abbot, D. S., Fu, T.-M., Jacob, D. J., Chance, K., Kurosu, T. P., Guenther, A., Wiedinmyer, C., Stanton, J. C., Pilling, M. J.,
Pressley, S. N., Lamb, B., and Sumner, A. L.: Quantifying the seasonal and interannual variability of North American isoprene emissions
using satellite observations of the formaldehyde column, J. Geophys. Res., 111, doi:10.1029/2005jd006689, http://dx.doi.org/10.1029/25
2005JD006689, 2006.
Patchen, A. K., Pennino, M. J., Kiep, A. C., and Elrod, M. J.: Direct kinetics study of the product-forming channels of the reaction of
isoprene-derived hydroxyperoxy radicals with NO, International Journal of Chemical Kinetics, 39, 353–361, doi:10.1002/kin.20248, http:
//dx.doi.org/10.1002/kin.20248, 2007.
Paulot, F., Crounse, J. D., Kjaergaard, H. G., Kroll, J. H., Seinfeld, J. H., and Wennberg, P. O.: Isoprene photooxidation: new insights30
into the production of acids and organic nitrates, Atmospheric Chemistry and Physics, 9, 1479–1501, doi:10.5194/acp-9-1479-2009,
http://www.atmos-chem-phys.net/9/1479/2009/, 2009.
Paulot, F., Henze, D. K., and Wennberg, P. O.: Impact of the isoprene photochemical cascade on tropical ozone, Atmospheric Chemistry and
Physics, 12, 1307–1325, doi:10.5194/acp-12-1307-2012, http://dx.doi.org/10.5194/acp-12-1307-2012, 2012.
Peeters, J., Müller, J.-F., Stavrakou, T., and Nguyen, V. S.: Hydroxyl Radical Recycling in Isoprene Oxidation Driven by Hydrogen Bonding35
and Hydrogen Tunneling: The Upgraded LIM1 Mechanism, J. Phys. Chem. A, 118, 8625–8643, doi:10.1021/jp5033146, http://dx.doi.
org/10.1021/jp5033146, 2014.
24
Perring, A. E., Bertram, T. H., Wooldridge, P. J., Fried, A., Heikes, B. G., Dibb, J., Crounse, J. D., Wennberg, P. O., Blake, N. J., Blake,
D. R., Brune, W. H., Singh, H. B., and Cohen, R. C.: Airborne observations of total RONO2: new constraints on the yield and lifetime of
isoprene nitrates, Atmospheric Chemistry and Physics, 9, 1451–1463, doi:10.5194/acp-9-1451-2009, http://www.atmos-chem-phys.net/
9/1451/2009/, 2009a.
Perring, A. E., Wisthaler, A., Graus, M., Wooldridge, P. J., Lockwood, A. L., Mielke, L. H., Shepson, P. B., Hansel, A., and Cohen, R. C.:5
A product study of the isoprene+NO3 reaction, Atmospheric Chemistry and Physics, 9, 4945–4956, doi:10.5194/acp-9-4945-2009, http:
//www.atmos-chem-phys.net/9/4945/2009/, 2009b.
Perring, A. E., Pusede, S. E., and Cohen, R. C.: An Observational Perspective on the Atmospheric Impacts of Alkyl and Multifunctional
Nitrates on Ozone and Secondary Organic Aerosol, Chemical Reviews, 113, 5848–5870, doi:10.1021/cr300520x, http://dx.doi.org/10.
1021/cr300520x, 2013.10
Pye, H. O. T., Luecken, D. J., Xu, L., Boyd, C. M., Ng, N. L., Baker, K. R., Ayres, B. R., Bash, J. O., Baumann, K., Carter, W. P. L., Edgerton,
E., Fry, J. L., Hutzell, W. T., Schwede, D. B., and Shepson, P. B.: Modeling the Current and Future Roles of Particulate Organic Nitrates
in the Southeastern United States, Environmental Science & Technology, doi:10.1021/acs.est.5b03738, http://dx.doi.org/10.1021/acs.est.
5b03738, 2015.
Rindelaub, J. D., McAvey, K. M., and Shepson, P. B.: The photochemical production of organic nitrates from α-pinene and loss via acid-15
dependent particle phase hydrolysis, Atmospheric Environment, 100, 193–201, doi:10.1016/j.atmosenv.2014.11.010, http://dx.doi.org/10.
1016/j.atmosenv.2014.11.010, 2015.
Roberts, J. M. and Fajer, R. W.: UV absorption cross sections of organic nitrates of potential atmospheric importance and estimation of
atmospheric lifetimes, Environmental science & technology, 23, 945–951, 1989.
Rollins, A. W., Kiendler-Scharr, A., Fry, J. L., Brauers, T., Brown, S. S., Dorn, H.-P., Dubé, W. P., Fuchs, H., Mensah, A., Mentel, T. F.,20
Rohrer, F., Tillmann, R., Wegener, R., Wooldridge, P. J., and Cohen, R. C.: Isoprene oxidation by nitrate radical: alkyl nitrate and secondary
organic aerosol yields, Atmospheric Chemistry and Physics, 9, 6685–6703, doi:10.5194/acp-9-6685-2009, http://www.atmos-chem-phys.
net/9/6685/2009/, 2009.
Rollins, A. W., Smith, J. D., Wilson, K. R., and Cohen, R. C.: Real Time In Situ Detection of Organic Nitrates in Atmospheric Aerosols,
Environmental Science & Technology, 44, 5540–5545, doi:10.1021/es100926x, http://dx.doi.org/10.1021/es100926x, pMID: 20575535,25
2010.
Rollins, A. W., Browne, E. C., Min, K.-E., Pusede, S. E., Wooldridge, P. J., Gentner, D. R., Goldstein, A. H., Liu, S., Day,
D. A., Russell, L. M., and Cohen, R. C.: Evidence for NOx Control over Nighttime SOA Formation, Science, 337, 1210–1212,
doi:10.1126/science.1221520, http://dx.doi.org/10.1126/science.1221520, 2012.
Rollins, A. W., Pusede, S., Wooldridge, P., Min, K.-E., Gentner, D. R., Goldstein, A. H., Liu, S., Day, D. A., Russell, L. M., Rubitschun,30
C. L., Surratt, J. D., and Cohen, R. C.: Gas/particle partitioning of total alkyl nitrates observed with TD-LIF in Bakersfield, Journal of
Geophysical Research: Atmospheres, 118, 6651–6662, doi:10.1002/jgrd.50522, http://dx.doi.org/10.1002/jgrd.50522, 2013.
Romer, P. S., Duffey, K. C., Wooldridge, P. J., Allen, H. M., Ayres, B. R., Brown, S. S., Brune, W. H., Crounse, J. D., de Gouw, J., Draper,
D. C., Feiner, P. A., Fry, J. L., Goldstein, A. H., Koss, A., Misztal, P. K., Nguyen, T. B., Olson, K., Teng, A. P., Wennberg, P. O., Wild, R. J.,
Zhang, L., and Cohen, R. C.: The Lifetime of Nitrogen Oxides in an Isoprene Dominated Forest, Atmospheric Chemistry and Physics35
Discussions, 2016, 1–25, doi:10.5194/acp-2016-28, http://www.atmos-chem-phys-discuss.net/acp-2016-28/, 2016.
25
Schwantes, R. H., Teng, A. P., Nguyen, T. B., Coggon, M. M., Crounse, J. D., Clair, J. M. S., Zhang, X., Schilling, K. A., Seinfeld, J. H.,
and Wennberg, P. O.: Isoprene NO3 Oxidation Products from the RO2 + HO2 Pathway, The Journal of Physical Chemistry A, 119,
10 158–10 171, doi:10.1021/acs.jpca.5b06355, http://dx.doi.org/10.1021/acs.jpca.5b06355, pMID: 26335780, 2015.
Simon, H., Reff, A., Wells, B., Xing, J., and Frank, N.: Ozone Trends Across the United States over a Period of Decreasing NOx and VOC
Emissions, Environmental Science & Technology, 49, 186–195, doi:10.1021/es504514z, http://dx.doi.org/10.1021/es504514z, 2015.5
Singh, H. B. and Hanst, P. L.: Peroxyacetyl nitrate (PAN) in the unpolluted atmosphere: An important reservoir for nitrogen oxides, Geo-
physical Research Letters, 8, 941–944, doi:10.1029/GL008i008p00941, http://dx.doi.org/10.1029/GL008i008p00941, 1981.
Sprengnether, M., Demerjian, K. L., Donahue, N. M., and Anderson, J. G.: Product analysis of the OH oxidation of isoprene and 1,3-
butadiene in the presence of NO, Journal of Geophysical Research: Atmospheres, 107, ACH 8–1–ACH 8–13, doi:10.1029/2001JD000716,
http://dx.doi.org/10.1029/2001JD000716, 2002.10
Talukdar, R. K., Burkholder, J. B., Hunter, M., Gilles, M. K., Roberts, J. M., and Ravishankara, A. R.: Atmospheric fate of several
alkyl nitrates Part 2UV absorption cross-sections and photodissociation quantum yields, J. Chem. Soc., Faraday Trans., 93, 2797–2805,
doi:10.1039/A701781B, http://dx.doi.org/10.1039/A701781B, 1997.
Teng, A. P., Crounse, J. D., and Wennberg, P. O.: Isoprene peroxy radical dynamics, in preparation.
Toon, O. B., Maring, H., Dibb, J., Ferrare, R., Jacob, D. J., Jensen, E. J., Luo, Z. J., Mace, G. G., Pan, L. L., Pfister, L., Rosenlof, K. H.,15
Redemann, J., Reid, J. S., Singh, H. B., Yokelson, R., Minnis, P., Chen, G., Jucks, K. W., and Pszenny, A.: Planning, implementation and
scientific goals of the Studies of Emissions and Atmospheric Composition, Clouds and Climate Coupling by Regional Surveys (SEAC4RS)
field mission, Journal of Geophysical Research, accepted manuscript, doi:10.1002/2015JD024297, 2016.
Travis, K. R., Jacob, D. J., Fisher, J. A., Kim, P. S., Marais, E. A., Zhu, L., Yu, K., Miller, C. C., Yantosca, R. M., Sulprizio, M. P., Thompson,
A. M., Wennberg, P. O., Crounse, J. D., St. Clair, J. M., Cohen, R. C., Laughner, J. L., Dibb, J. E., Hall, S. R., Ullmann, K., Wolfe, G. M.,20
Neuman, J. A., and Zhou, X.: NOx emissions, isoprene oxidation pathways, vertical mixing, and implications for surface ozone in the
Southeast United States, in review for Atmospheric Chemistry and Physics, doi:10.5194/acp-2016-110, 2016.
Tuazon, E. C. and Atkinson, R.: A product study of the gas-phase reaction of Isoprene with the OH radical in the presence of NOx, Interna-
tional Journal of Chemical Kinetics, 22, 1221–1236, doi:10.1002/kin.550221202, http://dx.doi.org/10.1002/kin.550221202, 1990.
Wainwright, C. D., Pierce, J. R., Liggio, J., Strawbridge, K. B., Macdonald, A. M., and Leaitch, R. W.: The effect of model spatial resolution25
on Secondary Organic Aerosol predictions: a case study at Whistler, BC, Canada, Atmospheric Chemistry and Physics, 12, 10 911–10 923,
doi:10.5194/acp-12-10911-2012, http://www.atmos-chem-phys.net/12/10911/2012/, 2012.
Wang, Y. X., McElroy, M. B., Jacob, D. J., and Yantosca, R. M.: A nested grid formulation for chemical transport over Asia: Applications to
CO, Journal of Geophysical Research: Atmospheres, 109, n/a–n/a, doi:10.1029/2004JD005237, http://dx.doi.org/10.1029/2004JD005237,
d22307, 2004.30
Wolfe, G. M., Hanisco, T. F., Arkinson, H. L., Bui, T. P., Crounse, J. D., Dean-Day, J., Goldstein, A., Guenther, A., Hall, S. R., Huey, G.,
Jacob, D. J., Karl, T., Kim, P. S., Liu, X., Marvin, M. R., Mikoviny, T., Misztal, P. K., Nguyen, T. B., Peischl, J., Pollack, I., Ryerson, T.,
St. Clair, J. M., Teng, A., Travis, K. R., Ullmann, K., Wennberg, P. O., and Wisthaler, A.: Quantifying sources and sinks of reactive gases
in the lower atmosphere using airborne flux observations, Geophysical Research Letters, 42, 8231–8240, doi:10.1002/2015GL065839,
http://dx.doi.org/10.1002/2015GL065839, 2015GL065839, 2015.35
Worton, D. R., Reeves, C. E., Penkett, S. A., Sturges, W. T., Slemr, J., Oram, D. E., Bandy, B. J., Bloss, W. J., Carslaw, N., Davey, J.,
Emmerson, K. M., Gravestock, T. J., Hamilton, J. F., Heard, D. E., Hopkins, J. R., Hulse, A., Ingram, T., Jacob, M. J., Lee, J. D., Leigh,
R. J., Lewis, A. C., Monks, P. S., and Smith, S. C.: Alkyl nitrate photochemistry during the tropospheric organic chemistry experiment,
26
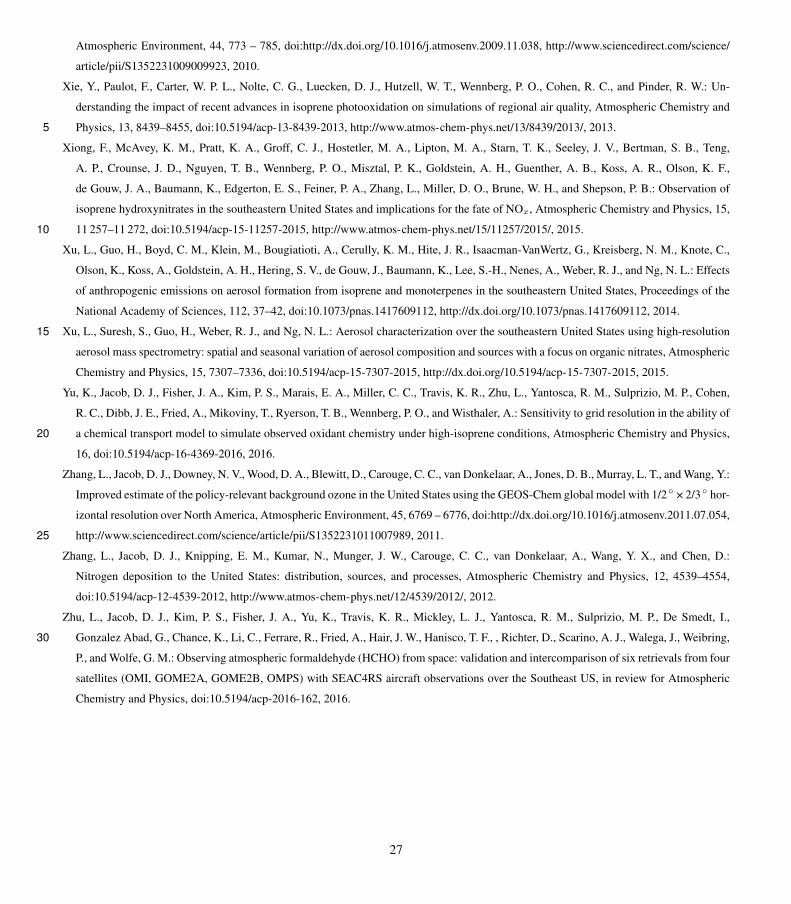
Atmospheric Environment, 44, 773 – 785, doi:http://dx.doi.org/10.1016/j.atmosenv.2009.11.038, http://www.sciencedirect.com/science/
article/pii/S1352231009009923, 2010.
Xie, Y., Paulot, F., Carter, W. P. L., Nolte, C. G., Luecken, D. J., Hutzell, W. T., Wennberg, P. O., Cohen, R. C., and Pinder, R. W.: Un-
derstanding the impact of recent advances in isoprene photooxidation on simulations of regional air quality, Atmospheric Chemistry and
Physics, 13, 8439–8455, doi:10.5194/acp-13-8439-2013, http://www.atmos-chem-phys.net/13/8439/2013/, 2013.5
Xiong, F., McAvey, K. M., Pratt, K. A., Groff, C. J., Hostetler, M. A., Lipton, M. A., Starn, T. K., Seeley, J. V., Bertman, S. B., Teng,
A. P., Crounse, J. D., Nguyen, T. B., Wennberg, P. O., Misztal, P. K., Goldstein, A. H., Guenther, A. B., Koss, A. R., Olson, K. F.,
de Gouw, J. A., Baumann, K., Edgerton, E. S., Feiner, P. A., Zhang, L., Miller, D. O., Brune, W. H., and Shepson, P. B.: Observation of
isoprene hydroxynitrates in the southeastern United States and implications for the fate of NOx, Atmospheric Chemistry and Physics, 15,
11 257–11 272, doi:10.5194/acp-15-11257-2015, http://www.atmos-chem-phys.net/15/11257/2015/, 2015.10
Xu, L., Guo, H., Boyd, C. M., Klein, M., Bougiatioti, A., Cerully, K. M., Hite, J. R., Isaacman-VanWertz, G., Kreisberg, N. M., Knote, C.,
Olson, K., Koss, A., Goldstein, A. H., Hering, S. V., de Gouw, J., Baumann, K., Lee, S.-H., Nenes, A., Weber, R. J., and Ng, N. L.: Effects
of anthropogenic emissions on aerosol formation from isoprene and monoterpenes in the southeastern United States, Proceedings of the
National Academy of Sciences, 112, 37–42, doi:10.1073/pnas.1417609112, http://dx.doi.org/10.1073/pnas.1417609112, 2014.
Xu, L., Suresh, S., Guo, H., Weber, R. J., and Ng, N. L.: Aerosol characterization over the southeastern United States using high-resolution15
aerosol mass spectrometry: spatial and seasonal variation of aerosol composition and sources with a focus on organic nitrates, Atmospheric
Chemistry and Physics, 15, 7307–7336, doi:10.5194/acp-15-7307-2015, http://dx.doi.org/10.5194/acp-15-7307-2015, 2015.
Yu, K., Jacob, D. J., Fisher, J. A., Kim, P. S., Marais, E. A., Miller, C. C., Travis, K. R., Zhu, L., Yantosca, R. M., Sulprizio, M. P., Cohen,
R. C., Dibb, J. E., Fried, A., Mikoviny, T., Ryerson, T. B., Wennberg, P. O., and Wisthaler, A.: Sensitivity to grid resolution in the ability of
a chemical transport model to simulate observed oxidant chemistry under high-isoprene conditions, Atmospheric Chemistry and Physics,20
16, doi:10.5194/acp-16-4369-2016, 2016.
Zhang, L., Jacob, D. J., Downey, N. V., Wood, D. A., Blewitt, D., Carouge, C. C., van Donkelaar, A., Jones, D. B., Murray, L. T., and Wang, Y.:
Improved estimate of the policy-relevant background ozone in the United States using the GEOS-Chem global model with 1/2◦ × 2/3◦ hor-
izontal resolution over North America, Atmospheric Environment, 45, 6769 – 6776, doi:http://dx.doi.org/10.1016/j.atmosenv.2011.07.054,
http://www.sciencedirect.com/science/article/pii/S1352231011007989, 2011.25
Zhang, L., Jacob, D. J., Knipping, E. M., Kumar, N., Munger, J. W., Carouge, C. C., van Donkelaar, A., Wang, Y. X., and Chen, D.:
Nitrogen deposition to the United States: distribution, sources, and processes, Atmospheric Chemistry and Physics, 12, 4539–4554,
doi:10.5194/acp-12-4539-2012, http://www.atmos-chem-phys.net/12/4539/2012/, 2012.
Zhu, L., Jacob, D. J., Kim, P. S., Fisher, J. A., Yu, K., Travis, K. R., Mickley, L. J., Yantosca, R. M., Sulprizio, M. P., De Smedt, I.,
Gonzalez Abad, G., Chance, K., Li, C., Ferrare, R., Fried, A., Hair, J. W., Hanisco, T. F., , Richter, D., Scarino, A. J., Walega, J., Weibring,30
P., and Wolfe, G. M.: Observing atmospheric formaldehyde (HCHO) from space: validation and intercomparison of six retrievals from four
satellites (OMI, GOME2A, GOME2B, OMPS) with SEAC4RS aircraft observations over the Southeast US, in review for Atmospheric
Chemistry and Physics, doi:10.5194/acp-2016-162, 2016.
27
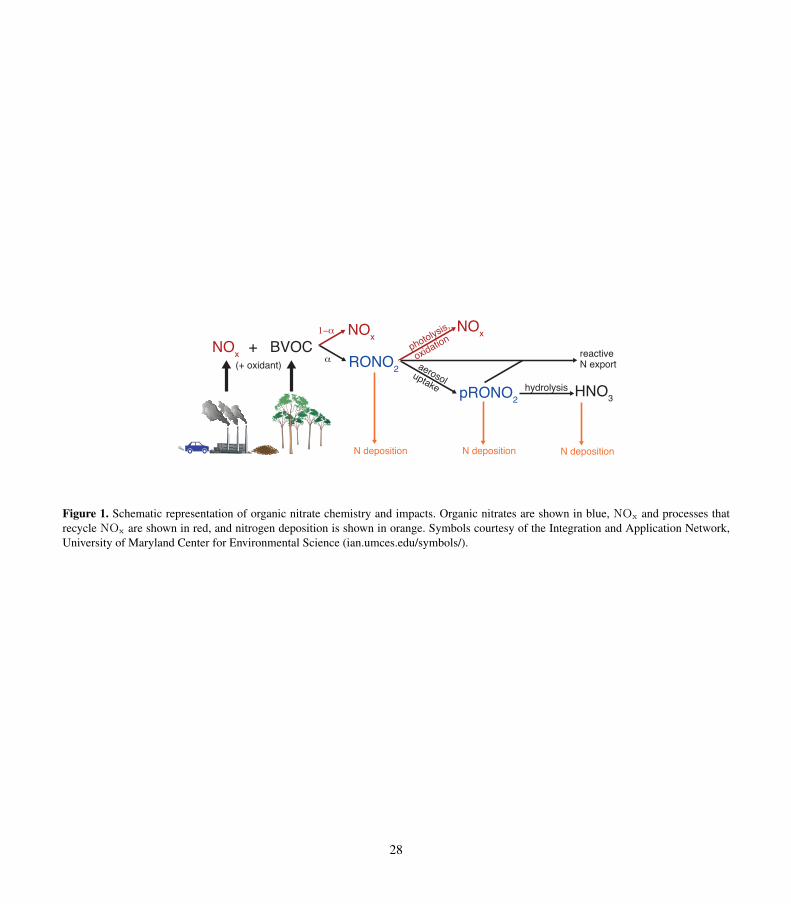
NOx BVOC+NOx
RONO2α
1−α
photolysis,
oxidationNOx
aerosoluptake pRONO2
N deposition N deposition
hydrolysis HNO3
N deposition
reactiveN export(+ oxidant)
Figure 1. Schematic representation of organic nitrate chemistry and impacts. Organic nitrates are shown in blue, NOx and processes thatrecycle NOx are shown in red, and nitrogen deposition is shown in orange. Symbols courtesy of the Integration and Application Network,University of Maryland Center for Environmental Science (ian.umces.edu/symbols/).
28

NO
12
34
OH, O2
NO2MACRMVK
HCHOOther C5 products
OHOO
OO
OH
β-hydroxyl peroxy radicaland isomers
δ-hydroxyl peroxy radicaland isomers
90% 10%
ISOPO2 ISOPO2
α=9% 91%
NO
α=9%91%
OHONO2
β-hydroxyl isoprene nitrateand isomersβ-ISOPN
ONO2
OHδ-hydroxyl isoprene nitrate
and isomersδ-ISOPN
OH, O2
90% 10%
isoprene epoxy diolsNO2
OHONO2
β-ISOPNO2
OO•
OH
OH, O2
90%10%
ONO2
OH
OO•OH
δ-ISOPNO2NO, HO2
methylvinylketone nitrateMVKN
O
methacrolein nitrateMACRN
ONO2OH
O2NO
O2NO
OH
OH
C5 diydroxy dinitrateDHDN
propanone nitratePROPNN
O2NOO
ethanal nitrateETHLN
NO, HO2
21% (NO)20% (HO2)30% (NO)
23% (HO2)
27% (NO)
21% (NO)
44% (NO)28% (HO2)
26% (NO)16% (HO2)
O2NOO
O
ONO2
OH
Figure 2. Schematic of the formation of isoprene nitrates (INs) from OH-initiated isoprene oxidation as implemented in GEOS-Chem. Theisomers shown are indicative as the mechanism does not distinguish between isomers (except for β- vs. δ-configurations). For ISOPNO2
oxidation, only IN products are shown, along with their yields from both NO and HO2 pathways. Small yields (<10%) of MVKN andMACRN from δ-ISOPNO2 are not shown.
29
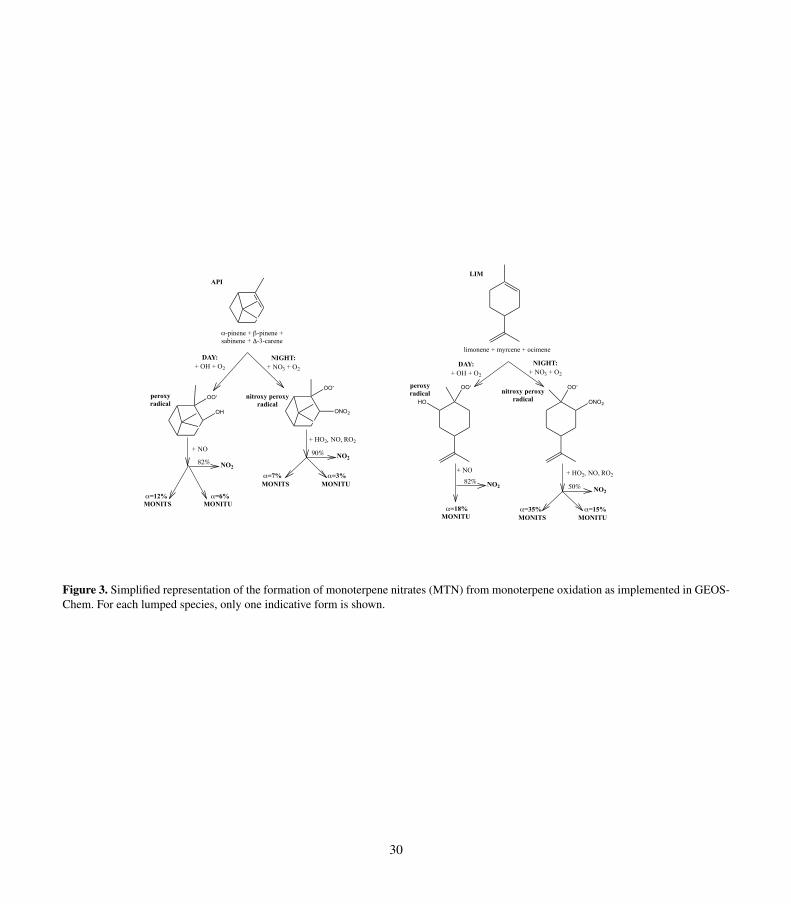
α-pinene + β-pinene +sabinene + Δ-3-carene
API
limonene + myrcene + ocimene
LIM
OO•
OH
MONITSα=12%
α=18%MONITU
α=6%MONITU
MONITS MONITU
OO•
ONO2
DAY:+ OH + O2
NIGHT:+ NO3 + O2
DAY:+ OH + O2
+ HO2, NO, RO2
α=7%
nitroxy peroxyradical
α=3%
90% NO282% NO2
MONITS MONITU
NIGHT:+ NO3 + O2
+ HO2, NO, RO2
α=35%
nitroxy peroxyradical
α=15%
50% NO2
HO
OO• OO•
ONO2peroxyradical
+ NO
peroxyradical
82% NO2
+ NO
Figure 3. Simplified representation of the formation of monoterpene nitrates (MTN) from monoterpene oxidation as implemented in GEOS-Chem. For each lumped species, only one indicative form is shown.
30
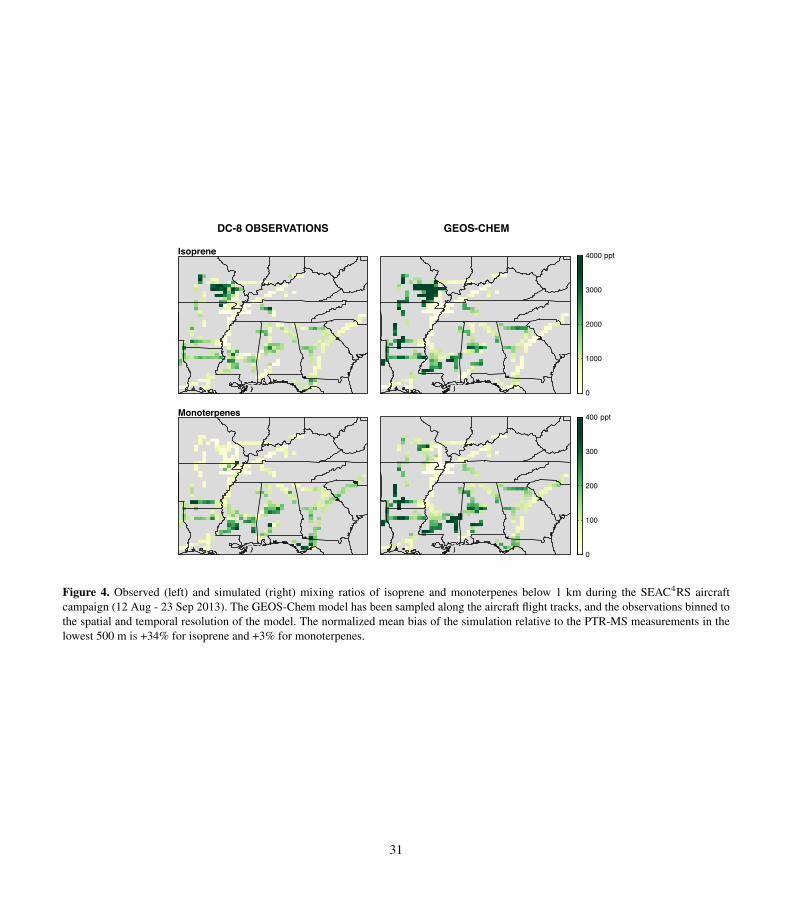
DC-8 OBSERVATIONS
0
1000
2000
3000
4000 pptIsoprene
GEOS-CHEM
Monoterpenes
0
100
200
300
400 ppt
Figure 4. Observed (left) and simulated (right) mixing ratios of isoprene and monoterpenes below 1 km during the SEAC4RS aircraftcampaign (12 Aug - 23 Sep 2013). The GEOS-Chem model has been sampled along the aircraft flight tracks, and the observations binned tothe spatial and temporal resolution of the model. The normalized mean bias of the simulation relative to the PTR-MS measurements in thelowest 500 m is +34% for isoprene and +3% for monoterpenes.
31
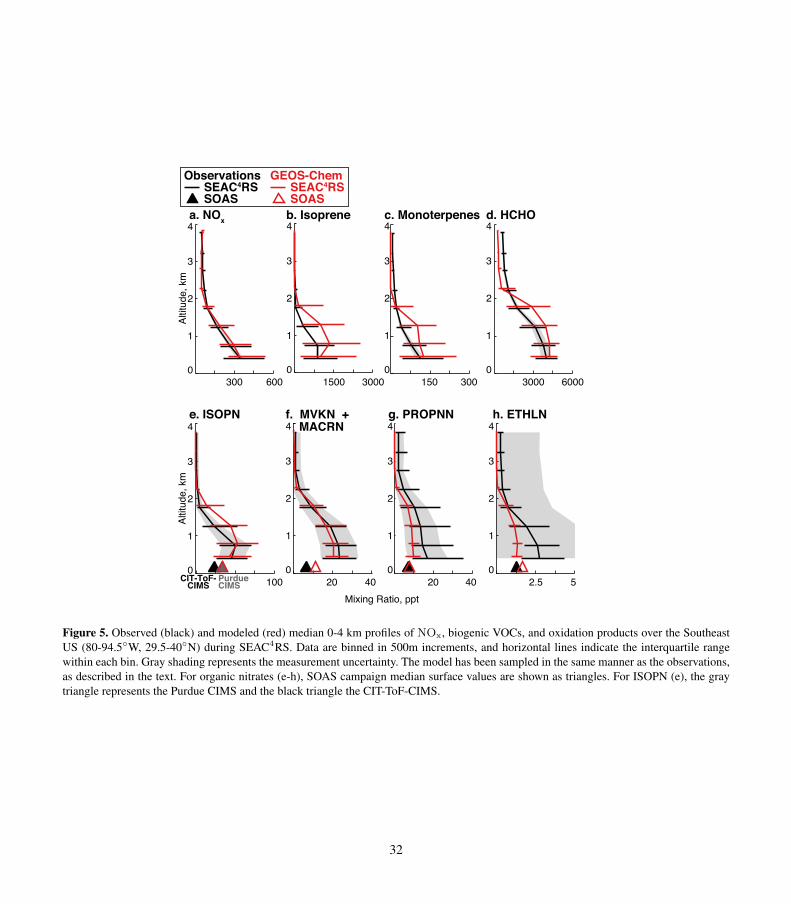
Mixing Ratio, ppt
Altit
ude,
km
Altit
ude,
km
e. ISOPN
0
1
2
3
4
100
h. ETHLN
2.5 50
1
2
3
4g. PROPNN
0
1
2
3
4
20 40
f. MVKN + MACRN
20 400
1
2
3
4
Observations SEAC4RS SOAS
CIT-ToF-CIMS
PurdueCIMS
b. Isoprene
1500 30000
1
2
3
4c. Monoterpenes
0
1
2
3
4
300150
d. HCHO
3000 60000
1
2
3
4
GEOS-Chem SEAC4RS SOAS
a. NOx
0
1
2
3
4
600300
Figure 5. Observed (black) and modeled (red) median 0-4 km profiles of NOx, biogenic VOCs, and oxidation products over the SoutheastUS (80-94.5◦W, 29.5-40◦N) during SEAC4RS. Data are binned in 500m increments, and horizontal lines indicate the interquartile rangewithin each bin. Gray shading represents the measurement uncertainty. The model has been sampled in the same manner as the observations,as described in the text. For organic nitrates (e-h), SOAS campaign median surface values are shown as triangles. For ISOPN (e), the graytriangle represents the Purdue CIMS and the black triangle the CIT-ToF-CIMS.
32
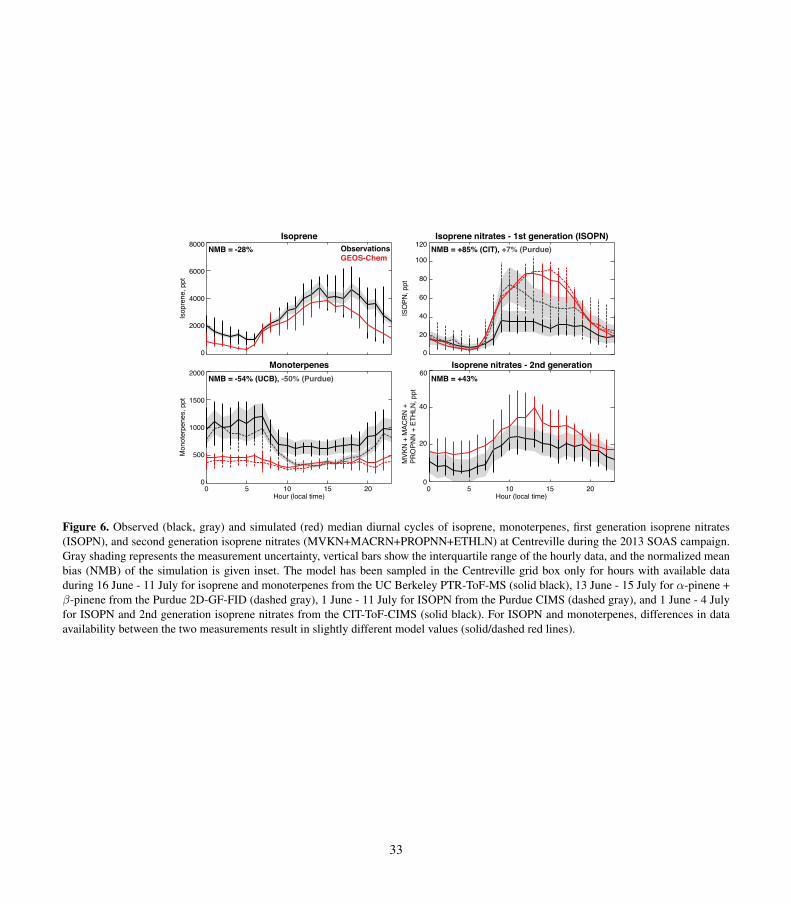
Isoprene
0
2000
4000
6000
8000
Isop
rene
, ppt
Monoterpenes
0 5 10 15 20Hour (local time)
0
500
1000
1500
2000
Mon
oter
pene
s, p
pt
NMB = -28%NMB = -28%Isoprene nitrates - 1st generation (ISOPN)
0
20
40
80
120
ISO
PN, p
pt
100
60
Isoprene nitrates - 2nd generation
0
20
40
60
MVK
N +
MAC
RN
+PR
OPN
N +
ETH
LN, p
pt
0 5 10 15 20Hour (local time)
NMB = +85% (CIT), +7% (Purdue)NMB = +85% (CIT), +7% (Purdue)
NMB = +43%NMB = +43%
ObservationsGEOS-Chem
NMB = -54% (UCB), -50% (Purdue)NMB = -54% (UCB), -50% (Purdue)
Figure 6. Observed (black, gray) and simulated (red) median diurnal cycles of isoprene, monoterpenes, first generation isoprene nitrates(ISOPN), and second generation isoprene nitrates (MVKN+MACRN+PROPNN+ETHLN) at Centreville during the 2013 SOAS campaign.Gray shading represents the measurement uncertainty, vertical bars show the interquartile range of the hourly data, and the normalized meanbias (NMB) of the simulation is given inset. The model has been sampled in the Centreville grid box only for hours with available dataduring 16 June - 11 July for isoprene and monoterpenes from the UC Berkeley PTR-ToF-MS (solid black), 13 June - 15 July for α-pinene +β-pinene from the Purdue 2D-GF-FID (dashed gray), 1 June - 11 July for ISOPN from the Purdue CIMS (dashed gray), and 1 June - 4 Julyfor ISOPN and 2nd generation isoprene nitrates from the CIT-ToF-CIMS (solid black). For ISOPN and monoterpenes, differences in dataavailability between the two measurements result in slightly different model values (solid/dashed red lines).
33
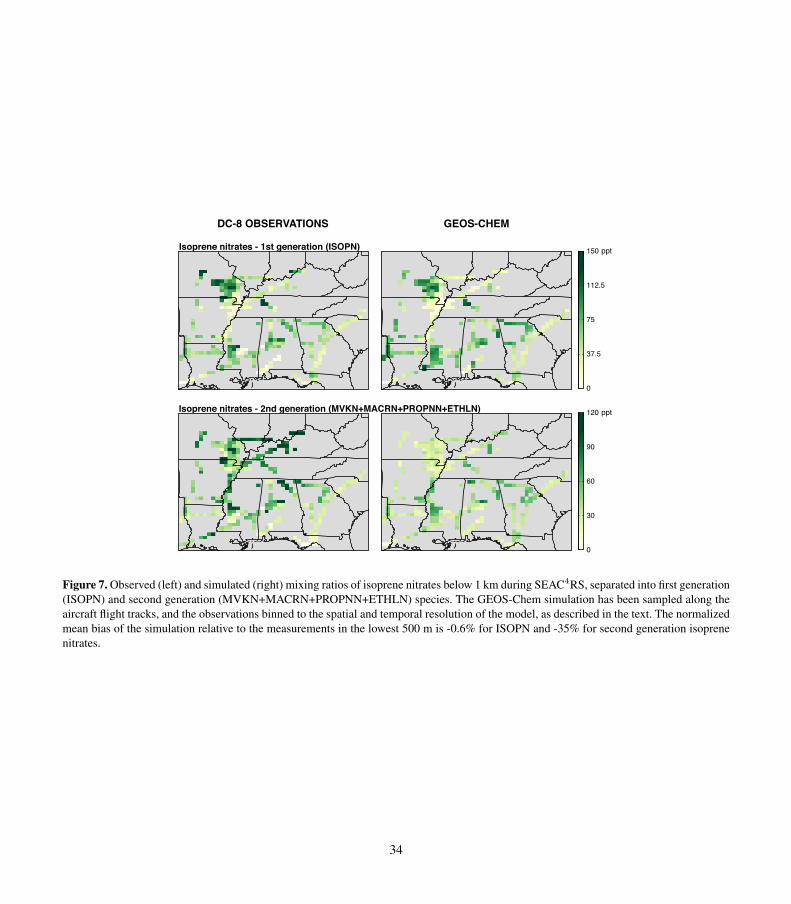
DC-8 OBSERVATIONS GEOS-CHEM
0
37.5
75
112.5
150 pptIsoprene nitrates - 1st generation (ISOPN)
Isoprene nitrates - 2nd generation (MVKN+MACRN+PROPNN+ETHLN)
0
30
60
90
120 ppt
Figure 7. Observed (left) and simulated (right) mixing ratios of isoprene nitrates below 1 km during SEAC4RS, separated into first generation(ISOPN) and second generation (MVKN+MACRN+PROPNN+ETHLN) species. The GEOS-Chem simulation has been sampled along theaircraft flight tracks, and the observations binned to the spatial and temporal resolution of the model, as described in the text. The normalizedmean bias of the simulation relative to the measurements in the lowest 500 m is -0.6% for ISOPN and -35% for second generation isoprenenitrates.
34
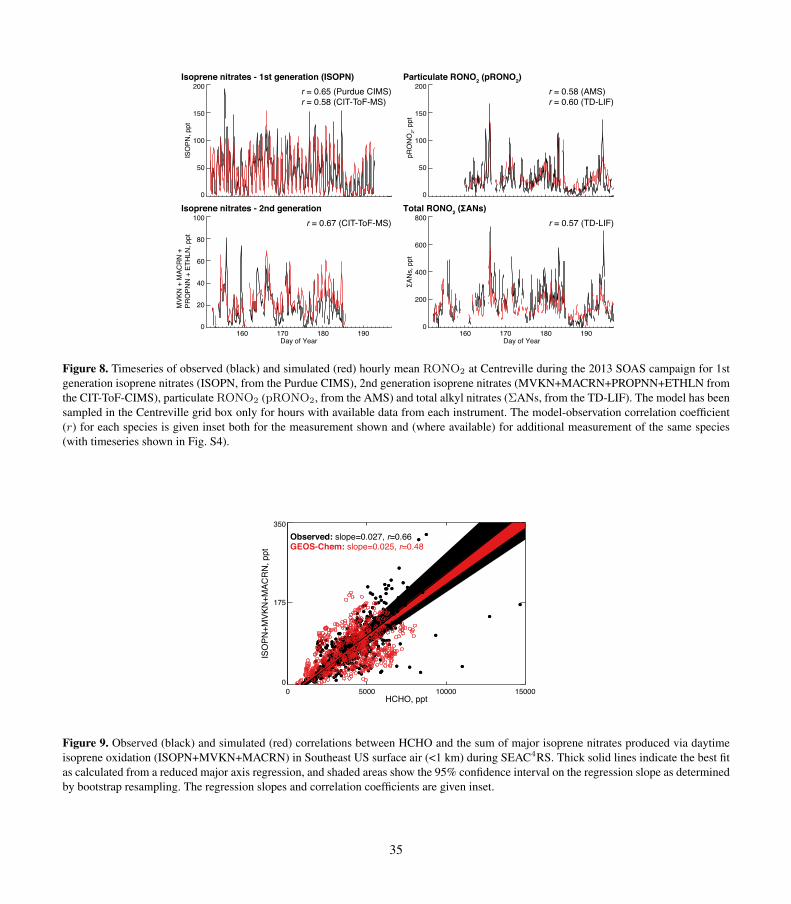
Isoprene nitrates - 1st generation (ISOPN)
0
50
100
150
200
Isoprene nitrates - 2nd generation
160 170 180 190Day of Year
0
20
40
80
100
r = 0.65 (Purdue CIMS)r = 0.58 (CIT-ToF-MS)r = 0.65 (Purdue CIMS)r = 0.58 (CIT-ToF-MS)
r = 0.67 (CIT-ToF-MS)r = 0.67 (CIT-ToF-MS)
ISO
PN, p
ptM
VKN
+ M
ACR
N +
PRO
PNN
+ E
THLN
, ppt
60
Particulate RONO2 (pRONO2)
0
50
150
200
100
Total RONO2 (ΣANs)
0
200
400
800
r = 0.58 (AMS)r = 0.60 (TD-LIF)r = 0.58 (AMS)r = 0.60 (TD-LIF)
r = 0.57 (TD-LIF)r = 0.57 (TD-LIF)
pRO
NO
2, pp
tΣA
Ns,
ppt
600
160 170 180 190Day of Year
Figure 8. Timeseries of observed (black) and simulated (red) hourly mean RONO2 at Centreville during the 2013 SOAS campaign for 1stgeneration isoprene nitrates (ISOPN, from the Purdue CIMS), 2nd generation isoprene nitrates (MVKN+MACRN+PROPNN+ETHLN fromthe CIT-ToF-CIMS), particulate RONO2 (pRONO2, from the AMS) and total alkyl nitrates (ΣANs, from the TD-LIF). The model has beensampled in the Centreville grid box only for hours with available data from each instrument. The model-observation correlation coefficient(r) for each species is given inset both for the measurement shown and (where available) for additional measurement of the same species(with timeseries shown in Fig. S4).
0 5000 15000HCHO, ppt
0
175
350
ISO
PN+M
VKN
+MAC
RN
, ppt
Observed: slope=0.027, r=0.66GEOS-Chem: slope=0.025, r=0.48
10000
Figure 9. Observed (black) and simulated (red) correlations between HCHO and the sum of major isoprene nitrates produced via daytimeisoprene oxidation (ISOPN+MVKN+MACRN) in Southeast US surface air (<1 km) during SEAC4RS. Thick solid lines indicate the best fitas calculated from a reduced major axis regression, and shaded areas show the 95% confidence interval on the regression slope as determinedby bootstrap resampling. The regression slopes and correlation coefficients are given inset.
35
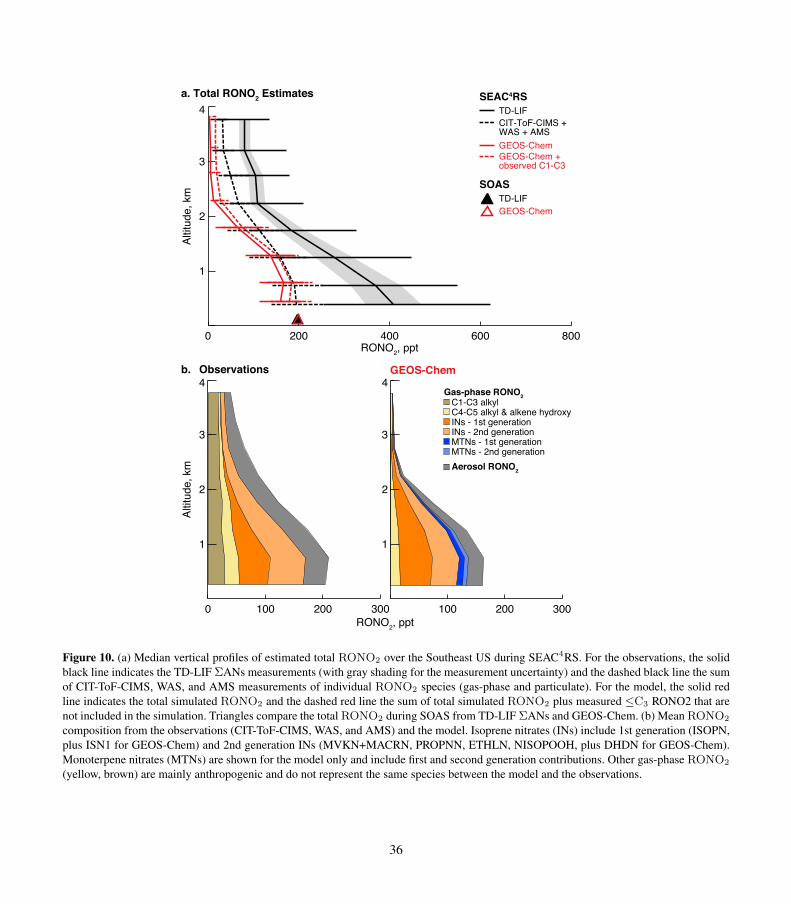
0 400200 800
1
2
3
4
Altit
ude,
km
a. Total RONO2 Estimates
1
2
3
4
RONO2, ppt
INs - 1st generationINs - 2nd generation
Gas-phase RONO2
Aerosol RONO2
C1-C3 alkylC4-C5 alkyl & alkene hydroxy
MTNs - 2nd generationMTNs - 1st generation
600
Altit
ude,
km
0 200100RONO2, ppt
300
TD-LIFCIT-ToF-CIMS +WAS + AMSGEOS-ChemGEOS-Chem +observed C1-C3
Observations
1
2
3
4GEOS-Chem
200100 300
b.
SEAC4RS
TD-LIFGEOS-Chem
SOAS
Figure 10. (a) Median vertical profiles of estimated total RONO2 over the Southeast US during SEAC4RS. For the observations, the solidblack line indicates the TD-LIF ΣANs measurements (with gray shading for the measurement uncertainty) and the dashed black line the sumof CIT-ToF-CIMS, WAS, and AMS measurements of individual RONO2 species (gas-phase and particulate). For the model, the solid redline indicates the total simulated RONO2 and the dashed red line the sum of total simulated RONO2 plus measured ≤C3 RONO2 that arenot included in the simulation. Triangles compare the total RONO2 during SOAS from TD-LIF ΣANs and GEOS-Chem. (b) Mean RONO2
composition from the observations (CIT-ToF-CIMS, WAS, and AMS) and the model. Isoprene nitrates (INs) include 1st generation (ISOPN,plus ISN1 for GEOS-Chem) and 2nd generation INs (MVKN+MACRN, PROPNN, ETHLN, NISOPOOH, plus DHDN for GEOS-Chem).Monoterpene nitrates (MTNs) are shown for the model only and include first and second generation contributions. Other gas-phase RONO2
(yellow, brown) are mainly anthropogenic and do not represent the same species between the model and the observations.
36
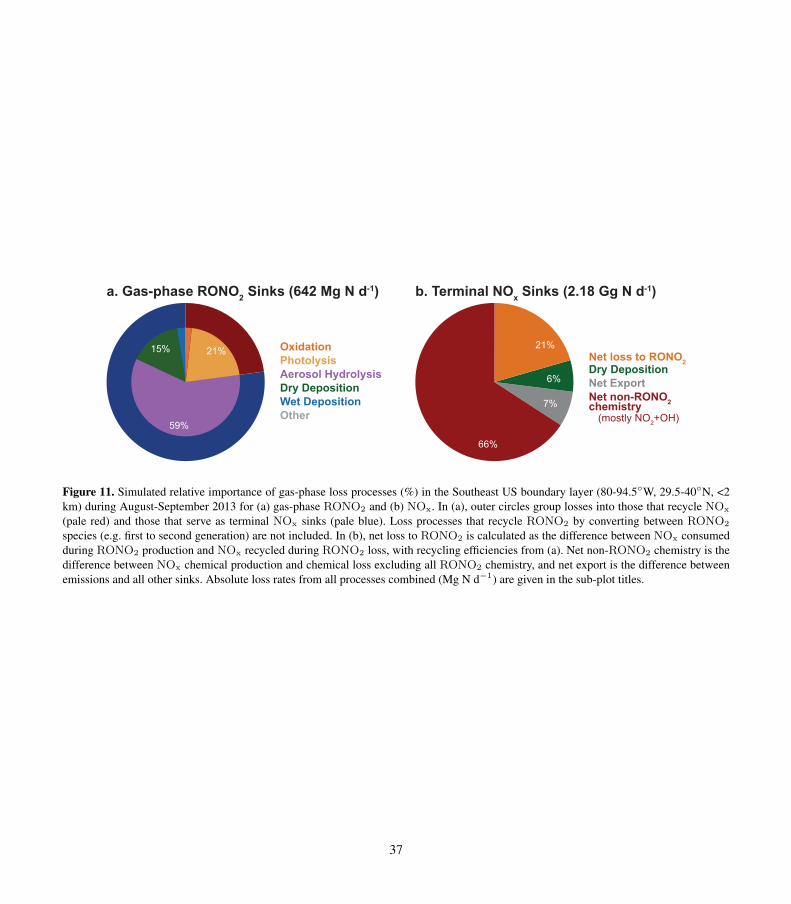
a. Gas-phase RONO2 Sinks (642 Mg N d-1)
PhotolysisOxidation
Dry DepositionWet DepositionOther
Aerosol Hydrolysis
15%
59%
21%
NOx recycling
NOx sink Net non-RONO2chemistry (mostly NO2+OH)
Dry DepositionNet Export
Net loss to RONO2
7%
6%
21%
66%
b. Terminal NOx Sinks (2.18 Gg N d-1)
Figure 11. Simulated relative importance of gas-phase loss processes (%) in the Southeast US boundary layer (80-94.5◦W, 29.5-40◦N, <2km) during August-September 2013 for (a) gas-phase RONO2 and (b) NOx. In (a), outer circles group losses into those that recycle NOx
(pale red) and those that serve as terminal NOx sinks (pale blue). Loss processes that recycle RONO2 by converting between RONO2
species (e.g. first to second generation) are not included. In (b), net loss to RONO2 is calculated as the difference between NOx consumedduring RONO2 production and NOx recycled during RONO2 loss, with recycling efficiencies from (a). Net non-RONO2 chemistry is thedifference between NOx chemical production and chemical loss excluding all RONO2 chemistry, and net export is the difference betweenemissions and all other sinks. Absolute loss rates from all processes combined (Mg N d−1) are given in the sub-plot titles.
37

0 10 20 30 40 50 60 70 80 90 100Cumulative NOx emissions (%)
0
500
1000
1500
2000
2500
Tota
l NO
X em
issi
on, M
g N
d-1
E BVO
C /
E NO
X Rat
io
Frac
tion
NO
x los
t to
RO
NO
2 pro
duct
ion
0 0.5 1
a. Fraction NOx lost to RONO2
0 25 50
b. EBVOC/ENOX ratio
c. Relationship to Southeast U.S. NOx emissions
0
10
20
30
0
0.2
0.4
0.6
Figure 12. Importance of organic nitrates as a sink for NOx, as a function of BVOC and NOx emissions. (a) Simulated fraction of emittedNOx that is lost to RONO2 production in Southeast US surface air. (b) Ratio of BVOC (isoprene + monoterpene) emissions (EBV OC ) toNOx emissions (ENOx). (c) Mean values of variables from (a) and (b) as a function of cumulative NOx emissions in the Southeast US.Model grid squares have been sorted by NOx emissions then grouped into bins that each represent 5% of total Southeast US NOx emissions.Values shown for the fractional NOx sink due to RONO2 production (blue) and the mean EBV OC/ENOx emissions ratio (red) representthe mean within each bin. NOx emissions are shown as cumulative totals (gray) in Mg N day−1. The Southeast US mean EBV OC/ENOx
emissions ratio (5.3) is highlighted with a white circle.
38
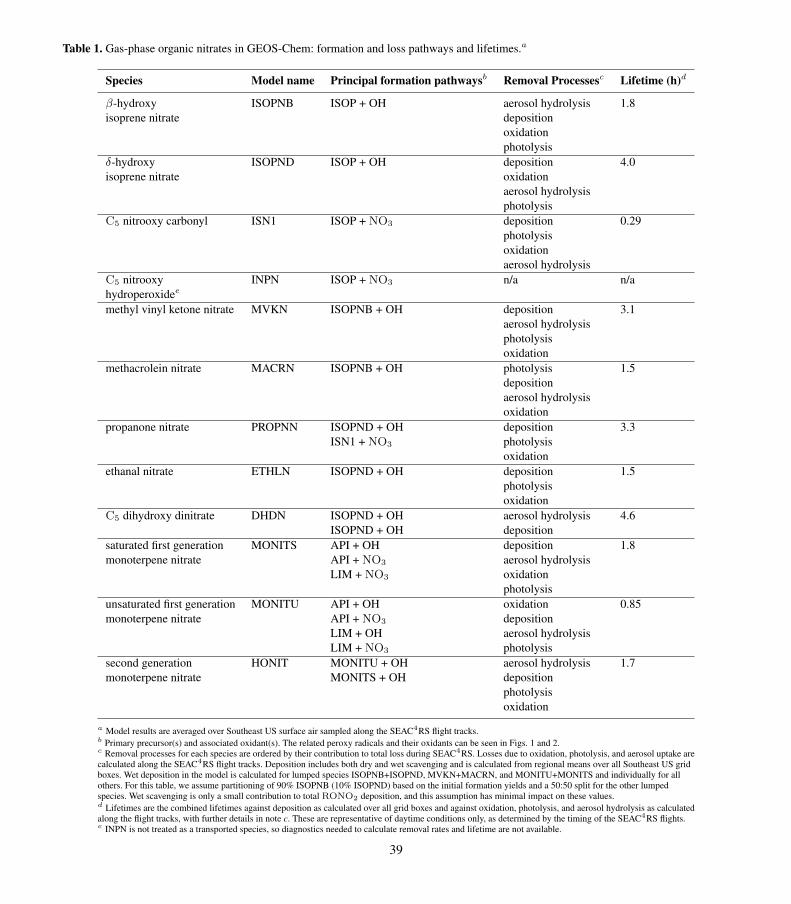
Table 1. Gas-phase organic nitrates in GEOS-Chem: formation and loss pathways and lifetimes.a
Species Model name Principal formation pathwaysb Removal Processesc Lifetime (h)d
β-hydroxy ISOPNB ISOP + OH aerosol hydrolysis 1.8isoprene nitrate deposition
oxidationphotolysis
δ-hydroxy ISOPND ISOP + OH deposition 4.0isoprene nitrate oxidation
aerosol hydrolysisphotolysis
C5 nitrooxy carbonyl ISN1 ISOP + NO3 deposition 0.29photolysisoxidationaerosol hydrolysis
C5 nitrooxy INPN ISOP + NO3 n/a n/ahydroperoxidee
methyl vinyl ketone nitrate MVKN ISOPNB + OH deposition 3.1aerosol hydrolysisphotolysisoxidation
methacrolein nitrate MACRN ISOPNB + OH photolysis 1.5depositionaerosol hydrolysisoxidation
propanone nitrate PROPNN ISOPND + OH deposition 3.3ISN1 + NO3 photolysis
oxidationethanal nitrate ETHLN ISOPND + OH deposition 1.5
photolysisoxidation
C5 dihydroxy dinitrate DHDN ISOPND + OH aerosol hydrolysis 4.6ISOPND + OH deposition
saturated first generation MONITS API + OH deposition 1.8monoterpene nitrate API + NO3 aerosol hydrolysis
LIM + NO3 oxidationphotolysis
unsaturated first generation MONITU API + OH oxidation 0.85monoterpene nitrate API + NO3 deposition
LIM + OH aerosol hydrolysisLIM + NO3 photolysis
second generation HONIT MONITU + OH aerosol hydrolysis 1.7monoterpene nitrate MONITS + OH deposition
photolysisoxidation
a Model results are averaged over Southeast US surface air sampled along the SEAC4RS flight tracks.b Primary precursor(s) and associated oxidant(s). The related peroxy radicals and their oxidants can be seen in Figs. 1 and 2.c Removal processes for each species are ordered by their contribution to total loss during SEAC4RS. Losses due to oxidation, photolysis, and aerosol uptake arecalculated along the SEAC4RS flight tracks. Deposition includes both dry and wet scavenging and is calculated from regional means over all Southeast US gridboxes. Wet deposition in the model is calculated for lumped species ISOPNB+ISOPND, MVKN+MACRN, and MONITU+MONITS and individually for allothers. For this table, we assume partitioning of 90% ISOPNB (10% ISOPND) based on the initial formation yields and a 50:50 split for the other lumpedspecies. Wet scavenging is only a small contribution to total RONO2 deposition, and this assumption has minimal impact on these values.d Lifetimes are the combined lifetimes against deposition as calculated over all grid boxes and against oxidation, photolysis, and aerosol hydrolysis as calculatedalong the flight tracks, with further details in note c. These are representative of daytime conditions only, as determined by the timing of the SEAC4RS flights.e INPN is not treated as a transported species, so diagnostics needed to calculate removal rates and lifetime are not available.
39