organic carbon storage in soils of tropical and subtropical china
TRANSCRIPT

ORGANIC CARBON STORAGE IN SOILS OF TROPICAL ANDSUBTROPICAL CHINA
LI ZHONG∗, JIANG XIAO, PAN XIANZHANG and ZHAO QIGUOInstitute of Soil Science, Academia Sinica, P.O. Box 821, Nanjing 210008, P.R. China
(∗ author for correspondence, e-mail: [email protected])
(Received 26 July 1999; accepted 17 May 2000)
Abstract. Tropical and subtropical China occupies a total area of about 215 Mha, but the contentsand storage of soil organic carbon (C) on this land have not been well studied. This research wasconducted in this concern by jointly using soil survey data and the regional soil map. It was estimatedthat the 0–20 cm C density of the soil subgroups in the region varied from 1.2 to 9.7 kg C m−2. In themajor zonal soils, soil subgroup ‘young ∼’ had generally a C density about 1.2–4.4 times lower thanits other natural counterparts. Furthermore, subgroups of the cultivated soil gave a C density about20–63% lower than their natural counterparts (except subgroup ‘young ∼’), showing remarkable Closses caused by cultivation. For soil groups in the east, brown soil had the highest C density (6.8and 21.4 kg C m−2, for the upper 20 and 100 cm soil, respectively), followed by yellow soil, yellowbrown soil and limestone soil (4.6–5.5 and 12.3–14.5 kg C m−2, idem). Torrid red soil, purplish soiland fluvo-aquic soil had the lowest C density (2.0–2.2 and 5.8–7.5 kg C m−2, idem) with the othersranking at a medium level. In the west, podzolic soil ranked the highest (17.9 and 55.8 kg C m−2,idem), followed by dark brown soil, brown soil and limestone soil (6.9–11.6 and 21–29 kg C m−2,idem), and again torrid red soil, purplish soil and fluvo-aquic soil ranked the lowest (3.9–5.1 and11.4–14.1 kg C m−2, idem). Finally, a total of about 26.8±7.4 Pg organic C was estimated beingstored in soils of the entire region.
Keywords: C density, C storage, soil, tropical and subtropical China
Abbreviations: BS – brown soil, LS – limestone soil, PS – purplish soil, RS – red soil, YS – yellowsoil, CSS – coastal solonchak and sandy soil, DBS – dark brown soil, FQS – fluvo-aquic soil, LOT– lotosol, LRS – lateritic red soil, MMS – mountain meadow soil, PDS – paddy soil, PZS – podzolicsoil, TRS – torrid red soil, YBS – yellow brown soil, OTS – other soils.
1. Introduction
With the increasing concern of the global climate change, the global C cycle hasbeen addressed more ever than before by interdisciplinary scientists. However, westill cannot balance the global C budget (Schimel et al., 1995; Schlesinger, 1993),and our knowledge in predicting future changes is challenged by a number ofunknowns. Soil organic C makes a major pool of the global C cycle (Schlesinger,1977; Post et al., 1982; Eswaran et al., 1993), and plays a critical role in regulatingthe atmospheric CO2 (Post et al., 1990; Schlesinger, 1991). But an accurate estim-ate of the global soil C storage and its geographic distribution is hampered by lackof reliable data (Eswaran et al., 1995; Arnold, 1995), and the capacity of the soil
Water, Air, and Soil Pollution 129: 45–60, 2001.© 2001 Kluwer Academic Publishers. Printed in the Netherlands.

46 L. ZHONG ET AL.
to sequester C is still not sufficiently elucidated. An improved understanding of theC status of the regional soils can help narrow our knowledge gaps in this concern,and provide options to assess regional soil management in C sequestration.
Tropical and subtropical China covers an area of about 215 Mha, and diverslargely in soil types, vegetation, geography and land uses. But its soil organic Ccontents and variations have not been well documented. This study was intendedto estimate the organic C content, storage and geographic distribution of soils inthe region based on data from the Second National Soil Survey and the regionalsoil map.
2. Materials and Methods
2.1. DATA SOURCE AND COLLECTION
The whole area confined by Map of Soils in the Red Soil and Yellow Soil Regionof China (1:4 M) was defined as tropical and subtropical China in this study, whichmatches roughly the common concept by Chinese meteorologists and soil scient-ists. As evident difference exists in climate, topography, vegetation, landuse andsocial economy, the region is traditionally divided into two parts: the east and thewest, each of which was addressed separately in this article (Figure 1). The soilmap mentioned above was used to characterize the geographic distribution of soilsin the entire region.
The primary data we employed were based on the Second National Soil Surveycollected from Soil Species of China Volume I, III and VI (National Soil SurveyOffice, 1993, 1994, 1996). Provincial records of soil species from each related area(some unpublished) were also used to enlarge the database of soil pedons and to en-hance representativity. As a result, about 15450 soil profiles were totally collected,of which 6326 were natural pedons and the others were cultivated soils. Becausesoil species data of Taiwan were not available, mean values of the C density of theeast soils were correspondingly adopted to ensure integrality.
The soil classification system employed in the Second National Soil Survey wasnot completely consistent with the legend of the Map of Soils in the Red Soil andYellow Soil Region of China (1:4 M). The mergence of soil units, especially atsubgroup level, was conducted for some soils to make the two systems identicaland compatible. Basically, soil subgroups were merged in light of the principle ofapproximation.
2.2. COMPUTATION OF SOIL ORGANIC C DENSITY
2.2.1. To Profile DepthFor a soil with n layers, its organic C density (SOCd , in kg C m−2) was calculatedby using the classical layer-based method as:

ORGANIC CARBON STORAGE IN SOILS 47
Figure 1. The area of study.
SOCd =n∑
i=1
TiϑiCi(1 − δi)/10 (1)
where Ti is the thickness (cm) of layer i, ϑi is the bulk density (g cm−3) of layer i,Ci is the C content (%) in layer i, and δi is the volumetric percentage of fragmentslarger than 2 mm. For soils without measured bulk density (about 70% of thetotal), mean values of their corresponding subgroups or groups were alternativelyused. For soil horizons without measured stoniness but defined qualitatively asone of slight stony, medium stony or heavy stony, the median of 0–15%, 15–50%or 50–100% was appointed, respectively, keeping in view the original definition.C content was converted from organic matter concentration using a conversioncoefficient of 1.724 since organic matter was determined by wet combustion withCr2O2−
7 (Wen, 1984).The C density of a given soil subgroup (SOCs) supported by n soil species was
computed by using

48 L. ZHONG ET AL.
SOCs =n∑
i=1
SOCif (i) (2)
where SOCi is the C density of soil species i, and f (i) is the area fraction ofspecies i in the total subgroup. The C density of a given soil group was averagedin the same way but based on all the subgroups it included. The total area of a soilsubgroup or a soil group obtained by adding up all the collected species under theclass was commonly much less than the total we got by digitizing the soil map, butthe former was assumed to be a representative sample of the latter.
2.2.2. To 20 and 100 cm DepthIn the Second National Soil Survey, soil profiles were divided into genetic horizonA, B, C, D, . . . . The upper 0–20 cm layer was not particularly identified, andprofiles did not go exactly to 100 cm depth. To estimate C density in the upper20 cm soil, we used only horizon A when A � 20 cm, or used both horizon Aand B when A < 20 cm. In the former case, it was computed by using all the othercharacteristics of horizon A but its depth. In case of A < 20 cm, a compensativelayer from B was taken with its properties assigned unchangedly from the originalB and then the upper 20 cm soil C density was able to be approximately estimated.
The C density of 0–100 cm soil (SOC100) was estimated for each soil group by
SOC100 = SOCp + SOCp−100 (3)
where SOCp is the C density to profile depth, and SOCp−100 is the C density fromprofile depth to 100 cm. SOCp was calculated by using the layer-based method asdiscussed in the previous section, but to estimate SOCp−100, a quantitative relation-ship between organic C content and depth was first established (see Section 3.2),and then with other characteristics of the lowest horizon extrapolated to this layer,SOCp−100 was able to be calculated by employing the integral calculous approach.
Area-weighted means were presistently used throughout this study whenever Cdensity and profile depth needed to be averaged.
3. Results an Discussion
3.1. MAIN SOILS AND THEIR DISTRIBUTION
Defined as given above, tropical and subtropical China is located from latidude 4to 32 degrees north. The mean annual temperature of the region varies from 14 to28 ◦C and the annual rainfall from 1200–2500 mm, with both variables appearinglarger in the south than in the north. Moreover, as the hilly east is to the pacificsea while the plateau and mountainous west is shielded by the Himalayas, districtdifferences in climate exist between the two subregions (CGRY, 1985).

ORGANIC CARBON STORAGE IN SOILS 49
Figure 2. Main soils in tropical and subtropical China.
Affected mainly by climate, there are as many as 18 soil groups in the regionaccording to the Chinese Soil Taxonomy. By digitizing calculation, Map of Soilsin the Red and Yellow Soil Region of China (1:4 M) gives a total land area ofabout 215 Mha, of which around 90% is covered by red soil (29%), yellow soil(16%), lateritic red soil (13%), limestone soil (8%), purplish soil (6%) and paddysoil (14%). Lotosol as a tropical zonal soil amounts only to about 2.5% (Figure 2).
3.2. VERTICAL DISTRIBUTION OF SOIL ORGANIC C
It is well known that soil organic C level declines commonly with depth, but as faras the quantitative relationship between the two is concerned, quite limited inform-ation we can find from the literature. Simple power and exponential functions inparticular have been proven applicable in describing C accumulation in profiles forsome soils (Bennema, 1974; Arrouays and Pelissier, 1994; Bernoux et al., 1998).But, more complex patterns of C with depth have been identified in others (Elzeinand Balesdent, 1995; Stone et al., 1993).
Most soils in tropical and subtropical China supported the C-declining obser-vation, but also showed that there are soils such as coastal sandy soil and coastalsolonchaks, in which C distributes unanimously throughout the entire profile (Fig-ure 3). The latter is likely due to the low plant debris controlled by limited plantgrowth and the frequently variable hydrological conditions of these soils. For theformer, our simulation analysis at both soil group and subgroup levels indicated

50 L. ZHONG ET AL.
Figure 3. Soil organic C distribution with depth. (a) Uncultivated lateritic red soil, western; (b) yellowred soil, eastern; (c) cultivated yellow soil, western; (d) coastal solonchak and sandy soil.
that the relationship between organic C content and soil depth can be described byequation:
C = (c + D)/(a + bD) (4)
or
C = 1/(a + bD) (5)
where C is organic C content (%), and D is depth (cm). For soils in the east, Equa-tion (4) gave correlation coefficients (R2 value) varying from 0.28–0.85, averaged0.47; Equation (5) yielded R2 values varying from 0.24–0.85, averaged 0.45. In thewest, Equation (4) was supported by R2 values ranging from 0.22–0.62, averaged0.39, while Equation (5) had R2 values from 0.22–0.55, averaged 0.38. The resultsshow that Equation (4) seems better than Equation (5), however, sometimes thevalues of a, b and c were too large, causing inconvenience to use.

ORGANIC CARBON STORAGE IN SOILS 51
TABLE IA
Soil organic C density categorized by subgroup
Eastern part
Soil group FAO Subgroup No. of Profile depth C density, kg C m−2
classification profiles (cm) Profile 0–20 cm
Latosol Haplic Acrisols Lotosol 672 99.0±6.8 8.01±2.71 2.29±1.00
Redish ∼ – – – –
Yellowish ∼ 197 100.0±7.3 10.63±3.73 3.29±1.51
Cultivated ∼ 28 90.5±8.1 4.85±0.84 1.17±0.19
Lateritic red soil Haplic Acrisols/ Lateritic red soil 204 101.3±6.8 8.80±2.31 3.00±1.17
Alisol Yellowish ∼ – – –
Young ∼ 39 97.3±10.7 7.62±2.55 2.49±0.95
Cultivated ∼ 140 101.5±7.7 6.39±1.62 1.95±0.47
Red soil Haplic Alisol/ Red soil 684 99.4±2.8 8.46±2.37 3.38±1.02
Haplic Acrisol Yellow ∼ 326 96.6±5.6 11.27±2.71 4.60±1.30
Cinnamon red ∼ 42 97.8±9.1 7.22±2.70 2.69±0.88
Young ∼ 162 83.9±17.1 3.88±1.79 1.54±0.74
Cultivated ∼ 618 98.9±8.4 9.42±3.62 2.71±0.83
Yellow soil Haplic Alisol Yellow soil 533 96.1±9.5 13.43±4.28 5.78±2.11
Surface gleyed ∼ 91 86.5±11.6 12.74±4.44 6.03±2.49
Young ∼ 80 56.7±14.8 7.30±3.56 3.99±1.62
Cultivated ∼ 10 99.6±7.9 9.55±3.00 2.18±0.59
Yellow brown soil Ferric/Haplic Yellow brown soil 47 92.0±9.0 11.34±4.82 4.36±1.18
Luvisol Young ∼ 16 54.0±5.7 9.11±3.15 5.60±2.74
Purplish soil Calcaric Regosol Purplish soil 369 86.2±11.0 6.36±2.84 2.22±0.47
Cultivated ∼ 21 92.9±6.6 5.82±1.17 2.01±0.62
Limestone soil Regosol/Leptisol Red ∼ 32 100.3±12.3 16.67±6.78 4.51±2.80
Brown ∼ 53 53.7±16.0 7.51±3.03 3.59±1.35
Yellow ∼ 36 89.6±11.7 12.66±4.35 4.81±1.96
Black ∼ 12 62.6±15.1 13.71±2.99 6.31±2.03
Cultivated ∼ 104 97.3±4.9 10.53±3.36 2.65±1.24
Fluvo-aquic soil Fluvisol Fluvo-aquic soil 250 100.5±2.3 6.97±1.53 2.02±0.60
Cultivated ∼ 255 96.8±3.4 8.07±2.11 2.37±0.49
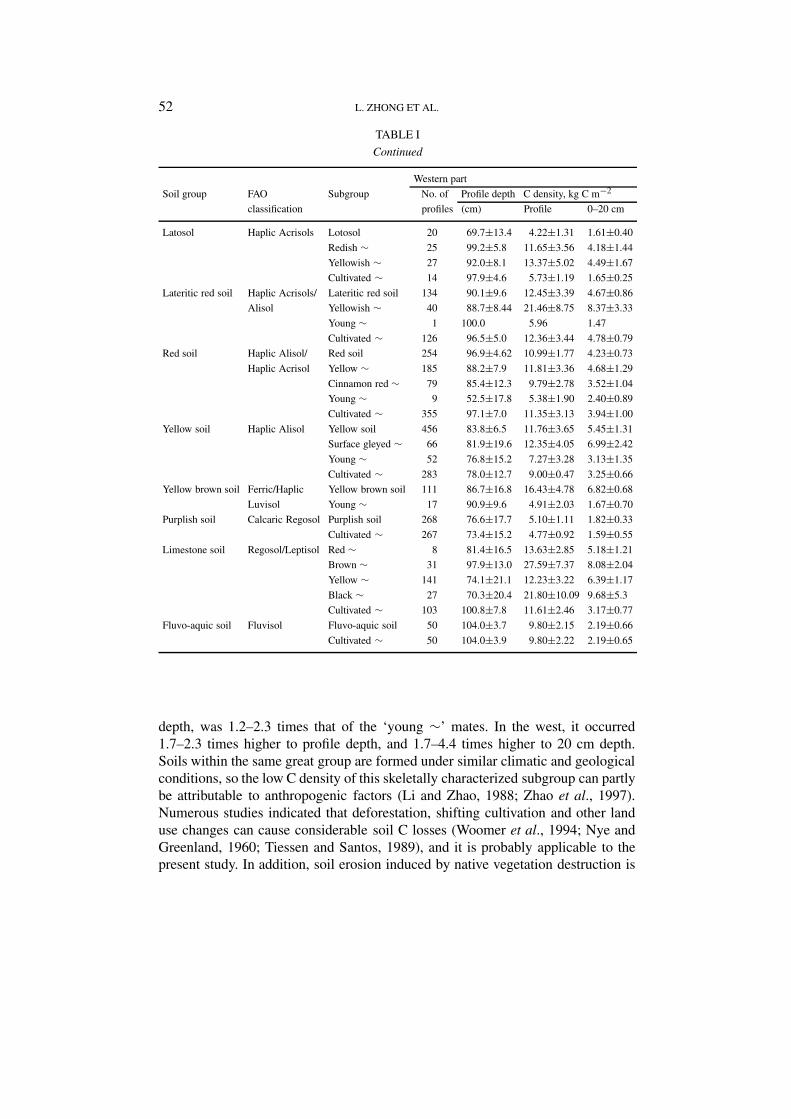
3.3. SOIL ORGANIC C DENSITY IN ACCORDANCE WITH SOIL SUBGROUPS
Table I gives the C density of the soil subgroups, and soils which were not classifiedto the subgroup level due to their small area were not included here. One pointwe can draw from Table I is that profiles of subgroup ‘young ∼’ generally wentshallower than the others within the same group, which led, therefore, to a smallerC density. The C density of the upper 20 cm soil seemed not having been affectedso strongly, but it occurred inevitably much less than that of its natural counterparts.In the east, for example, of the three major zonal soils as red soil, yellow soil andlateritic red soil, the C density of their natural subgroups, both to 20 cm and profile
52 L. ZHONG ET AL.
TABLE I
Continued
Western part
Soil group FAO Subgroup No. of Profile depth C density, kg C m−2
classification profiles (cm) Profile 0–20 cm
Latosol Haplic Acrisols Lotosol 20 69.7±13.4 4.22±1.31 1.61±0.40
Redish ∼ 25 99.2±5.8 11.65±3.56 4.18±1.44
Yellowish ∼ 27 92.0±8.1 13.37±5.02 4.49±1.67
Cultivated ∼ 14 97.9±4.6 5.73±1.19 1.65±0.25
Lateritic red soil Haplic Acrisols/ Lateritic red soil 134 90.1±9.6 12.45±3.39 4.67±0.86
Alisol Yellowish ∼ 40 88.7±8.44 21.46±8.75 8.37±3.33
Young ∼ 1 100.0 5.96 1.47
Cultivated ∼ 126 96.5±5.0 12.36±3.44 4.78±0.79
Red soil Haplic Alisol/ Red soil 254 96.9±4.62 10.99±1.77 4.23±0.73
Haplic Acrisol Yellow ∼ 185 88.2±7.9 11.81±3.36 4.68±1.29
Cinnamon red ∼ 79 85.4±12.3 9.79±2.78 3.52±1.04
Young ∼ 9 52.5±17.8 5.38±1.90 2.40±0.89
Cultivated ∼ 355 97.1±7.0 11.35±3.13 3.94±1.00
Yellow soil Haplic Alisol Yellow soil 456 83.8±6.5 11.76±3.65 5.45±1.31
Surface gleyed ∼ 66 81.9±19.6 12.35±4.05 6.99±2.42
Young ∼ 52 76.8±15.2 7.27±3.28 3.13±1.35
Cultivated ∼ 283 78.0±12.7 9.00±0.47 3.25±0.66
Yellow brown soil Ferric/Haplic Yellow brown soil 111 86.7±16.8 16.43±4.78 6.82±0.68
Luvisol Young ∼ 17 90.9±9.6 4.91±2.03 1.67±0.70
Purplish soil Calcaric Regosol Purplish soil 268 76.6±17.7 5.10±1.11 1.82±0.33
Cultivated ∼ 267 73.4±15.2 4.77±0.92 1.59±0.55
Limestone soil Regosol/Leptisol Red ∼ 8 81.4±16.5 13.63±2.85 5.18±1.21
Brown ∼ 31 97.9±13.0 27.59±7.37 8.08±2.04
Yellow ∼ 141 74.1±21.1 12.23±3.22 6.39±1.17
Black ∼ 27 70.3±20.4 21.80±10.09 9.68±5.3
Cultivated ∼ 103 100.8±7.8 11.61±2.46 3.17±0.77
Fluvo-aquic soil Fluvisol Fluvo-aquic soil 50 104.0±3.7 9.80±2.15 2.19±0.66
Cultivated ∼ 50 104.0±3.9 9.80±2.22 2.19±0.65
depth, was 1.2–2.3 times that of the ‘young ∼’ mates. In the west, it occurred1.7–2.3 times higher to profile depth, and 1.7–4.4 times higher to 20 cm depth.Soils within the same great group are formed under similar climatic and geologicalconditions, so the low C density of this skeletally characterized subgroup can partlybe attributable to anthropogenic factors (Li and Zhao, 1988; Zhao et al., 1997).Numerous studies indicated that deforestation, shifting cultivation and other landuse changes can cause considerable soil C losses (Woomer et al., 1994; Nye andGreenland, 1960; Tiessen and Santos, 1989), and it is probably applicable to thepresent study. In addition, soil erosion induced by native vegetation destruction is

ORGANIC CARBON STORAGE IN SOILS 53
also a key contributor to the low C of this subgroup, but the fate of the ‘off-land C’is not known in context of the global change.
Except for the subgroup of ‘young ∼’, cultivated soil subgroups had relativelylow C densities too, especially in the upper 20 cm soil. Of the three major zonalsoils in the east, they occurred about 20–63% less in the upper 20 cm soil ascompared with the averages of their natural counterparts; in the west, except thered soil, a decline of about 20–47% was observed. Land conversion for agriculturegenerally results in losses in organic C (Detwiler, 1986; Mann, 1986; Anderson,1995), and results from various authors vary widely, dependent on climate, soil andmanagements (Sanchez et al., 1989; Lal, 1976; Woomer et al., 1994). On average,a 20–50% loss of organic C was generally reported. The difference in C densitybetween the natural and cultivated subgroups could give information on to whatextent cultivation had caused C losses in the region. The reason of C losses aftercultivation is due mainly to an increased rate of decomposition and the reducedamount of return of plant residues.
Figure 4 presents spatially the 0–20 cm soil C density in the entire region. Itwas based on C density at the subgroup level. It shows clearly that in the east, soilC density in the upper 20 cm soil was dominantly within 2–4 kg C m−2, whilein the west, almost half was at the level of 4–6 kg C m−2. It is notable that themajority of the soil subgroups in the west had higher C densities than their eastcounterparts. It can be partly attributed to variations in climatic conditions betweenthe two subregions, but more intensive human disturbance in the east than in thewest is also responsible.
As the Chinese soil classification system differentiates from the widely citedFAO/UNESCO soil unit and the USDA taxonomy, we can hardly compare ourresults with others, especially at the subgroup level. Another problem with ourresults is that most profiles of ours could not reach 100 cm depth, although they areclose to, which makes it disputable even to compare one with another. Fortunately,most soils gave C densities close to that at the 100 cm depth (see the followingsection).
3.4. SOIL ORGANIC C DENSITY IN ACCORDANCE WITH SOIL GROUPS
After knowing the quantitative relationship between C content and depth of eachsoil group, we can estimate its C density to 100 cm depth based on the methodologystated in the previous section. Figure 5 presents the estimated C density of the eastsoils to profile and to 100 cm depth. It indicates that for east soils, the largestdiference between SOC100 and SOCp fell to brown soil and yellow brown soil(about 10%), with less variations occurring to the others. West soils differentiatedthemselves by about 3–19%.
Figures 6 and 7 give C density in 0–20 and 0–100 cm soil, respectively. In theeast, brown soil had the highest C density (6.78 and 21.4 kg C m−2, respectively, inthe upper 20 cm and 100 cm soil), followed by yellow soil, yellow brown soil and

54 L. ZHONG ET AL.
Fig
ure
4.O
rgan
icC
dens
ity
inth
e0–
20cm
soil
sof
trop
ical
and
subt
ropi
calC
hina
.

ORGANIC CARBON STORAGE IN SOILS 55
Figure 5. C density to profile and to 100 cm depth, east soil.
Figure 6. Organic C density of the 0–20 cm horizon.

56 L. ZHONG ET AL.
Figure 7. Soil C density to 100 cm depth.
limestone soil (4.6–5.5 and 12.3–14.5 kg C m−2, idem). Torrid red soil, purplishsoil and fluvo-aquic soil had the lowest C density (2.0–2.2 and 5.8–7.5 kg C m−2,idem) with the others ranking at a medium level. In the west, the C density ofpodzolic soil ranked the highest (17.9 and 55.8 kg C m−2, idem), followed by darkbrown soil, brown soil and limestone soil (6.9–11.6 and 21–29 kg C m−2, idem)and again torrid red soil, purplish soil and fluvo-aquic soil exhibited the lowest Cdensity (3.9–5.1 and 11.4–14.1 kg C m−2, idem).
Figure 8 gives the spatial distribution of soil organic C density in the upper100 cm layer. Different from Figure 4, it was based on the averaged C density atthe soil group level. It indicates that the majority of the eastern soils had a C densityof 8–10 kg C m−2, while the western soils were diversity supported by values from11–12, 12–14, 14–16, and 16–60 kg C m−2.
Our zonal soils as lotosol, lateritic red soil, red soil and yellow soil, gave Cdensities of 2.4–5.5 and 8.2–13.4 kg C m−2 in the east, respectively for the upper20 and 100 cm soil, while in the West, they showed values of 3.9–5.1 and 11.4–14.1 kg C m−2, respectively. Sanchez et al. (1982) reported a value of 8.3 kg C m−2
for 61 randomly-selected tropical profiles, which is relatively in consistent with thepresent findings for eastern lotosol, lateritic red soil and red soil, but occurs quiteless than that of the eastern yellow soil and all the western zonal soils. The Cdensity of Oxisols given by Sanchez et al. (1982) is 11.3 kg C m−2, which is inaccordance with that of the Ferralsols or Oxisols in North America estimated by

ORGANIC CARBON STORAGE IN SOILS 57
Fig
ure
8.O
rgan
icC
dens
ity
inth
e0–
100
cmso
ils
oftr
opic
alan
dsu
btro
pica
lChi
na.

58 L. ZHONG ET AL.
Figure 9. Organic C storage in the upper 100 cm soil of the region.
Bohn (1976) and matches the results of our western lotosol and red soil. But itoccurs higher than our estimates for the eastern zonal soils (except yellow soil)and is less than the values of our western lateritic red soil and yellow soil. Bohn’s(1976) value of 8 kg C m−2 for Ultosol (or Acrisol) is quite close to Kimble etal. (1990a) global Ultisol C density (8.3 kg C m−2) but slightly less than Kimble’sestimate for global Oxisol (9.7 kg C m−2), and all these results are comparable withthe C density of our eastern lotosol, lateritic red soil and red soil, but less than thatof our western zonal soils and the eastern yellow soil.
3.5. SOIL ORGANIC C STORAGE
Multiplied by the area of a soil group, its C density gives the amount of organic Cstored in the soil, and then by summing the C storage of all the soils in a region, wecan easily estimate the regional C stocks. Based on our study, the total C storage inthe upper 100 cm soils of tropical and subtropical China is about 26.8±7.4 Pg, inwhich about 52% is stored in the four zonal soils as red soil, yellow soil, alteriticred soil and lotosol. As the four zonal soils occupy about 61% of the total land area,about 10% larger than their C storage percentage, their C density occurs relativelylower than that of the regional average. Lotosol, as the only tropical soil in theregion, contributes only 2% to the total due to its smaller area. Paddy soil, with anarea of 13.8%, stores 13% of the total C, indicating that its C density is just aroundthe regional average (Figure 9).
Various authors have estimated the amount of organic C in the soil of tropics.Kimble et al. (1990b) estimated a value of 496 Pg C in the upper 100 cm soil,which matches well with the estimation of 506 Pg C given by Eswaran et al. (1993).Batjes (1996) reported a relative lower result of 384–403 Pg C for 0–100 cm soil.Accordingly, the amount of organic C stored in the soil of tropical and subtropicalChina amounts about to 5.5–7.5% of the world’s tropical total.

ORGANIC CARBON STORAGE IN SOILS 59
4. Conclusions
National soil survey has the great potential in providing a regional database forsoil organic C, but it has disadvantages. For the Second National Soil Survey ofChina, soil profiles were not extended to the well-accepted depth of 100 cm, whichimpeded greatly the effort in estimating the C density in the upper 100 cm soil.However, simple models characterizing the vertical distribution of soil organic Cin profiles can help solve the problem. In tropical and substropical China, it wasfound that soil organic C content (C in %) changes with depth (D in cm) followinga pattern of: C = (c+D)/(a+bD), or C = 1/(a+bD). Extrapolation of what foundedhere to other regions should be done with caution.
A soil map at an appropriate scale contributed greatly to the accuracy of theregional soil C density and storage estimation, and GIS techniques is proved to bea very useful means for characterizing the spatial distribution of C on a regional ornational scale. By using the Map of Soils in the Red Soil and Yellow Soil Region ofChina (1:4 M) as the ‘blueprint’ and data from the Second National Soil Survey, weestimated that there are about 26.8±7.4 Pg organic C stored in soils of tropical andsubstropical China. The C density of soil subgroups in the region varied from 1.2 to9.7 C m−2 in the upper 20 cm soil. In the east, the C density of soil groups rangedfrom 2.0–6.8 and 5.8–21.4 C m−2 for the upper 20 and 100 cm soil, respectively,while in the west, it occurred from 3.9–17.9 and 11.4–55.8 kg C m−2 correspond-ingly. On average, cultivation was estimated having caused a carbon loss of about20–63% in the region.
Acknowledgements
The authors are grateful to Dr. Z. C. Cai for his helpful suggestions through thisstudy, and Dr. C. F. Xi for making provincial soil data available and helpful ex-planation to the principles guiding the Second National Soil Survey. This researchwas founded partly by a National Natural Sciences Foundation Grant 49631010and partly by the Laboratory of Material Cycling in Pedosphere, Academia Sin-ica (grant number 2–951505). This study was also supported by the PresidentFoundation of the Chinese Academy of Sciences.
References
Anderson, D. W.: 1995, ‘Decomposition of Organic Matter and Carbon Emissions from Soils’, inR. Lal, J. Kimble, E. Levine, and B. A. Stewart (eds.), Soils and Global Change, CRC/Lewispublishers, Boca Raton, FL, U.S.A., pp. 165–175.
Arnold, R. W.: 1995, ‘Role of Soil Survey in Obtaining a Global Carbon Budget’, in R. Lal, J.,Kimble, E. Levine and B. A. Stewart (eds.), Soils and Global Change, CRC/Lewis Publishers,Boca Raton, FL, U.S.A., pp. 257–263.
Arrouays, D. and Pelissier, P.: 1994, Soil Science 157, 185.Batjes, N. H.: 1996, European Journal of Soil Science 47, 151.

60 L. ZHONG ET AL.
Bennema, J.: 1974, Pedologie XXIV 2, 119.Bernoux, M., Arrouays, D., Cerri, C. C. and Bourennane, H.: 1998, Soil Science 163, 941.Bohn, H. L.: 1976, Soil Sci. Soc. Am. J. 140, 468.CGRY (Cooperative Group for Soil Improvement and Utilization Division in Red and Yellow Soil
Regions): 1985, Soil Utilization and Amelioration Division in Red and Yellow Soil Regions,Agriculture Press, Beijing, 192 pp. (in Chinese).
Detwiler, R. P.: 1986, Biogeochemistry 2, 67.Elzein, A. and Balesdent, J.: 1995, Soil Sci. Soc. Am. J. 59, 1328.Eswaran, H., Van den Berg. E. and Reich, P.: 1993, Soil Sci. Soc. Am. J. 57, 192.Eswaran, H. E., Van den Berg, E., Reich, P. and Kimble, J.: 1995, ‘Global Soil Carbon Resources’,
in R. Lal, J. Kimble, E. Levine and B. A. Stewart (eds.), Soils and Global Change, CRC/LewisPublishers, Boca Raton, FL, U.S.A., pp. 27–43.
Kimble, J., Cook, T. and Eswaran, H.: 199a, ‘Organic Matter in Soils of the Tropics’, in Proc. Symp.Characterization and Role of Organic Matter in Different Soils, 14th International Congress ofSoil Science, Tokyo, Japan, 12–18 Augustus 1990, pp. 250–258.
Kimble, J. M., Eswaran, H. and Cook, T.: 1990b, ‘Organic Carbon on a Volume Basis in Tropical andTemperate Soils’, in Transactions of the 14th International Congress of Soil Science 5, 248–253.
Lal, R.: 1976, Proc. Soil Sci. Soc. Amer. 40, 762.Li, Z. and Zhao, O. G.: 1998, Climatic Change 40, 119.Mann, L. K.: 1986, Soil Sci. 42, 279.Nye, P. H. and Greenland, D. J.: 1960, ‘The Soil under Shifting Cultivation’, in Commonwealth
Bureau of Soils (ed.), Tech. Comm. No. 51, Hapenden, England.Post, W. M., Peng, T. H., Emanuel, W. R., King, A. W., Dale, V. H. and DeAngelis, D. L.: 1990,
American Scientist 78, 310.Sanchez, P. A., Gichuru, M. P. and Katz, L. B.: 1982, ‘Organic Matter in Major Soils of the Tropics
and Temperate Regions’, in Non-Symbiotic Nitrogen Fixation and Organic Matter in the Tropics,12th International Congress of Soil Science, New Delhi, pp. 99–114.
Sanchez, P. A., Palm, C. A., Szott, L. T., Cuevas, E. and Lal, R.: 1989, ‘Organic Input Managementin Tropical Agroecosystems’, in Coleman, D. C., Oades, J. M., Uehara, G. (eds.), Dynamics ofSoil Organic Matter in Tropical Ecosystems, Univ. Hawaii Press, Honolulu, pp. 125–152.
Schimel, D., Enting, I. G., Heimann, M., Wigley, T. M. L., Raynaud, D., Alves, D. and Siegenthaler,U.: 1995, ‘CO2 and the Carbons Cycle’, in Houghton, J. T., Meira Filho, L. G., Bruce, J. et al.(eds.), Climate Change 1994, Cambridge University Press, Cambridge, pp. 35–71.
Schlesinger, W. H.: 1977, Annual Revue of Ecology and Systematics 8, 51.Schlesinger, W. H.: 1991, Biogeochemistry: An Analysis of Global Change, Academic Press, San
Diego.Schlesinger, W. H.: 1993, Vegetatio 104, 295.Stone, E. L., Harris, W. G., Brown, R. B. and Kuehl, R. J.: 1993, Soil Sci. Soc. Am. J. 57, 179.The National Soil Survey Office: 1993, Soil Species of China, Vol. I, China Agricultural Press,
Beijing, 924 pp. (in Chinese).The National Soil Survey Office: 1994, Soil Species of China, Vol. III, China Agricultural Press,
Beijing, 744 pp. (in Chinese).The National Soil Survey Office: 1996, Soil Species of China Vol. VI, China Agricultural Press,
Beijing, 880 pp. (in Chinese).Tiessen, H. and Santos, M. C. D.: 1989, Plant and Soil 119, 337.Wen, Q. W.: 1984, Study Methods of Soil Organic Matter, (in Chinese), Agricultural press, Beijing,
318 pp.Woomer, P. L., Martin, A., Albrecht, A., Resck, D. V. S. and Scharpenseel, H. W.: 1994, ‘The im-
portance and Management of Soil Organic Matter in the Tropics’, in Woomer, P. L. and Swift, M.J. (eds.), The Biological Management of Tropical Soil Fertility, John Wiley & Sons, Chichester,U.K., pp. 47–80.
Zhao, Q. G., Li, Z. and Xia, Y. F.: 1997, Nutrient Cycling in Agroecosystems 49, 229.