organic carbon balance and net ecosystem metabolism in chesapeake bay
TRANSCRIPT

Vol. 150: 229-248,1997 ' ~ MARINE ECOLOGY PROGRESS SERIES
Mar Ecol Prog Ser Published April 30
Organic carbon balance and net ecosystem metabolism in Chesapeake Bay
'University of Maryland System, Center for Estuarine and Environmental Studies, Horn Point Environmental Laboratory, PO Box 775, Cambridge, Maryland 21613, USA
'University of Maryland System, Center for Estuarine and Environmental Studies, Chesapeake Biological Laboratory, PO Box 38. Solomons. Maryland 20688, USA
ABSTRACT: The major fluxes of organic carbon associated with physical transport and biological metabolism were compiled, analyzed and compared for the mainstem portion of Chesapeake Bay (USA). In addition, 5 independent methods were used to calculate the annual mean net ecosystem metabolism (NEM = production - respiration) for the integrated Bay. These methods, which employed biogeochemical models, nutrient mass-balances and summat~on of individual organic carbon fluxes, yielded remarkably similar estimates, with a mean NEM of +50 g C m-2 yr.' (i SE = 7.51, which is approximately 8% of the estimated annual average gross primary production. These calculat~ons suggest a strong cross-sectional pattern in NEM throughout the Bay, wherein net heterotrophic meta- bolism prevails in the pelagic zones of the rnaln channel, while net autotrophy occurs in the littoral zones which flank the deeper central area. For computational purposes, the estuary was separated ~ n t o 3 regions along the land-sea gradient: (1) the oligohaline Upper Bay (1 1 "L of total area); (2) the meso- haline Wd Bay (36% of area); and (3) the polyhallne Lower Bay (53% of area). A distinct regional trend in NEM was observed along this salinity gradient, with net heterotrophy (NEM =-87 g C m-' yr-') in the Upper Bay, balanced metabolism in the Mid Bay and net autotrophy (NEM = +92 g C m-' y r ' ) in the Lower Bay. As a consequence of overall net autotrophy, the ratio of dissolved inorganic nitrogen (DIN) to total organic nitrogen (TON) changed from D1N:TON = 5.1 for riverine inputs to D1N:TON =
0.04 for water exported to the ocean. A striking feature of this organic C mass-balance was the relative dominance of biologically mediated metabolic fluxes compared to physical transport fluxes. The over- all ratio of physical TOC inputs (I) to biotic primary production (P) was 0.08 for the whole estuary, but varied dramatically from 2.3 in the Upper Bay to 0.03 in the Mid and Lower Bay regions. Similarly. ecosystem respiration was some 6-fold higher than the sum of all physical carbon sinks. This general negative correspondence between 1:P ratio and NEM, which occurred among Bay regions, was also evident in data available for organic C fluxes in other coastal ecosystems. An inverse relationship between NEM and P, postulated in a previous study, did not apply to Chesapeake Bay, and closer examination of available data revealed the importance of the loading ratio of DIN:TOC as a key control on coastal NEM. It is proposed here that the general global trend of coastal eutrophicatlon will lead to increasing values of NEM in estuaries worldwide. The management implications of this trend are com- plex, involv~ng both increased potential fisheries harvest and decreased demersal habitat.
K E Y WORDS: Net ecosystem metabolism Production . Respiration Organic carbon . Inorganic nutri- ents Estuaries. Chesapeake Bay
INTRODUCTION
Rates of organic production in estuaries and other coastal ecosystems are among the highest in the bio-
'E-mail:[email protected] "Present address: U.S. Geological Survey, 385 Middlefield
Rd, Menlo Park, California 94025, USA
sphere (Kelly & Levin 1986). This characteristically rich productivity has been attributed to the relatively high rates of nutrient inputs (Nixon et al. 1986) and to the diversity of functional groups of primary producers, including phytoplankton, benthic micro- and macro- algae, seagrasses and tidal marshes (Odum 1971). In addition to this substantial autochthonous production, many estuarine systems also receive high rates of
O Inter-Research 1997 Resale of full artlcle not permitted

230 Mar Ecol Prog Ser 150: 229-7.48, 1997
organic loading from external sources in the adjacent watershed (Meybeck 1982, Kempe 1984, Howarth et al. 1996). Much of the river-borne organic matter is, however, composed of relatively refractory dissolved organic carbon, DOC (Meybeck 1982). In addition, for rivers with moderate to high suspended sediment con- centrations, most of the particulate organic carbon, POC, is also relatively unavailable for metabolic breakdown (Ittekkot & Laane 1991) Some estuarine systems, however, receive significant inputs of labile organlc matter from external sources, such as waste- water effluents (van Es & Laane 1982) and adjacent oceanic upwelling areas (Smith et al. 1991).
These inputs of organic carbon to coastal ecosystems may have a variety of fates, depending on their origin, form and relative lability. Significant fractions of the organic inputs to estuaries are consumed by resident heterotrophic organisms, supporting their respiration and growth. There is particular interest in understand- ing how organic inputs might regulate production and harvest of the valuable coastal fisheries (Houde & Rutherford 1993), which appear to be characterized by efficient transfer of primary production to commercial yield (Nixon 1988, Costanza et al. 1993). The harvest and em~gration of these f~sh , as well as invertebrates and waterfowl feeding on estuarine food-chains, rep- resent potentially significant loss terms in the organic carbon budget of coastal ecosystems (Houde & Ruther- ford 1993). In addition, many coastal systems are con- sidered to be effective traps for inputs of suspended particulates from adjacent watershed and oceanic sources (e.g. Schubel & Carter 1984), resu.l.ting in accu- mulation of particulate organic carbon in estuarine bottom sediments. Although most of this POC is con- sumed and respired by benthic organisms, a substan- tial fraction may be buried indefinitely (e.g. Roden et al. 1995).
The balance between primary production (P) and total respiration (R) in a particular ecosystem is a measure of both its trophic status (Odum 1956) and availability of autochthonous organic matter for har- vest and export to adjacent regions (e.g Fisher & Likens 1973). For an autotrophic ecosystem, in which P > R, organic matter will be buried or exported; when P i R, the ecosystem is heterotrophic, and its mctdbolism must be supported by stored or import.ed organic matter. The net metabolic balance of an ecosystem is indicated by the difference between P and R or the ratio, P: R . In general, inorganic nutrients are assimilated and removed from the environment by primary production and regenerated back in respiratory processes. Hence, autotrophic systems tend to require inputs of inorganic nutrients from ex- ternal sources, while heterotrophic systems regener- ate and export nutrients (Smith et al. 1991). Although
globally averaged long-term mean rates of primary production and respiration tend to converge (e.g Odum 1956), imbalances In P and R at smaller scales contribute to the functional coupling anlong adjacent regions via exchanges of inorganic nutrients and organic carbon. Understanding the metabolic balance within plankton cornmunltles is useful for predicting POC deposition from pelagic to t~cnthic subsystems in coastal environments (Kemp & Boynton 1992, Oviatt et al. 1993, Baines et al. 1994). The P : R ratio IS also a useful index for assessing the relatlve importance of 'new' versus 'regenerated' production in aquatic eco- systems (Quinones & Platt 1991). Even at a global level, concepts of net ecosystem metabolism can be useful in assessing contributions of specific systems to large-scale carbon budgets (e.g. Smith & Hollibaugh 1993).
There are a variety of methods which have been used for estimating net ecosystem metabolism (NEM = P - R) of coastal regions. One of the most common approaches involves analysis and summati.on of indi- vidual rate measurements for primary production and respiration of plankton and benthic communities at specific sites and times (van Es 1977, Garside 8 Mal- one 1978, Jassby et al. 1993). Although this approach allows partitioning overall rates among individual processes and describing temporal and spatial pat- terns (e.g. Dollar et al. 1991., Smith & Kemp 1995), it is limited by the need for large data sets and by its tendency to yield large propagated errors from summed rates (e g. Smith 1991). A related method involves measuring die1 or seasonal changes in oxy- gen or inorganic carbon pools integrated over the whole water column (e.g. Odum 1956, Kenney et al. 1988, Howarth et al. 1996). Large and variable physi- cal transport typical of many coastal waters can, how- ever, generate fluctuations in oxygen concentrations which mask signals associated with P and R (Kemp & Boynton 1980). Alternative approaches involving bio- gcochemical models have also been employed suc- cessfully to calculate NEM (e.g Nixon & Pilson 1984, Smith et al. 1991) These models tend to provide well- constrained integrated estimates of ecosystem metab- olism averaged over broad scales, but they are not appropriate for detailed analyses of temporal and spdtidl patterns.
Although there are surprisingly few direct estimates of net organic carbon metabolism for coastal ecosys- tems, a recent review of the literdture hctq suggested a preponderance of annual net heterotrophy. especidlly for the more productive systems (Smith & Hollibaugh 1993). Indeed, net heterotrophy would be expected for coastal ecosystems receiving large inputs of allochtho- nous organic matter from its rivers (e.g. Kempe 1984); however, this description may not be consistent with

Kenip et al.. Net ecosystem meJgbolisn~
the idea of estuaries as traps for particulate organic matter and as sources of bountiful fisheries harvests (e.g. Nixon & Pilson 1984, Nixon 1988). Direct experi- ments have demonstrated that increased inputs of in- organic nutrients, without parallel additions of organic carbon, tend to cause increases in both P and NEM for estuarine systems (Oviatt et al. 1986). Within a given water-course along the land-sea gradient, one might expect regional variations in the metabolic balance of ecosystems, where net autotrophic regions transport excess organic matter to adjacent regions which are net heterotrophic (Heath 1995). There are a number of factors which will tend to regulate NEM in an estuar- ine system, including inputs of inorganic nutrients, exchange rate with the adjacent seaward region, and loading rates and lability of organic carbon (Hopkinson & Vallino 1995).
Chesapeake Bay (USA) is considered to be anlong the most produ.ctive estuaries worldw~de, with escep- tionally high rates reported both for algal photosyn- thesis (Boynton et al. 1982) and fisheries harvest per unit primary production (Nixon 1988). Although an initial calculation of major metabolic and physical organic carbon fluxes was presented over 2 decades ago (Biggs & Flemer 1972), there are no current pub- lished estimates for the Bay's overall balance of organic carbon, fluxes. In the intervening years since publication of that preliminary carbon budget, there have been nu.merous measurements of organic carbon fluxes reported for the Bay, includ~ng plankton pro- duction and respiration (Malone et al. 1986, 1988, Smith & Kemp 1995), benthic respiration (Boynton & Kemp 1985, Roden & Tuttle 1993, Marvin 1995), and sediment carbon burial (Officer e t al. 1984, Dibbs 1988). In addition, many of the most important physi- cal fluxes of nutrients and organic carbon have been calculated using numerical simulation models (Cerco & Cole 1993), and well-constrained mass-balances halie been published recently for nitrogen and phos- phorus (Boynton et al. 1995)
The purpose of this paper is to present a robust budget which quantifies the major sources and sinks for organic carbon in the mainstem region of Chesa- peake Bay. Here we test the hypothesis that net metabolism in the highly productive Chesapeake Bay ecosystem is heterotrophic (Smith & Hollibaugh 1993) by comparing calculations of NEM generated from several alternative methods. We consider the relative importance of physical transport versus biological production and consumption processes in the estu- ary's organic carbon balance. We also contrast re- gional and seasonal differences in major physical and metabolic carbon fluxes, and consider implications for understanding the Bay's ecological interactions and for managing its resources.
METHODS AND APPROACH
Overall approach. Three distinct approaches were used to calculate 5 independent estimates of annual net ecosystem metabolism (NEM) for mainstem Chesa- peake Bay. These computations are based on substan- tially dlfferenl conceptualizations of physical fluxes and biogeochemical processes (Fig 1) In the first of these approaches, broadly aggregated inputs and losses of organic carbon to and from the estuarine ecosystem were organized into physical and biological
nJ Or'yniric Cnrbon Bnlni~ce
Production (P)
Algae Pnc 'lp Vasc. Plants
k v e r + TOC Inputs (I) Pool
Atmos. I"" Burral RP, Rh *c
NEIW, = P - R Plankton Benthos = ! - E
Respiration (R)
h) DIN ni ld TON Balnilces
Denitrification
Ocean Export Pool
Land & NEM,, Net Metabolism Atmosphere
TON Ocean Export
Burial
c) DIN ui id DIP Bnlailces
Denitrification
Ocean Export
Land & Atmosphere
Pool Net Metabolism NEhl,,
Fig. I . Schematics of methods used for calculating net ecosys- tem metabolism [NEM, (C units), NEM, IN units) or NEM,, ( P units)] ol Chesapeake Bay under steady state conditions: (a) organlc carbon balance, where NEM, = (P - R) = (I - E); (b) balances of d~ssolved inorganic nitrogen (DIN) and total organic nitrogen (TON), where NEM, = (l,,, - E,, - D,) = (I , , - E,,,, - B,); (c) stoich~ometrically related balances of DIN and dissolved ~noryanic phosphorus (DIP), where NEM,, = [I,, - D , - r ( l ,I , ) ] 11 - (1/16)] ', with l,,, = input of DIP and r = the ratio of D1N:DIP neal- the estual-y mouth, and NEM, = 16 NEM,. Sub- scripts as follows: c, carbon; ac, algal carbon; VC, vascular plant carbon, dc, river discharge of carbon, ad, deposition of atmospheric carbon; pc, planktonic carbon, b, benthos; n , nitrogen; in, inorganic nltroyen; on, organlc nitrogen; p , phos-
phorus; ip, inorganic phosphorus

232 Mar Ecol Prog Ser 150: 229-248, 1997
processes (Fig. l a ) . NEM was calculated as the sum- mation of all metabolic fluxes, Including gross primary production of algal and vascular plant (emergent and submersed) groups (P) and total respiration of plank- tonic and benthic communities (R). NEM was also esti- mated from the sum of physical inputs (I) from land- based and atmospheric sources and losses to burial and seaward exchange (which can also be an input) Thus, this approach provides 2 independent estimates of carbon-based net metabolism, where NEM, = (P - R ) and NEM, = (I - E).
The second and third approaches for estimating ecosystem metabolism involve developing mass- balances for nutrients (Fig. l b , c). In the second method, mass-balances are computed for pools of both dissolved inorganic nitrogen (DIN) and total organic nitrogen (TON), where the net exchange between these 2 pools gjves a nitrogen-based estimate of NEM (Fig. l b ) . For both DIN and TON pools, inputs from land and atmosphere (I,, and I,,) must be included along with exchanges between estuary and the sea (E,, and E,,). Additional losses include denitrification (D,) for the DIN pool and burial (B,) for TON; it is assumed that there is no significant burial of inorganic nitrogen (Keefe 1994). This method also provides 2 independent estimates of net metabolism (in nitrogen units), where NEM, = I,, - E,, - D, and NEM, = I,, -E , , - B,. Although a similar mass-balance scheme could be developed for phosphorus, the inability to distinguish between burial of inorganic and organic forms of P (Keefe 1994, Conley et al. 1995) complicates the calcu- lation. The third approach (Fig Ic), which is essen- t~ally the method of Nixon & Pilson (1984), provldes a flfth independent estimate of NEM. Here, parallel mass-balances are developed for DIN and dissolved inorganic phosphorus (DIP), where NEM, = I,, - E,, - D, and NEM, = I,, - E,,, respectively. This method requlres data for estimating the Input terms ( I , , , I,,) and for denitrification (D,), thus leavlng 4 unknown values (NEM,, NEM,, E,,, E,,,)- The assumption of fixed Red- field stoichiometry between DIN and DIP uptakehecy- cling in NEM yields a third equation (NEM,:NEM, = 16). The fourth equation required for a unique solution derives from assuming that the ratio of DIN to DIP exchange rates with the sea is proportional to the ratio (r) of their respective concentrations a t the estuary mouth (E,,,: E,, = r ) .
Several assumptions apply to each of these calcula- tions. Most of the data used in computations of NF:.I were taken from the time period 1986 to 1993, and while values fluctuate between years with hydrologic and meteorological changes, extremely wet or dry years (250% of the 50-year mean nverflow) were not inciuded. Although pools of nutrients and olganic carbon within the Bay may vary in size from vear to
year (e.g Boynton et al. 1982). these variations tend to be small compared to the nl~iloi nputs and losses, thus justifying steady-state dssumptions for these mass-balance calculations. For all methods, each of the terms in the mass-balances hds an associated error, which propagates through tht. calculation. In most cases, it IS difficult to estimate the ~ndividual errors, much less the cum~~lat ive propaydted errors. Because NEM is calculated as the difference between inputs and losses in all of these methods, propagated errors may make it difficult to distinguish this esti- mate from zero With some knoi\,ledge about the variance and error d.istributions for each of the major terms of each mass balance, we could construct a bootstrap calculation of errors using Monte Carlo techniques (e.g. Efron & Tibshirani 1991). In most cases where such approaches have been used, how- ever, the estimates of error d~stributions themselves have an unquantified uncertainty, which is typically ignored. Therefore, we have not attempted to esti- mate propagated errors, but instead take the pluralis- tic dpproach of computing the same endpoint (NEM) using 5 in.dependen.t methods.
Study site description. In this paper, the major fluxes and transformation processes involving organic carbon are calculctted for the mainstem of Chesapeake Bay (Fig 2). This estuarine ecosystem is defined here as the tidal water extending in length some 300 km in a north-south direction from Susquehanna Flats to the Bay Bridge-Tunnel, and in width (5 to 30 km) between mean tidal water-levels and/or the mouths of lateral tributaries. Vertically, the study area is taken to extend from the water surface down to the depth limit for metabolically active sediments; thus, benthic respi.ra- tion is considered an internal process, while long-term sediment burial is considered a loss from the system. All area-depth-volume relations used in these calcula- tions were taken from previously compiled Bay statis- tics (Cronin & Pritchard 1975). Three ecologically dis- tinct regions are defined for the estuary, with the Upper Bay (oligohaline) separated from the Mid Bay (mesohaline) near latitude 39" N, and Mid and Lower Bay (polyhaline) separated just below latitude 38'N (Fig. 2). The upper 2 regions are similar to those defined previously as the northern Bay (Biggs & Fle- mer 1972) and the Maryland Bay (Boynton et al. 1995). Major metabolic processes (P and R ) were measured routinely from 1988 to 1992 at stations (Fig. 2, 'process stations') located within each of the 3 regions; and nutrient and organic carbon pools were measured every 2 to 4 wk at 40 to 50 stations ('EPA Monitoring') and monthly a t an additional 18 stations ('NSF Map- ping') over the study period (Fig. 2). For each Bay region hypsograph~c relations were developed for depth versus both water surface area and water vol-

Kemp et al. Net ecosystem nietabolis~n 233
-- p --P- -
and vertical distributions of algal bio- mass (Smith & Kemp 1995). Jn general, th.e depth of the euphotic zone ( l 'h sur- face irradiance) was slightly shallower (6 to 10 m) than the pycnocline depth (8 to 12 m) in the Mid Bay region and sim- ilar to or deeper than the pycnocline (5 to 10 m vs 3 to 8 m) in the Lower Bay; the water colunln 1va.s vertically mixed in the Upper Bay, with a euphotic zone depth of 3 to 4 m. Plankton respiration rates were vertically integrated by mul- tiplying volumetric rates by mean heights of the upper and lower water colu.mn layers (e.g. Kemp et al. 1992). Recent estimates of plankton commu- nity photosynthetic and respiratory quo- tients reported Bay-wide mean values of 1.26 and 1.19, respectively, but neither was significantly different from 1.0 (Stokes 1996). Benthic community respi- ration was calculated in O2 equivalents as the sum of sulfate reduction rates (assuming the stoichiometric molar rela- tion 02 :S0 , = 2) plus half of the sedi- ment oxygen consumption (SOC) rates (assuming the other half is attributable to sulfide reoxidation). This approach, which has been used previously for the Mid and Lower Bay regions (e.g Roden & Tuttle 1993), is also appropriate for the Upper Bay because sulfate reduction is still the predominant anaerobic respira- tory process, even in this low salinity region (Mal-vin 1995) A respiratory quotient of 1.0 was used to convert O2 rates into carbon units, based on numer-
Fly. 2. Map of Chesapeake Bay defining 3 functionally distinct regions ous contemporaneous observations of (Upper, Mld, and Lower) and showlng s~~rnp l ing stations for rate processes O2 and total CO, (TC02) fluxes across ('Process') and for physical, chern~cal dnd biological properties measured In
monthly ( 'NSF Mapping') and fortnightly cruises ('EPf\ Monitoring') th.e sediment-water interface (P. Sam- pou unpubl.). Rates of sulfate reduction (Roden & Tuttle 1993, Marvin 1995) and
ume to calculate the height of the bottom water layer SOC (Cowan & Boynton 1996) were available for deep (below the pycnocline) and to dist.inguish between lit- (sub-photic) sediments in all 3 regions of the Bay. toral and pelagic areas (e .g . Kemp et al. 1992, Smith & The estuarine cross-section was separated into meta- Kemp 1995). bolically distinct sections, including pelagic photic and
Planktonic and benthic production and respiration. aphotic zones, distinguished by the euphotic depth Rates of plankton community production and respira- (depth of 1 %, surface irradiance), and littoral zones, tion were based on 1ight:dark bottle incubations using where sediment surfaces are above the euphotic high-precision oxygen titration methods (Smith & depth. Because of the limited availability of data for Kemp 1995). Vertically integrated rates of gross pri- both benthic (algal) primary production (Rizzo & Wet- rnary production, which were estimated as the sum of zel 1985) and shallow planktonic P and R (e.g. Kemp & daytime net production plus dark respiration, were cal- Boynton 1981) in Chesapeake Bay, alternative culated using photosynthesis versus irradiance rela- approaches were developed for estimating metabolic tions, vertical attenuation of downwelling irradiance rates in the littoral zone. Annual mean rates of verti-

234 Mar Em1 Prog Ser 150; 229-248, P997
cally integrated total primary production were taken to be constant at all depths over a given Bay cross- section. This assumes that, while volumetric rates may vary over depth gradients, vertically integrated areal rates would be constant under light-limited conditions (e.g. Wofsy 1983). This also assumes that the sum of planktonic plus benthic production in the littoral areas is similar to the integrated plankton community pro- duction in the adjacent pelagic region, and that the littoral photic zone is simply con~pressed withln the benthic algal habitat (Sand-Jensen 1989, MacIntyre et al. 1996). Recent observations in Chesapeake Bay (Petersen et al. 1997, M. Kemp unpubl.) support these assumptions. On the other hand, volumetric rates of planktonic community respiration were taken to be constant over the cross-section (Kemp & Boynton 1980, 1981), indicating that densities and activities of het- erotrophic organisms did not vary with water column depth (e.g Shiah & Ducklow 1994). In addition, exist- ing data on sediment-water fluxes of oxygen and total inorganic carbon in the Mid Bay region have revealed that rates in littoral areas (<B m depth) are consistently lower (by an average of 501%)) than those measured for the deep pelagic sediments (Kemp unpubl.). Thus, benthic respiration rates in the littoral areas were taken to be half those in adjacent deep sediments.
An estimate of the contribu.tions of submersed vascu- lar plants and low intertidal marsh plants to the Bay's carbon balance was also made. It was assumed that the total respiration associated with these vdscular plant habitats was already taken into account in the above- described scheme, so only net plant production was included in this calculation. It was anticipated that these contribution.^ of organic carbon product~on would be relatively small, because the mainstem Bay has relatively little bordering intertidal marsh habitdt (Stevenson et al. 1988) and the current abundance and areal coverage of submersed vascular plants is drasti- cally reduced compared to its historical levels (Kemp ct
al. 1983, Orth & Ivloore 1983). Observations on the area of submersed plant coverage (Batiuk et al. 1992) were multiplied by representative rates of net plant produc- tion for Upper and Lower Ray regions (Kemp et. al. 1984, Orth & Moore 1986). Estimates of steady-state contributions from intertidal marshes to the Bay's C balance were obtained by multiplying area of marsh coverage surrounding the mainstem Bay (Stevenson et al. 1988) by a value for mean annual export of organic carbon from coastal marshes of North America (Nixon 1980). Finally, potential contribution of organic matter from eroding marshes was also included in this calcu- lation by multiplying estimates of annual areal loss (Horton & Eichbaum 1991) by mean values for organic content, bulk density and depth of peat for eroding marshes in the Bay region (Stevenson et al. 1985)
Nutrient mass-balance calculations. Inputs of DIN, TON and DIP were estimated from the same data set used in developing a recent nutrient budget for Chesa- peake Bay (Boynton et al. 19951 To accompl~sh this, it was necessary to use the original data to partition esti- mates of total N and P inputs into dissolved inorganic and total organic forms. Similarly, data from mapping surveys in a process oriented study (LMER Coordinating Com- mittee 1992) were used to compute partitioning of total nitrogen concentration into pools of ammonium, nitrate (plus nitrite), dissolved organic and particulate organic nitrogen along the main axis of the Bay. Estimates of den- itrification, sediment burial, and atmospheric deposition of DIN. TON and DIP were taken directly from Boynton et al. (1995), with adjustments for differences in defini- tion of boundaries. For the mass-balance calculations of DIN andTON, nitrogen exchanges at the Bay mouth and at the mouths of major tributaries were computed from model simulation output for the nominal 'mean' hydro- logical \-car, 1986 (Cerco & Cole 1993, C. Cerco pers. comm.). The tributaries considered in this analysis (PO- tom.ac, James, York, Rappahannock, and Patuxent, and Patapsco/Back Rivers, Fig. 2), combined with the Susquehanna River, account for >90 of the total fresh- water runoff to the Chesapeake Bay system. These nu- merical computations of nitrogen exchange at the sea- ward boundaries of the Ray and its major tributaries were remarkably close to those estimated by difference in mass-balance calculations (Boynton et al. 1995).
Physical inputs and losses for organic carbon. Inputs of total organic carbon (TOC) from the Susque- hanna River to the mainstem Bay were also calculated from the same data set used in developing nutrient loading estimates (Boynton et al. 1995, R Sl~nimers unpubl.). Point source inputs from sewage and 1nd.u~- trial effluents were derived from data used for the numerical simulation model (Cerco & Cole 1993), and physical exchanges at the mouths of the Ba) and its major tributaries were computed as output from model simulations for 1986 (C Cerco pers. cornm.). The same tributaries were included in this analysis as those listed above for nutrient budget calculations. Data fro~n thc Bay monitoring program [e.g Magnien et al. 1992) were used to examine seasonal patterns in the vertical distribution of TOC at mouths of the mainstem Bay and the Potomac estuary and to consider if these were con- sistent 1~1th the computed exchange rates. Organic carbon losses through sediment burial were calculated from the same data set as used previously for nutrient budgets (Boynton et al. 1995), with addition of sedi- ment carbon content (Boynton & Kemp 1985, W Boyn- ton unpubl. data) and adjustments for differences in, definition of Bay area. Estimates of carbon rcmoved from the Bay in fisheries harvest also parallel prevlous calculations for nutrient budgets (Boynton et al. 199.5).
Kemp et al.. Ncl ecosystenl nletabolism 235
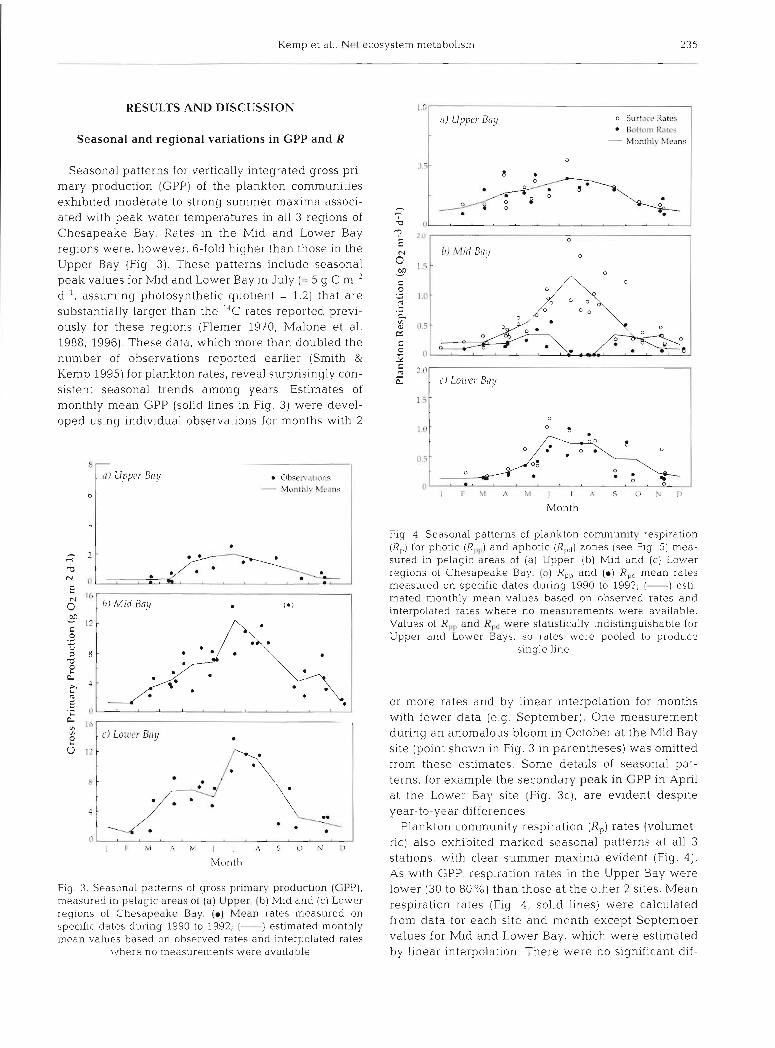
Seasonal patterns for vertically integrated gross pri- mary production (GPP) of the plankton communities exhibited moderate to strong summer maxima associ- ated with peak water temperatures in all 3 regions of Chesapeake Bay. Rates in the Mld and Lower Bay regions were, however, 6-fold higher than those in the Upper Bay (Fig 3). These patterns include seasonal peak values for Mid and Lower Bay in July (= 5 g C m-2 d-', assuming photosynthetic quotient = 1.2) that are substantially larger than the 14C rates reported previ- ously for these regions (Flemer 1970, Malone et al. 1988, 1996). These data, which more than doubled the number of observations reported earlier (Smith & Kemp 1995) for plankton rates, reveal surprisingly con- sistent seasonal trends among years. Estimates of monthly mean GPP (solid lines in Fig. 3) were devel- oped using individual observations for months with 2
RESULTS AND DISCUSSION 1 0
Seasonal and regional variations in GPP and R
Obsen.lt~onz - Monthly hlrar~p
n ) U p p ~ B~ny o Surf;lr~, Rates R~\lhnnl Kdlr<
- Month[\ \leans
L l h 5 [ 1 7 ) Mid Bny S 1
l I bl . \ M ) I & O N ' )
Month
Flg 3. Sea.sona1 patterns of gross primary production (GI'P), measured in pelagic areas of (a) Upper, ( b ) Mid and (c) Lower regions of Chesapeake Bay. (m) Mean rates measured on specific dates during 1990 to 1992; (-) estlnlated monthly mean values based on observed rates and interpolated rates
where no measurements were available
l i 5 : .,l h! J I \ S (1 '4 0
Month
5 2 0
Fig. 4. Seasonal patterns of plankton commun~ty respiration (R,) for photic (R,,,,) and aphotic (R,,,) zones (see Fig. 5) mea- sured in pelagic dreas of (a) Upper, (b) Mid and (c) Lower reglons of Chesapeake Bay. (o) RPp and (m) R,, mean rates measured on specific dates during 1990 to 1992, (-) esti- mated monthly mean values based on observed rates and lntei-polated rates where no measurements were available. Values of R:,,, and R,,, were statistically ind~stlnguishable for Upper and Lower Bays, so rates were pooled to produce
single line
- L
or more rates and by linear interpolation for months with fewer data (e.g. September). One measurement during an anomalous bloom in October at the Mid Bay site (point shown in Fig. 3 in parentheses) was omitted from these estimates. Some details of seasonal pat- terns, for example the secondary peak in CPP in April at the Lower Bay site (Fig. 3c), are evident despite year-to-year differences.
Plankton community respiration (R,) rates (vol.umet- ric) also exhibited marked seasonal patterns at all 3 stations, with clear summer maxima evident (Fig. 4). As with GPP, respiration rates in the Upper Bay were lower (30 to 80%) than those at the other 2 sites. Mean respiration rates (Fig 4 , solid lines) were calculated from data for each site and month except September values for Mid and Lower Bay, which were estimated by linear interpolation. There were no slgnlficant dif-
C) Loroer Bny

236 Mar Ecol Prog Ser 150 229-248, 1997
ferences between surface and bottom water respira- tion rates except In the Mid Bay between Apnl and September (Flg 4b) Respiration rates appear to peak earlier at the Lower Bay slte (June) than in the Upper and Mid Bay reglons (July to August) Vel tlcally lnte- grated plankton~c community resplratlon rates were calculated by multlplylng measured values (Fig 4 ) by respective total volumes and divid~ng by areas of lit- toral and pelagic (surface and bottom) zones of each reglon
Rates of benthic community respiration (Rk,) exhib- ited cons~derable temporal var~ability and weaker sea- sonal patterns (compared to R , ) at all 3 stud! sites (Fig 5) Overall sulfate reduction (SR) rates tended to be substantially h ~ g h e r at the Mld Bay (Fig 5b) than at either of the other locations, w ~ t h lowest values In the Upper Bay Although these rates of SR are slm~lar to those prev~ously reported for the Mid and Lower Bay regions (e g Roden & Tuttle 19931, these data include the flrst reports for Upper Bay sites and the most
I W) Upper Bay * - Suliote Raiuction --c
I C) Lozoer Boy
I A M J I S O Y D
Month
F I ~ 5 Seasonal patterns of benthlc commun~ty r e s p ~ r a t ~ o n as sulfate reduct~on (SR, converted to equivalent O2 rates as- suming SO4:O2 = 2) and sediment 0, consumpt~on rates (SOC) In areas underlying pelagic zones of (a) Upper, (b) Mid and ( C ) Lower regions of Chesapeake Bay ( 0 ) Mean SR rates mea- suredonspecif~cdatesdunng 1990 to 1992, estimatedSR (-1 and SOC (---) monthly mean values based on observed rates and ~nterpolated rates where no measurements were available
Data from Marvin (1995) and Cowan & Boynton (1996)
detailed descnptlons of seasonal cycles (Marvln 1995) Rates of sedlment oxkqen consumptlon (SOC Cowan & Boynton 1996) were considerably lower than SR at the Mid and Lower Bay sites but actually exceeded SR In the Upper Bay Sulf~de burial can account for only a small fraction ( < l 0 Howarth 1984) of SR excess over SOC The large d~fference between SR and SOC In summer at the Mid Bay site (and to a lesser extent In the Lower Bay) is, ho~vever, mostly attributable to sul- fide efflux from sedlments d~rectly Into anoxlc bottom waters, w ~ t h subsequent reox~dation near the pycno- cline (e g Kemp et a1 1992) Presumably the generally h ~ g h e r value for SOC compared to SR In the Upper Bay can be explained by relatively higher ~ a t e s of a e r o b ~ c metazoan resplrat~on Aerobic resp~ratlon accounts for a small fraction of SOC at Mid Bay but may be more important at the macrofauna-r~ch seaward s ~ t e ( e g Mayer 1992) Hence our estlmates of total benthic res- pirat~on (whlch assume that only half of SOC is a t t r~b- utable to aerobic respiration) may shghtly underestl- mate total rates for the Upper and Lower Bay areas w h ~ l e overestlmatlng rates for Mid Bay
Sed~ment-water fluxes of dissolved organic carbon have not been Included in this analysls however, these appear to be generally small (<10%) relatlve to total sedlment resp~ratlon (Burdlge & Homestead 1994) In any case, they would be accounted for In our estlmates of R,, R, or ocean exchange
Seasonal and regional variations in NEM
Integrated rates of organlc product~on and respira- tion were computed uslng the monthly mean rates of GPP, R, and R, presented in Figs 3 to 5, wlth the assumptions descnbed in 'Methods and approach' (Table 1) Durlng all seasons and particularly the sum- mer months, rates of GPP and total ecosystem resplra- tion (R) were similar In the Mid and Lower Bay reglons, but rates for the Upper Bay slte were only 20 to 50 % of these values Values of R exceeded GPP throughout the year In the Upper Bay, and annual mean NE\I was strongly net heterotrophic (Fig 61 Net heterotrophv was maximal in this reglon In March to Aprll colncl- dent with the peak dellvery of organic carbon w ~ t h the spnng freshet (Smith & Kemp 1995) Brlef per~ods of net heterotrophy, which were also evldent In the Mid and Lower Bdy reglons in May to June, correspond to the transit~on from the w~nter-spnng bloom dominated by large centnc diatoms to the summer assemblage of dlverse flagellated nanoplankters (Sellner 1987, Ma- lone et a1 1988, 1991) The tlmlng of this annual event tends to correspond to the depletion of S1 pools in these c,stuanne zones (Conley & Malone 1992) A secondary event of nl , t heterotrophy was also evldent In the

Kemp et al.. Net ecosystem metabolism 237
Table 1 Summary of annual mean values for gross primary production (GPP), community respiration (R,, and R,,) and net ecosys- tem metabolism for 3 regions of mainstem Chesapeake Bay Vertically integrated rates of GPP (Flg. 6) and volurnetnc rates of planktonic comm'unity rc.splration (R,,) (see Fig. 7) were assumed to be equal in flanks and channel, see text for explanation Rates of benthic community respiration (K,) were estimated as sulfate reduction [assuming 0 2 : S 0 , = 2 (molar)] plus hdlf of sediment 0, consumption (SOC) rates; R, rates in flank taken as half of channel rates (see Fig. 8); see text for explanation. Areal rates ( g 0, m-' y r ' ) were estimated by dividing fluxes by respective areas. Subtotals for the total Bay a re based on area-weighted sums of
regional subtotals
Region
Upper Bay Pelaglc Llttoral
Subtotal (g O2 m ' yr.')
Mid Bay Pelagic Littoral Subtotal [g 0, m-, yr-l)
Lower Bay Pelagic LlttoraI
Subtotal (g 0, m-' yr-l)
Total Bay Pelagic Littoral Subtotal (g OZ m-? yr-l)
Area (10" m') GPP
Metabolic I-ates (10" g O2 yr I )
R I ) RI, Net
Lower Bay in autumn, perhaps associated with condi- tlons of nutrient limitation (Flsher et al. 1992, Malone et al. 1996) and inp.uts of seagrass materials associated with late summer senescence and uprooting during frequent storm events (Orth & Moore 1986).
Computations presented here suggest a strong cross-sectional pattern in NEM throughout the Bay, wherein net heterotrophic metabolism dominates in pelagic zones associated with the main estuarine chan- nel, while net au.totrophy occurs in the littoral zones which flank the dee,per central area (Fig 6, Table 1 ) . This trend, which derives largely from our assumption of depth-independent production, would be appropri- ate for conditions of light-limited phytoplankton growth, where algal self-shading dominates light at- tenuation and suspended sediments have minimal effects (Wofsy 1983, Petersen et al. 1997). While sus- pended sediments contribute substantially to total light attenuation in the Upper Bay, absorption by algal pig- ments dominates in most of the Bay (Malone et a1 1996). On the other hand, contributions of benthic algae to total ecosystem production might cause littoral zone GPP to exceed that in adjacent pelagic areas, despite the shoaling euphotic zone (e.g. MacIntyre et al. 1996). A second assumption behind this computed
pattern is that volumetric rates of plankton community respiration are independent of water column depth, a pattern reported for the Mid Bay area (e.g. Kemp &
Boynton 1980, 1981) These assumptions have been generally corroborated by recent observations in the mesohaline regions of the Bay (Kemp unpubl.) and in experimental ecosystems of varying water depth (Petersen et al. 1997). We provide a sensitivity analysis of these and other assumptions at the end of this section.
A distinct pattern of regional variations in NEM was evident from these data, with net heterotrophy prevail- ing in the Upper Bay, balanced metabolism in the Mid Bay and net autotrophy in the lower estuary (Fig. 6, Table 1). This is similar to the trend reported previously (Smith & Kemp 1995) for plankton community metabo- lism in the pelagic areas along the Bay's main salinity gradient. Net heterotrophy in the Upper Bay results from the combined effects of allochthonous organic car- bon sources and high turbidity conditions enhancing respiration and inhibiting photosynthesis, respectively (Smith & Kemp 1995). The net autotrophic conditions in the southern estuary appear to result from inputs of in- organic nutrients from Lower Bay tributaries (Boynton et al. 1995) as well as the broad littoral zone which

Mar Ecol Prog Ser 150: 229-248, 1997
1 C) Lower Bay I
n l . . . . . . . . . . . l I F M A M I J A S O N D
Month
Fig. 6 . Estimated seasonal patterns of net ecosystem metabo- lism (NEM) for (a) Upper, (b) Mid and (c) Lower regions of Chesapeake Bay; NEM estimated as the sum of littoral and pelagic gross primary production (where vertically integrated rates were assumed equal in 2 areas) m ~ n u s plankton cornmu- nity respiration in littoral and pelagic photic and aphot~c areas [where volumetric rates (see Fig. 4 ) were multiplied by respective mean depths of water volumes in each area] minus benthic respiration in pelagic and littoral areas; see text for
explanation
flanks a relatively narrow channel. Previous estimates of ecosystem production and respiration for upper and middle Bay regions, although different from those pre- sented here, also S L I ~ C J E L S ~ P ~ strong net. heterotrophy in the landward section and minor net autotroph) in the mesohaline region (Biggs & Flemer 1972). Such transi- tions from heterotrophic to autotrophic metabolism along land-sea gradients have been also suggested from model-derived patterns proposed for the estuary- shelf region of large coastal systems (Heath 1995) and for the tidal fresh reaches of small marsh-dominated es- tuaries (Hopkinson & Vallino 1995).
The potential contributions from production of sea- grasses and other submersed vascular plants to the Bay-wide metabolic carbon balance were also consid- ered (Table 2). The littoral zone area of the Bay
presently occupied by seagrasses and other submersed vascular plants has been recently estimated precisely from aerial surveys (Batiuk et al. 1992). Measurements of net production of plant carbon, which were taken from detailed studies at specific Bay sites (Kemp et al. 1984, Orth & Moore 1986), may tend to overestimate the mean rates for the whole Bay. The product of these 2 numbers gives an estimate of the total net organic car- bon input from submersed plants of 50 X 10" g C yr.'; this estimate already accounts for losses to plant respi- ration and excretion. When this value is averaged over the whole Bay area, it amounts to only 9 g C m-' yr-', which is just over 1 %) of the Bay's gross plankton pro- duction. Although previous calculations indicated that submersed plants contributed approximately one-third to the total ecosystem GPP in a Bay tributary in the 1960s, dramatic declines in plant abundance have greatly reduced this influence (Kemp et al. 1983). Since the present area occupied by seagrasses is about 10'% of its historical habitat (Batiuk et al. 1992), one could speculate that prior to 1960 net production from these plants might have approached 100 g C m-2 yr-'
Inputs from emergent vascular plants, including export of both recent plant production and eroding peat from intertidal marshes, appear to contribute even less (than seagrasses) to the mainstem Bay's organic carbon balance. The total input from these combined processes associated with marsh ecosystems was esti- mated to be 36 X 10" C y r ' , which is equivalent to 6 g C m-* yr-' (< 1 ' X , of total), when averaged over the whole Bay area. Previous estimates of marsh export contributions to the Bay's total primary production indicated slightly higher values (= 5% of total); how- ever, these calculations were for the whole Bay includ- ing tributaries with much larger ratios of marsh to open water areas (Nixon 1980).
By summing and area-weighting these measure- ments of GPP and R for the 3 estuarine regions, a posi- tive (n.et autotrophy) annu.al value for net ecosystem metabolism of the whole Bay was estimated to be 108 g O2 m-' yr-l or 40 g C m-' yr-l (Table 1). Adding thc independent estimates of net organic carbon inputs from macrophytes would increase this value to 55 g C m-2 yr.' The potential probl.ems of uncertain assump- tions and error propagation cast substantial doubt on this calculation of NEM. Below we provide sensitivity calculations, which give some perspective for these estimates.
A simp1.e sensitiv~ty analysis allowed us to view the degree to which this estimate depends on key assump- tions made in the calculation. Here we varied the fol- lowing parameters: (1) photosynthetic quotient (PQ), (2) plankton community respiratory coefficient (RQ,), (3) benthic community respiratory coefficient (RQ,,), (4 ) relative size of benthic respiration (Rh) in flank ver-

Kemp et a l . Net ecosystem metabolism 239
Table 2 \nnual mean values estimated for net o r g a n ~ c carbon production and export from submcrwd and emergent vascular plant communities in mainstem
Chesapcake Bay
Comnlunity Process /\red Input rate Total input (10" m') (g C ni-L y r ' ) (10" g C y r ' )
-- - -
Subi~lersed ".ct plant production" 200 250 5 0 plants
Emergent Export of plant prod " 230 100 23 plants Annual rate of peat loss' 0 9 14 000 13
Total vascular plant lnput 86 (15 g C m-' yr-l)
"Area of existing submersed plant beds in mainstem Bay for 1990 taken from Batiuk et a1 (1992); rates of net plant production taken from Kemp et al. (1984) and Orth & Moore (1986)
"Marsh area includes 72 X 10" m' coastal high-sal~nity habitats plus 156 X 10" m' submerged upland marsh habltat (Stevenson et al. 1988); annual export rate taken from N ~ x o n (1980, Table 10 therein)
'Area1 rate of marsh loss from Horton & Eichbaum (1991), organic carbon flux estimated assuming 30 cm depth of peat , 0 1 g dw cm-' bulk densit)!, and 0.45 g C g dlv-I (Stevenson et al. 1985)
sus channel regions Changing PQ from the value of 1.0 used in our base calculation to the often-cited value of 1 25 (e g Malone et a1 1986) caused a radical de- cllne in our estimate of NEM from +39 to -71 g C m yr ' Decreasing either RQ,, or RQl, from the nominal values of 1 0 used here to values of 0 8 (also commonly used In the literature, e g. Smith & Kemp 1995) caused substantial increases in NFhl from + 39 to values of + l30 and +72 g C m ' yr ' , respectively It is interest- ing, however, that simultaneous changes in PQ, RQ, or R Q , to the alternatirie values indicated above caused very llttle change in NEW (from +39 to +53 g C m yr-') Alteinat~ve assumptions for cdlculating R, also lead to considerable changes In estimates of NEM For example, disregarding the SOC data, and assumlng R,, equal to SR rates only causes NEM to increase from +39 to +71 g C m ? yr l, while an assumption that R,, was better represented by SOC iates alone increases the NEM estimate further to + l 3 9 g C m yr ' If ~ v c assume that values of R,, were the same in channel and flank regions (rather than our base case assumption that flank rates were half of channel rates), estimates of NEM decrease from +39 to + 5 g C m-2 y r ' . G ~ v e n the uncertainty in the assuinpt~ons used here, it is clear froin this analysis that more robust alternative methods are needed for estimating NEM.
Nutrient mass-balance estimates of net ecosystem metabolism
Among the strongest evidence suggesting auto- trophic NEM for the mainsten1 of Chesapeake Bay is
seen In the longitudinal distribution of nitrogen species along the Bay's main land-sea transect (Fig 7) An example is given foi April 1989 including 4 majol mtrogen species ammonium (NH,+), nitrate plus n i t r~te (NO, + NO3 ) , dissolved organic nitrogen (DON) and paiticulate organic nitro- g m (PON) T h ~ s pattern 1s similar to otheis evident in data piesented pre- viously for the Bay and ~ t s tributaries ( e g Kemp & Boynton 1984, Ward & Twilley 1986 r ~ s h e i et a1 1988, Mag- nien et a1 1992, Boynton et a1 1995), as well as other estuarine systems ( e g Shaip et a1 1982, Chr~stian et a1 1991) In general, concentrat~ons of total nitrogen tend to decrease non- conservatirrely as inputs d e ~ i v e d from watelshed and atmospheric sources are diluted with sea water and taken up in biogeochemical processes with-
I'll (1 ) 511rfflcc ( ~ i ~ i ~ c ~ ~ ~ i t ~ ~ ~ ~ f i ~ ~ ! S r w , it11
B DON. uh.1
D~stance from Bay Mouth, km
Fig. 7. Longitudinal d is t r~bulon of DIN IN1 I : ' , NO,+ NO,-) and TON (dissolved, particulate) along the main channel of Chesa- peake Bay for Apnl 1989 in (aj surface waters and (b) bottom \vaterS. (c) Longitudinal distilbution of ratio D1K:TON along the
main Bay channel (data from Kemp et a1 unpubl )

Mar Ecol Prog Ser 150: 229-248. 1997
I'M? 1984 tYW I988
Year
Fig. 8. Monthly mean values for Susquehanna River inputs to Chesapeake Bay in 1978-1988 for (a) freshwater flow, (b) total nitrogen (TN) loachng plus the ratio of dissolved in- organic nitrogen (DIN) to total organic nitrogen (TON), and (c) loading of total organic carbon (TOCJ, unpublished data
from monitoring program ( R . Summers pers. comm.)
NEM using mass-balance calculations (Fig. l b , Table 3). Although the ratio of DIN:TON for all inputs was slightly less than for the major river sources (1.4 compared to 2 .4) , the ratio for nitrogen exported to the ocean declined markedly to 0.04. whilc! D1N:TON for all sinks was 0.27 (Table 3). Assuming no signifi- cant changes in nitrogen pools on annual scales within the Bay, NEM can be calculated in stoichio- nlctrically equivalent nitrogen units as the missing
8 term in h budgets for both DIN and TON, as outlined in 'r?l~!thods and approach' (Fig lb) . Although nitro-
6 z gen mass-balances have been reported recently for several Bay regions (Boynton et al. 1995), the present
J ' calculations cover a different Bay area, and they dls- z tinguish between inorganic and organic forms. This
2 calculation assumes no burial of inorganic N, and this is supported by recent observations that the vast
U majority of particulate nitrogen is organic (Keefe
1994). Jn th1.s m.ethod, nitrogen exchanges between the main Bay and both the adjacent ocean and the major tributaries were estimated independently using output from numerical model simulations (Cerco & Cole 1993, C. Cerco pers. comm 1. Two independent calculations of NEM in nitrogen units were converted to equivalent organic carbon units assuming phyto- plankton are responsible for most of the net produc-
in the estuary. With regard to NEM, the important trend is the substantial change in the ratio of dissolv- ed inorganic nitrogen to total organic nitrogen (DIN:TON), decreasing from almost 2 .5 at the land.- ward end to less than 0.5 at the mouth of the estuary (Fig ?c). There are strong (10-fold) seasonal variations in total N loading to the Bay associated with riverflow (Fig. 8a, b); however, seasonal fluctuations in the D1N:TON ratio are less pronounced, ranging from 3 to 4 in winter-spring to 1.5 to 2 in summer-fall (Fig. 8b). Assuming no major allochthonous sources of organic nitrogen in the middle and lower reaches of the estuary, this implies that there is a net transforma- tion of DIN into organic nitrogen forms within, the estu- ary. Under steady state conditions, this transformation can only occur as a consequence of production exceed- ing respiration within the integrated ecosystem.
The implications of this net transformation from inorganic to organic forms of nitrogcn occurring with- in the Bay were assessed quantitatively in terms of
Table 3 . Annual mean net ecosystem metabolism for main- stem Chesapeake Bay estimated based on mass-balance of dissolved inorganic nitrogen (DIN) and total organic nitrogen (TON). NEM was calculated as the difference between inputs and losses; carbon metabolism assumes Redfield stoichio-
metry, C:N = 6.7 (Nixon & Pilson 1984)
Sources and sinks Nitrogen fluxes ( I d g N yr-') DIN rates TON rates
Nitrogen inputs Susquehanna River" Tributary mouths" Atmosphered
I Subtotal inputs
Nitrogen losses Export to oceanb 3.2 Denitrificationa 23.0 Burial in sediments" - Subtotal losses 26.2
Net ecosystem metabol~sm Total nitrogen 35.0 (Carbon rate, g C y r ' ) (34) (54)
"Based on data and calculations g ~ v e n in Boynton et al. (1995) and by R. Summers (pers. comm.)
b ~ x p o r t from mouths of Bay and ~ t s tributary estuaries based on mass-balance calculations for each system (e.g. Boynton et al. 1995) and numer~cal model simulabons (Cerco & Cole 1993, pers comm.)

Kemp et al.: Net ecosystem metabolism 24 1
Cf~fsnpakc Buy Mouth
Year
Flg. 9. Monthly mean values for the ratio of D1N:DIP (1988 to 1992) in surface waters (potentially available for export) at monitoring stations near the mouth of Chesapeake Bay; shaded area represents region of Redfield ratio for algal composition (data from EPA monitoring program, e.g.
Magnien et al. 1992)
tion (C:N = 6.7 atomic), yielding annual NEM esti- mates of 33 and 54 g C m-2 yr-', for DIN and TON mass-balances, respectively (Table 3). The values are remarkably similar to that calculated from a summa- tion and integration of metabolic rate measurements.
The third approach for computing NEM (in nitrogen units) combines mass-balance calculations for both DIN and DIP (dissolved inorganic phosphorus) pools (Fig. l c ) . A key variable in this calculation is the ratio (I) of D1N:DIP for water exchanged at the estuary mouth. This ratio varied between 3 and 55 over the course of a 6 yr data record, with highest values occur- ring in winter-spring and lowest values in summer, and an overall mean of 10.5 (Fig. 9). Although this ratio does not appear to vary greatly along the estuarine axis in some estuaries such as Narragansett Bay (Nixon & Pilson 1984), that is not the case for large, river-dom- inated systems like Chesapeake Bay (e.g. Boynton et al. 1982). The organic carbon equivalent of thc NEM value estimated from this method was 75 g C m-2 yr-' (Table 4), which is somewhat higher than the other estimates but still indicates net autotrophy. This method does not require independent calculation of nutrient exchanges between the estuary and the ocean. It does, however, assume net export of both DIN and DIP, and that relative loss rates are proportional to the ratio DIN:DIP in water at the estuarine mouth. Recent nutrient mass-balance calculations concluded that total P was, in fact, imported from the continental shelf to the Bay (Boynton et al. 1995). It is unclear, how- ever, whether there was a net import or export of DIP, making the present estimate of NEM with this method tenuous.
Table 4. Annual mean net ecosystem metabolisnl for main- stem Chesapeake Bay estimated based on stoichiometric bal- ances of dissolved inorganic nitrogen, DIN, and dissolved inorganic phosphorus, DIP. For NEM, method adapted from Nixon & Pilson (1984), where I,, is input of dissolved inorganic nitrogen, D, 1s denitrification loss, I,, is input of dissolved inorganic phosphorus, and r is ratio of D1N:DIP at Bay mouth;
see text for explanation
Variables Rates (log g N yr-l)
Nutrient inputs From Susquehnna River"
DIN 44.23 DIP 0.34
From Potomac River and Virginia tributariesb DIN 6.28 D JP 0.05
From Upper Bay polnt sources" DIN 4.65 DIP 0.57
From atmosphere" DIN 5.35 DIP 0.09
Total inputs DIN DIP
Losses to denitrification" Ratio (r) 1)IN:DIP at Bay mouth Net Ecosystem Metabolism, NEM
= [Ilv - D,, - r(I,,,]] [ l - (r/16)1-' = [6U.51 - 24.3 - 10 5(1.05)] (1 - 10.5/16)-'
= 73 X 10% N yr-' (74 g C m- 'y r i )
'Data from Boynton et al. (1995) 'Data calculated from output of numerical water quality model (Cerco & Cole 1993, C. Cerco unpubl.)
Physical sources and sinks of organic carbon
The final computation included here for Chesapeake Bay's NEM again uses summation of carbon fluxes; however, in this case physical (rather than biological) sources and sinks of organic carbon were compiled and summed. We reasoned that the steady-state differ- ence between physical inputs and outputs of organic carbon must be attributable to net production or con- sumption In biological processes (Fig l c ) . This calcula- tion deals with physical transport processes which lead to input or removal of organic carbon from the Bay volume, and it includes the physical harvest of fish biomass, in addition to fluxes associated with water transport (Table 5).
The major physical transport source of TOC input to the Bay was from the Susquehanna River, contributing 53% of the total input to the estuary and 88% of the total to the Upper Bay region (Table 5). The second largest source of TOC was from the major tributaries,

24 2 Mar Ecol Prog Ser 150: 229-248, 1997
Table 5. Summary of annual mean values for organlc carbon fluxes associated with physical transport and fishenes harvest for 3 regions of mainstem Chesapeake Bay and attendant estlmate of net ecosystem metabolism. Calculations for individual Bay
regions do not conslder advect~ve and lspersive exchanges between regions
Fluxes Upper Bay Mid Bay Lower Bay Total Bay
Organic carbon inputs Susquehanna river" 151.3 Tributary mouths" 17.5 Sources below fall-line' 0.5 ' Almospheric deposits" 2.6 Subtotal, lnputs 171.0
Organic carbon losses Burial m sediments" Export to oceanb Fisheries harvest* Subtotal. losses
Net ecosystem metabolism -54.9 (g C m-Z yr-l) (-9.9)
"Data from R Summers (unpubl 1, see Fig 12 %alculated from numerical model (Cerco & Cole 1993, C Cerco pers. comm.) 'Includes both p a n t and diffuse sources below fall-hne (Cerco & Cole 1994) dTaken from Boynton et a1 (1995) apportioned to malnstem Bay area and assuming C.N ratio of 6 g C g NW' for DOM In prec~pitatlon and 3 3 g C g N.' for fish
'Bay reglonal areas deflned as In Table 1, with deposltlonal fractions (0 72.0 47, 0 47 for Upper. Mid and Lower Bay, respecbvely) from Kerhn et al (1983). Depos~tlonal rates (8 50, 3.50, 3 95 X lo3 g m-Z yr-' for Upper, Mid and Lower Bd I a< computed m Boynton et a1 (1995). Carbon content of bur~ed sedlment (31 5. 18 4.7.0 mg C g dw ' for Upper, Mid anti Lower Bay, see Fig 11) calculated from Bo) nton & Kemp (1985, unpubl.)
accounting for some 35 % of the total input to the Bay. While the Susquehanna River debouches directly to the Upper Bay region, the largest inputs from tributary systems occur in the Lower Bay. The other inputs con- sidered in this analysis, including point sources below the river fall-lines and atmospheric deposition, were also highest in the Lower Bay region, but these con- tributed less than 15% to the total physical TOC load- i n g ~ . The distinct 2-layer circulation which develops at the mouths of each of the major tributaries leads to a net seaward transport of surface water and landward transport of bottom water, with the annual mean flows being equal, assuming rainfall and evaporation are in balance (e.g. Pritchard 1952). The question of whether the net transport of TOC will be seaward or landward (to or from the Bay) depends, in part, on the vertical distribution of TOC concentrations. Although non-lin- earities in transport make it necessary to look at the spatiaVternpora1 details of flow and concentration dis- tributions, higher mean concentrations in the surface layer will tend to yield a net export of TOC from the tributary to the Bay. In general, annual mean concen- trations of TOC were, indeed, higher in surface ~vaters for all tributaries considered, including thi! largest, the Potomac River estuary (Fig. lob)
The biogeochernical utility of the organic matter delivered to the Bay via physical transport varies depending on its source and timing. TOC input rates
from the Susquehanna River (and other tributaries) to the Upper Bay region were more than twice the input from GPP and slightly higher than ecosystem respira- tion (Tables 1 & 5). For the Mid and Lower Bay regions. however, allochthonous TOC sources represented much smaller fractions (3 to 4 % ) of the total organic carbon inputs. Even for the Upper Bay, the strong cor- relation reported previously between plankton respi- ration and production (Smith & Kemp 1995) and the absence of comparable correlations relating riverine TOC input to respiration (contrast patterns in Figs. 4 or 5 with those in Fig. 8) suggest that autochthonous sources were substantially more labile than allochtho- nous TOC. On the other hand, the significant positive intercept in the observed regression of plankton respi- ration on production for the Upper Bay represents almost half the annual mean value for R,, and one- fourth of the mean daily rate of TOC delivery from the Susquehanna River to this region (Smith & Kemp 1995). In general, it appears that river-borne organic matter tends to be less labile than that generated from estuarine primary production, and that the relative importance of riverine carbon declines along the land- sea salt y 1-ddient (e.g. van Es & Laane 1982, Matson & Brinson 1990, Cifuentes et al. 1988).
The 2 major loss terms in this Chesapeake Bay mass- baIance of phys~cal fluxes of organic carbon were burial in sediments and export to the ocean. Export to

Kemp et al.: Net ecosysten~ m e t a b o l ~ s ~ n 243
I) I F i l .\ \I I I r\ 5 O N I)
Month
Fig 10 Mean annual cycles (1984 to 1992) of total organic carbon concentrations in surface and bottom tvaters at sta- tions near the mouth of Chesapeake Bay and at the conflu- ence of the Potornac River estuary with the mainstem Bay (data from EPA nlon~toring program, e.g M a g n ~ e n et al. 1932)
the continental shelf accounted for almost 52'' of the total physical losses of TOC from the Bay system. The difference between monthly mean surface and bottom concentrat~ons of TOC at the Bay mouth was even mole distinct than that shown for the Potomac, with surface values averaging 20 to 60 ',, higher than bot- tom concentiatlons (Fig 10a) For the whole Bay, bul- ial comprised some 40'%) of all physlcal loss terms for organic carbon, with over half of the total buiial occur- ring in the Upper Bay region (Table 5 ) even though this represents only 11 of the total Bay area consid- ered In fact, the proport~ons of total organic carbon burlal occurring In each of the 3 regions was inveisely proportional to their areas (Table 5) The spatial dlstri- bution of percent organic carbon In Bay sediments leflects this tendcnci fol hlghest rates of buiial to be concentrated in the upper estuary (Fig 11) The thud physical process of TOC removal from the Bay consid- ered in t h ~ s analysis 1s fisheries hanes t The total flesh weight harvest of flsh p] oducts from the Bay was dom- mated by the commercial catch of a single species, Atlantlc menhaden (Houde & Rutherford 1993) Fish- eiies harvest replesented a surprisingly large tern1 in this budget being 8 of the total losses and 16'% of
Flg 11 Spa t~a l patterns (May 1993) of pdrticulate orgdnic car- bon (POC, '%! dry weight) In surface sed~lnents (0 to 3 mm) of Chesapeake Ucl\l and \ r I trcal protiles of POC at selected sta- tions (Auy 1988) along estuarine Data f~o rn W Boynton
(unpubl )
the total p h i s ~ c a l input fluxes of TOC (Table 5) The value for NEM estimated from the difference between physical input dnd output fluxes of TOC is 258 X 10" C yr ' , whlch is equivalent to 47 g C m yr ' , of which fisheries yield comprised some 17 ' X , (Table 5)
Comparison of NEM estimates and C-balance among estuaries
The 5 independent estimates of NEM for Chesa- peake Bay yielded remarkably similar results, with rates ranging from 33 to 75 g C m yr.', and a mean value of 50 g C m-' y r - i (SE = 7 5). It is interesting that

244 \.fdt- Ecol Prog Ser 150: 229-248. 1997
calculations (Table 3) suggest that a substantial portion of the seaward exported TOC originated from estuar- ine production. The Bay's NEM constituted 7.4 % of the calculated GPP for this ecosystenl (Fig 12).
Comparing NEM estimated for Chesapeake Bay with values reported for other estuarine ecosystems reveals several interesting relations. A recent study (Smith & Hollibaugh 1993) included some 22 coastal ecosystems for which sufficient information was avail- able to calculate annual mean NEM. Of these sites, only 7 exhibited NEM values which were positive or zero. Although the data displayed considerable scatter, an inverse relationship between NEM and GPP was suggested, where the most productive ecosystems had the most heterotrophic metabolism (Smith & Hol- libaugh 1993). This trend of decreasing NEM for the
Fig. 12. Summary of estimated annual mean values for malor most productive systems was attributed to the fact that organic carbon fluxes in rnainstern Chesapeake Bay, includ- most of the nutrients delivered to these estuaries were ing physical input (I) and output (E) fluxes and biotic rneta- holism associated primary production (P) and community derived from terrestrial organic matter inputs. ~ n d e e d , respiration (R) . Net ecosystem metabolism can be calculated most of the world's rivers carry substantial loads of as P - R = 270 X 10" 9 C yr-' (49 9 C V') or as I - E = TOC (Meybeck 1982, Kempe 1984). This effect,
258 X 10% C yr-' (47 g C m-' yr-l) whereby organic loading from land-based sources drives NEM to become negative, is particularly acute because of the fact that C:N ratios for terrestrial plants,
the 2 NEM estimates based on N mass-balance and associated, det:rital organics, are much higher than (Table 3) and the 2 values for NEM calculated from those of estuarine organisms (e .g . Hopkinson 8: Vallino measured TOC fluxes (biological, Table 1; physical, 1995). Hence, use of terrestrial organic matter, with its Table 5) both averaged 44 g C m-' yr-' Given the fact high C:N and C:P ratios, to fuel estuarine respiration that the physical TOC fluxes were so much smaller ( l 0 releases proportionally lower quantities of inorganic to 20x1 than the biological metabolic fluxes, it is sur- nutrients (than would the same respiration on estuar- prising that input-output differences in the 2 budgets ine organic matter) to support coupled production. converged to similar NEM values (Fig. 12). In fact, the On the other hand, increased inputs of inorganic most obvious feature of the overall organic carbon nutrients to estuarine ecosystems tend to stimulate budget for Chesapeake Bay is, perhaps, the domi- both GPP and NEM. This has been d.emonstrated nance of biological compared to physical fluxes. Au- clearly in inorganic nutrient enrichment studies with tochthonous GPP (P) was more than 13 times larger experimental coastal marine ecosystems, where NEM than the sum of all physical transport inputs of TOC (I), increased from balanced metabolism under low nutri- while ecosystem resplration was over 6-fold greater ent inputs to + l00 g C m-2 yr-' with a 32-fold increase than all of the physical sinks for TOC (Fig 12). The in inorganic nutrient loading (Oviatt et al.. 1986). The ratio of physical to biological TOC inputs (I:P) tends to fraction of GPP going to NEM increased from 8.8% at vary substantially along the land-sea gradient, with 2-fold increase in nutrient loading to 18'%, at 32-fold values of 2.3 for the Upper Bay declining to 0.03 for the treatments (Oviatt et al. 1986). Most of this increased Mid and Lo~ver Bay regions (Tables l & 5) . In contrast NEM coald be accounted for as sedimented particulate to the carbon balance, nitrogen assimilated in the Bay's organic matter and benthic fauna1 biomass (Oviatt et GPP was only 5-fold greater than the total N inputs al. 1993) Chesapeake and Narragansett Bays repre- from allochthonous sources. This suggests that some sent examples of temperate estuaries generating sub- 80% of GPP IS supported by recycl.ed nitrogen (e.g. stantial positive NEM from the large inputs of inor- Kemp & Boynton 1984). While it is impossible to ascer- ganic nutrients received via agricultural runoff and tain which fraction of a particular carbon input is chan- wastewater discharges. Oceanic ecosystems, far from neled into each of the sinks, it can be assumed that the influence of terrestrial organic matter, appear to most of the carbon generated in GPP is consumed, in exhibit a positive relationship between GPP and NEM system resp~ration. As suggested earlier, indirect evi- (referred to as 'new production', Eppley & Peterson dence indicates that a significant portion of the Upper 1979), which is the opposite of that suggested previ- Bay respiration is supported by river-borne TOC ously for coastal regions (Smith & Hollibaugh 1993). (Smith & Kemp 1995). Conversely, nitrogen balance Several reef and lagoonal ecosystems under tropical
Production (P)
Inputs (1) Algae 3622
SusLJR-. 151
Tribs. 110
A tmos. - 24 - Plalkton 4s h t h o s
285 2503 899 543
TOC Fluxes Respiration (R)
TOC P001
281
Burial - 217
Fisheria
Kemp et al.: Net ecosystem metabolism 245
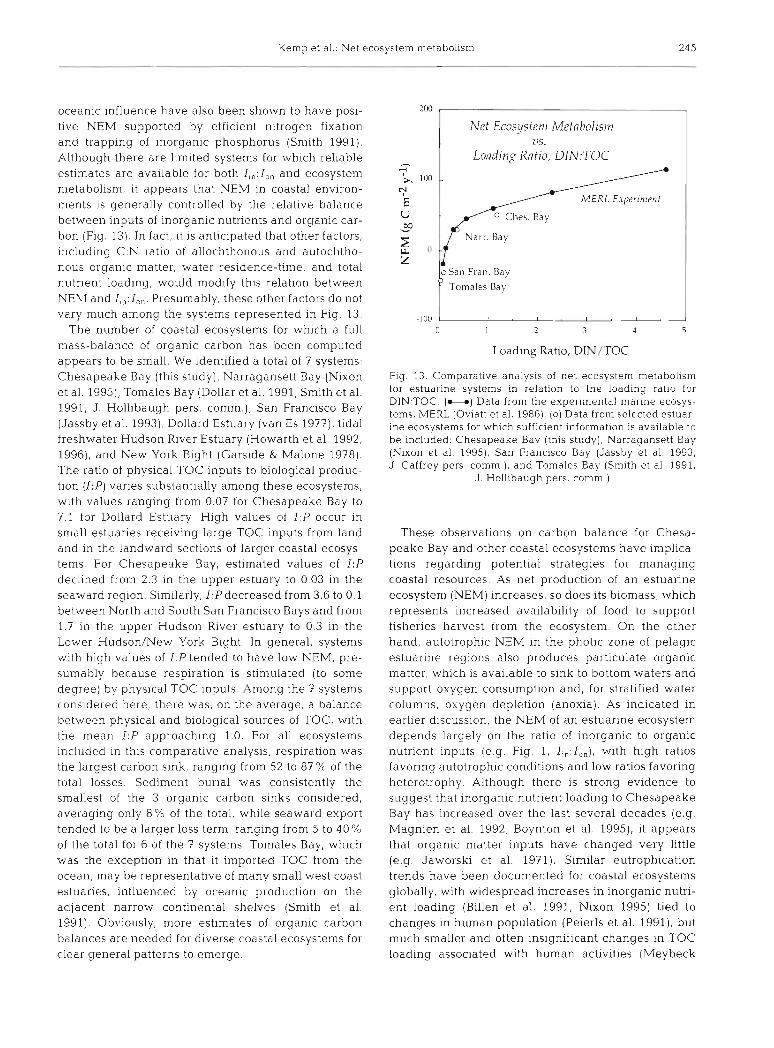
oceanic influence have also been shown to have posi- tive NEM supported by eff~cient n~trogen fixation and trapping of inorganic phosphorus (Smith 1991). Although there are limited systems for which rel~able estimates are available for both I,,: I,, and ecosystem metabolism, it appears that NEM in coastal environ- ments is generally controlled by the relative balance between inputs of inorganic nutrients and organic car- bon (Fig. 13). In fact, it is anticipated that other factors, including C:N ratio of allochthonous and autochtho- nous organic matter, water residence-t~me, and total nutrient loading, would modify this relat~on between NEhI and I,,: I,,. Presumably, these other factors do not vary much among the systems represented in Fig. 13.
The number of coastal ecosystems for which a full mass-balance of organic carbon has been computed appears to be small. We identified a total of 7 systems: Chesapeake Bay (this study), Narragansett Bay (Nixon et al. 1995), Tomales Bay (Dollar et al. 1991, Smith et al. 1991, J . Hollibaugh pers. comm.), San Francisco Bay (Jassby et al. 1993), Dollard Estuary (van Es 1977), tidal freshwater Hudson River Estuary (Howarth et al. 1992, 1996), and New York Bight (Garside & Malone 1978). The ratio of physical TOC inputs to biological produc- tion (I: P) varies substantially among these ecosysten~s, with values ranging from 0.07 for Chesapeake Bay to 7.1 for Dollard Estuary. High values of 1:P occur in small estuaries receiving large TOC inputs from land and in the landward sections of larger coastal ecosys- tems. For Chesapeake Bay, estimated values of I :P declined from 2.3 in the upper estuary to 0.03 in the seaward region. Similarly, I ,Pdecreased from 3.6 to 0.1 between North and South San Francisco Bays and froin 1 7 in the upper Hudson R~ver estuary to 0.3 in the Lower Hudson/New York Bight. In general, systems with high values of I P tended to have low NEM, pre- sumably because respiration is stimulated (to some degree) by physical TOC inputs. Among the 7 systems considered here, there was, on the average, a balance between physical and b~ological sources of TOC, w ~ t h the mean I :P approaching 1.0. For all ecosystems included in t h ~ s comparative analysis, respiration was the largest carbon sink, ranging from 52 to 87 % of the total losses. Sediment burial was consistently the smallest of the 3 organic carbon sinks considered, averaging only 8% of the total, while seaward export tended to be a larger loss term, ranging from 5 to 40 % of the total for 6 of the 7 systems. Tomales Bay, which was the exception in that it imported TOC from the ocean, may be representative of many small west coast estuaries, influenced by oceanic production on the adjacent narrow continental shelves (Smith et al. 1991). Obviously, more estimates of organic carbon balances are needed for diverse coastal ecosystems for clear general patterns to emerge.
200
Net Ecosystem Metobolisin U S . I Loading Ratio, D1N:TOC
Tomales Bay
Loading Ratio, DIN/TOC
Fig 13 Comparative analysis of net ecosystem metabolism for estualine systems in relation to the l o a d ~ n g ratio for DIN TOC (U) Data from the expenmental rnanne ecosys- tems, M E R L (Oviatt et a1 1986) (0) Data from selected estuar- me ecosystems for whlch sufficient ~nforrnatlon is available to be included Chesapeake Bay (thls study), Narragansett Bay (Nixon et a1 1995), San Francisco Bay (Jassby et a1 1993, J Caffrey pers cornm ) , and Tomales Bay (Smith et a1 1991,
J Hollibaugh pers comm )
These observations on carbon balance for Chesa- peake Bay and other coastal ecosystems have implica- tions regarding potential strategies for managing coastal resources. As net production of an estuailne ecosystem (NEM) increases, so does its biomass, which represents increased availability of food to support fisheries harvest from the ecosystem. On the other hand, autotrophic NEM in the photic zone of pelagic estuarine regions also produces particulate organic matter, which is available to sink to bottom waters and support oxygen consumption and, for stratified water columns, oxygen depletion (anoxia). As indicated in earlier discussion, the NEM of an es tuar~ne ecosystem depends largely on the ratio of inorganic to organic nutrient inputs (e .g . Fig. 1, I,,:I,,), w ~ t h high ratios favonng autotrophic conditions and low ratios favoring heterotrophy. Although there is strong evidence to suggest that inorganic nutrient loading to Chesapeake Bay has increased over the last several decades (e.g. Magnien et al. 1992, Boynton et al. 1995), it appears that organic matter inputs have changed very little (e .g . Jaworski et al. 1971). Similar eutrophication trends have been documented for coastal ecosystems globally, with widespread increases in inorganic nutri- ent loading (Billen et al. 1991, Nixon 1995) tied to changes in human population (Peierls et al. 1991), but much smaller and often insignificant changes in TOC loading associated with human activities (Meybeck

hlar Ecol Prog Ser 150: 229-248, 1997
1982, Howarth et al. 1996). Thus, this general trend of increased inorganic nutrient loading, with higher ratios of in.organic:organic inputs, will likely lead to general increases in NEM for Chesapeake Bay and othcr coastal ecosystems. While waste management efforts in industrial regions focused initially on reduc- ing inputs of organic carbon to coastal waters, present concerns are aimed primarily at removal of inorganic nutrients; however, both can contribute to oxygen depletion (Officer & Ryther 1977) It appears that resource managers are faced with the inevitable trend of increasing NEM in coastal ecosystems worldwide. They will need to develop strategies for fostering the associated increased production of fisheries popula- t i o n ~ , while attempting to mitigdte potential detrimen- tal effects of anoxia and resulting lost habitat for dem- ersal species.
Acknoruledgements. This work was supported by NSF LMER Program (Grant nos. BSR-8814272 and DEB-9412133) and by NOAA, Maryland Sea Grant College (no. R/P 32). We grate- fully acknowledge contributions of J . Cornwell, D. Capone, C. Madden, J . Hagy and T. Malone, as well as S. Smith. S. Nixon and C. Hopkinson in d~scussions which led to the formulation of this manuscript. We thank K. Whipp and D. HinMe for their assistance In field observat~ons and in preparation of graphics for this manuscript; thanks also go to J Posey and E. Conway for their assistance in data analyses supporting Figs. 9 and 10. We are particularly indebted to C. Cerco for providing output from a numerical simulation model to estimate nutrient and carbon fluxes at the seaward end of the Bay and its major tnb- utaries. Finally, we give special thanks to R. Summers, R. Magnien and the U.S. EPA Chesapeake Bay Monitoring Pro- gram for use of unpublished monitoring data.
LITERATURE CITED
Baines SB, Pace M, Karl D (1994) Why does the relationship between sinking flux and planktonic primary production differ between lakes and oceans? Limnol Oceanogr 39: 213-226
Batiuk RA, Orth RJ, Moore KA, Dennison WC, Stevenson JC, Staver L, Carter V, Rybichi N, Kollar S, Bieber S, Heasly P, Bergstrom PW (1992) Chesapeake Bay submersed aquatic vegetation habitat requirements and restoration goals: a technical synthesis. US EPA, Chesapeake Bay Program, Annapolis, MD
B~ggs RB. Flemer DA (1972) The flux of particularte carbon In an estuary. Mar Biol 12:ll-17
Billen G, Lancelot C, Meybeck M (1991) N, P, and Si retention along the aquatic continuum from land to ocean. In: Man- toura R. Martin JM, Wollast R (eds) Ocean margin processes in global change. J Wiley and Sons, Chichester, p 19-44
Boynton WR, Garber JH, Summers R. Kemp WM (1995) Inputs, transformations and transport of nitrogen and phosphorus in Chesapeake Bay and selected tributaries. Estuaries 181285-314
Boynton WR. Kemp WM (1985) Nutrient regeneration and oxygen consumption by sediments along an estuarine salinity gradient. Mar Ecol Prog Ser 23:45-55
Boynton WR, Kemp WM, Keefe CW (1982) A comparative analvsis of nutrients and other factors influencina estuar- - ine phytoplankton production. In: Kennedy VS (ed) Estu- anne com~arisons Academic Press. New York, D 69-90
Burdige DJ, Homestead J (1994) Fluxes of dissolved organic carbon from Chesapeake Bay sediments. Geochim Cos- mochim Acta 58:3407-3424
Cerco CF, Cole T (1993) Three-dimensional eutrophication model of Chesapeake Bay. J Environ Eng 119:1006-1025
Cerco CF, Cole T (1994) Three-dimensional eutrophication model of Chesapeake Bay. Vol 1: Main Report. Tech Rep EL-94-4, US Army Corps of Engineers, Vicksburg, MS
Christian RR, Boyer J, Stanley DW (1991) Multi-year distribu- tion patterns of nutrients within the Neuse River estuary. North Carolina. Mar Ecol Prog Ser 71:259-274
Cifuentes LA, Sharp JH, Fogel ML [1988) Stable carbon and n~trogen isotope b~ogeochemistry in the Delaware estuary. Limnol Oceanogr 33: 1102-1 115
Conley DJ, Malone TC (1992) Annual cycle of dissolved sili- cate in Chesapeake Bay: implications for the production and fate of phytoplankton biomass. Mar Ecol Prog Ser 81: 121-128
Conley DJ, Smith W, Cornwell JC , F~sher TR (1995) Transfor- mation of particle-bound phosphorus at the land-sea ~nter- face. Estuar Coast Shelf Sci 40:161-176
Costanza R, Kemp WM, Boynton WR (1993) Predictability, scale and biodiveisity in coastal and estuarine ecosystems: implications for management. Ambio 22:88-96
Cowan J, Boynton WR (1996) Sediment-water oxygen and nutnent exchanges along the longitudinal axis of Chesa- peake Bay: seasonal patterns, controlling factors and eco- logical significance. Estuanes 19562-580
Cronin WB, Pritchard EW (1975) Additional statistics on the dimensions of the Chesapeake Bay and its tributaries: cross-section widths and segment volumes per meter depth. Spec Rep 42, Chesapeake Ray Institute, The Johns Hopkins Univ, Ref 75-3, Baltimore, MD
Dibbs JE (1988) The dynamics of Beryllium-7 in Chesapeake Bay. PhD thesis. State Univ of New York, Binghamton
Dollar SJ, Smith SV, Vink SM, Obredski S, Hollibaugh JT (1991) Annual cycle of benthic nutrient fluxes in Tomales Bay. California, and contribution of the benthos to total ecosystem metabolism. Mar Ecol Prog Ser 79:115-125
Efron B, Tibshirani R (1991) Statistical data analysis in the computer age. Science 253:390-395
Eppley RW, Peterson BJ (1979) Particulate organic matter flux and planktonic new production in the deep ocean. Nature 282 677-680.
Fisher SG, Likens GE (1973) Energy flow In Bear Brook, New Hampshire: an integrative approach to stream ecosystem metaolism. Ecol Monogr 431421-439
Fisher TR, Harding LW. Stanley DW, Ward LG (1988) Phyto- plankton, nutrients and turbldty In the Chesapeake, Delaware and Hudson Estuaries. Estuar Coast Shelf Sci 27:61-93
Fisher TR, Peele ER, Ammerman JW, Harding LW (19921 Nutrient limitation of phytoplankton in Chesapeake Bay. Mar Ecol Prog Ser 8251-63
Flemer DA (1970) Primary production in the C h e ~ p e a k e Bay. Chesapeake Sci 11:117-l29
Garside C, Malone TC (1978) Monthly oxygen and carbon budgets of the New York Bight Apex. Estuar Coast Mar Sci 6:93-104
Heath M (1995) An holistic analysis of the coupling between physical and biological processes in the coastal zone. Ophelia 42:95-125
Hopkinson CS, VaUino JJ (1995) The relationstups among

Keinp et al.: Net ecos
Man's activities in thv watersheds and estuaries: a model of runoff effects on pdtterns of estuarine community meta- bolism. Estuaries 18:598-621
HOI-ton T, Eichbaum W (19911 Turning the tidc. Saving the Chesapeake Bay. Island Press, Washington, DC
Houde ED, Rutherford ES (1993) Recent trends in estuarine fisheries: predictions of fish production and yield. Estuar- ies 16:161-l76
Howarth K\V (1984) The ccological significance of sulfur In the energy dynamlcs of salt marsh and coastdl manne sed- i m e n t ~ . Biogeochelnistry 1:5-27
Howarth RW, Marino R, Garritt R, Sherman D (1992) Ecosys- tem respirat~on and organic carbon processing In a largc. t~dally influencetl river: the Hudson River. Biogeoc.hrni- lstry 16:83-102
Howarth RW, Schneider R, Swaney D (1996) Metdbolism and organic carbon fluxes in the t~da l , freshwater Hudson. Estuaries 19:848-865
Ittekkot V, Laane R (1991) Fate of riverinr pal-t~culale organic matter In: Degens E, Kempe S, Richcy R (eds) Scope 42- biogeochemistry of major wol-Id rivers. J W~lcy dnd Sons, New York, p 233-242
Jassby AD, Cloern JE. Powell TM (1993) Organic carbon sources and sinks in San Francisco Bay: vanability induced by river flow. Mar Ecol Prog Ser 95.39-54
Jaworski NA, Lear D, Villa 0 (1971) Kutrient management in the Potomac Estuary. In: Likens GE (ed) Nutrients and eutrophication. ASLO Spec Symp Vol 1. Allen Press. Lawrence, KS, p 246-273
K~,c.tc. CW (1994) The contnbut~on of inorganic compounds to the partlculate carbon, nitrogen and phosphorus in sus- pended matter and surface sediments of C:hesapeake Bay. Estuaries 17:122-130
Kelly JR. Levin SA (1986) A comparl.;on of aquatic dntl terres- t r~a l nutrient cycling and production processes in natural ecosystems, la th reference to ecological concepts of rele- vance to some waste disposal issues. In: Kullenberg C (ed) The role of the oceans as a waste disposal option. D Reidel Publ CO, New York, p 165-203
Kemp WM, Boynton WR (1980) Influence of biological and physical factors on dissolved oxygen dynamics In an estu- arine system: implications for measurement of community metabolism. Estuar Coast Mar Sci 11:407-431
Kemp Whf, Boynton WR (1981) External and internal factors regulating metabolic rates of an estuarine benthic commu- nity. Oecologia 51.19-27
Kemp WM. Boynton M'R 11984) Spatial and temporal coupling of nutrient inputs to estuarine prim~lr)' product~on: the role of particuldte transport and decomposition Bull hlar Sci 35522-535
Kelnp LVM, Boynton WR (1992) Benthic-pelag~c interactions. nutrient and oxyyrn dynamlcs. In: Smith D. Leffler M. Mack~ernan G (eds) Oxygen dynctmics in Chcsapeake Bay: a synthesis of recent research. Maryland S r a Grant Publication, College Park, p 149-221
Kemp WM, Boynton WR, Tw~lley RR, Stevenson JC, Means JC (1983) The decline of submerged vascular plants in upper Chesapeake Bay: summary of results concerning possible causes. Mar Technol Soc J 17:78-89
K e n ~ p WM, F3oynton WR, Twilley RR, Stevenson JC, Ward LG (1984) Influences of submersed vascular plants on ecolog- ical processes in upper Chesapeake Bay. In: Kcnnedy VS (ed) The estuaries as a fllter. Academic Press, N(:w York, p 367-394
Kemp WM, Sampou PA, Garber J , Tuttle J , Boynton WR (1992) Relative roles of benthic versus planktonic respira- tion in the seasonal depletion of oxygen from bottom
waters of Chesapeake Bay. Mar Ecol Prog Ser 85:137-152 Kempe S (1984) Sinks of the anthropogenically enhanced
carbon cycle in surfacc fresh waters. J Geophys Res 89: 4657-4676
Kenney BE, Likaker W, Duke CS, Ramus J (1988) Community oxygen metabol~sm in a shallow tidal estuary. Estuar Coast Shelf Sci 27:33-43
Kerhin R, Halka J, Hennessee E. Blakeslee P, Wells D, Zoltan N. Cuthbertson R (1983) Phys~cal charactei-lstics and sedl- ment budget for bottom sediments in thc Maryland por- tion of Chesapeake Bay. U S EPA, Wash~ngton, DC
LMER (Land Margin Ecosystem Research) Coordinating Committee (1992) Understanding changes in coastal envi- ronments: thcl LMER program EOS ?5:481-485
Maclntyi-e H , G c ~ d e r R, Miller D (1996) M~crophytobenthos The ecological role of the 'secret garden' of unvegetated, shallow-water marine habitats. 1. Distribution, abundance and prirndry production. Estuaries 19(2A):186-201
Magnien RE, Summers RM, Sellner KG [1992) External nutri- ent sources, internal nutnent pools and phytoplankton production in Chesapeake Bay. Estuaries 15.497-516
Malone TC, Conley DJ, Fisher TR. Glibert PM, Harding LW, Scllner KG (1996) Scales of nutrient limited phytoplankton productivity in Chesapeake Bay. Estuaries 19(2B):371-385
Malone TC, Crocker LH, Pike SE, Wendlel- BW (1988) Influ- ences of river flow on the dynamics of phytoplankton pro- duction in a partially stratified estuary. Mar Ecol Prog Ser 48:235-249
Malone TC, Ducklow HW, Peele ER, Pike SE (1991) Pico- plankton carbon flux in Chesapeake Bay Mar Ecol Prog Ser 78:l l-22
Malone 'TC. Kemp WM, Ducklow HW, Boynton WR, Tuttle JH, Jonas RB (1986) Lateral vanations in the production and fate of phytoplankton in a partially stratified estuary. Mar Ecol Prog Ser 32:149-l60
Mai-vin MC (1995) Controls on the spatial and temporal trends of benthic sulfate reduction and methanogenesls along the Chesaprake Bay central channel. PhD thesis, University of Maryland, College Park
Matson E.4, Brinson MM (1990) Stable carbon isotopes and the C:N ratio in the estuaries of the Pamlico and Neuse Rivers, North Carolina. Limnol Oceanogr 35:1290-1300
Mayer MS (1992) Effects of benthic macrofauna on nitrogen cycling and oxygen consumption of estuarine sediments. PhD thesis, University of Maryland, College Park
Meybeck M (1982) Carbon, nitl-ogen and phosphorus trans- port by world rivers. Am J Sci 282:401-450
Nixon SW (1980) Between coastal marshes and coastal waters-a review of twent)' years of speculat~ons and research on the role of salt marshes In estuarine produc- tivity and water chemistry. In: Hamilton P, MacDonald KB (eds) Estuarine and wetland processes. Plenum Publ, New York, p 437-525
Nixon SW (1988) Physical energy inputs and the comparative ecology of lake and marine and marine ecosystems Li~nnol Oceanogr 33:1005-1025
Nixon SW (1995) Coastal ma.rine eutrophicat~on: a definition, social causes, and future concerns. Ophelia 41:119-219
Nixon SW, Granger S. Nowicki B (1995) An assessment of the annual mass balance of carbon, nitrogen and phosphorus in Narragansett Bay. Biogeochemistry 31:15-61
Nixon SLV, Oviatt CW, Frithsen J , Sullivan B (1986) Nutrients and the productivity of estuaries and coastal marlne ecosystems. J Limnol Soc Sth Afr 12:43-71
Nixon SW, Pilson M (1984) Estuarine total system metabolism and organic exchange calculated from nutrlcxnt ratios an example from Narragansett Bay In: Kennedy VS (ed) The

Mar Ecol Prog Ser 150: 229-248, 1997
estuary a s a filter. Academic Press. New York. p 261-290 Odum EP (1971) Fundamentals of ecology. WB Saunders.
Philadelphia Odum HT (1956) Pnmary production in flowing waters.
Limnol Oceanogr 1:102-117 Officer CB, Lynch DR, Setlock C;, Helz G (1984) Recent sedi-
mentation rates in Chcsapcdke Bay. In: Kennedy VS (ed) The estuary as a filter Academlc Press, New York, p 131-158
Officer CB, Ryther JH (1977) Secondary sewage treatment versus ocean outfalls: an assessment Science 197: 1056-1060
Orth RJ, Moore KA (1983) An unprecedented decline In sub- merged aquatic vegetation (Chesapeake Bay). Science 22: 51-53
Orth RJ, Moore KA (1986) Seasonal and yearly variations in the standing crop of Zosterd marina L. (eelgrass) in lower Chesapeake Bay. Aquat Bot 24:335-341
Ov~a t t CA, Doering PH, Nowicki BL, Zoppini A (1993) Net system production in coastal waters as a function of eutrophication, seasonality and benthic macrofaunal abundance. Estuaries 16:247-254
Oviatt CA, Keller AA, Sampou PA, Beatty LL (1986) Patterns of productivity during eutrophication: a mesocosm experi- ment. Mar Ecol Prog Ser 28:69-80
Peierls B, Caraco N, Pace M, Cole J (1991) Human ~nfluence on river nitrogen. Nature 350:386-387
Petersen J , Chen CC, Kemp WM (1997) Scaling aquatic pri- mary productivity: experiments under nutrient and light limited conditions. Ecology (in press)
Pritchard DW (1952) Salinity distribution and circulation in the Chesapeake Bay estuarine system. J Mar Res 11: 106-123
Quinones RA. Platt T (1991) The relation between the f-ratio and the P:R ratio in the pelagic ecosystem. Limnol Oceanogr 36:211-213
Rizzo WM, Wetzel RL (1985) Intertidal and shoal benthic com- munlty metabolism in a temperate estuary: studies of spa- tial and temporal scales of variability. Estuaries 8.342-351
Roden EE, Tuttle JH (1993) Inorganic sulfur cycling in mid and lower Chesapeake Bay sediments. Mar Ecol Prog Ser 93:lOl-118
Roden EE, Tuttle JH, Boynton WR, Kemp WM (1995) Carbon cycling in mesohaline Chesapeake Bay sediments. 1. POC deposition rates and mineralization pathways. J Mar Res 53:799-819
Sand-Jensen K (1989) Environmental variables and their effect on photosynthesis of aquatic plant communit~es. Aquat Bot 34:5-25
This artjclc was submitted to the editor
Schubel JR, Carter H (1984) The estuary as a filter for fine- grain suspended sediment. In: Kennedy VS (ed) The estu- ary as a filter. Academic Press, New York, p 81-129
Sellner K (1987) Phytoplankton in Chesapeake Bay: role in carbon, oxygen and nutrient dynam~cs. In: Majumdar SK. Hall JL, Austin HM (eds) Contaminant problems and management of living Chesapeake Bay resources. The Pennsylvania Academy of Sclence Publications, Easton, p 134-157
Sharp JH , Culberson CH, Church TM (1982) The chem~stry of the Delaware estuary. General considerations Limnol Oceanogr 27:1015-1028
Shiah FK, Ducklow HW (1994) Temperature and substrate regulation of bacterial abundance, production and specific growth rate in Chesapake Bay, US.4. Mar Ecol Prog Ser 103:297-308
Smith SV, Hollibaugh JT, Dollar SJ, Vink S (1992) Tomales Bay metabolism C-N-P stoichiometry and ecosystem het- erotrophy at the land-sea interface. Estuar Coast Shelf Sci 33:223-257
Smith SV (1991) Stoichiometry of C:N:P fluxes in shallow-wa- ter manne ecosystems. In: Cole J , Lovett J , Findlay S (eds) Comparative analyses of ecosystems. Patterns, mecha- nisms, theories. Springer-Verlag, New York, p 259-286
Smith SV, Holllbaugh JT (1993) Coastal met.abolism and the oceanic organlc carbon balance. Rev Geophys 31:75-89
Smith EM, Kemp WM (1995) Seasonal and regional variations in plankton community production and respiration for Chesapeake Bay. Mar Ecol Prog Ser 116:217-231
Stevenson JC, Kearney MS, Pendleton EC (1985) Sedimenta- tion and erosion in a Chesapeake Bay brackish marsh sys- tem. Mar Geol67:213-235
Stevenson JC, Ward LG. Kearney MS (1988) Sediment trans- port and trapping in marshsystems: implications of t~da l flux studies. Mar Geol 80:37-59
Stokes C (1996) influences of environmental variables on photosynthetic and respiratory quotients in Chesapeake Bay. MSc thesis, University of Maryland, College Park
Van Es FB (1977) A preliminary carbon budget for a part of the Ems estuary. the Dollard. Helgol Meeresunters 30: 283-294
Van Es FB, Laane RWP (1982) The uti11.t~ of organic matter In the Ems-Dollard estuary. Neth J Sea Res 16:300-314
Ward LG, Twilley RR (1986) Seasonal distributions of sus- pended particulate material and dissolved nutrients in a coastal plain estuary. Estuaries 9:156-168
Wofsy SC (1983) A simple model to predict extinction coeffi- cients & phytoplankton b~omass in eutrophic waters. Limnol Oceanogr 28:1144-1155
Manuscript first received: September 16, 1996 Rev~sed verslon accepted. March 3, 1997