organic aerosol sources and chemistry: insights from...
TRANSCRIPT

Organic Aerosol Sources and Chemistry: Insights from Development and Application of In-Situ
Thermal Desorption Gas Chromatograph for Semi-Volatile Organic Compounds (SV-TAG)
by
Yunliang Zhao
A dissertation submitted in partial satisfaction of the
requirements for the degree of
Doctor of Philosophy
in
Environmental Science, Policy, and Management
in the
Graduate Division
of the
University of California, Berkeley
Committee in charge:
Professor Allen H. Goldstein, Chair
Professor Dennis D. Baldocchi
Professor Ronald C. Cohen
Fall 2012

Organic Aerosol Sources and Chemistry: Insights from Development and Application of In-Situ
Thermal Desorption Gas Chromatograph for Semi-Volatile Organic Compounds (SV-TAG)
©2012
by Yunliang Zhao

1
Abstract
Organic Aerosol Sources and Chemistry: Insights from Development and Application of In-Situ
Thermal Desorption Gas Chromatograph for Semi-Volatile Organic Compounds (SV-TAG)
by
Yunliang Zhao
Doctor of Philosophy in Environmental Science, Policy, and Management
University of California, Berkeley
Professor Allen H. Goldstein, Chair
Understanding organic aerosol (OA) sources and secondary OA (SOA) formation is
crucial to elucidate their human health and climate change effects, but has been limited by lack
of instrumentation capable of in-situ measurements of organic speciation in the atmosphere
across the vapor pressure range of semi-volatile organic compounds (SVOCs) and OA. This
dissertation describes 1) the development of a novel instrument based on a thermal desorption
aerosol gas chromatograph (TAG), called semi-volatile TAG (SV-TAG) which enables
quantitative measurements of specific chemical tracers in SVOCs and OA and 2) application of
this new instrument to investigate the various source contributions to OA and SOA formation.
The development of the SV-TAG was initiated by employing a denuder difference
method to improve the capability of the TAG for quantitative gas/particle separation. Using this
technique, hourly time resolution in-situ measurements of organic species were made and then
used to investigate the pathways of gas-to-particle partitioning for oxygenated compounds and
particle-phase organics were used for source apportionment calculations. The measurements of
gas/particle partitioning of phthalic acid, pinonaldehyde and 6, 10, 14-trimethyl-2-pentadecanone
were explored to elucidate the pathways of gas-to-particle partitioning whereby SOA was formed.
The observations show that multiple pathways of gas-to-particle partitioning contribute to
formation of SOA in the atmosphere and the dominance of different pathways are compound-
dependent. Absorption into particles is shown to be the dominant pathway for 6, 10, 14-
trimethyl-2-pentadecanone to contribute to SOA in Bakersfield, CA. The major pathway to form
particle-phase phthalic acid is likely attributed to formation of condensable salts through
reactions between phthalic acid and gas-phase ammonia. The observations of pinonaldehyde in
particles while inorganic acids in particles were fully neutralized suggest that the occurrence of
reactive uptake of pinonaldehyde onto particles does not require the presence of inorganic acids.
The relationship between particle-phase pinonaldehyde and RH suggests that aerosol water
content plays a significant role in the formation of particle-phase pinonaldehyde. To investigate
the contributions of various sources to OA in Bakersfield, CA, positive matrix factorization
(PMF) analysis was performed on a subset of the measured particle-phase organic compounds.
Six OA source factors were identified, including one representing primary organic aerosol
(POA), four different types of secondary organic aerosol (SOA) representing local, regional, and

2
nighttime production, and one representing a complex mixture of additional OA sources that
were not further resolvable. POA accounted for 15% of OA on average with a significant
contribution from local vehicles. SOA was the dominant contributor to OA, accounting for on
average 72% of OA. The rest of OA was unresolved as a mixture of OA sources. Both local and
regional SOA had a significant contribution to OA during the day but regional SOA was the
largest contributor to OA during the afternoon. SOA formed from the oxidation of biogenic SOA
precursors substantially contributed to OA at night. The absorption of organic compounds into
particles is suggested to be the major pathway to form SOA, although other pathways also played
significant roles.
To achieve quantitative collection of SVOCs following improved gas/particle separation,
a new collection and thermal desorption system was developed with the key component being a
passivated metal fiber filter collector. This final configuration of the SV-TAG enabled in-situ
quantitative measurements of speciated SVOCs with vapor pressures lower than n-tetradecane
(C14). The capability for measurements of gas/particle partitioning was demonstrated by
measurements of n-alkanes in both gas and particle phases. Organic tracers in both gas and
particle phases can be quantified. Percentages of speciated organic compounds in total measured
organics can be estimated. For example, ~7% and less than 1% of total measured organics in the
same retention range of n-alkanes (C14-C20) in the atmosphere in Berkeley, CA were accounted
for by the sum of measured n-alkanes (C14-C20) and the sum of n-alkylcyclohexanes (C14-C20).
The SV-TAG has been demonstrated to enable investigation of the pathways of gas-to-
particle partitioning and source apportionment of OA with hourly time resolution. The SV-TAG
is also capable of quantitative measurements of speciated SVOCs, defining their gas/particle
partitioning in-situ for the first time, and providing observational constraints on the abundance
of SVOCs with which to investigate their primary emissions, chemical transformation, and fate.

i
Table of Contents Table of Contents.............................................................................................................. i
List of Figures................................................................................................................... iii
List of Tables.................................................................................................................... v
Acknowledgements........................................................................................................... vi
Chapter 1 Introduction............................................................................................. 1
1.1 Identification of OA sources................................................................................. 1
1.2 SOA formation...................................................................................................... 2
1.2.1 Gas-to-particle partitioning....................................................................... 2
1.2.2 IVOCs and SVOCs................................................................................... 3
1.3 Instrumentation..................................................................................................... 4
1.4 Focus of PhD dissertation..................................................................................... 4
1.5 References............................................................................................................. 5
Chapter 2 Insights into SOA formation mechanisms from measured gas/particle
partitioning of specific organic tracer compounds...................................................... 9
2.1 Abstract................................................................................................................. 9
2.2 Introduction.......................................................................................................... 9
2.3 Methods................................................................................................................ 10
2.3.1 Sampling and analysis.............................................................................. 11
2.3.2 Particle-phase fraction calculations.......................................................... 12
2.4 Results and discussions........................................................................................ 13
2.4.1 Pinonaldehyde.......................................................................................... 13
2.4.2 Phthalic acid............................................................................................. 15
2.4.3 6,10,14-trimethyl-2-pentadecanone.......................................................... 16
2.5 Conclusions and implications............................................................................... 16
2.6 References............................................................................................................. 17
2.7 Tables and Figures................................................................................................ 21
Chapter 3 Sources of organic aerosol investigated using organic compounds as
tracers measured during CalNex Bakersfield.............................................................. 26
3.1 Abstract................................................................................................................. 26
3.2 Introduction.......................................................................................................... 26
3.3 Methods................................................................................................................ 28
3.3.1 Sampling and chemical analysis.............................................................. 28
3.3.2 PMF procedures....................................................................................... 29
3.4 PMF results.......................................................................................................... 30
3.4.1 Factor 1: local POA.................................................................................. 30
3.4.2 Factor 2: A mixture of OA sources.......................................................... 31
3.4.3 Factor 3: SOA1......................................................................................... 31
3.4.4 Factor 4: SOA2......................................................................................... 31
3.4.5 Factor 5: SOA3......................................................................................... 32
3.4.6 Factor 6: nighttime SOA (SOA4)............................................................. 32
3.5 Reconstructed OA................................................................................................. 32
3.6 Source contributions to OA mass......................................................................... 33
3.7 Formation pathways of SOA................................................................................ 34
3.8 Conclusions and atmospheric implications.......................................................... 35

ii
3.9 References............................................................................................................ 35
3.10 Tables and figures................................................................................................. 39
Chapter 4 Development of an in situ thermal desorption gas chromatography
instrument for quantifying atmospheric semi-volatile organic compounds.............. 44
4.1 Abstract................................................................................................................. 44
4.2 Introduction.......................................................................................................... 44
4.3 Methods................................................................................................................ 46
4.3.1 The SV-TAG system................................................................................ 46
4.3.2 SV-TAG operation................................................................................... 47
4.3.3 System evaluation.................................................................................... 48
4.3.4 Ambient sampling.................................................................................... 50
4.4 Evaluation results................................................................................................. 50
4.4.1 Thermal desorption and transfer efficiency............................................. 50
4.4.2 SVOC collection efficiency by the F-CTD............................................... 51
4.4.3 Particle collection efficiency by the F-CTD............................................. 51
4.4.4 Denuder vapor collection and particle penetration.................................. 52
4.4.5 Measurements of ambient air................................................................... 52
4.5 Summary and atmospheric implications.............................................................. 53
4.6 References............................................................................................................ 54
4.7 Tables and figures................................................................................................. 58
Chapter 5 Conclusions............................................................................................... 64
5.1 Summary............................................................................................................... 64
5.1.1 Gas-to-particle partitioning (SOA formation).......................................... 64
5.1.2 Major source contributions to OA............................................................. 65
5.1.3 SV-TAG and ambient measurements....................................................... 65
5.2 Future work........................................................................................................... 66
5.2.1 Measurements of gas/particle partitioning............................................... 67
5.2.2 Measurements of SVOCs.......................................................................... 67
5.2.3 SOA formation and transformation.......................................................... 67
5.2.4 Instrumentation......................................................................................... 67
Appendix A: Supplemental information for Chapter 2..................................................... 69
Appendix B: Supplemental information for Chapter 3..................................................... 71
Appendix C: Supplemental information for Chapter 4..................................................... 75

iii
List of Figures
Chapter 2 - Insights into SOA formation mechanisms from measured gas/particle partitioning of
specific organic tracer compounds
Figure 2.1 O/C ratios and subcooled vapor pressures of measured organic species 21
Figure 2.2 Average measured and predicted fractions for oxygenated SVOCs and
their corresponding reference compounds 22
Figure 2.3 Measured fraction of pinonaldehyde in particles and the cation-to-anion
ratio as a function of RH 23
Figure 2.4 Timelines of the cation-to-anion ratio and the fraction of pinonaldehyde in
particles throughout the field campaign 24
Figure 2.5 Correlation between the fraction of phthalic acid in particles and the
concentration of gas-phase ammonia 25
Chapter 3 - Sources of organic aerosol investigated using organic compounds as tracers
measured during CalNex Bakersfield
Figure 3.1 PMF factor profiles 39
Figure 3.2 Diurnal averages for each PMF factor, the wind direction and the ratio
of 1,3,5-TMB to toluene 40
Figure 3.3 Wind rose plots to emphasize the major contributing source directions 41
Figure 3.4 Mean diurnal mass fraction contribution of each factor to total OA 42
Figure 3.5 Diurnal averages for SOA factors from AMS PMF and TAG PMF
solutions 43
Chapter 4 - Development of an in situ thermal desorption gas chromatography instrument for
quantifying atmospheric semi-volatile organic compounds
Figure 4.1 Schematic of the SV-TAG system 58
Figure 4.2 Recoveries of representative compounds 59
Figure 4.3 Recoveries of n-alkanes ≤ C26 measured with different FTs 60
Figure 4.4 Overall gas collection efficiency of the F-CTD 61
Figure 4.5 Stability of the SV-TAG collection and detection system 62
Figure 4.6 Ambient measurements of gas- and particle-phase organics 63
Appendix A: Supplemental Information for Chapter 2
Figure A1 The stability of gas collection efficiency of the denuder 69
Figure A2 Particle losses inside the denuder 70
Appendix B: Supplemental Information for Chapter 3
Figure B1 (a) The relative difference between the reconstructed and measured OA
concentration; (b) the frequency of the different atmospheric OA
concentrations occurred at night 72
Figure B2 Factor profiles extracted by PMF analysis from the same group of
compounds with or without inclusion of gas-phase contributions to
measured SVOCs 73
Figure B3 Correlation of PMF results from the dataset with or without inclusion of

iv
gas-phase contributions 74
List of Figures
Appendix C: Supplemental Information for Chapter 4
Figure C1 Schematic diagrams of the F-CTD and its housing assembly 78
Figure C2 Schematic diagram of the FT assembly 79
Figure C3 Operating conditions for the evaluation of gas collection efficiency of the
F-CTD using thermal desorption method 80
Figure C4 Operating conditions for the evaluation of the gas collection efficiency of
the F-CTD using evaporation transfer 81
Figure C5 Operation conditions of the SV-TAG system during ambient
measurements 82
Figure C6 Optimization of the recovery of less volatile organic compounds 83
Figure C7 Particle collection efficiency of the F-CTD for the mobility diameter from
~ 30 nm to ~350 nm 84
Figure C8 Particle collection efficiency of the F-CTD for the mobility diameter from
~ 60 nm to ~1000 nm 85
Figure C9 Effect of organic loading on the recovery of individual compounds 86

v
List of Tables
Appendix B: Supplemental Information for Chapter 4
Table B1 - Organic compounds used to evaluate the overall SVOC CE of the F-CTD 77

vi
Acknowledgements
This dissertation is a culmination of research performed over 5 years and could not have
been completed without the help and support from my advisor, colleagues, friends and family. I'd
like to thank my advisor, Allen Goldstein, who is always supportive and encouraging by sharing
his insights, suggestions and excitements for my research. I'm grateful for many challenges,
opportunities that I grow to under his guidance. He is a great advisor to work with. I'd like to
thank my colleagues in the Goldstein group, Dave, Gabriel, Arthur, Drew, Rachel and Jeong-
Hoo, for their help in both laboratory and field measurements. I'd also like to thank other group
members for their helpful discussions and making the Goldstein group a supportive environment
to do science.
I'd like to thank Nathan Kreisberg and Susanne Hering at Aerosol Dynamic Inc.. Without
their help, I could not complete the development of the novel instrument, SV-TAG. I have gone
to Nathan numerous times to ask for advice on instrumentation and instrument designs. I'd like to
thank Lara Gundel at LNBL as well, from whom I have learned a lot about denuders when I first
started the development of the SV-ATG. I also thank University of California Extension Staff
and Kern County Staff for logistical support during the Bakersfield CalNex study. I have
collected most part of data for my dissertation during the CalNex Campaign. I also thank my
other collaborators, including Lynn Russell, Shang Liu and Douglas Day at UC San Diego and
Jennifer Murphy, Trevor Vandenboer and Milos Markovic at University of Toronto.
I'd also like to thank my dissertation committee, Professors Allen Goldstein, Dennis
Baldocchi and Ronald Cohen, for their thorough and critical readings of my dissertation and for
their help to make research and dissertation better.
I am grateful to my parents, Fuying Zhao and Luansheng Wang, for their understanding,
support and encouragement all these years. Most of all, I want to thank Ying (Jane) Hong for
being such an important part of my life. I own so much of my success to her. Finally, I'd like to
thank everyone who helped, supported and encouraged me along the way.

1
Chapter 1
Introduction
Organic aerosol (OA) constitutes 20~90% of the total fine aerosol mass in most regions
(Kanakidou et al., 2005). OA can be categorized into either primary organic aerosol (POA)
directly emitted from sources, such as food cooking and vehicle exhausts (e.g. Schauer et al.
1999a, b, 2002) or secondary organic aerosol (SOA) formed in the atmosphere from different
precursors through chemical reactions (Odum et al., 1997; Jang et al., 2002; Robinson et al.,
2007; Kroll and Seinfeld, 2008). SOA has been found to have different adverse human health
effects than POA (Li et al., 2008) and plays a significant role in affecting climate change on both
global and regional scales (Hoyle et al., 2009; Goldstein et al., 2009). Understanding OA sources
and SOA formation is a critical step toward elucidating their roles in climate change and human
health and developing effective control strategies for reducing air pollution.
1.1 Identification of OA sources Quantification and characterization of OA can be made with a wide range of analytical
techniques, such as gas chromatography-mass spectrometry (GC-MS), Fourier transform infrared
spectroscopy, Aerodyne Aerosol Mass Spectrometry (AMS), and so on, with chemical resolution
spanning from individual organic compounds to function groups to the carbon content and
characterization completeness range from less than 20% to 100% (e.g. Turpin et al., 2000;
Hallquist et al., 2009). None of these techniques is able to directly determine the amount of POA
and SOA or the contributions of various sources to OA, but they provide complementary aerosol
chemical composition information which can be analyzed to identify sources and their
contributions to OA through statistical analyses and knowledge of source chemical signature and
atmospheric transformation pathways.
Measurements of organic speciation made with GC-MS generally resolve less than 20%
of the OA mass (Hallquist et al., 2009; Williams et al., 2006), but some of identified organic
compounds can serve as molecular markers which are unique to specific OA sources, such as
levoglucosan for wood combustion and phthalic acid for SOA (e.g. Schauer et al., 1996).
Moreover, SOA tracers can provide information for understanding the chemical formation and
transformation mechanisms leading to SOA (e.g. Kleindienst et al., 2007; Zhang et al., 2009;
Williams et al., 2010). Chemical mass balance (CMB) and positive matrix factorization (PMF)
models are two common methods that use speciated organic molecular marker to estimate source
contributions to OA (e.g. Schauer et al., 1996; Schauer and Cass, 2000; Jaeckels et al., 2007;
Shrivastava et al., 2007; Williams et al., 2010). Both CMB and PMF models assume the
measured chemical composition of OA in the atmosphere is the linear sum of contributions of a
number of sources which have distinct source profiles (Schauer et al., 1996; Hopke, 2003; Reff
et al., 2007; Shrivastava et al., 2007; Zhang et al., 2011).
The CMB model using organic molecular marker compounds directly apportions OA to
specific sources, such as diesel vehicles and meat cooking, using their source profiles as model
inputs (Schauer et al., 1996). As a result of the requirement of a priori knowledge of the source
profile, the CMB model cannot apportion OA mass to sources with unknown or undefined
2
source profiles, such as SOA. Though the amount of SOA has been estimated by the difference
of between apportioned OA and measured OA (Schauer et al., 1996; Zheng et al., 2002;
Subramanian et al., 2007), SOA estimated through this approach is poorly constrained.
The PMF model apportions organic species into distinct factors according to co-variation
between them. The composition of organic species in each factor can be used to identify the
presence of either a specific source or atmospheric process (Shrivastava et al., 2007; Williams et
al., 2010). Since the PMF model solves for the source profiles, the sources with unknown or
undefined source profiles can be determined by inclusion of all organic markers measured in the
ambient samples. For example, four types of SOA were determined by performing the PMF
analysis on a dataset of organic species measured hourly by a thermal desorption aerosol gas
chromatograph (TAG) in a field study site in the Riverside, California (Williams et al., 2010). In
the PMF analysis, the contributions of identified sources to OA can be estimated by either
directly including OA mass in the PMF dataset as a compound or by using a multivariate fit of
the temporal variability of factors onto measured OA (Reff et al., 2007; Shrivastava et al., 2007;
Williams et al., 2010).
Bulk analyses of OA provided by optical-thermal elemental carbon (EC) and organic
carbon (OC) analyzer or by AMS are particular useful for the split of POA and SOA (e.g. Yu et
al., 2007; Zhang et al., 2007), but are not sufficient to conduct source apportionment of POA or
SOA to specific sources or processes. Generally, EC tracer-based analysis assumes any organics
leading to a higher OC/EC ratio than that in primary emissions must be SOA (Gray et al.1986;
Turpin et al., 1991; Strader et al., 1999; Yu et al., 2007). PMF analysis of mass spectra produced
by AMS is now routinely used to separate several components of OA, including hydrocarbon-
like OA (HOA), low-volatility oxygenated OA (LV-OOA), semi-volatile oxygenated OA, with
POA assumed to consist of hydrocarbon-like OA and SOA generally assumed to be represented
by the sum of OOA (Ulbrich et al., 2009; Jimenez et al., 2009; Zhang et al., 2011); however,
these components of OA cannot be traced to specific sources or processes without further
information.
1.2 SOA formation SOA accounts for the dominant fraction of OA in most regions and its contribution to OA
can be over 80% in the afternoon during summer in urban areas (Lim and Turpin, 2002; Zhang et
al., 2005; 2007; Williams et al., 2010). However, models, describing SOA formation through
gas-phase oxidation of VOCs followed by absorptive partitioning of their low volatility oxidation
products into particles, typically predict less SOA than it measured in polluted regions (e.g.
Volkamer et al., 2006; Hodzic et al., 2010; Spracklen et al., 2011). These discrepancies between
modeled and measured SOA can be in part attributed to uncharacterized gas-to-particle
partitioning pathways in the atmosphere (e.g. Kroll et al., 2005; Kroll and Seinfeld 2008) or
additional SOA precursors which are likely intermediate-volatility organic compounds (IVOCs)
and semi-volatile organic compounds (SVOCs) (e.g. Goldstein and Galbally, 2007; Robinson et
al., 2007; Hodzic et al., 2010).
1.2.1 Gas-to-particle partitioning

3
SOA formation is traditionally modeled by absorption into particles following formation
of low-volatility oxidation products, but studies have shown that multiple other pathways of gas-
to-particle partitioning are also important in the atmosphere(e.g. Jang et al., 2002; Kroll et al.,
2005; Na et al., 2007; Iinuma et al., 2005). In one example, reactive uptake of carbonyls onto
acidic particles has been suggested be an important additional pathway of SOA formation (e.g.
Jang et al., 2002), even though the compounds involved in this pathway are present in the gas
phase according to absorptive partitioning theory (Pankow, 1994). In another example,
enhancement of SOA formation resulted from a-pinene ozone reactions has been observed in the
presence of gas-phase ammonia and this enhancement was attributed to reactions between gas-
phase ammonia and organic acids (Na et al., 2007).
Laboratory studies have shown that reactive uptake of carbonyls on acidic particles
depends on specific compounds and experimental conditions. SOA formation from the reactive
uptake of small carbonyls was observed to be significantly higher in the presence of an acidic
catalyst (e.g. Jang et al., 2002; Iimuna et al., 2005; Kroll et al., 2005), but enhancement in SOA
formation varied in different laboratory studies (e.g Iimuna et al., 2005) and results reported by
Kroll et al. (2005) showed that the reactive uptake of some of carbonyls onto particles was
insignificant when concentrations of carbonyls used in the laboratory experiments were scaled to
atmospheric levels.
Experimental conditions in laboratory studies often differ from the atmospheric
conditions in many ways, including NOx level, particle acidity, preexisting aerosol mass, gas-
phase organic mass and oxidation state (Kroll and Seinfeld, 2008). As a result, SOA formation
pathways occurring in the atmosphere could be different from those characterized in laboratory
studies. Therefore, ambient measurements of gas- and particle-phase organic species are
necessary to identify the presence of different gas-to-particle partitioning pathways in the
atmosphere and investigate the effects of atmospheric conditions, including particle acidity and
RH, on gas-to-particle partitioning of different species. Ambient measurements are also
necessary to examine the relative importance of different gas-to-particle partitioning pathways.
1.2.2 IVOCs and SVOCs
Recent modeling work has shown that models including estimated I/SVOCs emissions
using the volatility basis set (VBS) approach (Robinson et al., 2007; Shrivastava et al., 2008;
Grieshop et al., 2009) resulted in better agreement between measured and modeled SOA
(Dzepina et al., 2009; Tsimpidi et al., 2010; Hodzic et al., 2010) than those which did not include
estimated I/SVOCs (e.g., Volkamer et al., 2006; Hodzic et al., 2010). However, these newer
models have not been able to reproduce both the SOA mass and the oxygen to carbon ratio of the
bulk aerosol (Hodzic et al., 2010), demonstrating that there remains substantial deficiencies in
understanding and modeling of I/SVOCs emissions and their atmospheric transformation into
SOA.
These deficiencies of the VBS approach must be rooted in its simplification of the
complex composition of I/SVOCs in the atmosphere and the dependence of SOA yields on
molecular structure and other parameters. The VBS approach lumps all species with the same
effective saturation concentration into a single volatility bin and assumes a constant mass
increase for species in a given bin through each oxidation step (Robinson et al., 2007;

4
Shrivastava et al., 2007). Additionally, the amount of primary I/SVOCs included in these newer
models is not measured in the atmosphere but instead is estimated by multiplying concentrations
of primary organic aerosol (POA) by a scaling factor derived from dilution measurements of
emissions from two primary sources: diesel exhaust and wood burning (Robinson et al., 2007;
Grieshop et al., 2009). To better predict SOA production from the oxidation of I/SVOCs, it is
critical to apply observational constraints to emissions, speciation, and gas-phase oxidation
mechanisms of I/SVOCs.
Since oxygenated compounds in the vapor pressure range of IVOCs are known to
partition into particles through non-absorptive gas-to-particle partitioning (e.g. Jang et al., 2002),
there is no clear split between IVOCs and SVOCs in the atmosphere according to gas/particle
partitioning. We therefore define "SVOCs" to include both IVOCs and SVOCs in this
dissertation. There are other operational definitions of SVOCs based on the vapor pressure and
air-sampling strategy (Turpin et al., 2000). However, SVOCs are generally in the vapor pressure
range approximately equivalent to C12-C32 n-alkanes (Turpin et al., 2000; Sihabut et al., 2005;
Robinson et al., 2007; de Gouw et al., 2011).
1.3 Instrumentation To improve the understanding of the primary source contributions to OA and SOA
formation in the atmosphere, ambient measurements are needed for both gas- and particle-phase
organic marker species which can be used to conduct PMF analyses, provide observational
constraints on abundance, speciation and sources of SVOCs, and investigate their gas-to-particle
partitioning pathways. Speciated measurements of organic chemicals in aerosols have
historically involved integrated field sampling by filtration or impaction with subsequent solvent
extraction in the laboratory for GC analysis. Generally the filter sampling has low time
resolution (typically 24 hours) and thus obscure the variability in concentrations of organic
species which are critical to understanding the dynamic variability of sources, chemistry, gas-to-
particle partitioning and atmospheric transport processes. Additionally, these measurements have
mainly focused on particle-phase organics and very few of them have been made to measure
SVOCs.
The TAG is the first in-situ instrument capable of measuring speciated organic
compounds in OA with hourly time resolution and capturing the diurnal trend of gas/particle
partitioning in the atmosphere (Williams et al., 2006; Williams et al., 2010). However, the
original TAG, equipped with an impactor collection cell, was not designed for collection of
SVOCs. Additionally, a filter-based method, utilized by the original TAG to achieve separation
of gas- and particle-phase organics, is subject to positive artifacts caused by adsorption of gas-
phase organics on the filter as well as negative artifacts due to evaporation of particulate organics.
As a result, while the original TAG was able to observe the trends in the concentrations of some
speciated SVOCs and their gas/particle partitioning, but it could not do quantitatively or
comprehensively.
1.4 Focus of PhD dissertation The goal of my PhD dissertation is to develop a novel instrument, based on the concept
of the TAG, that is capable of quantitative measurements of SVOCs and OA with hourly time

5
resolution and make ambient measurements with this instrument that would 1) improve our
understanding of SOA formation pathways; 2) determine the contributions to OA from a variety
of sources and 3) provide observational constraints on abundance, speciation and sources of
SVOCs as SOA precursors. These three focuses are addressed in Chapter 2-4, respectively.
This dissertation consists of five chapters:
Chapter 1: Introduction
Chapter 2: Insights into SOA formation mechanisms from measured gas/particle partitioning of
specific organic tracer compounds
Chapter 3: Sources of organic aerosol investigated using organic compounds as tracers measured
during CalNex Bakersfield
Chapter 4: Development of an in situ thermal desorption gas chromatography instrument for
quantifying atmospheric semi-volatile organic compounds
Chapter 5: Conclusions
The development of the SV-TAG was initiated by employing a denuder difference
method to improve the separation of gas- and particle-phase organics of the original TAG
followed by development of a new system to quantitatively collect and transfer SVOCs into
GC/MS. Chapter 2 and 3 focus on the ambient measurements after a denuder was added into the
sampling inlet of the original TAG. Ambient measurements were made as part of the CALifornia
at the NEXus of Air Quality and Climate Change (CalNex) campaign in Bakersfield. In Chapter
2, the separation of gas- and particle-phase organics by a denuder was evaluated and time-
resolved measurements of the gas/particle partitioning of SOA tracers were made to examine the
presence of other SOA formation pathways in addition to absorptive partitioning in the ambient
atmosphere. In Chapter 3, PMF analysis was performed on particle-phase organic species to
investigate the source contributions to OA and provide insights into the importance of different
SOA formation pathways in the atmosphere. Chapter 4 presents the development and extensive
evaluations of a final configuration of SV-TAG, including the components developed in two
development stages. Chapert4 also reports the first SV-TAG ambient measurements of speciated
SVOCs made in Berkeley, CA, which clearly demonstrates the capability to measure abundance,
speciation and gas/particle partitioning of SVOCs.
1.5 References de Gouw, J. A., Middlebrook, A. M., Warneke, C., Ahmadov, R., Atlas, E. L., Bahreini, R.,
Blake, D. R., Brock, C. A., Brioude, J., Fahey, D. W., Fehsenfeld, F. C., Holloway, J. S.,
Henaff, M. Le, Lueb, R. A., Mckeen, S. A., Meagher, J. F., Murphy, D. M., Paris, C., Parrish,
D. D., Perring, A. E., Pollack, I. B., Ravishankara, A. R., Robinson, A. L., Ryerson, T. B.,
Schwarz, J. P., Spackman, J. R., Srinivasan, A., and Watts, L. A. (2011). Organic Aerosol
Formation Downwind from the Deepwater Horizon Oil Spill. Science, 331:1295-1299.
Dzepina, K., Volkamer, R. M., Madronich, S., Tulet, P., Ulbrich, I. M., Zhang, Q., Cappa, C. D.,
Ziemann, P. J., and Jimenez, J. L. (2009). Evaluation of Recently-Proposed Secondary
Organic Aerosol Models for A Case Study in Mexico City. Atmos. Chem. Phys., 9:5681-5709.
Goldstein, A. H., Koven, C. D., Heald, C. L. and Fung, I. Y. (2009). Biogenic carbon and
anthropogenic pollutants combine to form a cooling haze over the southeastern United States.
P. Natl. Acad. Sci. USA, 106:8835-8840.
6
Grieshop, A. P., Logue, J. M., Donahue, N. M., and Robinson, A. L. (2009). Laboratory
Investigation of Photochemical Oxidation of Organic Aerosol from Wood Fires 1:
Measurement and Simulation of Organic Aerosol Evolution. Atmos. Chem. Phys., 9:1263-
1277.
Hallquist, M., Wenger, J. C., Baltensperger, U., Rudich, Y., Simpson, D., Claeys, M., Dommen,
J., Donahue, N. M., George, C., Goldstein, A. H., Hamilton, J. F., Herrmann, H., Hoffmann,
T., Iinuma, Y., Jang, M., Jenkin, M. E., Jimenez, J. L., Kiendler-Scharr, A., Maenhaut, W.,
McFiggans, G., Mentel, T. F., Monod, A., Prevot, A. S. H., Seinfeld, J. H., Surratt, J. D.,
Szmigielski, R. and Wildt, J. (2009). The formation, properties and impact of secondary
organic aerosol: current and emerging issues. Atmos. Chem. Phys., 9:5155-5236.
Hodzic, A., Jimenez, J. L., Madronich, S., Canagaratna, M. R., DeCarlo, P. F., Kleinman, L., and
Fast, J. (2010). Modeling Organic Aerosols in A Megacity: Potential Contribution of Semi-
Volatile and Intermediate Volatility Primary Organic Compounds to Secondary Organic
Aerosol Formation. Atmos. Chem. Phys., 10:5491-5514.
Hopke, P. K. (2003), Recent developments in receptor modeling, J. Chemometr., 17(5), 255-265.
Hoyle, C. R., Myhre, G., Berntsen, T. K. and Isaksen, I. S. A. (2009). Anthropogenic influence
on SOA and the resulting radiative forcing. Atmos. Chem. Phys., 9:2715-2728.
Iinuma, Y., Boge, O., Miao, Y., Sierau, B., Gnauk, T. and Herrmann, H. (2005). Laboratory
studies on secondary organic aerosol formation from terpenes. Faraday Discuss., 130:279-
294.
Jaeckels, J. M., M. S. Bae, and J. J. Schauer (2007), Positive matrix factorization (PMF) analysis
of molecular marker measurements to quantify the sources of organic aerosols. Environ. Sci.
Technol., 41(16), 5763-5769.
Jang, M. S., Czoschke, N. M., Lee, S. and Kamens, R. M. (2002). Heterogeneous atmospheric
aerosol production by acid-catalyzed particle-phase reactions. Science, 298:814-817.
Jimenez, J. L., et al. (2009), Evolution of Organic Aerosols in the Atmosphere. Science,
326(5959), 1525-1529.
Kanakidou, M., Seinfeld, J. H., Pandis, S. N., Barnes, I., Dentener, F. J., Facchini, M. C., Van
Dingenen, R., Ervens, B., Nenes, A., Nielsen, C. J., Swietlicki, E., Putaud, J. P., Balkanski, Y.,
Fuzzi, S., Horth, J., Moortgat, G. K., Winterhalter, R., Myhre, C. E. L., Tsigaridis, K., Vignati,
E., Stephanou, E. G. and Wilson, J. (2005). Organic aerosol and global climate modelling: a
review. Atmos. Chem. Phys., 5:1053-1123.
Kleindienst, T. E., M. Jaoui, M. Lewandowski, J. H. Offenberg, C. W. Lewis, P. V. Bhave, and E.
O. Edney (2007), Estimates of the contributions of biogenic and anthropogenic hydrocarbons
to secondary organic aerosol at a southeastern US location. Atmos. Environ., 41(37), 8288-
8300.
Kroll, J. H., Ng, N. L., Murphy, S. M., V, V., Flagan, R. C. and Seinfeld, J. H. (2005). Chamber
studies of secondary organic aerosol growth by reactive uptake of simple carbonyl
compounds. J. Geophys. Res.-Atmos., 110.
Kroll, J. H., and J. H. Seinfeld (2008), Chemistry of secondary organic aerosol: Formation and
evolution of low-volatility organics in the atmosphere. Atmos. Environ., 42(16), 3593-3624.
Li, Q. F., A. Wyatt, and R. M. Kamens (2009), Oxidant generation and toxicity enhancement of
aged-diesel exhaust. Atmos. Environ., 43(5), 1037-1042.
Na, K., Song, C., Switzer, C. and Cocker, D. R. (2007). Effect of ammonia on secondary organic
aerosol formation from alpha-Pinene ozonolysis in dry and humid conditions. Environ. Sci.
Technol., 41:6096-6102.

7
Odum, J. R., T. P. W. Jungkamp, R. J. Griffin, R. C. Flagan, and J. H. Seinfeld (1997), The
atmospheric aerosol-forming potential of whole gasoline vapor. Science, 276(5309), 96-99.
Pankow, J. F. (1994). An Absorption-Model of Gas-Particle Partitioning of Organic-Compounds
in the Atmosphere. Atmos. Environ., 28:185-188.
Reff, A., S. I. Eberly, and P. V. Bhave (2007), Receptor modeling of ambient particulate matter
data using positive matrix factorization: Review of existing methods. J. Air. Waste. Manage.,
57(2), 146-154.
Robinson, A. L., N. M. Donahue, M. K. Shrivastava, E. A. Weitkamp, A. M. Sage, A. P.
Grieshop, T. E. Lane, J. R. Pierce, and S. N. Pandis (2007), Rethinking organic aerosols:
Semivolatile emissions and photochemical aging. Science, 315(5816), 1259-1262.
Schauer, J. J., W. F. Rogge, L. M. Hildemann, M. A. Mazurek, G. R. Cass, and B. R. T. Simoneit
(1996), Source apportionment of airborne particulate matter using organic compounds as
tracers. Atmos. Environ., 30(22), 3837-3855.
Schauer, J. J., M. J. Kleeman, G. R. Cass, and B. R. T. Simoneit (1999a), Measurement of
emissions from air pollution sources. 1. C-1 through C-29 organic compounds from meat
charbroiling. Environ. Sci. Technol., 33(10), 1566-1577.
Schauer, J. J., M. J. Kleeman, G. R. Cass, and B. R. T. Simoneit (1999b), Measurement of
emissions from air pollution sources. 2. C-1 through C-30 organic compounds from medium
duty diesel trucks. Environ. Sci. Technol., 33(10), 1578-1587.
Schauer, J. J., and G. R. Cass (2000), Source apportionment of wintertime gas-phase and
particle-phase air pollutants using organic compounds as tracers. Environ. Sci. Technol., 34(9),
1821-1832.
Schauer, J. J., M. J. Kleeman, G. R. Cass, and B. R. T. Simoneit (2002), Measurement of
emissions from air pollution sources. 5. C-1-C-32 organic compounds from gasoline-powered
motor vehicles. Environ. Sci. Technol., 36(6), 1169-1180.
Shrivastava, M. K., R. Subramanian, W. F. Rogge, and A. L. Robinson (2007), Sources of
organic aerosol: Positive matrix factorization of molecular marker data and comparison of
results from different source apportionment models. Atmos. Environ., 41(40), 9353-9369.
Shrivastava, M. K., Lane, T. E., Donahue, N. M., Pandis, S. N., and Robinson, A. L. (2008).
Effects of Gas Particle Partitioning and Aging of Primary Emissions on Urban and Regional
Organic Aerosol Concentrations. J. Geophys. Res., 113, D18301, doi:10.1029/2007JD009735.
Sihabut, T., Ray, J., Northcross, A. and McDow, S. R. (2005). Sampling artifact estimates for
alkanes, hopanes, and aliphatic carboxylic acids. Atmos. Environ., 39:6945-6956.
Spracklen, D. V., Jimenez, J. L., Carslaw, K. S., Worsnop, D. R., Evans, M. J., Mann, G. W.,
Zhang, Q., Canagaratna, M. R., Allan, J., Coe, H., McFiggans, G., Rap, A. and Forster, P.
(2011). Aerosol mass spectrometer constraint on the global secondary organic aerosol budget.
Atmos. Chem. Phys., 11:12109-12136.
Subramanian, R., N. M. Donahue, A. Bernardo-Bricker, W. F. Rogge, and A. L. Robinson
(2007), Insights into the primary-secondary and regional-local contributions to organic
aerosol and PM2.5 mass in Pittsburgh, Pennsylvania. Atmos. Environ., 41(35), 7414-7433.
Tsimpidi, A. P., Karydis, V. A., Zavala, M., Lei, W., Molina, L., Ulbrich, I. M., Jimenez, J. L.,
and Pandis, S. N. (2010). Evaluation of the Volatility Basis-Set Approach for the Simulation
of Organic Aerosol Formation in the Mexico City Metropolitan Area. Atmos. Chem. Phys.,
10:525-546.
Turpin, B. J., Saxena, P., and Andrews, E. (2000). Measuring and Simulating Particulate
Organics in the Atmosphere: Problems and Prospects. Atmos. Environ., 34:2983-3013.

8
Ulbrich, I. M., M. R. Canagaratna, Q. Zhang, D. R. Worsnop, and J. L. Jimenez (2009),
Interpretation of organic components from Positive Matrix Factorization of aerosol mass
spectrometric data. Atmos. Chem. Phys., 9(9), 2891-2918.
Volkamer, R., Jimenez, J. L., San Martini, F., Dzepina, K., Zhang, Q., Salcedo, D., Molina, L. T.,
Worsnop, D. R. and Molina, M. J. (2006). Secondary organic aerosol formation from
anthropogenic air pollution: Rapid and higher than expected. Geophys. Res. Lett., 33.
Williams, B. J., Goldstein, A. H., Kreisberg, N. M. and Hering, S. V. (2006). An In-Situ
Instrument for Speciated Organic Composition of Atmospheric Aerosols: Thermal Desorption
Aerosol GC/MS-FID (TAG). Aerosol Sci. Tech., 40:627-638.
Williams, B. J., Goldstein, A. H., Kreisberg, N. M. and Hering, S. V. (2010). In Situ
Measurements of Gas/Particle-Phase Transitions for Atmospheric Semivolatile Organic
Compounds. P. Natl. Acad. Sci.. 107:6676-6681.
Zhang, Q., et al. (2007), Ubiquity and dominance of oxygenated species in organic aerosols in
anthropogenically-influenced Northern Hemisphere midlatitudes. Geophys Res Lett, 34(13).
Zhang, Q., J. L. Jimenez, M. R. Canagaratna, I. M. Ulbrich, N. L. Ng, D. R. Worsnop, and Y. L.
Sun (2011), Understanding atmospheric organic aerosols via factor analysis of aerosol mass
spectrometry: a review. Anal. Bioanal. Chem., 401(10), 3045-3067.
Zhang, Y., R. J. Sheesley, J. J. Schauer, M. Lewandowski, M. Jaoui, J. H. Offenberg, T. E.
Kleindienst, and E. O. Edney (2009), Source apportionment of primary and secondary organic
aerosols using positive matrix factorization (PMF) of molecular markers. Atmos. Environ.,
43(34), 5567-5574.

9
Chapter 2
Insights into SOA formation mechanisms from measured gas/particle
partitioning of specific organic tracer compounds
2.1 Abstract Semi-volatile and intermediate-volatility organic compounds (S/IVOCs) in both gas and
particle phases were measured using a Thermal desorption Aerosol Gas chromatograph (TAG)
instrument during the CALifornia at the NEXus of Air Quality and Climate Change (CALNEX)
campaign in Bakersfield, CA from May 31st to June 27th, 2010. The gas/particle partitioning of
phthalic acid, pinonaldehyde and 6, 10, 14-trimethyl-2-pentadecanone is discussed in detail to
explore secondary organic aerosol (SOA) formation mechanisms. Measured fractions in the
particle phase ( fpart) of 6, 10, 14-trimethyl-2-pentadecanone were similar to those expected from
absorptive gas/particle partitioning theory, suggesting that its partitioning is dominated by
absorption processes. However, fpart of phthalic acid and pinonaldehyde were significantly higher
than predicted. The formation of low-volatility products from reactions of phthalic acid with
ammonia is proposed as one possible mechanism to explain the enhancement of particle-phase
phthalic acid. This gas/particle partitioning pathway is expected to lead to high O/C ratios of
SOA because it favors the partitioning of gas-phase organic acids into particles by forming
condensable ammonium salts. The observations of particle-phase pinonaldehyde when inorganic
acids were fully neutralized show that inorganic acids are not required for the occurrence of
reactive uptake of pinonaldehyde on particles. The observed relationship between fpart of
pinonaldehyde and relative humidity (RH) suggests that the aerosol water content play a
significant role in the formation of particle-phase pinonaldehyde. The identification of multiple
pathways of oxygenated organics partitioning into particles in the atmosphere demonstrates that
multiple pathways of gas/particle partitioning should be included in models to predict SOA and
multiple tracers of SOA are needed to reconstruct SOA in source apportionment models.
2.2 Introduction Secondary organic aerosol (SOA) accounts for the majority of organic aerosol (OA) on a
global scale (Kanakidou et al., 2005; Goldstein and Galbally, 2007) and more than 80% in the
afternoon during summer in urban areas (Williams et al., 2010a). However, predictions of SOA
by traditional models based on laboratory measurements of SOA yields from traditional SOA
precursors and absorptive partitioning theory have been shown to substantially underestimate the
ambient SOA loadings in polluted regions (Heald et al. 2005; 2010; Volkamer et al., 2006;
Spracklen et al., 2011). The discrepancies between measurements and models could in part be
attributed to poor understanding of formation pathways of SOA in the ambient atmosphere.
Laboratory studies have shown that SOA formation pathways in addition to absorptive
partitioning (Pankow, 1994), such as reactive uptake of gaseous species (Jang et al., 2002; Kroll
et al., 2005) and gas-phase non-oxidative reactions (Na et al., 2007), could be important.
However, these pathways remain poorly understood. For example, laboratory studies have shown
that reactive uptake of oxygenated organic compounds on acidic particles can significantly
increase SOA yields, but there is no agreement on the extent of enhancement in SOA yields

10
(Jang et al., 2002; Iinuma et al., 2005; Kroll and Seinfeld, 2008). Additionally, laboratory studies
of reactive uptake of oxygenated compounds have focused primarily on small carbonyl
compounds and found that not all of them significantly contribute to SOA when their
concentrations used in the laboratory studies are scaled to atmospheric levels (e.g., Jang et al.,
2002; Kroll et al., 2005). As a result, the contribution of individual compounds to SOA cannot be
generalized based solely on their functional groups. Ambient measurements are crucial to
examine the importance of laboratory proposed SOA mechanisms.
Ambient measurements with an Aerodyne Quadrupole Aerosol Mass Spectrometer (Q-
AMS) have been made to examine the effects of aerosol acidity on SOA formation and the
results showed that no significant enhancement in SOA formation was observed during acidic
periods identified based on the inorganic ion charge balance (Zhang et al., 2007). However, the
importance of acid-catalyzed reactions in SOA formation might not be evident using the
inorganic ion charge balance as the indicator of aerosol acidity because organic acids could also
provide sufficient acidity for the occurrence of these reactions (Gao et al., 2004). Additionally,
the variability in the amount of SOA formed through acid-catalyzed reactions could be obscured
by SOA formed through other pathways if there is not an analytical method to distinguish them.
In comparison with bulk OA analysis by AMS, time-resolved speciated measurements of gas-
and particle-phase organic compounds are particular useful to determine concentrations of
organic compounds involved in acid-catalyzed reactions and distinguish SOA products formed
through acid-catalyzed reactions from other pathways. Moreover, these time-resolved, speciated
measurements provide information to examine factors affecting SOA formation that have
previously been investigated in laboratory studies, such as relative humidity (RH) and acidity,
and discover new pathways of SOA formation in the atmosphere (Pankow, 1994; Jang et al.,
2002; Tillmann et al., 2010).
Williams et al. (2010b) demonstrated that a Thermal desorption Aerosol Gas
chromatography (TAG) instrument was able to capture the trend of gas/particle partitioning of
individual species, wherein a filter-based sampling method was used to separate gases from
particles. In this TAG, the fraction of organic species was overestimated because the its
collection cell is designed for particles and is incapable of complete collection of vapors.
Additionally, this filter-based method is subjective to sorption of gas-phase organics on the filter
and evaporation of collected organics from the filter. Consequently, the extent of overestimation
cannot be estimated. In the current study, a denuder-based sampling method was used,
representing an improved method to separate gases from particles (Turpin et al., 2000) and
allowing the upper limit of the overestimation to be estimated The investigation of different
SOA formation pathways is made by conducting time-resolved, speciated measurements of
gas/particle partitioning of oxygenated semi-volatile/intermediate-volatility organic compounds
(S/IVOCs) in the ambient atmosphere with this modified TAG. The factors affecting these
pathways are investigated using temporal variability of measured gas/particle partitioning of
organic species in combination with supporting measurements, such as RH. This study improves
the understanding of SOA formation in the ambient atmosphere and likely lead to useful
parameterization of SOA formation.
2.3 Methods

11
2.3.1 Sampling and analysis
A modified TAG instrument was deployed to measure organic species in both gas and
particle phases during the CalNex campaign from May 31th to June 27th, 2010 at the Bakersfield
California Supersite. The modification was made before this field campaign by adding an active
charcoal denuder (30 mm OD, 40 cm length, ~490 channels, Mast carbon, UK) into the sampling
inlet as a parallel sampling line to a bypass line made of stainless steel tubing. The denuder was
housed inside a home-made aluminum cylindrical tube with a tapered cap in each end connecting
to the sampling line upstream and downstream.
Detailed description of operation of TAG can be found elsewhere (Williams et al., 2006;
Worton et al., 2011). Only the sampling and operation relevant to this study are described here.
During the sampling, ambient air at 10 L/min was sampled from the center of a main flow,
drawn from approximately 5 meters above ground at 200 L/min, and sampled through a sharp cut
PM2.5 cyclone (10 L/min, BGI Inc., Waltham, MA). Downstream of the cyclone, a flow split was
made to discard 10% of air flow. Subsequently, 90% of the ambient flow was sampled through
the denuder line (or the bypass line) and delivered into a customized Collection and Thermal
Desorption cell (CTD) through a 9 L/min critical orifice for collection of organics. The
aerodynamic particle diameter corresponding to 50% collection is ~0.07 m so that the entire
accumulation mode mass falls within the instrument’s collection range (Williams et al., 2006).
Gas/particle separation was achieved by alternating ambient air between the denuder line and the
bypass line. The samples collected through the denuder ("denuded samples") were expected to be
only particle phase organics while those collected through the bypass line ("undenuded samples")
were the total organics, the sum of the collected gas and particle phase organics. The sampling
duration of each sample was 90 minutes from May 31st to June 9th (Sampling period I) and 30
minutes from June 10th to 27th (Sampling period II). The CTD was maintained at 28°C during
the ambient sampling and was continuously held at the same temperature for one minute to purge
residual air from the CTD with a helium flow of 20 ml/min at the conclusion of ambient
sampling. Following the purge, the thermal desorption of collected organics were carried out in a
helium flow by heating the CTD from 28°C to 300°C at a rate of ~30°C/min and held at 300°C
for nine minutes followed by thermal injection into a gas chromatograph. The chromatographic
separation of organic species was achieved by a capillary GC column (Rxi-5Sil MS; 30 m length,
0.25 mm i.d., 0.25 m film thickness, Restek). The GC oven temperature was held at 45°C for
18 minutes for the sample injection from the CTD to GC followed, in order, by: 1) a ramp to
150°C at 15°C/min; 2) a ramp from 150°C to 330°C at 9°C/min and 3) a hold at 330°C for 4
minutes. Identification and quantification was achieved using a quadrupole mass spectrometer
(Agilent, 5973) calibrated based on responses to authentic standards that were manually injected
into the CTD at regular time intervals throughout the campaign (Kreisberg et al., 2009).
The gas collection efficiency of the denuder was determined in the beginning, middle and
end of the campaign by the difference of the amount of gas-phase organics downstream of the
denuder line and the bypass line with a Teflon coated fiber filter placed upstream of the cyclone
to remove particles. Particle penetration through the denuder was determined using an optical
particle spectrometer (Droplet Measurements, model UHSAS) to measure the number size
distributions of ambient particles at both the inlet and outlet of this denuder before this campaign.

12
A broad suite of complementary measurements were concurrently made at this site,
including a full range of meteorological, trace gas and aerosol measurements. The measurements
utilized in this study included non-refractory PM1.0 inorganic and organic aerosol components,
carboxylic acid group, gas-phase ammonia and meteorological data. Non-refractory PM1.0
aerosol components were measured by an Aerodyne high-resolution time-of-flight Aerosol Mass
Spectrometer (HR-ToF-AMS) using the methods described in Liu et al. (2012). PM1.0 was also
collected by Teflon filters for measurements of the organic acid group (-COOH) by Fourier
transform infrared (FTIR) spectroscopy (Liu et al., 2012). Gas-phase ammonia was measured
using an Ambient Ion Monitor/Ion Chromatograph (AIM-IC) (Markovic et al., 2012)..
2.3.2 Particle-phase fraction calculations
Because the particle-phase and total organics were not collected simultaneously,
measured fraction of a given compound in the particle phase ( fpart) in sample n is calculated
using the particle-phase concentration(Cpart,n) divided by the average of the previous and
subsequent total concentrations (Ctotal,n-1,, Ctotal,n+1 ):
1,1,
,2
ntotalntotal
npart
partCC
Cf (2.1)
The gas/particle partitioning coefficient (kom) for absorptive uptake into organic aerosol is
calculated by the equation described by Pankow (1994):
MWP
RTk
L
om0610
(2.2)
where R is ideal gas constant (8.2×10⁻⁵
m-3
atm mol-1
K-1
), T is temperature (K), PL0
is the vapor
pressure of the pure compound (atm) at the temperature of interest, δ is the activity coefficient of
the compound in the absorbing phase, and MW is the average molecular weight (g mol-1
) of the
absorbing phase. The particle-phase fraction based on partitioning theory (fpart,T) was calculated
from the partitioning coefficient constant (kom) and the mass concentration of organic aerosols in
µg m-3
(COA):
1
OAom
part,TC
11
kf (2.3)
The data collected by other instruments were averaged to match TAG sampling duration
of 30 or 90 minutes. The average OA concentration (COA) from HR-ToF-AMS measurements
was 3.7 ± 1.8 µg m-3
(0.5 - 11.2 µg m-3
). Average temperature was 26 ± 6 °C (12 - 40°C). In our
study, the theoretical fractions of organic species in the particle phase were calculated using the
measured average temperature and average OA concentration (T =26°C, COA=3.7 µg m-3
) and
both molecular weight (MW = 200 g mole-1
) and activity coefficient (= 0.3 and 3) from literature
(Pankow, 1994; Seinfeld and Pankow, 2003). Subcooled vapor pressures used in this study were
from The Estimation Programs Interface (EPI) Suite developed by the US Environmental
Protection Agency's Office of Pollution Prevention and Toxics and Syracuse Research
Corporation (SRC).

13
2.4 Results and discussions More than 150 compounds were measured by TAG, covering a broad vapor pressure
range and different functional groups (Figure 2.1). Most identified compounds were present in
the vapor pressure range of S/IVOCs defined by Robinson et al., (2007). The gas/particle
partitioning of three oxygenated compounds, pinonaldehyde, phthalic acid and 6, 10, 14-
trimethyl-2-pentadecanone, are discussed in detail to explore SOA formation in the ambient
atmosphere. Pinonaldehyde is a major product of α-pinene ozonolysis with gaseous yields of
pinonaldehyde being 0.39-0.69 (Liggio and Li, 2006). Phthalic acid and 6, 10, 14-trimethyl-2-
pentadecanoneand have been used as SOA tracers in both chemical mass balance and positive
matrix factorization model calculations (Zheng et al., 2002; Shrivastava et al., 2007; Williams et
al., 2010a).
Although fpart of the compounds of interest were overestimated because gas-phase
organics were only partially collected by the collection cell used in this study which was
designed for collecting particle-phase organics, the extent of overestimation can be indicated by
fpart of n-alkanes. Firstly, the efficient gas/particle separation made by the denuder limits the
source of the overestimation to the collection cell. Average collection efficiencies of the denuder
for pinonaldehyde, phthalic acid and 6, 10, 14-trimethyl-2-pentadecanone were over 98%.
Average losses of the particle number inside the denuder were less than 10% for particle sizes
spanning the particle spectrometer’s range (0.05~1 μm) and the performance of this denuder was
stable over one month ambient measurements (see Appendix A, Figures A1 and A2). Secondly,
the gas/particle partitioning of n-alkanes can be well described by the gas/particle absorption
partitioning theory (Fraser et al., 1997) and n-alkanes have the lower or same adsorption
coefficient constants on the surface of sampling substrates, relative to other compounds with the
same vapor pressure (Goss and Schawarzenbach, 1998). As a result, measured particle-phase
fractions of n-alkanes, the sum of absorptive gas/particle partitioning and overestimation caused
by incomplete collection of their vapors, are the upper limit of the overestimation of TAG
measurements in the vapor pressure range of these n-alkanes.
The reference compounds selected based on the similar subcooled vapor pressure for
pinonaldehyde, phthalic acid and 6, 10, 14-trimethyl-2-pentadecanone are n-tetradecane, n-
heptadecane and n-nonadecane, respectively (Figure 2.2). If measured particle-phase fractions of
oxygenated organics are far larger than those of their reference compounds, as is the case for
phthalic acid and pinonaldehyde, additional SOA formation pathways must occur, beyond
absorptive gas/particle partitioning and overestimation due to under collection of gas-phase
organics.
2.4.1 Pinonaldehyde
The mean fpart of pinonaldehyde was 20 ± 20%, much higher than its reference compound
of n-tetradecane (Figure 2.2). The fraction of pinonaldehyde in the particle phase was observed
to increase as RH increased (Figure 2.3A), but the fraction contributed by its partitioning into
aerosol water is negligible even if a ratio of aerosol water to dry aerosol mass equal to one is
assumed and all of the aerosol water is available to take up pinonaldehyde. Moreover, this
assumed ratio of the water content to dry mass is inconsistent with the average RH of 34%

14
during TAG measurements because a ratio of generally less than 0.3 is expected at this average
RH (Khlystov et al., 2005; Schuster et al., 2009; Engelhart et al., 2011). The particle-phase
pinonaldehyde reported here is with negligible sampling artifacts due to adsorption of gas-phase
pinonaldehyde to the collection cell because the denuder efficiently removed organic vapors.
Therefore, our observations of particle-phase pinonaldehyde clearly show that gas-phase
pinonaldehyde had been converted into forms with the lower vapor pressures prior to the
collection.
Low-volatility compounds (e.g. oligomers) formed from monomers with direct
involvement of pinonaldehyde have been observed in chamber experiments (Tolocka et al., 2004;
Liggo and Li, 2006; Tillman et al., 2010) and ambient samples (Tolocka et al., 2004). In our
study, low-volatility compounds were measured as a pinonaldehyde monomer, consistent with
previous TAG measurements in a forest area (Worton et al., 2011). The reason may be attributed
to the use of the thermal desorption method which could decompose low-volatility compounds
into their original monomers (Jang et al., 2002). These low-volatility compounds were not
directly measured in our study, but the variability in the concentrations of measured
pinonaldehyde can still be useful to investigate factors affecting the formation of low-volatility
compounds. In the following discussion, the term of particle-phase pinonaldehyde is taken to
include all low-volatility compounds formed with direct involvement of pinonaldehyde. The
cation-to-anion ratio, calculated using molar concentrations of ammonium and anions (=
2×[sulfate] + [nitrate]) measured by HR-ToF-AMS, is used as an indicator of availability of
acids in our study. The presence of excess ammonium is indicated when the cation-to-anion
ration is greater than one and the presence of excess acids is indicated when the ratio is less than
one.
Particle-phase pinonaldehyde was observed while the cation-to-anion ratio calculated
using ammonium, sulfate and nitrate was greater than one, indicating that the presence of
inorganic acids were not necessary for the formation of particle-phase pinonaldehyde (Figure
2.4). Since FTIR measures carboxylic acids as an acid group (-COOH) (Russell et al., 2009),
excess organic acids, which were not neutralized, were present in particles (Figure 2.4). Our
observations of particle-phase pinonaldehyde and availability of acids demonstrate the
observations of chamber experiments of α-pinene ozonolysis which show that oligomers are
formed on the neutralized ammonium sulfate particles (Gao et al., 2004; Tolocka et al., 2004)
and organic acids produced from gas-phase hydrocarbon oxidation are sufficient to catalyze
these heterogeneous reactions (Gao et al., 2004).
Laboratory studies have shown that high aerosol acidity leads to the high yield of
oligomers from pinonaldehyde (Liggio and Li, 2006) and the oxidation products of α-pinene
(Gao et al., 2004; Tolock et al., 2004). However, the laboratory observed trend was not displayed
by the relationship between fpart of pinonaldehyde and organic acids measured by FTIR (Figure
2.4). The reason could be that the contribution of organic acids to the aerosol acidity cannot be
directly indicated by the cation-to-anion ratio because different organic acids have different
dissociation constants and organic acids and their conjugate base can serve as a buffer solution.
The cation-to-anion ratio of inorganic ions shows a general trend that the high cation-to-anion
ratio was along with the low fpart of pinonaldehyde (Figure 2.4), but the acidity estimated based
on the cation-to-anion ratio would have a large uncertainties when the cation-to-anion ratio is

15
near one (Xue et al., 2011). Moreover, this trend was not followed when other factors affecting
the relationship between aerosol acidity and fpart of pinonaldehyde were considered, such as RH
(Figure 2.3B) which can change the composition and mass of SOA (Nguyen et al., 2011) and the
aerosol acidity (Liggio and Li, 2006). As shown in Figure 2.3A, fpart of pinonaldehyde exhibited
a positive dependence on RH in Sampling Period I, consistent with previous TAG measurements
in a forested area (Worton et al., 2011). However, the cation-to-anion ratio calculated from
inorganic ions did not consistently decrease as RH increased (Figure 2.3B). As a result, the effect
of the aerosol acidity on fpart of pinonaldehyde is not shown by the relationship between the
cation-to-anion ratio and fpart of pinonaldehyde.
In comparison with Sampling Period I, fpart of pinonaldehyde was generally lower in
Sampling Period II and showed a different dependence on RH (Figures 2.3A and 2.4) while this
pattern was not observed for its reference compound, n-tetradecane. The difference in
relationships between fpart and RH observed during these two sampling periods is also supported
by another independent measurement of the cation-to-anion ratio which was different in two
sampling periods (Figures 2.3B and 2.4). Therefore, the observed relationship between fpart of
pinonaldehyde and RH represents the real relationship between them in the atmosphere.
The enhancement in fpart of pinonaldehyde at the high RH was not observed in Sampling
Period II, although the particle-phase concentration of pinonaldehyde was observed to increase
as RH increased. The relationships between RH and fpart of pinonaldehyde suggest that RH favors
the formation of particle-phase pinonaldehyde in the atmosphere, but it isn't the primary factor
affecting the yields of particle-phase pinonaldehyde. Further studies are needed to examine the
effect of RH on the yield of particle-phase pinonaldehyde in the atmosphere and laboratory.
2.4.2 Phthalic acid
The mean fpart of phthalic acid was 60 ± 20%, substantially higher than that of its
reference compound, n-nonadecane (Figure 2.2). To reproduce the mean fpart for phthalic acid
using gas/particle partitioning theory, a significantly lower activity coefficient (~5×10⁻³
) than the
estimated range from 0.3 to 3 for SOA in the atmosphere (Seinfeld and Pankow, 2003) would be
needed. The partitioning of phthalic acid into aerosol water cannot explain the mean fpart for
phthalic acid based on its Henry's law constant of 2.0×10⁻¹¹
atm m-3
mol-1
(USEPA EPI suite)
and the assumption that the ratio of aerosol water content to the dry aerosol mass is one and all
aerosol water is available to take up phthalic acid. The dissociation of phthalic acid was also
considered, but the contribution due to its dissociation to its mean fpart was negligible even when
pH was estimated by neutralized inorganic ions without inclusion of other organic acids.
Moreover, the aerosol water content is unlikely to be that high at the average RH of 34% in the
atmosphere (Khlystov et al., 2005; Schuster et al., 2009; Engelhart et al., 2011). Therefore, there
must be an additional partitioning mechanism whereby particle-phase phthalic acid is formed.
We infer that a likely pathway for phthalic acid partitioning to particles is through its
reaction with ammonia. This is supported by the presence of excess ammonium in the particle
phase indicated by the cation-to-anion ratio of inorganic species measured by HR-ToF-AMS
(Figure 2.4). Evidence for reactions between organic acids and gas-phase ammonia is provided
by Na et al. (2007), who observed that ammonia could dramatically increase SOA yields by
reactions with organic acids in chamber experiments. Furthermore, the positive correlation

16
between gas-phase ammonia and fpart of phthalic acid (linear regression R2=0.8 between average
fpart and the ammonia concentration) supports the hypothesis that phthalic acid partitioning to
particles is through reactions with gas-phase ammonia (Figure 2.5).
Reactions with ammonia can convert phthalic acid into ammonium salts with the low
vapor pressures and subsequently favor its partitioning into particles. Subcooled vapor pressures
of the formed salts can be more than 100 times lower than that of phthalic acid, even if just
monoammonium salt was formed (order of magnitude of the subcooled vapor pressure drop is
estimated using the vapor pressure drop of organic acids after forming ammonium salt from
USEPA EPI suite). Additional support needed for the presence of phthalic acid ammonium salts
is that these salts can be measured as phthalic acid by the TAG using a thermal desorption
technique to extract collected organics. This support is given in Hajek et al. (1971) wherein the
investigation of the thermal decomposition of ammonium salt of isophthalic acid shows that
simultaneous release of both ammonia and isophthalic acid molecules from diammonium salts
occurs without dehydration or amide formation.
2.4.3 6, 10, 14-trimethyl-2-pentadecanone
The mean fpart of 6, 10, 14-trimethylpentadecanone was 4 ± 2 %, similar to that of its
reference compound, n-heptadecane, suggesting that there is no reactive uptake of it on particles
during the campaign contrary to the observations of pinonaldehyde and phthalic acid. These
results are in agreement with previous studies on the gas/particle partitioning of ketones (Esteve
and Noziere, 2005; Kroll et al., 2005). Esteve and Noziere (2005) suggested that aldol
condensation was too slow to contribute significantly to SOA under atmospheric conditions.
Kroll et al. (2005) showed that ketones did not produce observable volume growth in the
presence of acidic seeds even with concentrations of over 500 ppb. Other measured compounds
with a ketone functional group in this study, such as benzophenone and 1-hydroxycyclohexy-
phenyl methanone, were also present primarily in the gas phase.
2.5 Conclusions and atmospheric implications Measurements of organic compounds in both gas and particle phases improves our
understanding of SOA formation mechanisms in the atmosphere. Ketones observed in our study
were present predominantly in the gas phase, suggesting that observed reactive uptake to
aerosols does not occur and absorption into aerosols is the dominant pathway for them to
contribute to SOA in the atmosphere. While absorption of gas-phase phthalic acid into the
particles can contribute to observed concentrations of particle-phase phthalic acid, the major
pathway to form particle-phase phthalic acid is likely attributed to reactions with gas-phase
ammonia. This mechanism is expected to cause high O/C ratios in ammonia enriched areas
because reactions with ammonia favor the uptake of carboxylic acids on particles. Therefore, the
formation of condensable salts can be a significant area of uncertainty for SOA formation in
ammonia enriched areas. Pinonaldehyde contributes to SOA through reactive uptake.
Observations of particle-phase pinonaldehyde when inorganic acids were neutralized show that
inorganic acids are not required for occurrence of reactive uptake of pinonaldehyde beyond that
predicted by the gas/particle partitioning theory. The effect of aerosol acidity on the partitioning
of pinonaldehyde into particles observed in laboratory studies is not displayed by our
observations using the relationship between the cation-to-anion ratio and the fraction of
17
pinonaldehyde in particles. The relationship between particle-phase pinonaldehyde and RH
suggests that aerosol water content likely plays a significant role in the formation and
accumulation of particle-phase pinonaldehyde in the absence of inorganic acids, but it is not the
primary one. Our observations highlight that further studies are needed to examine the effects of
RH and organic acids on the reactive uptake of pinonaldehyde and other aldehydes on neutral
seed particles.
In-situ measurements of both gas- and particle-phase organic compounds in the
atmosphere have clearly shown that multiple gas/particle partitioning pathways are present in the
atmosphere and other gas/particle partitioning pathways significantly improve the SOA yields,
relative to absorptive gas/particle partitioning. Observations of particle-phase pinonaldehyde
show that inorganic acids are not required for the occurrence of reactive uptake of pinonaldehyde
into particles and subsequently suggest that this pathway is likely widespread. However, the
gas/particle partitioning of phthalic acid favored by formation of condensable salts indicates that
this pathway could be only significant in ammonia-rich environments. Therefore, further in-situ,
time-resolved measurements of gas/particle partitioning covering more oxygenated organic
compounds are needed to investigate SOA formation in different areas and provide
parameterization for inclusion of these pathways in SOA models. Additionally, since our results
show that each of three SOA tracers investigated here has distinct pathways to partition to
particles, multiple tracers are needed in source apportionment models to adequately represent
SOA formation. However, these tracers are present in both gas and particle phases. As a result, it
raises a concern about the accuracy of the source apportionment models using these SOA tracers
without correcting gas adsorption on the sampling substrates.
2.6 References Engelhart, G. J., Hildebrandt, L., Kostenidou, E., Mihalopoulos, N., Donahue, N. M. and Pandis,
S. N. (2011). Water content of aged aerosol. Atmos. Chem. Phys., 11:911-920.
Esteve, W. and Noziere, B. (2005). Uptake and reaction kinetics of acetone, 2-butanone, 2,4-
pentanedione, and acetaldehyde in sulfuric acid solutions. J. Phys. Chem., A, 109:10920-
10928.
Fraser, M. P., Cass, G. R., Simoneit, B. R. T. and Rasmussen, R. A. (1997). Air quality model
evaluation data for organics .4. C-2-C-36 non-aromatic hydrocarbons. Environ. Sci. Technol.,
31:2356-2367.
Gao, S., Ng, N. L., Keywood, M., Varutbangkul, V., Bahreini, R., Nenes, A., He, J. W., Yoo, K.
Y., Beauchamp, J. L., Hodyss, R. P., Flagan, R. C. and Seinfeld, J. H. (2004). Particle phase
acidity and oligomer formation in secondary organic aerosol. Environ. Sci. Technol., 38:6582-
6589.
Goldstein, A. H. and Galbally, I. E. (2007). Known and unexplored organic constituents in the
earth's atmosphere. Environ. Sci. Technol., 41:1514-1521.
Goss, K. U. and Schwarzenbach, R. P. (1998). Gas/solid and gas/liquid partitioning of organic
compounds: Critical evaluation of the interpretation of equilibrium constants. Environ. Sci.
Technol., 32:2025-2032.
Hajek, M., Malek, J. and Bazant, V. (1971). Kinetics of Thermal Decomposition of Ammonium
Salts of Terephthalic and Isophthalic Acids. Collect Czech Chem C 36:84-&.

18
Heald, C. L., Jacob, D. J., Park, R. J., Russell, L. M., Huebert, B. J., Seinfeld, J. H., Liao, H. and
Weber, R. J. (2005). A large organic aerosol source in the free troposphere missing from
current models. Geophys. Res. Lett., 32, L18809.
Heald, C. L., Ridley, D. A., Kreidenweis, S. M. and Drury, E. E. (2010). Satellite observations
cap the atmospheric organic aerosol budget. Geophys. Res. Lett., 37.
Iinuma, Y., Boge, O., Miao, Y., Sierau, B., Gnauk, T. and Herrmann, H. (2005). Laboratory
studies on secondary organic aerosol formation from terpenes. Faraday Discuss., 130:279-
294.
Jang, M. S., Czoschke, N. M., Lee, S. and Kamens, R. M. (2002). Heterogeneous atmospheric
aerosol production by acid-catalyzed particle-phase reactions. Science, 298:814-817.
Kanakidou, M., Seinfeld, J. H., Pandis, S. N., Barnes, I., Dentener, F. J., Facchini, M. C., Van
Dingenen, R., Ervens, B., Nenes, A., Nielsen, C. J., Swietlicki, E., Putaud, J. P., Balkanski, Y.,
Fuzzi, S., Horth, J., Moortgat, G. K., Winterhalter, R., Myhre, C. E. L., Tsigaridis, K., Vignati,
E., Stephanou, E. G. and Wilson, J. (2005). Organic aerosol and global climate modelling: a
review. Atmos. Chem. Phys., 5:1053-1123.
Khlystov, A., Stanier, C. O., Takahama, S. and Pandis, S. N. (2005). Water content of ambient
aerosol during the Pittsburgh air quality study. J. Geophys. Res.-Atmos., 110.
Kreisberg, N. M., Hering, S. V., Williams, B. J., Worton, D. R. and Goldstein, A. H. (2009).
Quantification of Hourly Speciated Organic Compounds in Atmospheric Aerosols, Measured
by an In-Situ Thermal Desorption Aerosol Gas Chromatograph (TAG). Aerosol Sci. Tech.,
43:38-52.
Kroll, J. H., Ng, N. L., Murphy, S. M., V, V., Flagan, R. C. and Seinfeld, J. H. (2005). Chamber
studies of secondary organic aerosol growth by reactive uptake of simple carbonyl
compounds. J. Geophys. Res.-Atmos., 110.
Kroll, J. H. and Seinfeld, J. H. (2008). Chemistry of secondary organic aerosol: Formation and
evolution of low-volatility organics in the atmosphere. Atmos. Environ., 42:3593-3624.
Liggio, J. and Li, S. M. (2006). Reactive uptake of pinonaldehyde on acidic aerosols. J. Geophys.
Res.-Atmos., 111.
Liu et al. (2012), Secondary organic aerosol formation from fossil fuel sources contribute
majority of summertime organic mass at Bakersfield, J. Geophys. Res.-Atmos., in press.
Markovic, M. Z., VandenBoer, T. C. and Murphy, J. G. (2012). Characterization and
optimization of an online system for the simultaneous measurement of atmospheric water-
soluble constituents in the gas and particle phases. J. Environ. Monitor., 14:1872-1884.
Na, K., Song, C., Switzer, C. and Cocker, D. R. (2007). Effect of ammonia on secondary organic
aerosol formation from alpha-Pinene ozonolysis in dry and humid conditions. Environ. Sci.
Technol., 41:6096-6102.
Nguyen, T. B., Roach, P. J., Laskin, J., Laskin, A. and Nizkorodov, S. A. (2011). Effect of
humidity on the composition of isoprene photooxidation secondary organic aerosol. Atmos.
Chem. Phys., 11:6931-6944.
Pankow, J. F. (1994). An Absorption-Model of Gas-Particle Partitioning of Organic-Compounds
in the Atmosphere. Atmos. Environ., 28:185-188.
Robinson, A. L., Donahue, N. M., Shrivastava, M. K., Weitkamp, E. A., Sage, A. M., Grieshop,
A. P., Lane, T. E., Pierce, J. R. and Pandis, S. N. (2007). Rethinking organic aerosols:
Semivolatile emissions and photochemical aging. Science, 315:1259-1262.

19
Russell, L. M., Bahadur, R., Hawkins, L. N., Allan, J., Baumgardner, D., Quinn, P. K. and Bates,
T. S. (2009). Organic aerosol characterization by complementary measurements of chemical
bonds and molecular fragments. Atmos. Environ., 43:6100-6105.
Schuster, G. L., Lin, B. and Dubovik, O. (2009). Remote sensing of aerosol water uptake.
Geophys Res Lett 36.
Seinfeld, J. H. and Pankow, J. F. (2003). Organic atmospheric particulate material. Annu. Rev.
Phys. Chem., 54:121-140.
Shrivastava, M. K., Subramanian, R., Rogge, W. F. and Robinson, A. L. (2007). Sources of
organic aerosol: Positive matrix factorization of molecular marker data and comparison of
results from different source apportionment models. Atmos. Environ., 41:9353-9369.
Spracklen, D. V., Jimenez, J. L., Carslaw, K. S., Worsnop, D. R., Evans, M. J., Mann, G. W.,
Zhang, Q., Canagaratna, M. R., Allan, J., Coe, H., McFiggans, G., Rap, A. and Forster, P.
(2011). Aerosol mass spectrometer constraint on the global secondary organic aerosol budget.
Atmos. Chem. Phys., 11:12109-12136.
Tillmann, R., Hallquist, M., Jonsson, A. M., Kiendler-Scharr, A., Saathoff, H., Iinuma, Y. and
Mentel, T. F. (2010). Influence of relative humidity and temperature on the production of
pinonaldehyde and OH radicals from the ozonolysis of alpha-pinene. Atmos. Chem. Phys.,
10:7057-7072.
Tolocka, M. P., Jang, M., Ginter, J. M., Cox, F. J., Kamens, R. M. and Johnston, M. V. (2004).
Formation of oligomers in secondary organic aerosol. Environ. Sci. Technol., 38:1428-1434.
Turpin, B. J., Saxena, P. and Andrews, E. (2000). Measuring and simulating particulate organics
in the atmosphere: problems and prospects. Atmos. Environ., 34:2983-3013.
US EPA; Estimation Program Interface (EPI) Suite. Version v4.10.
http://www.epa.gov/oppt/exposure/pubs/episuitedl.htm
Volkamer, R., Jimenez, J. L., San Martini, F., Dzepina, K., Zhang, Q., Salcedo, D., Molina, L. T.,
Worsnop, D. R. and Molina, M. J. (2006). Secondary organic aerosol formation from
anthropogenic air pollution: Rapid and higher than expected. Geophys. Res. Lett., 33.
Williams, B.J., Goldstein, A.H., Kreisberg, N.M. and Hering, S.V. (2006). An In-Situ Instrument
for Speciated Organic Composition of Atmospheric Aerosols: Thermal Desorption Aerosol
GC/MS-FID (TAG). Aerosol Sci. Tech., 40, 627–638.
Williams, B. J., Goldstein, A. H., Kreisberg, N. M. and Hering, S. V. (2010a). In situ
measurements of gas/particle-phase transitions for atmospheric semivolatile organic
compounds. P. Natl. Acad. Sci. USA, 107:6676-6681.
Williams, B. J., Goldstein, A. H., Kreisberg, N. M., Hering, S. V., Worsnop, D. R., Ulbrich, I. M.,
Docherty, K. S. and Jimenez, J. L. (2010b). Major components of atmospheric organic aerosol
in southern California as determined by hourly measurements of source marker compounds.
Atmos. Chem. Phys., 10:11577-11603.
Worton, D. R., Goldstein, A. H., Farmer, D. K., Docherty, K. S., Jimenez, J. L., Gilman, J. B.,
Kuster, W. C., de Gouw, J., Williams, B. J., Kreisberg, N. M., Hering, S. V., Bench, G.,
McKay, M., Kristensen, K., Glasius, M., Surratt, J. D. and Seinfeld, J. H. (2011). Origins and
composition of fine atmospheric carbonaceous aerosol in the Sierra Nevada Mountains,
California. Atmos. Chem. Phys., 11:10219-10241.
Xue, J., Lau, A. K. H. and Yu, J. Z. (2011). A study of acidity on PM2.5 in Hong Kong using
online ionic chemical composition measurements. Atmos. Environ., 45:7081-7088.

20
Zhang, Q., Jimenez, J. L., Worsnop, D. R. and Canagaratna, M. (2007). A case study of urban
particle acidity and its influence on secondary organic aerosol. Environ. Sci. Technol.,
41:3213-3219.
Zheng, M., Cass, G. R., Schauer, J. J. and Edgerton, E. S. (2002). Source apportionment of
PM2.5 in the southeastern United States using solvent-extractable organic compounds as
tracers. Environ. Sci. Technol., 36:2361-2371.

21
2.7 Tables and figures
Figure 2.1 O/C ratios of organic compounds measured by TAG as a function of subcooled vapor
pressure at 25ºC. The compounds of interest are colored in red.

22
Figure 2.2 Average measured fractions for oxygenated SVOCs (solid markers) and their
corresponding reference compounds (empty markers) are shown as markers. Error bars are one
standard deviation. The solid and dashed lines are the predicted fractions of organic compounds
in the particle phase based on the gas/particle partitioning equation.

23
Figure 2.3 A) Measured fraction of pinonaldehyde in the particle phase as a function of RH
(average 5 or 6 points in each bin in Sampling Period I; 12 points in each bin in Sampling Period
II). Error bars are one standard deviation. The X-axis values are the average value of RH in each
bin. Fractions larger than 3 standard deviations outside of the mean in each sampling period are
considered outliers and excluded in this plot. B) The average cation-to-anion ratio of inorganic
species (sulfate, nitrate and ammonium) as a function of RH (average 7 points in each bin in
Sampling Period I; 27 points in each bin in Sampling Period II).

24
Figure 2.4 The temporal change of the cation-to-anion ratio of measured inorganic ions,
carboxylic acid group and the fraction of pinonaldehyde in the particle phase.

25
Figure 2.5 Fraction of phthalic acid in the particle phase as a function of the concentration of
gas-phase ammonia. Each bin of seven bins has 18 data points.

26
Chapter 3
Sources of organic aerosol investigated using organic compounds as tracers
measured during CalNex Bakersfield
3.1 Abstract To investigate the major sources of organic aerosol (OA) and provide insights into
secondary organic aerosol (SOA) formation, positive matrix factorization (PMF) analysis was
performed on a large set of organic species measured by in-situ Thermal desorption Aerosol Gas
chromatography-mass spectrometry (TAG) during the California at the Nexus of Air Quality and
Climate Change (CalNex) campaign in Bakersfield, CA from May 31st through June 27th, 2010.
Six OA source factors were identified, including one representing primary organic aerosol
(POA), four different types of secondary organic aerosol (SOA) representing local, regional, and
nighttime production, and one representing a complex mixture of additional OA sources that
were not further resolvable. The average POA contribution to total OA was 15% throughout the
campaign with a diurnal range from 10% during the day to 19% at night and motor vehicles are
suggested to be a significant contributor. The contribution of the four distinct types of SOA to
total OA averaged 72% throughout the campaign and varied diurnally from 78% during the day
to 66% at night. The complex mixture of additional OA sources in the final factor contributed an
average of 14% to total OA. Both regional and local SOA were significant OA sources, but
regional SOA had a larger contribution to total OA than local SOA during the day. Biogenic
VOC oxidation products contributed a significant fraction of total OA at night. We conclude that
SOA was formed through multiple pathways that peak at different times of day, with the largest
SOA contribution occurring through condensation of gas-phase oxidation products onto particles.
Effective control measures to reduce OA in Bakersfield should focus on reducing sources of
VOCs that serve as precursors to SOA during the day, and we conclude that the major source of
SOA is regional.
3.2 Introduction Organic compounds constitute a major mass fraction (20-90%) of atmospheric fine
particulate matter in most environments (Kanakidou et al., 2005). These organic compounds
have been categorized into either primary organic aerosol (POA), directly emitted from various
primary sources such as food cooking and vehicle exhausts (e.g. Schauer et al. 1999a, b, 2002a),
or secondary organic aerosol (SOA), formed in the atmosphere through chemical reactions
(Odum et al., 1997; Jang et al., 2002; Robinson et al., 2007; Kroll and Seinfeld, 2008). The
majority of organic aerosol (OA) in rural and urban areas is secondary (Zhang et al., 2007;
Shrivastava et al., 2007; Williams et al., 2010; Jimenez et al., 2009). SOA and POA have been
shown to have different adverse human health effects (Li et al., 2009), so quantifying source
contributions to OA has important implications for air quality regulation.
Source apportionment between POA and SOA has generally been done in one of three
ways; (i) bulk organic spectra measured by the Aerodyne Aerosol Mass Spectrometer (e.g.
Jimenez et al., 2009; Zhang et al., 2011), (ii) thermal-optical elemental carbon/organic carbon
analyzer (e.g. Turpin et al., 1991; Strader et al., 1999) and (iii) molecular speciation measured by

27
gas chromatograph/mass spectrometer (GC/MS) (e.g. Shrivastava et al., 2007; Williams et al.,
2010). In comparison with bulk organic analysis, the molecular speciation resolves a smaller
fraction of OA, but the identified organic compounds can serve as tracers for specific source
types (Schauer et al., 1996; Schauer and Cass, 2000) and provide information for understanding
SOA formation and transformation in the atmosphere (e.g. Kleindienst et al., 2007; Williams et
al., 2010). Two common source apportionment methods using organic compounds are the
chemical mass balance (CMB) and positive matrix factorization (PMF) models (e.g. Schauer et
al., 1996; Shrivastava et al., 2007; Williams et al., 2010).
The CMB model uses organic compounds to estimate OA contributions from a variety of
sources, such as biomass burning, meat cooking, or diesel vehicle emissions, but requires a
priori knowledge of their source profiles as inputs to solve the model (Schauer et al., 1996;
Schauer and Cass, 2000; Zheng et al., 2002). As a result, CMB analysis is sensitive to the
provided source profiles (Robinson et al., 2006; Subramanian et al., 2007). The products and
SOA yields measured for a few known volatile organic compounds (VOCs) oxidized in chamber
experiments have been considered as source profiles of SOA (Kleindienst et al., 2007; Stone et
al., 2009). However, the relevance of these source profiles is limited to these known compounds
and the specific experimental conditions used in the chamber to derive the profiles. Source
profiles for SOA are difficult to establish due to the complexity of oxidation processes and the
wide range of precursors and atmospheric conditions, so CMB models have typically been
unable to provide adequate constraints on the SOA mass or composition. Though SOA mass can
be estimated by CMB models as the difference between apportioned OA and measured OA, they
do not provide detailed information about SOA sources (Schauer et al., 1996; Zheng et al., 2002;
Subramanian et al., 2007).
The PMF model uses covariation between organic compounds to categorize them into
unique groups or factors that could represent emissions from contemporaneous source or
formation processes (Shrivastava et al., 2007; Zhang et al., 2009; Williams et al., 2010). Since a
priori knowledge of source profiles is not required as inputs, factors likely representing poorly
constrained or unknown sources, such as SOA, can be determined. Characterization of these
factors based on their compositions and temporal variations therefore provide an effective tool
for differentiating complex sources (Shrivastava et al., 2007; Zhang et al., 2009; Williams et al.,
2010). Past work has demonstrated the ability of this method to separate multiple SOA types
with distinct diurnal patterns in the absence of known source profiles (Williams et al., 2010).
Despite its utility for source apportionment, PMF analysis is not widely performed on organic
compounds in the particle phase because it typically requires a larger number of samples which
poses significant challenges when measurements of speciated OA are mainly made by filter
sampling with 24-hour collection periods in the field followed by solvent extraction in the
laboratory for analysis (Jaeckels et al., 2007; Shrivastava et al., 2007). Recently, speciated
measurements of OA have been facilitated by the development of an in-situ Thermal desorption
Aerosol Gas chromatography instrument (TAG) which provides hourly time resolved chemical
speciation of OA (Williams et al., 2006). As a result of the hourly time resolution, TAG provides
as many data points in a few weeks of measurements as solvent extracted filters are able to in a
year, thus enabling multivariate statistical analyses. TAG data has been analyzed by PMF in
previous work to resolve nine different types of OA in an urban environment, including various
SOA and POA sources (Williams et al., 2010).

28
In this work, we focus on data from a field site in Bakersfield, CA, one of two supersites
of the CALifornia at the NEXus between Air Quality and Climate Change (CalNex) campaign in
June 2010. Before the CalNex campaign. Previous studies of source contributions to OA in the
Bakersfield area were based on the EC-tracer method and CMB and focused on OA in winter
(Magliano et al., 1999; Strader et al., 1999; Schauer et al., 2000). Neither the EC-tracer method
nor CMB was able to provide insights into different SOA types. Recently, new results of studies
of major OA components and SOA formation in Bakersfield areas during the CalNex campaign
have been reported. Liu et al. (2012) has shown that SOA was the dominant component of OA in
the Bakersfield site, accounting for 80~90% of OA, and the majority of SOA was likely formed
through gas-to-particle condensation of daytime oxidation products of volatile organic
compounds (VOCs). Rollins et al. (2012) reported that organic nitrate aerosol accounted for 1/3
of nighttime increase of OA and suggested that reductions in NOx emissions can reduce OA
concentrations. In this study, we take a different approach to investigate source contributions to
OA and atmospheric processes to form SOA using organic tracers, instead of bulk organic mass
spectra (Liu et al. 2012) and organic nitrates (Rollins et al. 2012). These organic tracers bear
specific information for OA sources and SOA formation pathways. For example, Zhao et al.
(2012) has shown that multiple gas-to-particle partitioning pathways contributed to SOA
formation in Bakersfield areas by examining the measured gas/particle partitioning of known
SOA tracers. By performing PMF analysis on these organic tracers, including primary and
secondary tracers measured by the TAG in Bakersfield, CA, distinct factors can be determined,
which are associated with specific source types and atmospheric processes in the context of an
urban area and the agricultural, natural, and industrial sources present in the region. The effective
control strategy to reduce OA concentrations are suggested based on our investigation of source
contributions to OA and formation pathways of SOA.
3.3 Methods 3.3.1 Sampling and chemical analysis
Speciated measurements of particle-phase organics were made with the TAG instrument
during the CalNex field campaign from May 31st to June 27th 2010 at the Bakersfield supersite,
CA. A description of the TAG is provided by Williams et al. (2006), and details on updates and
operation of the TAG used in this work are provided in Chapter 2. Briefly, the TAG was updated
by addition of a denuder into the sampling inlet so that there were two parallel sampling lines,
one denuder line and one bypass (no denuder) line made of stainless steel tubing. During
sampling, ambient air was pulled at 10 L/min through a PM2.5 cyclone from the center of a main
sampling flow of 200 L/min drawn from ~5 meters above the ground through a 6-inch (i.d.) rigid
duct and gas- and particle-phase organics were collected by an impactor. The sampling flow was
alternated between the denuder line to collect only particle-phase organics, and the bypass line to
collect total organics, the sum of gas- and particle-phase organics. Following sampling, the
collected organics were thermally desorbed and injected into a gas chromatograph-mass
spectrometer (GC/MS) for analysis. Identification and quantification were achieved using a
quadrupole mass spectrometer (Agilent, 5973) calibrated based on responses to authentic
standards that were manually injected into the impactor cell at regular intervals throughout the
campaign (Kreisberg et al., 2009). During this campaign, TAG measurements were made in two

29
periods wherein the sampling durations were different. The duration of each sample was 90
minutes from May 31st to June 9th (Sampling period I) and 30 minutes from June 10th to 27th
(Sampling period II). Over the 27-days of measurements, 244 samples of speciated OA were
acquired and over 100 particle-phase organic compounds were identified and quantified.
Supporting measurements conducted concurrently that are relevant to data analysis and
discussion in this study included detailed characterization of meteorological conditions, OA, and
volatile organic compounds (VOCs). Wind speed and direction were monitored by a propeller
wind monitor (R.M. Young, 5130). Details on measurements of submicron OA made with an
Aerodyne High-Resolution Time-of-Flight Aerosol Mass Spectrometer (HR-ToF-AMS) are
provided in Liu et al., (2012). Gas-phase VOCs were measured by an automated in-situ GC-
FID/MS system (Gentner et al., 2012). In addition, ozone was measured using a UV photometric
ozone analyzer (Dasibi Inc., model 1008 RS).
3.3.2 PMF procedures
The positive matrix factorization (PMF) model describes observed concentrations of
organic species as the linear combination of the contributions from a number of sources with
constant profiles (Paatero and Tapper, 1993; Hopke, 2003; Reff et al., 2007; Ulbrich et al., 2009):
ijpj
p
ipij efgx (3.1)
where xij is the concentration of species j measured in sample i, gip is the contribution of factor p
to sample i, fpj is the concentration of species j in factor p and eij is the residual not fit by the
model. PMF solves the equations for gip and fpj to best reproduce xij without a priori knowledge
of them based on the selected number of factors (p). The solution to PMF minimizes the object
function, Q, defined as:
2
11
)(
m
j ij
ijn
i s
eQ (3.2)
where sij is the estimated uncertainty of species j measured in sample i.
As the PMF model allows each data point to be individually weighted, the uncertainties
associated with organic compounds at different concentration levels are estimated separately. By
estimating the uncertainty using this approach, undetected data points can be weighted, so
compounds or days with many missing points do not need to be removed. This approach
provides an advantage over many other methods by achieving longer timelines of observations
(Pollissar et al., 1998). In our study, data points, which were not detected because of the low
concentration, were assigned a concentration of one third of the compounds detection limit, and
uncertainty was assigned to be four times its concentration, similar to the estimation made in
Pollissar et al. (1998). The uncertainty for the measured data point was estimated using the same
equations described in Williams et al. (2010). In contrast to that work, however, the detection
limit of each compound was used in the current study to better account for the instrument noise,
instead of instrument precision derived from the standard deviation of the difference between
consecutive data points used in Williams et al., (2010).
To investigate the major OA sources in this study, only the particle-phase organics were
included in the PMF analysis. In Appendix B, we demonstrated that the inclusion of gas-phase

30
contributions to semi-volatile organic compounds (SVOCs) significantly bias the results of
source apportionment. The criteria we used for inclusion of compounds were that the timeline of
observations covered the entire period of TAG measurements, the compounds were in the
particle phase, and the percentage of above detection limit data points was greater than 50% over
the full timeline of observations. As a result, 30 compounds (listed in Figure 3.1) in 244 samples
were included in the PMF analysis. PMF was applied using the Igor based PMF Evaluation Panel
v2.04 (Ulbrich et al., 2009).
Detailed discussions of determination of the optimum number of PMF factors can be
found in the literature of Reff et al. (2007), Ulbrich et al. (2009) and Williams et al. (2010), and
interpretability of these factors is an important criterion. In our study, the linkage between factors
and specific OA source types or atmospheric processes was initially made based on the existing
knowledge of specific sources of individual compounds in each factor and was further
corroborated by their diurnal profiles and supporting measurements, such as VOCs and
meteorological conditions.
Although the sum of concentrations of all species included in PMF analysis accounts for
only a small fraction of AMS measured OA, the mass contribution of each factor to measured
OA can be calculated by a multivariate fit of the temporal contributions of PMF factors onto total
AMS measured OA mass concentrations (Reff et al., 2007; Williams et al., 2010). The sum of
these calculated mass contributions are defined as reconstructed OA. The regression coefficients
for factors provide an additional constraint on the number of factors to be included, since
negative regression coefficients are a good indication that the number of factors exceeds the
optimum (Reff et al., 2007).
3.4 PMF results The variability of the TAG data is best explained by six factors with a value of Q/Qexpected
equal to 2.5 with Fpeak set to 0. Since the interpretability is an important criterion in determining
the optimal number of factors, 5-factor and 7-factor solutions were also explored. In comparison
with the 6-factor solution, the 5-factor solution resulted in a convolution of factors 1 and 5. The
7-factor solution split factor 6, which is a mixture of anthropogenic and biogenic SOA factors,
without providing additional meaningful information. We therefore chose to examine the 6-
factor solution in detail to characterize the major components of total OA. To facilitate
discussion, we define 8:00-20:00 PST as the day and 20:00-8:00 PST as the night.
3.4.1 Factor 1: Local POA
We define factor 1 as local POA. Factor 1 has the highest contribution from
hydrocarbons among the six factors (Figure 3.1) and has a diurnal profile with higher
concentrations at night, consistent with the buildup of local emissions into a shallow nighttime
boundary layer (Figure 3.2). Highest concentrations of this factor occurred during the night, at
low wind speeds, and with wind coming from all directions (Figures 3.2 and 3.3) indicating that
it originated mainly from local sources because Bakersfield is located near the southern end of
the San Joaquin Valley. One of the two main oxygenated compounds present in this factor was
9-fluorenone, which has been identified as a primary emission from motor vehicles (Schauer et
al., 1999). The other prominent oxygenated compound present in this factor was phthalic acid.

31
Phthalic acid can be produced from oxidation of naphthalene and has been used as a tracer for
anthropogenic SOA (Schauer et al., 2002b; Fine et al., 2004; Shrivastava et al., 2007), but its
average concentration in this factor accounts for less than 1% of its total measured concentration
so we consider this a very minor contribution of SOA adding to this POA dominated factor.
The major known POA sources in Bakersfield are wood burning, meat cooking and
motor vehicles (Schauer et al., 2000) and the average contribution of unknown POA sources to
OA was small (~10%) (Schauer et al., 2000; Strader et al., 1999). Our POA factor correlated
with several measured hopanes (r > 0.54), which were not included in the PMF analysis because
over 50% of their data points were below detection limit. The good correlations with hopanes
suggest that this factor is related to motor vehicles that have been identified as the dominant
source of hopanes in urban environments (Schauer et al., 1996; 2002; Schauer and Cass, 2000).
Tracers for meat cooking, such as palmitoleic acid and cholesterol, were not detected and the
detected tracer for wood burning, retene, was only observed in a few particle-phase samples.
3.4.2 Factor 2: A mixture of OA sources
We define factor 2 as a mixture of OA sources with contributions from both POA and
SOA. While hydrocarbons accounted for a significant fraction of this factor, relative to local
POA, there was a smaller fraction of each PAH and a larger fraction of each phthalate (Figure
3.1). Additionally, an SOA tracer, 6, 10, 14-methyl-2-pentadecanone (Shrivastava et al., 2007),
apparently contributed to this factor, relative to the POA factor wherein this tracer was not
present. The composition of this factor suggests that it was affected by a variety of different
sources and atmospheric chemical processes. The large difference in the concentration range in
alternating intervals of its 2-hr diurnal profile is caused by very different concentrations observed
during two sampling periods. The concentrations in Sampling Period I were higher than those in
Sampling Period II and were plotted in every other sampling interval. The diurnal profile for the
concentration of this factor was examined separately for each sampling period, but neither period
had a clear diurnal cycle, suggesting again that this factor is mostly likely a mixture of OA
sources.
3.4.3 Factors 3 : SOA1
We define factor 3 as SOA1. The contribution of organic species to this factor was
dominated by oxygenated compounds (Figure 3.1). Methyl phthalic acid has been used as a
tracer for anthropogenic SOA (Fine et al., 2004; Williams et al., 2010) and 9,10-anthraquinone
has been observed as oxidation products of PAHs (Helmig et al., 1992; Helmig and Harger,
1994). The elevated concentration of this factor during 20:00-24:00 PST (Figure 3.2) is
attributed to the low wind speed and low temperature, which favors the accumulation of gas-
phase oxygenated compounds in the afternoon and subsequent condensation of them onto
particles to contribute to SOA. These condensable oxygenated compounds can be formed locally,
and probably include some organic nitrates (Rollins et al., 2012), and can also be produced
upwind and transported to the site during the afternoon along with SOA3 (discussed below).
3.4.4 Factor 4: SOA2
We define factor 4 as SOA2. The dominant contribution of organic species to this factor
was from two SOA tracers, phthalic acid and methyl-phthalic acid, though other compounds,
both hydrocarbons and oxygenated compounds, were present but with much smaller

32
contributions. Evidence that this factor was associated with photochemically produced SOA is
apparent when comparing the diurnal profile of this factor with that of the ratio of 1,3,5-
trimenthylbenzene (TMB) to toluene. Because both 1,3,5-TMB and toluene have similar source
types in Bakersfield (Gentner et al., 2012) and1,3,5-TMB reacts faster with OH radicals than
toluene does (Atkinson and Arey, 2003), a smaller ratio of 1,3,5-TMB to toluene indicates that
the air mass is more oxidized. An opposite trend between the average diurnal profile of this
factor and that of the ratio of 1,3,5-TMB to toluene clearly shows that higher concentrations of
this factor occurred when gas-phase organics were more oxidized (Figure 3.2). The highest
concentration of this factor occurred in the morning (8:00-9:00 PST) when the wind speed was
low (Figure 3.2), indicating that this SOA was formed locally.
3.4.5 Factor 5: SOA3
We define factor 5 as SOA3. This factor had its highest concentrations in the afternoon
(Figure 3.2) and correlated with ozone (r=0.62). The dominant contribution of organic species to
this factor was from oxygenated compounds (Figure 3.1). However, the diurnal patterns of the
ratio of 1,3,5-TMB to toluene did not correlate well with this factor, especially in the afternoon
(Figure 3.2). The afternoon ratio of 1,3,5-TMB to toluene was close to the nighttime ratio,
indicating that observed VOCs were fresh and emitted locally without having undergone
significant oxidation. Therefore, we infer that SOA in this factor was not dominantly formed
through local VOC oxidation by OH, but instead was composed primarily of regionally formed,
transported SOA. This inference is supported by relatively high wind speeds (from the northeast)
during the observations of high concentrations of this factor (Figure 3.3) would carry regional
source contributions to the observation site, but would dilute local source contributions.
3.4.6 Factor 6: Nighttime SOA (SOA4)
We define factor 6 as nighttime SOA (SOA4). This factor had the highest concentrations
at night with the dominant contribution from SOA tracers phthalic acid, methyl phthalic acid, 6,
10, 14-methyl-2-pentadecanone and pinonaldehyde. Pinonaldehyde is a volatile oxidation
product of a biogenic VOC, α-pinene, and can contribute to SOA by forming low vapor pressure
products, such as dimers (Tolocka et al., 2004; Liggio and Li, 2006). The factors controlling
gas/particle partitioning of pinonaldehyde at this site has been analyzed in Chapter 2.
Deconvolution of biogenic and anthropogenic contributions is difficult due to the co-variation of
chemical transformations leading to SOA, but it is evident that SOA from biogenic VOC
oxidation contributed significantly to SOA4 as the highest concentrations of this factor were
most frequently observed when the wind blew from the vegetated areas located to the east of the
field site (Figure 3.3).
3.5 Reconstructed OA Reconstructed OA based on TAG-derived factors was compared with measured OA to
evaluate the capability of the TAG-derived factors to capture the variability of OA in the
atmosphere. Good agreement between the reconstructed and measured OA was demonstrated by
differences between them, which were less than 20% for over 70% of observations (Figure B1a).
The reconstructed OA had largest uncertainties at the lowest measured OA concentrations and
was generally lower than the measured OA at high measured OA concentrations. This could be
attributed to larger uncertainties related to organic species when the atmospheric OA

33
concentration was low and lack of inclusion of additional organic tracers in the current dataset
when the atmospheric OA concentration was high (because they were below detection limit in
more than 50% of observations or cannot be measured by TAG). As shown by Figure B1b, the
negative relative residuals mainly occurred at night. One reason for these negative residuals
could be that the TAG did not measure a tracer for organic nitrates which have been shown to
significantly contribute to nighttime OA in this region (Rollins et al., 2012).
3.6 Source contributions to OA mass The local POA source accounted for an average 15% of total OA and motor vehicles
were shown to have a significant contribution to local POA. The average contribution of POA to
total OA could be up to 28% if we assumed that all of the mass of the mixture of OA sources is
POA, but this is surely an overestimate. The contributions from other specific primary sources
cannot be determined individually in this study because they are small and PMF analysis cannot
reliably separate very small factors among the noise and variation of the larger factors. The
emissions in the Bakersfield region are highly complex with cars, trucks, oil and gas extraction
and refining operations, agricultural activities and other sources all potentially contributing some
to these POA factors.
The average contribution of the sum of SOA (SOA1-4) was 72% of total OA and the
contribution of SOA could be up to 85% if the mass in the mixture of OA sources is only
considered as SOA. The dominance of SOA in total OA derived from organic species in this
study is consistent with the results reported by Liu et al. (2012) based on PMF analysis of AMS
observations from the same site which showed that 80% to 90% of total OA is accounted for by
SOA. We conclude that efforts to control atmospheric OA in this region must focus on
understanding and then controlling the sources of SOA precursors or factors leading their
transformation into SOA.
We calculated the diurnal cycle of relative contribution from each identified component
to OA (Figure 3.4) to highlight the dominant components of OA in different periods of the day
and night. The factors contributing the largest fraction of total OA was different during the day
and night, but both of them were SOA. The largest daytime contribution to total OA was from
SOA3, and this factor accounted for ~50% of total OA throughout the day. SOA4 was dominant
at night when it accounted for 39% of total OA, but it provided only a very small contribution to
total OA during the day. SOA2 also contributed substantially to total OA, accounting for 21% of
the total OA when it reached its highest concentration in the morning (8:00 - 12:00 PST). SOA1
always had a small contribution to the total OA, accounting for < 10% of total OA over all
periods of the day. Both SOA2 and SOA3 substantially contributed to total OA (12~21% and
40~56%, respectively) during the day. Since SOA2 was more local and SOA3 was more regional,
we suggest control of SOA precursor emissions on both local and regional scales are needed to
reduce the daytime OA concentration. It will the most effective to control the regional precursors
in the afternoon. SOA4, comprising both anthropogenic and biogenic SOA, was the largest OA
source at night, but it's unclear if control of anthropogenic SOA precursors is able to reduce OA
concentrations because the contribution of SOA formed by oxidation of anthropogenic
precursors is less constrained
34
3.7 Formation pathways of SOA Controlling emissions of pollutants involved in the formation pathways of SOA has the
potential to play a significant role in reducing regional OA concentrations (e.g. Liggio and Li,
2006; Na et al., 2007). In areas where biogenic emissions are oxidized in the presence of
anthropogenic pollutants such as SO2, NOx and black carbon, it has become increasingly
apparent that SOA formation from biogenic VOC is substantially enhanced (Goldstein et al.,
2009; Surratt et al., 2010; Carlton et al., 2010; Spracklen et al., 2011). Rollins et al. (2012) has
shown that in the Bakersfield region reductions in NOx can reduce the OA concentration because
of the involvement of NOx in formation of organic nitrates. Through the following discussion,
we expect to not only suggest the main formation pathway of SOA formation in the Bakersfield
site, but also examine if control of other sprecies involved in SOA formation in addition to NOx
and organic precursors can reduce OA concentrations. TAG-derived factors can be indicative of
the dominant formation pathway for each SOA type identified. The pathways of oxygenated
compounds contributing to SOA in each factor can be used to draw a distinction between direct
gas-to-particle condensation wherein oxidation reactions produce low volatility products that
condense, secondary gas-to-particle condensation wherein non-oxidation reactions produce
lower volatility products that condense, such as reactions between carboxylic acids and ammonia,
and reactive uptake wherein compounds expected to be in the gas-phase enter the particle phase
through acid-catalyzed reactions. Evidence for these formation pathways in Bakersfield during
CalNex based on individual compounds – specifically phthalic acid, pinonaldehyde and 6, 10,
14-trimethyl-2-pentadecanone has been explored and reported in Chapter 2. Ketones enter the
particle phase primarily through direct gas-to-particle condensation, while phthalic acid was
shown to enter the particle phase mainly through reaction with ammonia in the gas phase. It is
likely that SOA1 and SOA3 were formed at least partially by direct gas-to-particle condensation
because the dominant contribution to the factor profiles of these two factors are from compounds
with ketone functional groups. The factor profile of SOA2 is primarily determined by particle-
phase phthalic acid formed through reactions with gas-phase ammonia, indicating the reactions
of carboxylic acids and ammonia play a significant role in the formation of SOA2. This
formation pathway is also supported by the good correlation (r>0.5) between the concentration of
SOA2 and the concentration of excess ammonium defined as the amount of ammonium which
was not neutralized by sulfate and nitrate measured HR-ToF-AMS. This formation pathway
could be site-specific because it needs excess ammonia to allow these reactions with carboxylic
acids to occur. For SOA4 (i.e., the nighttime SOA) the factor profile contains pinonaldehyde, as
well as phthalic acid and 6, 10, 14-2-pentadecanone. The presence of pinonaldehyde in the
particles indicates the occurrence of acid-catalyzed reactions in the particles. However, the
relative contribution to the nighttime OA from these particle-phase reactions cannot be
distinguished from the direct gas-to-particle condensation. Chapter 2 has shown that secondary
gas-to-particle partitioning and reactive uptake can significantly increase SOA yields of phthalic
acid and pinonaldehyde relative to direct gas-to-particle partitioning. Therefore, control of
species involved in these pathways of gas-to-particle partitioning such as ammonia and organic
acids could lead to reductions in the OA concentration, in addition to control of organic
precursors. However, the efficiency of reduction of SOA concentrations by control ammonia
needs further investigation. For example, the reduction of ammonia would increase the aerosol
acidity which improve the SOA formation from particle-phase reactions (Jang et al., 2002;
Liggio and Li, 2006).

35
To substantiate that the formation pathways of SOA can be indicated by individual
compounds, daytime SOA types derived from PMF analysis of organic species were compared to
those from PMF analysis of bulk organic mass spectra measured by AMS (Figure 3.5). The
contribution of the daytime SOA (the sum of SOA2 and SOA3) derived from organic species to
total OA in this study displays a similar diurnal profile to SOA of the sum of high O/C alkane
(O/C=0.68), high O/C aromatic (O/C=0.63) and petroleum (O/C=0.20) SOA derived from AMS
mass spectra reported in Liu et al. (2012) from the same measurement campaign, which were
selected because their mass fraction exhibited a daytime enhancement. The consistency of
daytime SOA between these two studies supports that oxygenated organic compounds observed
by TAG are able to reproduce the trend of SOA formation during the day.
3.8 Conclusions and atmospheric implications PMF analysis was performed on 244 particle-phase speciated organic samples, acquired
over the span of a month, to investigate OA sources. The variability of this dataset was best
explained by six types of OA sources using PMF analysis. The concentration of reconstructed
OA based on these six factors was in good agreement with the concentration of measured OA.
Local POA accounted for 15% of the total OA on average and is suggested to be mostly
contributed by motor vehicles. SOA was the dominant component of total OA throughout the
day and night. SOA (the sum of SOA1-4) accounted for an average 72% of total OA with an
average diurnal variation in the range from 66% at night to 78% during the day. SOA3 (regional
SOA, 56%) was dominant during the afternoon and SOA4 (nighttime SOA, 39%) was dominant
during the night. SOA2 (Local SOA) contributed significantly in the morning, accounting for 21%
of total OA from 8:00 am to 12:00 pm PST.
Our results suggest that the formation of SOA during this study occurred dominantly
through direct gas-to-particle condensation. Particle-phase reactions also contributed to
formation of nighttime SOA, but their contributions are not well-constrained in this study. The
formation of SOA in this study occurred through multiple pathways, some of which may be
regionally-specific due to the unique mixture of emissions in this airshed. Our investigation of
gas-to-particle partitioning suggested that the amount of SOA can be reproduced by the
traditional SOA model using absorptive gas-to-particle partitioning.
The best control strategy for each type of SOA (SOA1-4) to enable effective reductions
in the regional OA concentration may be different. The control of SOA precursor emissions on
both local (SOA1 and 2) and regional (SOA3) scales are needed during the day, but control of
regional SOA precursor emissions is likely to be most effective in the afternoon. Control of
ammonia would also reduce the concentration of local SOA (SOA2). However, as discussed
above, control of ammonia emissions could also lead to more nighttime SOA. At night, The
contributions of both biogenic and anthropogenic precursors to the formation of nighttime SOA
(SOA4) were evident, but neither of their contributions can be determined in this study.
Consequently, it leaves it unclear if the concentration of nighttime SOA is effectively reduced by
control of anthropogenic organic precursors.
3.9 References

36
Atkinson, R., and J. Arey (2003), Atmospheric degradation of volatile organic compounds, Chem.
Rev., 103(12), 4605-4638.
Carlton, A. G., R. W. Pinder, P. V. Bhave, and G. A. Pouliot (2010), To What Extent Can
Biogenic SOA be Controlled?, Environ. Sci. Technol., 44(9), 3376-3380.
Gentner, D.R., Isaacman, G., Worton, D.R., Chan, A.W.H., Dallmann, T.R., Davis, L., Liu, S.,
Day, D.A., Russell, L.M., Wilson, K.R., Weber, R., Guha, A., Harley, R.A., and Goldstein,
A.H. (2012), Secondary organic aerosol and the burning question of gas vs. diesel, P. Natl.
Acad. Sci. USA,, in review.
Goldstein, A. H., C. D. Koven, C. L. Heald, and I. Y. Fung (2009), Biogenic carbon and
anthropogenic pollutants combine to form a cooling haze over the southeastern United States,
P. Natl. Acad. Sci. USA, 106(22), 8835-8840.
Fine, P. M., B. Chakrabarti, M. Krudysz, J. J. Schauer, and C. Sioutas (2004), Diurnal variations
of individual organic compound constituents of ultrafine and accumulation mode particulate
matter in the Los Angeles basin, Environ. Sci. Technol., 38(5), 1296-1304.
Helmig, D., and W. P. Harger (1994), Oh Radical-Initiated Gas-Phase Reaction-Products of
Phenanthrene, Sci Total Environ, 148(1), 11-21.
Helmig, D., J. Arey, R. Atkinson, W. P. Harger, and P. A. Mcelroy (1992), Products of the OH
Radical-Initiated Gas-Phase Reaction of Fluorene in the Presence of Nox, Atmos Environ,
26(9), 1735-1745.
Hopke, P. K. (2003), Recent developments in receptor modeling, J. Chemometr., 17(5), 255-265.
Jaeckels, J. M., M. S. Bae, and J. J. Schauer (2007), Positive matrix factorization (PMF) analysis
of molecular marker measurements to quantify the sources of organic aerosols, Environ. Sci.
Technol., 41(16), 5763-5769.
Jang, M. S., N. M. Czoschke, S. Lee, and R. M. Kamens (2002), Heterogeneous atmospheric
aerosol production by acid-catalyzed particle-phase reactions, Science, 298(5594), 814-817.
Jimenez, J. L., et al. (2009), Evolution of Organic Aerosols in the Atmosphere, Science,
326(5959), 1525-1529.
Kanakidou, M., et al. (2005), Organic aerosol and global climate modelling: a review, Atmos.
Chem. Phys., 5, 1053-1123.
Kleindienst, T. E., M. Jaoui, M. Lewandowski, J. H. Offenberg, C. W. Lewis, P. V. Bhave, and E.
O. Edney (2007), Estimates of the contributions of biogenic and anthropogenic hydrocarbons
to secondary organic aerosol at a southeastern US location, Atmos. Environ., 41(37), 8288-
8300.
Kreisberg, N. M., S. V. Hering, B. J. Williams, D. R. Worton, and A. H. Goldstein (2009),
Quantification of Hourly Speciated Organic Compounds in Atmospheric Aerosols, Measured
by an In-Situ Thermal Desorption Aerosol Gas Chromatograph (TAG), Aerosol Sci. Tech.,
43(1), 38-52.
Kroll, J. H., and J. H. Seinfeld (2008), Chemistry of secondary organic aerosol: Formation and
evolution of low-volatility organics in the atmosphere, Atmos. Environ., 42(16), 3593-3624.
Li, Q. F., A. Wyatt, and R. M. Kamens (2009), Oxidant generation and toxicity enhancement of
aged-diesel exhaust, Atmos. Environ., 43(5), 1037-1042.
Liggio, J., and S. M. Li (2006), Reactive uptake of pinonaldehyde on acidic aerosols, J. Geophys.
Res., 111(D24), doi:10.1029/2005JD006978.
Liu et al. (2012), Secondary organic aerosol formation from fossil fuel sources contribute
majority of summertime organic mass at Bakersfield, J. Geophys. Res.-Atmos., in press.

37
Magliano, K. L., V. M. Hughes, L. R. Chinkin, D. L. Coe, T. L. Haste, N. Kumar, and F. W.
Lurmann (1999), Spatial and temporal variations in PM10 and PM2.5 source contributions
and comparison to emissions during the 1995 integrated monitoring study, Atmos. Environ.,
33(29), 4757-4773.
Odum, J. R., T. P. W. Jungkamp, R. J. Griffin, R. C. Flagan, and J. H. Seinfeld (1997), The
atmospheric aerosol-forming potential of whole gasoline vapor, Science, 276(5309), 96-99.
Paatero, P., and U. Tapper (1993), Analysis of Different Modes of Factor-Analysis as Least-
Squares Fit Problems, Chemometr. Intell. Lab., 18(2), 183-194.
Polissar, A.V, P. K. Hopke, P. Paatero, W. C. Malm, and J.F., Sisler (1998), Atmospheric aerosol
over Alaska 2. Elemental composition and sources, J. Geophys. Res., 103(D15), 19,045-
19,057.
Reff, A., S. I. Eberly, and P. V. Bhave (2007), Receptor modeling of ambient particulate matter
data using positive matrix factorization: Review of existing methods, J. Air. Waste. Manage.,
57(2), 146-154.
Robinson, A. L., R. Subramanian, N. M. Donahue, A. Bernardo-Bricker, and W. F. Rogge
(2006), Source apportionment of molecular markers and organic aerosol. 3. Food cooking
emissions, Environ. Sci. Technol., 40(24), 7820-7827.
Robinson, A. L., N. M. Donahue, M. K. Shrivastava, E. A. Weitkamp, A. M. Sage, A. P.
Grieshop, T. E. Lane, J. R. Pierce, and S. N. Pandis (2007), Rethinking organic aerosols:
Semivolatile emissions and photochemical aging, Science, 315(5816), 1259-1262.
Rollins, A. W., E. C. Browne, K.-E. Min, S. E. Pusede, P. J. Wooldridge, D. R. Gentner, A. H.
Goldstein, S. Liu, D. A. Day, L. M. Russell, and , R. C. Cohen (2012), Evidence for NOx
control over nighttime SOA formation, Science,337(6099), 1210-1212.
Schauer, J. J., and G. R. Cass (2000), Source apportionment of wintertime gas-phase and
particle-phase air pollutants using organic compounds as tracers, Environ. Sci. Technol., 34(9),
1821-1832.
Schauer, J. J., M. J. Kleeman, G. R. Cass, and B. R. T. Simoneit (1999a), Measurement of
emissions from air pollution sources. 1. C-1 through C-29 organic compounds from meat
charbroiling, Environ. Sci. Technol., 33(10), 1566-1577.
Schauer, J. J., M. J. Kleeman, G. R. Cass, and B. R. T. Simoneit (1999b), Measurement of
emissions from air pollution sources. 2. C-1 through C-30 organic compounds from medium
duty diesel trucks, Environ. Sci. Technol., 33(10), 1578-1587.
Schauer, J. J., M. J. Kleeman, G. R. Cass, and B. R. T. Simoneit (2002a), Measurement of
emissions from air pollution sources. 5. C-1-C-32 organic compounds from gasoline-powered
motor vehicles, Environ. Sci. Technol., 36(6), 1169-1180.
Schauer, J. J., M. P. Fraser, G. R. Cass, and B. R. T. Simoneit (2002b), Source reconciliation of
atmospheric gas-phase and particle-phase pollutants during a severe photochemical smog
episode, Environ. Sci. Technol., 36(17), 3806-3814.
Schauer, J. J., W. F. Rogge, L. M. Hildemann, M. A. Mazurek, G. R. Cass, and B. R. T. Simoneit
(1996), Source apportionment of airborne particulate matter using organic compounds as
tracers, Atmos. Environ., 30(22), 3837-3855.
Shrivastava, M. K., R. Subramanian, W. F. Rogge, and A. L. Robinson (2007), Sources of
organic aerosol: Positive matrix factorization of molecular marker data and comparison of
results from different source apportionment models, Atmos. Environ., 41(40), 9353-9369.
Spracklen, D. V., et al. (2011), Aerosol mass spectrometer constraint on the global secondary
organic aerosol budget, Atmos. Chem. Phys., 11(23), 12109-12136.

38
Stone, E. A., J. B. Zhou, D. C. Snyder, A. P. Rutter, M. Mieritz, and J. J. Schauer (2009), A
Comparison of Summertime Secondary Organic Aerosol Source Contributions at Contrasting
Urban Locations, Environ. Sci. Technol., 43(10), 3448-3454.
Strader, R., F. Lurmann, and S. N. Pandis (1999), Evaluation of secondary organic aerosol
formation in winter, Atmos. Environ., 33(29), 4849-4863.
Subramanian, R., N. M. Donahue, A. Bernardo-Bricker, W. F. Rogge, and A. L. Robinson
(2007), Insights into the primary-secondary and regional-local contributions to organic
aerosol and PM2.5 mass in Pittsburgh, Pennsylvania, Atmos. Environ., 41(35), 7414-7433.
Surratt, J. D., A. W. H. Chan, N. C. Eddingsaas, M. N. Chan, C. L. Loza, A. J. Kwan, S. P.
Hersey, R. C. Flagan, P. O. Wennberg, and J. H. Seinfeld (2010), Reactive intermediates
revealed in secondary organic aerosol formation from isoprene, P. Natl. Acad. Sci. USA,
107(15), 6640-6645.
Tolocka, M. P., M. Jang, J. M. Ginter, F. J. Cox, R. M. Kamens, and M. V. Johnston (2004),
Formation of oligomers in secondary organic aerosol, Environ. Sci. Technol., 38(5), 1428-
1434.
Turpin, B. J., J. J. Huntzicker, S. M. Larson, and G. R. Cass (1991), Los-Angeles Summer
Midday Particulate Carbon - Primary and Secondary Aerosol, Environ. Sci. Technol., 25(10),
1788-1793.
Ulbrich, I. M., M. R. Canagaratna, Q. Zhang, D. R. Worsnop, and J. L. Jimenez (2009),
Interpretation of organic components from Positive Matrix Factorization of aerosol mass
spectrometric data, Atmos. Chem. Phys., 9(9), 2891-2918.
Williams, B. J., A. H. Goldstein, N. M. Kreisberg, and S. V. Hering (2006), An in-situ
instrument for speciated organic composition of atmospheric aerosols: Thermal Desorption
Aerosol GC/MS-FID (TAG), Aerosol Sci. Tech., 40(8), 627-638.
Williams, B. J., A. H. Goldstein, N. M. Kreisberg, S. V. Hering, D. R. Worsnop, I. M. Ulbrich, K.
S. Docherty, and J. L. Jimenez (2010), Major components of atmospheric organic aerosol in
southern California as determined by hourly measurements of source marker compounds,
Atmos. Chem. Phys., 10(23), 11577-11603.
Zhao, Y., N.K., Kreisberg, D.R., Worton, G., Isaacman, R.J., Weber, M. Z., Markovic, T.C.,
Vandenboer, S., Liu, D.A., Douglas, J.G., Murphy, L.M., Russell, S.V., Hering, A.H.,
Goldstein, (2012). Insights for SOA formation mechanisms from measured gas/particle
partitioning of specific organic tracer compounds. Prepare to submit to Environmental
Science and Technology
Zhang, Q., et al. (2007), Ubiquity and dominance of oxygenated species in organic aerosols in
anthropogenically-influenced Northern Hemisphere midlatitudes, Geophys Res Lett, 34(13).
Zhang, Q., J. L. Jimenez, M. R. Canagaratna, I. M. Ulbrich, N. L. Ng, D. R. Worsnop, and Y. L.
Sun (2011), Understanding atmospheric organic aerosols via factor analysis of aerosol mass
spectrometry: a review, Anal. Bioanal. Chem., 401(10), 3045-3067.
Zhang, Y., R. J. Sheesley, J. J. Schauer, M. Lewandowski, M. Jaoui, J. H. Offenberg, T. E.
Kleindienst, and E. O. Edney (2009), Source apportionment of primary and secondary organic
aerosols using positive matrix factorization (PMF) of molecular markers, Atmos. Environ.,
43(34), 5567-5574.
Zheng, M., G. R. Cass, J. J. Schauer, and E. S. Edgerton (2002), Source apportionment of PM2.5
in the southeastern United States using solvent-extractable organic compounds as tracers,
Environ. Sci. Technol., 36(11), 2361-2371.

39
3.10 Tables and figures
Figure 3.1 PMF factor profiles. Compounds are generally grouped into hydrocarbons and
oxygenated organic compounds. The y-axis is the fraction of each compound contributing to the
total mass of all compounds in that factor.

40
Figure 3.2 Diurnal profiles of the mass concentration of each factor and the average diurnal
profile of wind direction and the ratio of 1,3,5-TMB to toluene. In the box plots, the center line
of each box is the median of the data, the top and bottom of the box are 75th and 25th percentiles
and top and bottom whiskers are 90th and 10th percentiles. The solid square maker is the mean
concentration. In average diurnal profiles, the mean value is plotted with ± one standard
deviation.

41
Figure 3.3 Wind rose plots for six PMF factors using only concentrations larger than the mean
concentration in each factor to emphasize the major contributing source directions. The wind
direction is shown in degrees with 0 (360) as north, 90 as east, 180 as south and 270 as west.
The relative concentration level is indicated by different colors: yellow > blue > green >red. The
frequency of observations is represented by the length of each wedge.

42
Figure 3.4 Mean diurnal mass fraction contribution of each factor to total OA during six
different times of day.

43
Figure 3.5 Average diurnal profiles of the mass fraction of OA identified as SOA by AMS PMF
(Liu et al., 2012) and by TAG PMF(this study). The TAG data are shifted to the right for clarity.

44
Chapter 4
Development of an in situ thermal desorption gas chromatography instrument
for quantifying atmospheric semi-volatile organic compounds
4.1 Abstract Semi-volatile organic compounds (SVOCs) play a significant role in the formation of
secondary organic aerosol, but their atmospheric abundance and chemical composition are
poorly understood. We have developed a new system for the Thermal desorption Aerosol Gas
chromatograph (TAG) that extends its capability to quantitatively speciate SVOCs (SV-TAG)
with the vapor pressure lower than tetradecane (C14) in hourly time resolution. The key
component is a passivated stainless steel fiber filter that quantitatively collects both gas and
particle phase organic compounds. A separation between gas and particle phase collection is
determined through a difference method by periodically sampling ambient air through a multi-
channel charcoal denuder that efficiently removes gas phase compounds. Measurements made
with this new instrument will provide constraints on the abundance, chemical composition, and
gas/particle partitioning of atmospheric SVOCs, and provide opportunities to improve our
understanding of secondary organic aerosol formation in the atmosphere.
4.2 Introduction Directly emitted, intermediate volatility organic compounds (IVOCs, defined as having
an effective saturation concentration C* of 103 to 10
6 µg m
-3) and semi-volatile organic
compounds (SVOCs, C* of 10-1
to 103 µg m
-3) have been proposed as a substantial, yet
unaccounted for source of secondary organic aerosol (SOA) precursors (Robinson et al., 2007;
Weitkamp et al., 2007). Estimated atmospheric abundances of directly emitted I/SVOCs can be
an order of magnitude larger than primary organic aerosol (Robinson et al., 2007). Chamber
experiments show that oxidation of compounds in the IVOC range produces SOA efficiently
(Lim and Ziemann, 2009; Chan et al., 2009; Presto et al., 2010; de Gouw et al., 2011). The
importance of I/SVOCs to SOA formation is further supported by recent modeling work showing
that the inclusion of estimated I/SVOCs emissions by means of the volatility basis-set approach
(Robinson et al., 2007; Shrivastava et al., 2008; Grieshop et al., 2009), resulted in better
agreement between measured and modeled SOA (Dzepina et al., 2009; Tsimpidi et al., 2010;
Hodzic et al., 2010) than models that did not include I/SVOCs (e.g., Volkamer et al., 2006;
Hodzic et al., 2010). However, these newer models cannot reproduce both the SOA mass and the
oxygen to carbon ratio of the bulk aerosol (Hodzic et al., 2010), which highlights substantial
deficiencies in the understanding of I/SVOCs emissions and oxidation mechanisms.
The volatility basis-set approach used in these newer models estimate primary I/SVOCs
by multiplying concentrations of primary organic aerosol (POA) by a scaling factor derived from
dilution measurements of emissions from two primary sources: diesel exhaust and wood burning
(Robinson et al., 2007; Grieshop et al., 2009). The corresponding uncertainty in estimated IVOC
abundance could be as much as three times the magnitude of POA emissions (Robinson et al.,
2007). Gas-phase oxidation of I/SVOCs proposed by Robinson et al. (2007) and updated by
Grieshop et al. (2009) lumps all species with the same effective saturation concentration into a
single volatility bin and assumes a constant mass increase for species in a given bin through each

45
oxidation step. However, it is likely that a large number of isomers are present for each carbon
number in the vapor pressure range of I/SVOCs (Goldstein and Galbally, 2007; Isaacman et al.,
2012) and laboratory experiments have shown that SOA yields from gas phase OH radical
initiated oxidation of alkane isomers differ according to their molecular structure in the order
cyclic > linear > branched (Lim and Ziemann, 2009). In addition to absorptive gas-to-particle
partitioning, previous studies have shown that other formation pathways, such as reactive uptake
of small carbonyls on acidic particles (e.g. Jang et al., 2002; Tolocka et al., 2004) and reactions
between carboxylic acids and ammonia (Na et al., 2007), are important for SOA formation.
Presto et al. (2012) recently introduces a chromatography-based approach to determine the
volatility distribution of POA emissions without speciation analysis based on relationship
between the retention time of known compounds and saturation concentration of them. The
observational constraints on the volatility distribution of S/IVOCs can be provided by using this
approach, but S/IVOCs need to be quantitatively collected. To better predict SOA production
from the oxidation of I/SVOCs, it is critical to apply observational constraints to emissions,
speciation, and gas-phase oxidation mechanisms and pathways of gas-to-particle partitioning of
I/SVOCs.
The Thermal desorption Aerosol Gas chromatograph (TAG, Williams et al., 2006) has
shown the capability to capture hourly trends in the gas/particle partitioning of speciated
organics and the variability of low-volatility compound vapors (Williams et al., 2010). However,
the original TAG, with its impactor-based collector, was not designed for capture of vapor phase
organics. As a result, this instrument could not quantitatively measure speciated I/SVOCs. As
mentioned above that multiple SOA formation pathways are present in the atmosphere,
oxygenated compounds in the vapor pressure range of IVOCs can therefore partition into
particles through non-absorptive gas-to-particle partitioning (e.g. Jang et al., 2002). As a result,
there is no clear split between IVOCs and SVOCs in the atmosphere according to gas/particle
partitioning. We will take "SVOCs" in this paper to include both IVOCs and SVOCs described
above. There are other operational definitions of SVOCs based on the vapor pressure and air-
sampling strategy (Turpin et al., 2000). However, SVOCs are generally in vapor pressure range
approximately equivalent to C12~C32 n-alkanes (Turpin et al., 2000; Sihabut et al., 2005;
Robinson et al., 2007; de Gouw et al., 2011). In this paper, we present the development and
evaluation of a new configuration for TAG, called semi-volatile TAG (SV-TAG), that enables
the quantitative measurement of speciated SVOCs with hourly resolution.
In selecting the sampling methodology for SV-TAG, consideration was given to denuder-
based methods, wherein a sorbent tubular system is used to remove vapor phase organics prior to
particle collection, and to filter-based methods that consist of a filter and sorbent trap in series.
Filter-sorbent trap methods have been used extensively (Fraser et al., 1997; Simcik et al., 1998;
Schauer et al., 1999; 2002; Subramanian et al., 2004), but are subject to positive artifacts caused
by adsorption of gas-phase organics on a filter as well as negative artifacts due to evaporation of
particulate organics. While sorption onto the filter media may be assessed experimentally
(Turpin et al. 2000), it is not possible to determine the magnitude of volatilization from the filter,
nor the absorption onto already-deposited organic material. The latter could be an even more
important pathway contributing to underestimation of gas-phase organics (Storey et al., 1995).
Denuder-based methods, with laboratory extraction and analysis of the substrates, have been
used to measure SVOCs in the atmosphere (e.g. Gundel et al., 1995; Cui et al., 1998; Possanzini

46
et al., 2004) and from primary emission sources (e.g. Schauer et al., 1999; 2002). Additionally,
thermally extractable, multi-capillary denuders have been developed using short sections of gas
chromatography capillary columns (Krieger and Hites, 1992; Tobias et al., 2007) and stainless
steel honeycombs coated by cross-linked and bonded polydimethylsiloxane (Rowe and Perlinger,
2010). If the denuder efficiently removes and retains vapor compounds of interest, the artifacts
are smaller because gas-phase organics are collected by the denuder surface while particles pass
through and are subsequently captured by the filter or the adsorbent bed downstream (e.g.
Gundel et al., 1995; Eatough et al., 1993; Cui et al., 1998; Turpin et al., 2000). Concerns have
been raised concerning the disequilibrium of gas/particle partitioning following the removal of
gas-phase organics, but this is minimized if the residence time inside the denuder is short
(Kamens and Coe, 1997). Moreover, vapor collection efficiencies and particle losses within the
denuder can be determined experimentally (Eatough et al., 1993; Gundel et al., 1995). For these
reasons we selected a denuder-based method for SV-TAG.
Our SV-TAG instrument combines denuder-difference sampling with in-situ thermal
desorption and gas chromatography/mass spectrometry (GC/MS) analysis. The collection cell is
designed to quantitatively collect both organic vapors and particles. The gas/particle partitioning
is determined by sampling alternately with, and without the denuder in-line upstream. Although
thermally extractable denuders have been discussed in the literature (Tobias et al., 2007; Rowe
and Perlinger, 2010), we opted for the difference approach because it is a less complex system
that allows us to combine the gas and particle collection and thermal desorption parts into a
single component. This paper describes the evaluation of the SV-TAG denuder and collector
components and procedures, and presents example ambient data.
4.3 Methods 4.3.1 The SV-TAG system
A schematic of the SV-TAG is shown in Figure 4.1. Components of SV-TAG that differ
from the original TAG are (1) an activated carbon denuder (2) a metal-fiber filter collection and
thermal desorption cell (F-CTD), and (3) a valve-less injection interface (VLI) with a secondary
focusing trap (FT). The denuder is switched in and out of the sample line, upstream of the F-
CTD, and removes organic vapors while allowing particles to penetrate. The F-CTD enables
efficient collection of SVOCs from the gas phase while simultaneously enabling efficient
collection of all particles, all on a filter surface that can be directly thermally desorbed and then
reused for the next sample. The FT facilitates the use of a much higher desorption flow rate (up
to 200 ml min-1
) than is possible with the direct gas chromatography column transfer where
injection flow rates are typically limited to ~1-2 ml min-1
.
The SV-TAG sample inlet uses a sharp cut PM2.5 cyclone (BGI Inc., Waltham, MA),
followed by two parallel sampling lines (a denuder line and a bypass line) and a 3-way ball valve
(V1, Figure 4.1). The denuder is a multi-channel, activated carbon cylindrical monolith made
from pyrolized phenolic extrusions (3 cm OD, 20 cm length, ~ 490 channels, Mast carbon, UK).
It is housed inside an aluminum tube and sealed by Viton o-rings with tapered caps at each end
connecting to ~1.0 cm (3/8 inch) OD sampling lines upstream and downstream. The bypass
sampling line is made of ~1.0 cm OD stainless steel tubing.

47
The F-CTD uses a 37 mm in diameter Bekipor® stainless steel (SS) fiber filter ( 3AL3,
Bekaert Fiber Technology, Belgium). This filter has a total fiber surface area of ~160 cm2 per
cm2 of filter surface based on manufacturer specifications. This is higher than the total fiber
surface area of ~130 cm2 per cm
2 of filter surface for quartz fiber filters (Mader and Pankow,
2001). The goal of this study is to develop an in-situ instrument capable of collecting SVOC
samples. We hypothesized that a passivated SS fiber filter should be quantitatively capable of
collecting SVOCs if it had large enough surface area, and it would be suitable for repeated
thermal desorption of the sample for analysis. This hypothesis was based on previous
observations that breakthrough of SVOCs on quartz filters is small in a 4 or 6-hour sampling
duration (Subramanian et al., 2004) and the demonstration in our original TAG that passivated
SS is a suitable material for thermal desorption of organics (Williams et al., 2006; Kreisberg et
al., 2009).
The F-CTD is fabricated by permanently sealing this filter inside a 316 SS, brazed
capsule with integrated sampling inlet and outlet tubes and a small bore tube for transferring
desorbed organics to the GC (see Appendix C, Figure C1). Ridges located inside the capsule
clamp the filter in place and ensure rapid heat transfer to the entire filter surface during thermal
desorption. Following fabrication, the F-CTD is passivated with an Inertium® coating
(Advanced Materials Components Express, Lemont, PA). The F-CTD is housed between two
aluminum disks outfitted with four cartridge heaters and two temperature sensing thermocouples.
Cooling fins are machined into the edges of the aluminum disks. A time programmed blower
delivers room air to cool the F-CTD to room temperature after completion of thermal desorption.
The VLI and FT allow the collected sample to be transferred from the F-CTD, focused,
and injected into the GC for analysis (Figure 4.1B) without having to pass through a valve. As
described by Kreisberg et al (2012), the VLI provides more reproducible sample transfer than did
the 6-port valve of the original TAG.
The VLI used in this study consists of two 50 cm long stainless steel capillaries with
inner diameters of 125 µm connected by a pair of VICI tees (Valco Instruments Co. Inc.) housed
in a square aluminum heating block (Figure 4.1) held at 300 ºC. Similar to the F-CTD, the
capillaries and VICI tees are passivated with an Inertium® treatment.
The FT for the final configuration is made of a 50-cm section of a SS GC capillary
column (MXT-5, 0.5 m x 0.53 mm ID, 5 µm film thickness, Restek) and integrated into the vent
line of the VLI as shown in Figure 4.1. The FT has its own aluminum heating and cooling block
with heat sink fins on both vertical edges (Figure C2). A thin layer of insulation between the VLI
and the FT housing minimizes heat transfer. A time programmed box fan is used to maintain the
FT at a low enough temperature to re-focus organics desorbed from the F-CTD. This FT does not
require liquid nitrogen or other consumables.
4.3.2 SV-TAG operation
SV-TAG alternates between two modes of operation: (1) GC sample analysis with
simultaneous collection of the next sample and (2) thermal desorption of a sample into the GC.
After collection, the deposited organics are thermally desorbed from the F-CTD and refocused
onto the FT ("sample trapping") followed by thermal transfer from the FT to the GC ("sample

48
injection"). Following sample injection, the F-CTD is cooled in preparation for collection of the
next sample. Sample collection alternates between the bypass (undenuded) and denuder inlet
lines. Gas/particle partitioning is determined by difference, with the undenuded sample
providing "total organics" and the denuded sample providing "particle-phase organics".
For sampling, ambient air at 10 L/min is pulled from the center of a larger transport flow
air stream, through the cyclone, through either the denuder or bypass line, and then delivered to
the F-CTD which is maintained at 28 ºC. After completion of ambient sampling, the 3-way valve
(V1) and sample valve (V2) are closed and helium flow is set to 200 ml/min for one minute with
the cell still at 28°C to flush any residual air from the F-CTD. The flow is then reduced to 10
ml/min and organics are thermally desorbed by heating the F-CTD from 28 ºC to 305 ºC at a rate
of ~35 ºC/min, then to 315 ºC at a rate of 5 ºC/min and holding at 315 ºC for 4 minutes. Midway
through the desorption, the helium flow is increased from 10 to around 150 ml/min to facilitate
the transfer of the less volatile material. The majority (~80%) of the helium desorption flow
enters the F-CTD through its outlet and the remainder through the inlet such that the filter is
predominantly back-flushed. Desorbed organics are refocused onto the FT which is held at 40 ºC.
Following desorption, the sample is transferred from the FT to the GC which is initiated while
the VLI switches to the sample injection mode by closing the vent valve (V4) and opening the
purge valve (V3) (Description of VLI operation is provided in Appendix C1). The FT is heated
from 40 ºC to 315 ºC in 3 minutes and held at 315 ºC for 2 minutes. The total injection flow is
about 3 ml/min consisting of ~ 2 ml/min from the FT, ~ 0.5 ml/min from the F-CTD and ~ 0.5
ml/min from the electronic pressure controller (EPC). During sample injection, the GC oven is
held at 45 ºC and the F-CTD at 315 ºC.
After sample injection, the system is switched back to the GC analysis mode for organic
chemical analysis (see Appendix C2). The F-CTD and FT heaters are turned off and fans are
turned on to cool the F-CTD and FT. Typically, sample collection time is 30 min (or 90 min for
2-hr cycle time), desorption and transfer step is about 20 min, followed by an 8-min cooling step.
The GC analysis is typically 35 min and is initiated at the conclusion of the desorption, and
continues during the collection of the next sample.
4.3.3 System evaluation
The combined thermal desorption and transfer efficiency of organics from the F-CTD to
the head of the GC column were evaluated using a C8-C40 n-alkane liquid standard, which covers
the SVOC vapor pressure range. The liquid standard was introduced into the F-CTD via a micro-
liter syringe through a customized injection port and thermally desorbed and transferred to the
GC/MS for analysis. The thermal desorption flow was varied for these tests. Initially transfer
efficiencies were evaluated without a focusing trap, which restricted the thermal desorption flow
to the GC column flow of 1-2 ml/min. Subsequent experiments, reported here, employed a FT
which decouples the thermal desorption flow from the chromatographic flow and facilitated
evaluation of the transfer efficiencies at higher carrier gas flows, as much as 200 ml/min.
After the addition of a FT into the system, the combined thermal desorption and transfer
efficiency from the F-CTD to the head of the column, defined as the recovery, depends on the
thermal desorption efficiency of particle-phase organics from the F-CTD, the efficiency of the
FT to trap the most volatile compounds in the vapor pressure range of SVOCs, and the transfer

49
from the FT to the column. Initially, the thermal desorption from the F-CTD was optimized by
examining the recovery of the particle-phase alkanes, followed by optimizing the recovery of
SVOCs from the FT. Our evaluation compared the relative recovery of individual alkanes from a
standard comprised of equal alkane masses at each carbon number. The relative recovery of each
n-alkane was expressed as the ratio of abundance of this n-alkane to the maximum abundance of
n-alkanes in the C14-C40 range for each run.
The selection of the FT materials is based on the goal to minimize any extra losses caused
by the addition of the FT. Since all of the components exposed to organics after thermal
desorption were made of SS and the GC column, three different media were evaluated:
unpassivated SS tubing and two SS MXT-5 columns with 3µm and 5µm film thickness,
respectively. The FT made of the same length of each material was initially evaluated to
determine which one would be optimized for the recovery of SVOCs by increasing the length of
the FT and reducing the thermal desorption flow rate. For all experiments, the temperature of the
FT was held at 40°C during sample trapping because of its proximity to the heated VLI.
The collection efficiency (CE) and volatilization losses of the F-CTD were evaluated
using authentic standards (Table B1) under simulated ambient sampling conditions. The
authentic standards covered the vapor pressure range of SVOCs and spanned several different
functional groups, typically observed in the atmosphere. These standards were introduced using
an impactor collection and thermal desorption cell (I-CTD) placed immediately upstream of the
F-CTD to act as a vaporizing source. The I-CTD was used in the original TAG, and is a compact
collection cell equipped with an injection port for liquid standards (Kreisberg et al, 2009).
To evaluate volatilization losses, we utilized a "thermal desorption transfer" method
whereby liquid standards introduced into the I-CTD with a micro-syringe were transferred to the
F-CTD by vaporizing them at 300 ºC in a 150 ml/min helium flow. This low flow rate ensured
efficient capture by the F-CTD. Then, particle and hydrocarbon free air from a zero air generator
(model 737, AADCO, Cleves, OH) was drawn at 10 L/min though the F-CTD for either 30 or 90
minutes, to simulate normal ambient sampling (either 30 or 90 minutes). Profiles of the flows, F-
CTD and FT temperatures are shown in Figure C3.
To evaluate the overall CE of the F-CTD, including both CE and volatilization losses, we
utilized an "evaporation transfer" method whereby organic standards deposited in the I-CTD
were transferred to the F-CTD over either 30 min or 90 min period in a 10 L/min zero air flow at
room temperature. This simulated organic vapor collection during real ambient sampling. The
material on the F-CTD was analyzed at the end of the room temperature transfer. Then the I-
CTD was heated in a 150 ml/min He flow to transfer the remaining standard and the F-CTD was
analyzed a second time. These data provide the total retention by the F-CTD by compounds. This
retention is the sum of collected material. Details are shown in Figure C4. The detailed
description of the thermal desorption method and evaporation transfer method are also provided
in Appendix C3.
The gas CE of the denuder was determined by examining the difference between the
undenuded and denuded samples in Berkeley, CA when a Teflon filter was placed upstream of
the cyclone to remove particles. The size-dependent penetration of particles through the denuder

50
and the particle CE by the F-CTD were evaluated through measurements of upstream and
downstream particle size distributions as presented in Appendix C4.
4.3.4 Ambient sampling
The SV-TAG was initially tested in Berkeley, CA in an hourly automated in-situ mode of
operation for two periods. In the first period of June 13 - 20, 2011, both denuded and undenuded
samples were collected to investigate gas/particle partitioning and overall denuder performance.
In the second period of Oct. 1- 4, 2011, only undenuded samples were collected to investigate
the variability of SVOCs in the atmosphere. Additionally, in the second period deuterated
internal standards were co-injected into the F-CTD with every ambient sample to evaluate the
reproducibility of the thermal transfer efficiency. For all ambient runs SV-TAG was operated
with the 50 cm, 5 µm film FT with the two step purge. The exact temperature and flow settings
are presented in Figure C5. The denuder performance was also evaluated as part of the California
Research at the Nexus of Air Quality and Climate Change campaign in Bakersfield during June-
July 2010.
4.4 Evaluation results 4.4.1 Thermal desorption and transfer efficiency
Tests of the thermal desorption from the F-CTD were first conducted using a 15 cm long
section of unpassivated SS tube as the FT. Figure 4.2 shows the recovery of n-pentadecane
(C15H32, a gas-phase alkane) and n-tritriacontane ( C33H68, a particle-phase alkane) as a function
of the thermal desorption flow rate (recoveries of the full range of n-alkanes are shown in Figure
C6). The recovery of n-tritriacontane was significantly enhanced by increasing the thermal
desorption flow rate up to 150 ml/min. The recovery of n-pentadecane decreased with increasing
the desorption flow rate, which was attributed to its breakthrough from the unpassivated SS FT.
The dependence of the recovery on the desorption flow rate was also evaluated with two
other types of FTs made of 15 cm long GC columns (MXT-5 0.53mm OD, 3 and 5 µm film
thickness). While the recovery of > C20 n-alkanes was observed to be similar for all three types
of FTs under the same thermal desorption method; the recovery of n-alkanes with carbon
number ≤ 20 from the FTs made of the SS GC columns was significantly different from the FT
made of the unpassivated SS tube (Figure 4.3a). The relationship between the recovery and
carbon number from the FTs made of GC columns exhibited a steeper drop, relative to the
unpassivated SS tube in the lower end of carbon numbers. The steeper drop reduces the number
of compounds whose recoveries would be estimated by interpolating the recovery curve of n-
alkanes. Additionally, the recovery of untested compounds from the FT made of a section of a
GC column can be derived using their retention time determined through the GC analysis and
the recovery curve constructed using the recovery and retention time of n-alkanes. The thicker
film (5 µm) FT improved the recovery of more volatile n-alkanes, relative to the FT made of the
GC column with 3 µm film thickness, due to the increased capacity of the film to trap organics.
The recovery of < C18 n-alkanes from the FT was optimized using the FT made of a
section of the GC column with the 5 µm film thickness. The optimal recovery for SVOCs was
achieved when the length of the FT was increased to 50 cm and the total volume of desorption
flow was reduced by shortening the total desorption time from 18 to 14 minutes and by using a

51
two step purge with a flow of 10 ml/min for 6 minutes followed by a higher flow of 150 ml/min
for 8 minutes. With the two step purge and 50 cm long FT, the recovery of n-tetradecane (C14H30)
from the FT was about 40%, while the recovery of C15-C26 alkanes was above 95% (Figure 4.3b)
and C27-C32 was 50-90% (Figure C6). Assuming a Gaussian elution profile, we estimate that
recovering close to 100% of n-tetradecane would require doubling the length of the FT,
improvements for more volatile components would best be achieved through redesign of the FT
housing to facilitate active cooling.
4.4.2 SVOC collection by the F-CTD The upper limit for losses of collected organics due to volatilization was evaluated using
the thermal desorption transfer method. The average recovery (n = 5) of most compounds was
around 100% after a 30 min zero air purge (Figure 4.4a). The recovery of each compound with a
90 min purge was approximately the same as with a 30 min purge and the average recovery of all
compounds after 30 min and 90 min purges was 0.99 ± 0.02 and 0.99 ± 0.05, respectively.
Except for the concentrations listed in Table B1, volatilization of collected n-alkanes from the F-
CTD was evaluated at concentrations of both 16.7 ng/m3 and 66.7 ng/m
3 for 30 min ambient
sampling. This range of concentrations was chosen to mimic the ambient concentration range of
n-pentadecane (0 to 55 ng/m3) reported by Fraser et al. (1997). The fraction of each compound
observed to be retained on the F-CTD was in the range of 0.9 to 1.05. Since organic compounds
with lower vapor pressures show stronger adsorption constants on the surface of sampling
substrates (Goss and Schwarzenbach, 1998), we conclude that losses due to volatilization from
the surface of the F-CTD are negligible for organics with vapor pressures lower than n-
tetradecane under these sampling conditions.
The overall CE of the F-CTD for gas-phase organics was directly evaluated using the
evaporation transfer method. All compounds had CE in the range of 0.8 to 1.0 for 30 min
simulated ambient sampling, with the exceptions of 1-tridecanal and 2-pentadecanone
(Figure 4.4b). A similar overall CE was also observed for 90 min simulated ambient sampling
and the average ratio of overall CE for all compounds between 30 min and 90 min simulation
was 1.00 ± 0.05 (Figure 4.4b). The similar overall CE for all other compounds observed in both
30 min and 90 min simulation demonstrates that the F-CTD is capable of quantitative
measurements of SVOCs with vapor pressures lower than n-tetradecane for 90 min sampling at
10 L/min.
It's unclear what caused the lower measured overall CE for 1-tridecanal and 2-
pentadecanone. The diffusivity of 1-tridecanal and 2-pentadecanone is larger than most other
compounds, such as n-heptadecane, yet the recovery of n-heptadecane is close to 100% in the
same evaluation. Additionally, we have demonstrated that the losses of collected organics due to
volatilization are negligible. However, the measured overall CE was reproducible allowing for an
empirical correction.
4.4.3 Particle collection efficiency by the F-CTD
Particle collection efficiencies for the F-CTD are presented in Appendix C (Figures C7
and C8). Mobility based measurements with test aerosols data show collection of 94% - 100%,
with a minimum at 100 nm diameter for sampling at 10 L/min (Figure C7). Optical counter data
with ambient particles show a similar profile, but with a minimum CE of 90% at 100 nm (Figure

52
C8). On a mass basis, the average mass CE for PM1.0 ambient particles was 98% as estimated
from the upstream and downstream particle volume distribution. In contrast to the particle CE of
the original I-CTD which had a 50% cut-point at 0.1 µm, the F-CTD improved the CE of
ultrafine particles to over 90%.
4.4.4 Denuder vapor collection and particle penetration
For atmospheric measurements, the concentration of gas-phase organics measured
downstream of a Teflon filter followed by the denuder was less than 1% of that measured
downstream of the Teflon filter alone, indicating a CE of over 99%. Moreover, these
measurements were observed to be stable for more than a month of continuous ambient sampling
during the California Research at the Nexus of Air Quality and Climate Change campaign in
Bakersfield during June-July 2010 (See Appendix A, Figure A1). Average losses of particles
inside the denuder were less than 10% by number for particle sizes spanning the range
0.05~1.00 μm (See Appendix A, Figure A2).
4.4.5 Measurements of ambient air
The stability of SV-TAG for ambient run of 3 days was evaluated by examining the
consistency of internal standards (ISs) injected with each sample. As shown in Figure 4.5, the
variability of an IS around its mean value was within 10 % for the more volatile IS (hexadecane-
d34, eicosane-d42, and phenanthrene-d8). The range of variability for later eluting internal
standards, such as n-tetracosane-d50, was greater and was found to be strongly related to changes
in the total organics collected by the F-CTD (organic loading) (Figure C9). The effect of the
organic loading on the recovery of individual compounds has been reported in measurements of
ambient organic aerosol with a previous version of the TAG (Lambe et al., 2010) and an
independent study of thermal desorption of organics from charcoal (Senf and Frank, 1990). The
observed relationship between the variability of each IS and the organic loading establishes the
need to use ISs introduced on the top of ambient samples to correct for the effect of varying
organic loadings. It should be noted that the effect of the organic loading could be overestimated
in the current system because ISs were introduced into the F-CTD from its downstream side and
thus increasing the surface area to which internal standards were exposed, relative to the ambient
samples collected on the upstream surface. The injection of internal standards will be changed in
future designs to better mimic ambient sampling.
A pair of undenuded and denuded samples are shown in Figure 4.6a. Over one hundred
compounds were identified in the undenuded sample using authentic standards and according to
the best matches available with the NIST2008 mass spectral database. The identified compounds
span a broad vapor pressure range and many different functional groups, such as alkanes, acids
and aromatics. For example, the observed n-alkanes demonstrate the wide vapor pressure range
from SVOCs to particle-phase organics that are possible to detect and quantify with this SV-
TAG instrument and they also highlight the capability to quantify gas to particle partitioning of
organic compounds (Figure 4.6b). Though the undenuded and denuded samples were not
collected simultaneously, the previous version of the TAG has demonstrated that this sampling
strategy is able to capture the variability of gas/particle partitioning in a long timeline of
observations (Zhao et al., 2012).

53
Some of the identified compounds, which are predominantly present in the gas phase, can
be used as organic markers to provide observational constraints on the abundance of primary
emissions of gas-phase SVOCs. Pristane and phytane are potential tracers for the emissions of
SVOCs from diesel and gasoline powered vehicles (Fraser et al., 1997; Schauer et al., 1999;
2002). Other identified organic compounds, such as phthalic acid, 6, 10, 14-trimethyl-2-
pentadecanone, alkyl cyclohexanes and dibenzothiophene that are frequently used as source
markers for organic aerosol in source apportionment models are traditionally considered to be
only present in particles (e.g. Shrivastava et al., 2007). However, our observations of gas/particle
partitioning of these compounds clearly show that they are present in both gas and particle
phases as SVOCs. With the SV-TAG, we can clearly separate and quantify both the gas phase
and particle phase abundance of these compounds, and thus investigate their partitioning and use
them with less uncertainty for source apportionment with hourly resolution.
The measured abundance of gas phase organics was about an order of magnitude larger
than the particle-phase organics in Berkeley CA over the SVOC range observed by the SV-TAG.
The gas-phase organics, determined by the difference between the total (undenuded) and
particle-phase (denuded) organics, were dominant early in the chromatogram and mostly formed
an unresolved complex mixture (Figure 4.6a). The sum of measured n-alkanes (C14-C20), which
were dominantly present in the gas phase, accounted for ~7% of total measured organics in the
same retention time range as n-alkanes (C14-C20), defined as high-volatility SVOCs which were
dominantly present in the gas phase and calculated by integrating the total ion in the retention
time range of n-alkanes (C14-C20). The sum of measured of n-alkylcyclohexanes (C14-C20)
accounted for less than 1% of high-volatility SVOCs. The upper limit of the contribution from
straight-chain and branched alkanes to high-volatility SVOCs was estimated to be ~32% by
assuming that m/z 57 (C4H9+) was just contributed by straight-chain and branched alkanes. This
restricts the upper limit for branched alkanes to be ~ 25% of measured high-volatility SVOCs
and indicates that branched hydrocarbons likely made up a substantial fraction of organics in the
ambient air in Berkeley, CA.
4.5 Summary and atmospheric implications In this chapter, we demonstrated that the SV-TAG is capable of hourly automated
quantitation of speciated gas- and particle-phase organics with their vapor pressure lower than
tetradecane (C14). The recovery of n-alkanes relative to eicosane (C20) is 40% for C14, 95-100%
for C15-C26 and 50-90% for C27-C32. The recovery of individual compounds during the ambient
measurements can be tracked and corrected using ISs introduced into each sample. The F-CTD
cell efficiently collects the entire particle size range of PM2.5 with collection efficiency near
100%, except for a slight dip to ~90% in a narrow range around 0.1 µm. The SV-TAG facilities
quantitative measurements of the gas to particle partitioning of SVOC compounds through a
denuder difference method. We also showed that traditional molecular markers for organic
aerosol can be routinely measured by the SV-TAG with minimal sampling artifacts. We
observed that many traditional organic aerosol markers are actually SVOCs with a significant
fraction in the gas phase, which has important implications for the use of these organic tracers in
source apportionment models. The SV-TAG is now ready for field deployments and will provide
unique datasets for the study of emissions, transformation, and partitioning of SVOCs and for

54
studies of SOA formation and transformation in the atmosphere over hourly to seasonal
timescales.
4.6 References Chan, A. W. H., Kautzman, K. E., Chhabra, P. S., Surratt, J. D., Chan, M. N., Crounse, J. D.,
Kurten, A., Wennberg, P. O., Flagan, R. C., and Seinfeld, J. H. (2009). Secondary Organic
Aerosol Formation from Photooxidation of Nathphalene and Alkylnaphthalenes: Implications
for Oxidation of Intermediate Volatility Organic Compounds (IVOCs). Atmos. Chem. Phys.,
9:3049-3060.
Cui, W., Eatough, D. J., and Eatough, N. L. (1998). Fine Particulate Organic Material in the Los
Angeles Basin - I: Assessment of the High-Volume Brigham Yong University Organic
Sampling System, BIG BOSS. J. Air &Waste Manage. Assoc., 48:1024-1037.
de Gouw, J. A., Middlebrook, A. M., Warneke, C., Ahmadov, R., Atlas, E. L., Bahreini, R.,
Blake, D. R., Brock, C. A., Brioude, J., Fahey, D. W., Fehsenfeld, F. C., Holloway, J. S.,
Henaff, M. Le, Lueb, R. A., Mckeen, S. A., Meagher, J. F., Murphy, D. M., Paris, C., Parrish,
D. D., Perring, A. E., Pollack, I. B., Ravishankara, A. R., Robinson, A. L., Ryerson, T. B.,
Schwarz, J. P., Spackman, J. R., Srinivasan, A., and Watts, L. A. (2011). Organic Aerosol
Formation Downwind from the Deepwater Horizon Oil Spill. Science, 331:1295-1299.
Dzepina, K., Volkamer, R. M., Madronich, S., Tulet, P., Ulbrich, I. M., Zhang, Q., Cappa, C. D.,
Ziemann, P. J., and Jimenez, J. L. (2009). Evaluation of Recently-Proposed Secondary
Organic Aerosol Models for A Case Study in Mexico City. Atmos. Chem. Phys., 9:5681-5709.
Eatough, D. J., Wadsworth, A., Eatough, D. A., Crawford, J. W., Hansen, L. D. and Lewis, E. A.
(1993). A Multiple-System, Multichannel Diffusion Denuder Sampler for the Determination
of Fine-Particulate Organic Material in the Atmosphere. Atmos. Environ., 27:1213-1219.
Fraser, M. P., Cass, G. R., Simoneit, B. R. T., and Rasmussen, R. A. (1997). Air Quality Model
Evaluation Data for Organics. 4. C2-C36 Non-Aromatic Hydrocarbons. Environ. Sci.
Technol., 31:2356-2367.
Goldstein, A. H., and Galbally, L. E. (2007). Known and Unexplored Organic Constituents in the
Earth’s Atmosphere. Environ. Sci. Technol., 41:1514-1512.
Goss, K. U. and Schwarzenbach, R. P. (1998). Gas/Solid and Gas/Liquid Partitioning of Organic
Compounds: Critical Evaluation of the Interpretation of Equilibrium Constants. Environ. Sci.
Technol., 32:2025-2032.
Grieshop, A. P., Logue, J. M., Donahue, N. M., and Robinson, A. L. (2009). Laboratory
Investigation of Photochemical Oxidation of Organic Aerosol from Wood Fires 1:
Measurement and Simulation of Organic Aerosol Evolution. Atmos. Chem. Phys., 9:1263-
1277.
Gundel, L. A., Lee, V. C., Mahanama, K. R. R., Stevens, R. K., and Daisey, J. M. (1995). Direct
Determination of the Phase Distributions of Semi-Volatile Polycyclic Aromatic Hydrocarbons
Using Annular Denuders. Atmos. Environ., 29(14):1719-1733.
Hodzic, A., Jimenez, J. L., Madronich, S., Canagaratna, M. R., DeCarlo, P. F., Kleinman, L., and
Fast, J. (2010). Modeling Organic Aerosols in A Megacity: Potential Contribution of Semi-
Volatile and Intermediate Volatility Primary Organic Compounds to Secondary Organic
Aerosol Formation. Atmos. Chem. Phys., 10:5491-5514.
Isaacman, G., Wilson, K. R., Chan, A. W. H., Worton, D. R., Kimmel, J. R., Nah, T., Hohaus, T.,
Gonin, M., Kroll, J. H., Worsnop, D. R. and Goldstein, A. H. (2012). Improved Resolution of

55
Hydrocarbon Structures and Constitutional Isomers in Complex Mixtures Using Gas
Chromatography-Vacuum Ultraviolet-Mass Spectrometry. Anal. Chem., 84:2335-2342.
Jang, M. S., Czoschke, N. M., Lee, S. and Kamens, R. M. (2002). Heterogeneous Atmospheric
Aerosol Production by Acid-catalyzed Particle-phase Reactions. Science, 298:814-817.
Kamens, R. M., and Coe, D. L. (1997). A Large Gas-Phase Stripping Device to Investigate Rates
of PAH Evaporation from Airborne Diesel Soot Particles. Environ. Sci. Technol., 31:1830-
1833.
Kreisberg, N. M., Hering, S. V., Williams, B. J., Worton, D. R. and Goldstein, A. H. (2009).
Quantification of Hourly Speciated Organic Compounds in Atmospheric Aerosols, Measured
by an In-Situ Thermal Desorption Aerosol Gas Chromatograph (TAG). Aerosol Sci. Tech.,
43:38-52.
Kreisberg, N. M., Worton, D. R., Zhao, Y., Ruehl, C. R., Goldstein, A. H., and Hering, S. V.
(2012). Development of an Automated High Temperature Valve-less Injection System for in-
situ Gas Chromatography. Prepared for submission to Journal of Chromatography A
Krieger, M. S. and Hites, R. A. (1992). Diffusion Denuder for the Collection of Semivolatile
Organic-Compounds. Environ. Sci. Technol., 26:1551-1555.
Lambe, A. T., Chacon-Madrid, H. J., Nguyen, N. T., Weitkamp, E. A., Kreisberg, N. M., Hering,
S. V., Goldstein, A. H., Donahue, N. M. and Robinson, A. L. (2010). Organic Aerosol
Speciation: Intercomparison of Thermal Desorption Aerosol GC/MS (TAG) and Filter-Based
Techniques. Aerosol Sci. Tech., 44:141-151.
Lim, Y. B., and Ziemann, P. J. (2009). Effects of Molecular Structure on Aerosol Yield from OH
Radical-Initiated Reactions of Linear, Branched, and Cyclic Alkanes in the Presence of NOx.
Environ. Sci. Technol., 43:2328-2334.
Mader, B. T. and Pankow, J. F. (2001). Gas/Solid Partitioning of Semivolatile Organic
Compounds (SOCs) to Air Filters. 3. An Analysis of Gas Adsorption Artifacts in
Measurements of Atmospheric SOCs and Organic Carbon (OC) When Using Teflon
Membrane Filters and Quartz Fiber Filters. Environ. Sci. Technol., 35:3422-3432.
Na, K., Song, C., Switzer, C. and Cocker, D. R. (2007). Effect of Ammonia on Secondary
Organic Aerosol Formation from Alpha-Pinene Ozonolysis in Dry and Humid Conditions.
Environ. Sci. Technol., 41:6096-6102.
Presto, A. A., Miracolo, M. A., Donahue, N. M., and Robinson, A. L. (2010). Secondary Organic
Aerosol Formation from High-NOx Photo-Oxidation of Low Volatility Precursors: n-Alkanes.
Environ. Sci. Technol., 44:2029-2034.
Presto, A. A., C. J. Hennigan, N. T. Nguyen, and A. L. Robinson (2012), Determination of
Volatility Distributions of Primary Organic Aerosol Emissions from Internal Combustion
Engines Using Thermal Desorption Gas Chromatography Mass Spectrometry. Aerosol Sci.
Technol., 46(10), 1129-1139.
Possanzini, M., Di Palo, V., Gigliucci, P., Concetta, M., Sciano, T. and Cecinato, A. (2004).
Determination of Phase-Distributed PAH in Rome Ambient Air by Denuder/GC-MS Method.
Atmos. Environ., 38:1727-1734.
Robinson, A. L., Donahue, N. M., Shrivastava, M. K., Weitkamp, E. A., Sage, A. M., Grieshop,
A. P., Lane, T. E., Pierce, J. R., and Pandis, S. N. ( 2007). Rethinking Organic Aerosols:
Semivolatile Emissions and Photochemical Ageing. Science, 315:1259-1262.
Rowe, M. D., and Perlinger, J. A. (2010). Performance of a High Flow Rate Thermally
Extractable Multicapillary Denuder for Atmospheric Semivolatile Organic Compound
Concentration Measurement. Environ. Sci. Technol., 44:2098-2104.

56
Schauer, J. J., Kleeman, M. J., Cass, G. R., and Simoneit, B. R. T. (1999). Measurement of
Emissions from Air Pollution Sources. 2. C1 through C30 Organic Compounds from Medium
Duty Diesel Trucks. Environ. Sci. Technol., 33:1578-1587.
Schauer, J. J., Kleeman, M. J., Cass, G. R., and Simoneit, B. R. T. (2002). Measurement of
Emissions from Air Pollution Sources. 5. C1-C32 Organic Compounds from Gasoline-
Powered Motor Vehicles. Environ. Sci. Technol., 36:1169-1180.
Senf, L. and Frank, H. (1990). Thermal-Desorption of Organic Pollutants Enriched on Activated
Carbon.5. Desorption Behavior and Temperature Profile. J. Chromatogr., 520:131-135.
Shrivastava, M. K., Subramanian, R., Rogge, W. F. and Robinson, A. L. (2007). Sources of
Organic Aerosol: Positive Matrix Factorization of Molecular Marker Data and Comparison of
Results from Different Source Apportionment Models. Atmos. Environ., 41:9353-9369.
Shrivastava, M. K., Lane, T. E., Donahue, N. M., Pandis, S. N., and Robinson, A. L. (2008).
Effects of Gas Particle Partitioning and Aging of Primary Emissions on Urban and Regional
Organic Aerosol Concentrations. J. Geophys. Res., 113, D18301, doi:10.1029/2007JD009735.
Sihabut, T., Ray, J., Northcross, A. and McDow, S. R. (2005). Sampling artifact estimates for
alkanes, hopanes, and aliphatic carboxylic acids. Atmos. Environ., 39:6945-6956.
Simcik, M. F., Franz, T. P., Zhang, H. X. and Eisenreich, S. J. (1998). Gas-Particle Partitioning
of PCBs and PAHs in the Chicago Urban and Adjacent Coastal Atmosphere: States of
Equilibrium. Environ. Sci. Technol., 32:251-257.
Storey, J. M., Luo, W., Isabelle, L. M., and Pankow, J. F. (1995). Gas/Solid Partitioning of
Semivolatile Organic Compounds to Model Atmospheric Solid Surfaces as a Function of
Relative Humidity. 1. Clean Quartz. Environ. Sci. Technol., 29:2420-2428.
Subramanian, R., Khlystov, A. Y., Cabada, J. C. and Robinson, A. L. (2004). Positive and
Negative Artifacts in Particulate Organic Carbon Measurements with Denuded and
Undenuded Sampler Configurations. Aerosol Sci. Tech., 38:27-48.
Tobias, D. E., Perlinger, J. A., Morrow, P. S., Doskey, P. V. and Perram, D. L. (2007). Direct
Thermal Desorption of Semivolatile Organic Compounds from Diffusion Denuders and Gas
Chromatographic Analysis for Trace Concentration Measurement. J. Chromatogr., A 1140:1-
12.
Tolocka, M. P., Jang, M., Ginter, J. M., Cox, F. J., Kamens, R. M. and Johnston, M. V. (2004).
Formation of Oligomers in Secondary Organic Aerosol. Environ. Sci. Technol., 38:1428-1434.
Tsimpidi, A. P., Karydis, V. A., Zavala, M., Lei, W., Molina, L., Ulbrich, I. M., Jimenez, J. L.,
and Pandis, S. N. (2010). Evaluation of the Volatility Basis-Set Approach for the Simulation
of Organic Aerosol Formation in the Mexico City Metropolitan Area. Atmos. Chem. Phys.,
10:525-546.
Turpin, B. J., Saxena, P., and Andrews, E. (2000). Measuring and Simulating Particulate
Organics in the Atmosphere: Problems and Prospects. Atmos. Environ., 34:2983-3013.
Volkamer, R., Jimenez, J. L., San Martini, F., Dzepina, K., Zhang, Q., Salcedo, D., Molina, L. T.,
Worsnop, D. R. and Molina, M. J. (2006). Secondary organic aerosol formation from
anthropogenic air pollution: Rapid and higher than expected. Geophys. Res. Lett., 33:L17811.
Weitkamp, E. A., Sage, A. M., Pierce, J. R., Donahue, N. M., and Robinson, A. L., (2007).
Organic aerosol formation from photochemical oxidation of diesel exhaust in a smog chamber.
Environ. Sci. Technol., 41:6969-6975.
Williams, B. J., Goldstein, A. H., Kreisberg, N. M. and Hering, S. V. (2006). An In-Situ
Instrument for Speciated Organic Composition of Atmospheric Aerosols: Thermal Desorption
Aerosol GC/MS-FID (TAG). Aerosol Sci. Tech., 40:627-638.

57
Williams, B. J., Goldstein, A. H., Kreisberg, N. M. and Hering, S. V. (2010). In Situ
Measurements of Gas/Particle-Phase Transitions for Atmospheric Semivolatile Organic
Compounds. P. Natl. Acad. Sci., 107:6676-6681.
Zhao, Y., Kreisberg, N.M., Worton, D.R., Isaacman, G., Weber, R.J., Markovic, M.Z.,
Vandenboer, T.C., Liu, S., Day, D.A., Murphy, J.G., Russell, L.M., Hering, S.V. and
Goldstein, A.H. (2012). Insights into SOA Formation Mechanisms from Measured
Gas/Particle Parititoning of Specific Organic Tracer Compounds. submitted to Environmental
Science and Technology.

58
4.7 Tables and figures
Figure 4.1 a) Schematic of the SV-TAG system with the major components labeled. (b)
Schematic of the F-CTD, FT and valveless injector showing the flow direction, valve states and
temperature states in each mode of operation.

59
Figure 4.2 Recovery of representative compounds as a function of flow rate through the F-CTD
and an unpassivated SS FT.

60
Figure 4.3 Recoveries of n-alkanes as a function of carbon number (≤ 26) measured with
different FTs . a) Selection of FT materials; b) Optimization of FT length and purge method. For
the one-step purge, thermal desorption flow was set to 150 ml/min for 18 min. For the two-step
purge, thermal desorption flow rate was set to 10 ml/min for 6 min then 150 ml/min for 8 min.
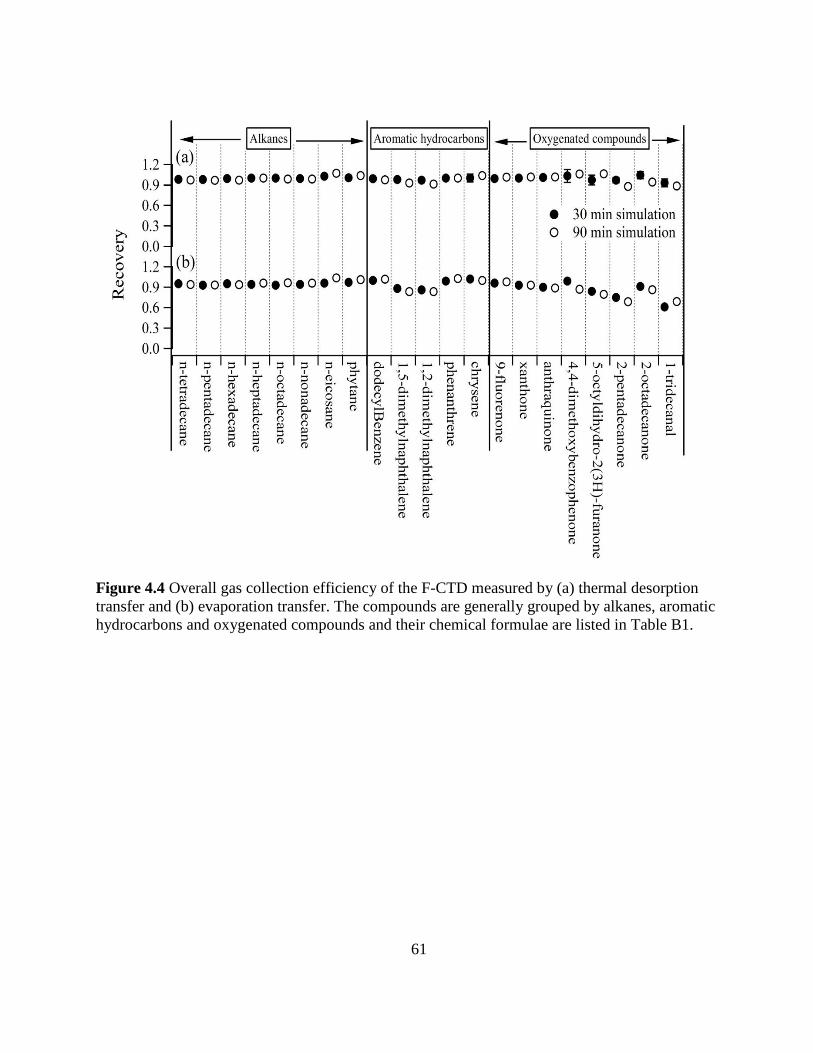
61
Figure 4.4 Overall gas collection efficiency of the F-CTD measured by (a) thermal desorption
transfer and (b) evaporation transfer. The compounds are generally grouped by alkanes, aromatic
hydrocarbons and oxygenated compounds and their chemical formulae are listed in Table B1.
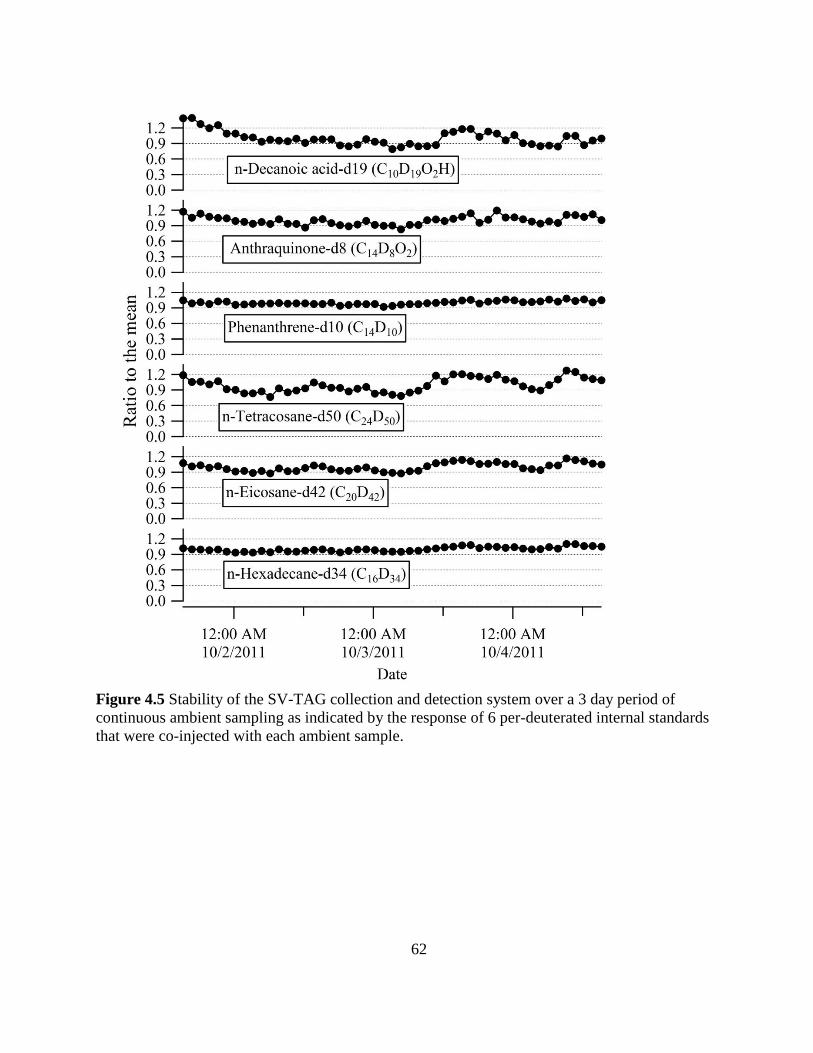
62
Figure 4.5 Stability of the SV-TAG collection and detection system over a 3 day period of
continuous ambient sampling as indicated by the response of 6 per-deuterated internal standards
that were co-injected with each ambient sample.

63
Figure 4.6 (a) Total ion chromatograms of undenuded (black) and denuded (green) ambient
samples collected in Berkeley, CA. The sampling volumes were 0.5 m3 each, collected at 10
L/min for 50 minutes, and the denuded sample was collected 40 minutes after the undenuded
sample; two large peaks in the chromatogram of the denuder sample were peaks of column bleed.
(b) measured concentrations of n-alkanes (left axis) and particle phase fraction (right axis)
calculated by dividing the particle-phase concentration (denuded sample) by the total
concentration (undenuded sample).

64
Chapter 5
Conclusions
5.1 Summary In this thesis, a novel instrument (SV-TAG) has been successfully developed to
quantitatively measure SVOCs and OA in the atmosphere. The design was based on the
principles of thermal desorption followed by GC/MS analysis (TAG). Ambient measurements of
speciated OA and SVOCs were made with this SV-TAG at its two development stages: 1)
improved separation of gas and particle phase organics and 2) quantitative collection and transfer
of SVOCs to the GC/MS. Insights into the various source contributions to OA and SOA
formation were gained through ambient measurements made in Bakersfield, CA during CalNex
campaign following the first development stage. The capability of the SV-TAG to quantitatively
measure speciated SVOCs was demonstrated by laboratory evaluation and ambient
measurements in Berkeley, CA following the second development stage.
5.1.1 Gas-to-particle partitioning (SOA formation)
In the first stage of development of the SV-TAG, a denuder was added into the sampling
inlet to improve separation of gas- and particle-phase organics. However, the original TAG
impactor-based cell, designed for collection of particles but had reduced collection of organic
vapors, was used. Consequently, the overall fraction of organic compounds in the particles was
overestimated. After the improvement of addition of a denuder into its sampling inlet, the upper
limit of the overestimation of fractions of organic compounds in particles was able to be
estimated using observations of n-alkanes and consequently investigation of different pathways
of gas-to-particle partitioning of oxygenated compounds was allowed to be done.
Measurements of gas/particle partitioning of phthalic acid, pinonaldehyde and 6, 10, 14-
trimethyl-2-pentadecanone were selected to explore the pathways of gas-to-particle partitioning
whereby SOA was formed. The results indicate that absorption into particles is the dominant
pathway for 6, 10, 14-trimethyl-2-pentadecanone to contribute to SOA in the atmosphere.
Absorption of gas-phase phthalic acid into particles can contribute to observed particle-phase
phthalic acid concentrations, but the major pathway forming particle-phase phthalic acid is likely
through reactions with gas-phase ammonia to form condensable salts. The observations of
pinonaldehyde in the particle phase when inorganic acids were neutralized indicate that inorganic
acids are not required for occurrence of reactive uptake of pinonaldehyde into particles. The
laboratory observed effect of aerosol acidity on reactive uptake of pinonaldehyde into particles
was not shown by the relationship between the cation-to-anion ratio and the fraction of
pinonaldehyde observed in ambient particles. The relationship between particle-phase
pinonaldehyde and RH suggests that aerosol water content likely plays a significant role in the
formation of particle-phase pinonaldehyde. These results highlight the needs to investigate the
effects of RH and organic acids on the reactive uptake of pinonaldehyde and other aldehydes
onto neutral seed particles in chamber experiments.
Though some of the major pathways of gas-to-particle partitioning were successfully
investigated without quantified gas-phase organics, an instrument capable of quantitative

65
measurements of gas/particle partitioning is desirable to allow direct comparisons of partitioning
coefficients between ambient and laboratory measurements, to provide accurate
parameterizations of gas/particle partitioning in SOA models, and to provide quantitative data on
SVOC concentrations in the atmosphere.
5.1.2 Major source contributions to OA
In Chapter 2, many compounds, including traditionally SOA tracers, have been shown to
be present in both gas and particle phases. With the use of a denuder in the sampling inlet
(described in Chapter 2), temporal variability of these tracers purely in the particles can be
directly quantified. In Chapter 3, the measured particle phase concentrations were used in PMF
analysis to determine POA and SOA sources contributing the OA in Bakersfield, CA during
2010 CalNex.
Six OA sources were identified, including a POA source, a mixture of OA sources, and
four types of SOA sources. Local vehicles were suggested to significantly contribute to POA.
Four types of SOA (1-4) displayed distinct diurnal profiles. Each of SOA1-3 displayed an
enhancement in its contributions to OA at different time during the day. SOA1 and 2 were
mainly local while SOA3 was more regional, transported. SOA4 mainly occurred during the
night and included contributions from both anthropogenic and biogenic SOA contributions.
SOA was the dominant component of OA, with four types of SOA accounting for an
combined 72% of OA, varying diurnally from 66% at night to 78% during the day. Regional
SOA (SOA3, 56%) was the largest contributor to OA during the afternoon and SOA4 (nighttime
SOA, 39%) was the largest one during the night. A clear split between local and regional SOA
during the day and anthropogenic and biogenic SOA during night cannot be made in this study.
However, the results indicate that regional SOA had a larger contribution to OA than local SOA
during the day and biogenic SOA contributed a significant fraction of OA during the night.
The best control strategy for each type of SOA (SOA1-4) to enable effective reductions
in the regional OA concentration may be different. The control of SOA precursor emissions on
both local and regional scales are needed during the day, but control of regional SOA precursor
emissions is likely to be most effective in the afternoon. At night, our observations suggest that
biogenic SOA could contribute a significant fraction of total OA, yet its contribution is not well
constrained. Consequently, it leaves it unclear if control of anthropogenic SOA precursor
emissions can efficiently reduce OA concentrations. In addition to organic precursors of SOA,
other species involved in SOA formation can be controlled to reduce OA concentrations. The
major pathway is indicated to be absorptive gas/particle partitioning, but other formation
pathways, including reactions between organic acids and ammonia to form condensable salts and
reactive uptake of carbonyls onto particles, also played a significant role in SOA formation.
Therefore, reductions in emissions of the species involved in the SOA formation, such as gas-
phase ammonia, should also reduce the SOA concentration in the atmosphere in this region.
However, the efficiency to reduce OA by control of ammonia needs further investigation because
reductions in ammonia emissions could lead to high aerosol acidity and subsequently increase
nighttime SOA formaiton.
5.1.3 SV-TAG and ambient measurements

66
As described in Chapter 2, the original TAG with improved gas/particle separation is able
to investigate gas/particle partitioning, but it is not capable of quantification of speciated SVOCs
and the gas/particle partitioning coefficient constants which are critical to providing
observational constraints on abundance and speciation of SVOCs and parameterize the
gas/particle partitioning in models. In response to these needs, a new collection and thermal
desorption system was developed, enabling the SV-TAG to quantitatively collect and transfer
speciated SVOCs to the GC/MS.
The development and evaluation of the SV-TAG was presented in Chapter 4. The major
components differing from the original TAG include: (1) an activated carbon denuder, (2) a
metal-fiber filter collection and thermal desorption cell (F-CTD), and (3) a valve-less injection
interface (VLI) with a secondary focusing trap (FT). These new components enabled the
quantitative measurements of speciated SVOCs with vapor pressures lower than n-tetradecane
(C14) within a 90-min sampling period.
Ambient measurements in Berkeley CA showed that the abundance of gas-phase organics
was an order of magnitude larger than the particle-phase organics over the SVOC vapor pressure
range. Of these measured organics, the sum of measured n-alkanes (C14-C20) accounted for ~7%
of measured high volatility SVOCs and the sum of measured of n-alkylcyclohexanes (C14-C20)
accounted for less than 1% of measured high volatility SVOCs. The upper limit of abundance for
branched alkanes was estimated to be ~ 25% of measured high volatility SVOCs, indicating that
branched hydrocarbons accounted for a substantial fraction of organics in the ambient air.
Tracers in the vapor pressure range of high volatility of SVOCs, such as phytane and
pristane, were quantified in the ambient samples. Other identified organic compounds
traditionally considered to be only present in particles were observed to be present in both gas
and particle phases. With the SV-TAG, these tracers can be quantitatively measured and
subsequently used in source apportionment models for both gas and particle phase organics.
In summary, this thesis has improved our understanding of SOA formation and source
contributions to OA by developing a novel instrument capable of time-resolved measurements of
gas- and particle-phase organic species and applying it to ambient measurements. This thesis
work has provided direct evidence that multiple pathways of gas-to-particle partitioning of
organic compounds occur in the atmosphere, are compound-dependent and are different from the
standard absorptive/partitioning theory. This thesis also suggests effective control strategy to
reduce OA concentrations. The development of SV-TAG enables not only investigation of the
pathways of gas-to-particle partitioning with hourly time resolution, but also quantitatively
measurements of speciated SVOCs. These measurement capabilities open a avenue to quantify
the gas/particle partitioning in the atmosphere and provide observational constraints on the
abundance of SVOCs, and enable investigation the primary emissions of SVOCs.
5.2 Future work With the capability of the SV-TAG to quantitatively measure both gas- and particle-phase
organics in an automated, continuous mode of operation, further work can be done, including 1)
measurements of gas/particle partitioning; 2) source apportionment of SVOCs; 3) examination of

67
SOA formation and transformation using PMF in combination with SOA tracers, although
further improvements in the instrumentation are still needed.
5.2.1 Measurements of gas/particle partitioning
SOA formation, including oxidation of gas-phase organics and the pathways of gas-to-
particle partitioning of their oxidation products, has been mainly investigated in chamber
experiments wherein the thermodynamics of gas/particle partitioning may be different from that
in the atmosphere. Therefore, the unique capability of SV-TAG in measurements of gas/particle
partitioning in the atmosphere is a powerful tool to examine our understanding of SOA formation
in the atmosphere. Chapter 2 has shown that ambient measurements of gas/particle partitioning
enables identification of other pathways of gas-to-partitioning and the investigation of
parameters affecting gas/particle partitioning, but no quantitative constraints can be provided
from these measurements due to incomplete collection of gas-phase organics.
With the configuration described in Chapter 4, quantitative measurements of gas/particle
partitioning are able to be made to: 1) provide observational constraints on the mean molecular
weight of atmospheric OA and activity coefficients of organic compounds in atmospheric OA
whose gas-to-particle partitioning is through absorption; 2) identify the presence of other
pathways of gas-phase organics entering particles other than absorption into particles and 3)
subsequently provide observational constraints on the contributions of individual organic
compounds to SOA and parameterization of factors affecting these pathways. Additionally, using
the SV-TAG, the oxidation of SOA precursors can now be better mapped through measurements
of gas/particle partitioning of their oxidation products and consequently provide constraints on
oxidation mechanisms used in SOA models.
5.2.2 Measurements of SVOCs
The need for measurements of atmospheric SVOCs to provide observational constraints
on speciation, abundance and partitioning of SVOCs was highlighted in the introduction of
Chapter 4. The chemical composition and abundance of SVOCs vary spatially owing to
difference in the composition of primary sources in different regions. Therefore, measurements
covering more regions are desirable. In addition to measurements of SVOCs in the atmosphere,
direct measurements of primary emission sources are needed for source apportionment of
SVOCs.
5.2.3 SOA formation and transformation
In combination with investigation of gas/particle partitioning in Chapter 2, Chapter 3 has
demonstrated that SOA formation and transport can be explored using PMF analysis of time-
resolved organic species. In this thesis, a novel approach to investigate SOA formation in the
atmosphere was presented providing insights into the discrepancies between modeled and
measured SOA. This approach needs to be applied to more areas to improve our understanding
of SOA formation and offer implications for improving air quality regulation.
5.2.4 Instrumentation
Gas/particle partitioning is currently determined by a denuder difference method wherein
the denuder is alternated into the sampling line every other run due to a single collection cell
employed in the configuration. Though the current configuration makes the collection and

68
thermal desorption system simple and is able to provide useful insights into SOA formation and
gas/particle partitioning, this sampling strategy could be improved to provide simultaneous
observations of gas and particle phases to examine in more detail how partitioning varies with
meteorological conditions, atmospheric chemistry and OA matrix. One future alternative which
can be tried is a dual-cell setup, in which one cell is used to collect particle-phase organics and
another is used to simultaneously collect total organics (gas-phase and particle-phase organics),
with sequential desorption and analysis through the GC/MS.
Chapter 4 has shown that current operating temperature of the FT is a limiting factor
which could be reduced to improve its recovery for small-molecular-weight compounds. Two
main factors affecting the temperature of the FT when it is trapping the organics desorbed from
the F-CTD are the temperature of the cooling air (room temperature) and the heat transfer from
the VL injector. The large thermal mass of the current heating block of the VL injector limits the
time required to ramp the temperature of the VL injector during the SV-TAG operation. If the
current configuration of the VL injector and FT is used, active cooling should be applied to the
FT to increase the higher volatility range of measureable species. Future work also should
include reducing the thermal masses of heating blocks of the VL injector and the contact surface
between the heating blocks for the VL and the FT.
Many potentially important SOA tracers, such as dicarboxylic acids, are typically too
polar to completely elute from the GC column. This severely limits the capability of SV-TAG to
quantify potentially dominant SOA tracers. The transmission efficiency of these polar
compounds through the GC can be increased by derivatization, such as methylation and
silylation. Future work should therefore include development of an on-line derivatization method
to improve the capability of SV-TAG to quantify more polar SOA tracers.
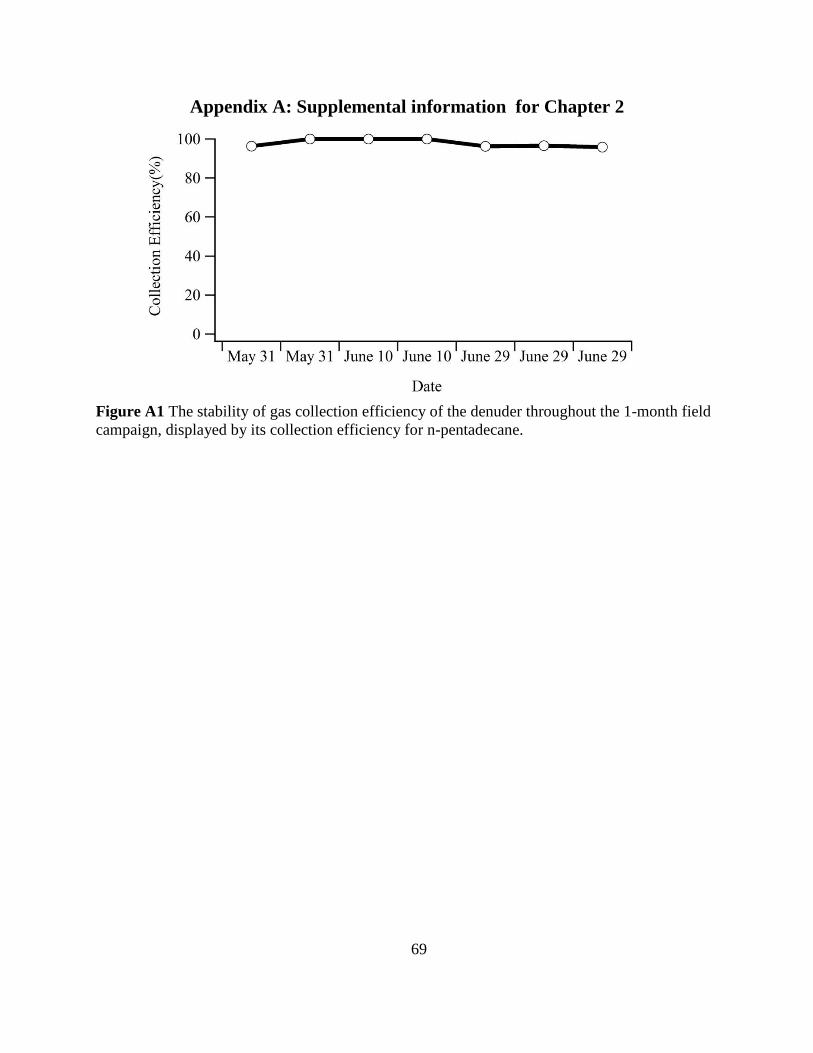
69
Appendix A: Supplemental information for Chapter 2
Figure A1 The stability of gas collection efficiency of the denuder throughout the 1-month field
campaign, displayed by its collection efficiency for n-pentadecane.

70
Figure A2 Particle losses inside the denuder.

71
Appendix B: Supplemental information for Chapter 3
Appendix B1 Effect of inclusion of gas-phase contributions to particle-
phase SVOCs on the PMF solution Many compounds present in the particle phase, especially SOA tracers, are SVOCs. As a
result of the utility of SVOCs in PMF analysis, inclusion of gas-phase contributions can bias
the temporal variability in particle-phase concentrations of these SVOCs and subsequently
lead to changes in correlations between different compounds which PMF analysis relies on to
extract different factors and explain the OA observations. In our study, the effect of gas-
phase contributions on the PMF solution, caused by gas-phase organic adsorption to the
collection cell when sampling in bypass mode (no denuder), is investigated by comparing the
same number of factors extracted from the same group of compounds with or without
inclusion of gas-phase contributions. The factor profiles from measurements of organics with
and without inclusion of gas-phase contributions are significantly different (Figure B2). To
visualize the difference caused by inclusion of gas-phase contributions, the correlation
between two factor profiles and the correlation between their time series were plotted against
each other. As shown in Figure B3, the difference in the temporal variability and chemical
composition of the factors are apparent for factor 1, 4, 5. Though the correlation coefficients
(r) for both temporal variability and chemical composition of the factor 2, 3, 6 are good, they
are still less than 0.8. This comparison establishes that the exclusion of gas-phase
contributions to SVOCs used in PMF analysis is crucial to achieving correct source
apportionment.

72
Appendix B2 Tables and figures
Figure B1 (a) The box plot of the relative residues determined using the difference between
reconstructed and measured OA divided by measured OA. The center line of each box is the
median of the data, the top and bottom of the box are 75th and 25th percentiles and top and
bottom whiskers are 90th and 10th percentiles. The data points are evenly distributed to each
interval. (b) the frequency of the atmospheric OA concentrations in each interval observed at
night.

73
Figure B2 Factor profiles extracted by PMF analysis from the same group of compounds
with and without inclusion of gas-phase contributions to the measured organic species.

74
Figure B3 Correlation of the timeline of observations and correlation of factor profile of the
corresponding factor extracted by PMF analysis from the dataset with or without inclusion of
gas-phase contributions. The labeled number refers to the factor number in Figure B2.

75
Appendix C: Supplemental information for Chapter 4
Appendix C1. Valve-less injection interface (VLI) operation
The VLI controls the helium gas flow direction in one of its two capillaries that serves to
connect the sampling and analysis sides of the system. This flow switch is controlled through the
vent and purge valves and by adjusting the pressure at the tee joining the two capillaries with the
GC column. Pressure balance is achieving using an electronic pressure controller (EPC) module
of the GC system (model 6890, Agilent, CA) and a fixed external pressure regulator on the purge
supply line. Normally, the helium carrier gas supplied by the EPC is split between the GC
column for sample analysis and the cell or the vent. During sample injection, the purge valve is
opened and the vent valve closed, resulting in transfer of the sample from the FT to the GC.
Appendix C2. Organic chemical analysis The chromatographic separation of desorbed organics is achieved using a GC (Agilent
6890) with a capillary column (Rxi-5Sil MS; 30 m length x 0.25 mm ID, 0.25 µm film thickness,
Restek). The GC oven temperature is increased at 15 °C/min from 45 °C to 150 °C then at
9 °C/min from 150 °C to 330 °C, and held at 330 °C for 4 minutes. Identification and
quantification are achieved using a quadrupole mass selective detector (Agilent 5973 MSD)
calibrated with authentic standards (Kreisberg et al., 2009) that are injected into the F-CTD. The
transfer efficiency and detector drift during ambient sampling are monitored by co-injection of
internal standards with each ambient run (Worton et al., 2012). The internal standards are
introduced into the downstream side of the F-CTD using an automatic liquid injection system
described elsewhere (Isaacman et al., 2011).
Appendix C3. Operating conditions for evaluations of overall CE
The operating conditions for thermal desorption transfer method are shown in Figure C3
and described as follows : 1) liquid standards were injected into the I-CTD; 2) liquid standards
were vaporized at 300 ºC and transferred to the F-CTD by helium carrier gas at 150 ml/min for
three minutes; 3) following completion of the transfer and after the I-CTD was cooled down to
room temperature, the F-CTD was purged by zero air at 10 L/min for 30 or 90 minutes; 4) after
the zero air purge, organics remaining in the F-CTD ("measured amount") were thermally
desorbed and transferred into the GC/MS for analysis. The amount of organics determined using
the same approach but without any zero air purging was defined as the reference amount. The
CE of the F-CTD for each compound was calculated by dividing the measured amount for each
component by its corresponding reference amount.
The operating conditions for the evaporation transfer method are shown in Figure C4 and
described as follows : 1) liquid standards were injected into the I-CTD; 2) standards evaporating
from the I-CTD at room temperature were transferred in 10 L/min zero air flow into the F-CTD;
3) after 30 minor 90 min collection, organics collected by the F-CTD were thermally desorbed
and introduced into the GC/MS while the I-CTD was maintained at room temperature; 4) after
the F-CTD was cooled back down to 28 °C, organics remaining on the I-CTD were thermally
desorbed and transferred into the F-CTD; 5) these less volatile organics collected by the F-CTD
were thermally transferred to the GC/MS. The CE for each compound was calculated as the sum

76
of the measured amount in both steps 3 and 5 divided by the reference amount for each
compound.
Appendix C4. Particle losses inside the denuder and particle collection
efficiency of the F-CTD Particle losses within the denuder and the particle collection efficiency (CE) of the F-
CTD were determined by measuring the difference between upstream and downstream ambient
particle number size distributions, measured by an optical particle spectrometer (Droplet
Measurements, model UHSAS) in the size range of ~0.05 to 1.00 m optical equivalent diameter
at 10 L/min sampling flow. The collection efficiency of the F-CTD for particles less than 0.05
m was measured by a home built scanning mobility particle sizer using TSI model 3081
differential mobility analyzer using laboratory generated particles in the range of ~30 to 340 nm.
The particles were generated by nebulizing dioctyl sebecate.
Appendix C5. Reference: Isaacman, G., Kreisberg, N. M., Worton, D. R., Hering, S. V. and Goldstein, A. H. (2011). A
versatile and reproducible automatic injection system for liquid standard introduction:
application to in-situ calibration. Atmos. Meas. Tech. 4:1937-1942.
Kreisberg, N. M., Hering, S. V., Williams, B. J., Worton, D. R. and Goldstein, A. H. (2009).
Quantification of Hourly Speciated Organic Compounds in Atmospheric Aerosols, Measured
by an In-Situ Thermal Desorption Aerosol Gas Chromatograph (TAG). Aerosol Sci. Tech.
43:38-52.
Worton, D. R., Kreisberg, N. M., Isaacman, G., Teng, A. P., McNeish, C., Gorecki, T., Hering, S.
V. and Goldstein, A. H. (2012). Thermal Desorption Comprehensive Two-Dimensional Gas
Chromatography: An Improved Instrument for In-Situ Speciated Measurements of Organic
Aerosols. Aerosol Sci. Tech. 46:380-393.

77
Appendix C6 Tables and figures
Table C1. Chemical formulae, retention times, and concentrations of organic compounds used to
evaluate the overall SVOC CE of the F-CTD.
Compounds Chemical
Formula
Retention
Time
Simulated ambient
concentrations
30 min
sampling
90 min
sampling
n-tetradecane C14H30 15.02 33.33 11.11
n-pentadecane C15H32 16.07 33.33 11.11
n-hexadecane C16H34 17.15 33.33 11.11
n-heptadecane C17H36 18.24 33.33 11.11
n-octadecane C18H38 19.34 33.33 11.11
n-nonadecane C19H40 20.42 33.33 11.11
n-eicosane C20H42 21.47 33.33 11.11
phytane C20H42 19.41 33.33 11.11
dodecylbenzene C18H30 20.29 83.33 27.78
1,5-dimethylnaphthalene C12H12 15.56 16.67 5.56
1,2-dimethylnaphthalene C12H12 15.69 16.67 5.56
phenanthrene C14H10 19.28 16.67 5.56
chrysene C18H12 26.04 16.67 5.56
9-fluorenone C13H8O 18.79 41.67 13.89
xanthone C13H8O2 20.11 41.67 13.89
anthraquinone C14H8O2 21.29 41.67 13.89
4,4'-dimethoxybenzophenone C15H14O3 23.96 41.67 13.89
5-octyldihydro-2(3H)-furanone C12H22O2 18.01 100 33.33
2-pentadecanone C15H30O 18.21 83.33 27.78
2-octadecanone C18H36O 21.49 83.33 27.78
1-tridecanal C13H26O 16.19 33.33 11.11

78
Figure C1 Schematic diagrams of the F-CTD and F-CTD housing assembly. The inlet (~ 0.5 cm
ID) and outlet (~ 0.2 cm ID) of the F-CTD consist of 2.5 cm long ~0.6 cm (1/4 inch) and ~0.3
cm (1/8 inch) OD tube extensions for compression fitting seals. The transfer line is made of a 10
cm long SS capillary with ~1.6 mm (1/16 inch) OD and ~0.5 mm (1/50 inch) ID, which is brazed
into the capsule on the upstream side of the filter to allow back-flushing during thermal
desorption. The F-CTD can be heated to 300°C in approximately 4 minutes and cooled back
down to 30°C in approximately 8 minutes when room temperature is ~ 20°C. The temperature in
the center of the filter, the furthest point from the heater measured by a thermocouple in contact
with the filter surface, reached its setpoint at approximately the same time as the heating block
and the temperature difference between the center of the filter and the heating block was <10 °C
when the temperature of the heating block was held isothermally at its setpoint.

79
Figure C2 Schematic diagram of the focusing trap assembly.

80
Figure C3 Operating conditions for the evaluation of gas CE of the F-CTD using the thermal
desorption method: (1) Injection of organics into the I-CTD; (2) Transfer organics from the I-
CTD to F-CTD by thermal desorption; (3) Zero air purge for 30 min (shown) or 90 min; (4)
Thermal desorption of the collected organics, including sample trapping (4a) and sample
injection (4b).

81
Figure C4 Operating conditions for the evaluation of the gas CE of the F-CTD using
evaporation transfer: (1) Injection of liquid standards; (2) Zero air purge for 30 min (shown) or
90 min; (3) Thermal desorption of the collected organics; (4) Transfer from the I-CTD to F-CTD;
(5) Thermal desorption of the collected organics. Thermal desorption consists of sample
trapping and sample injection (see Figure C3).
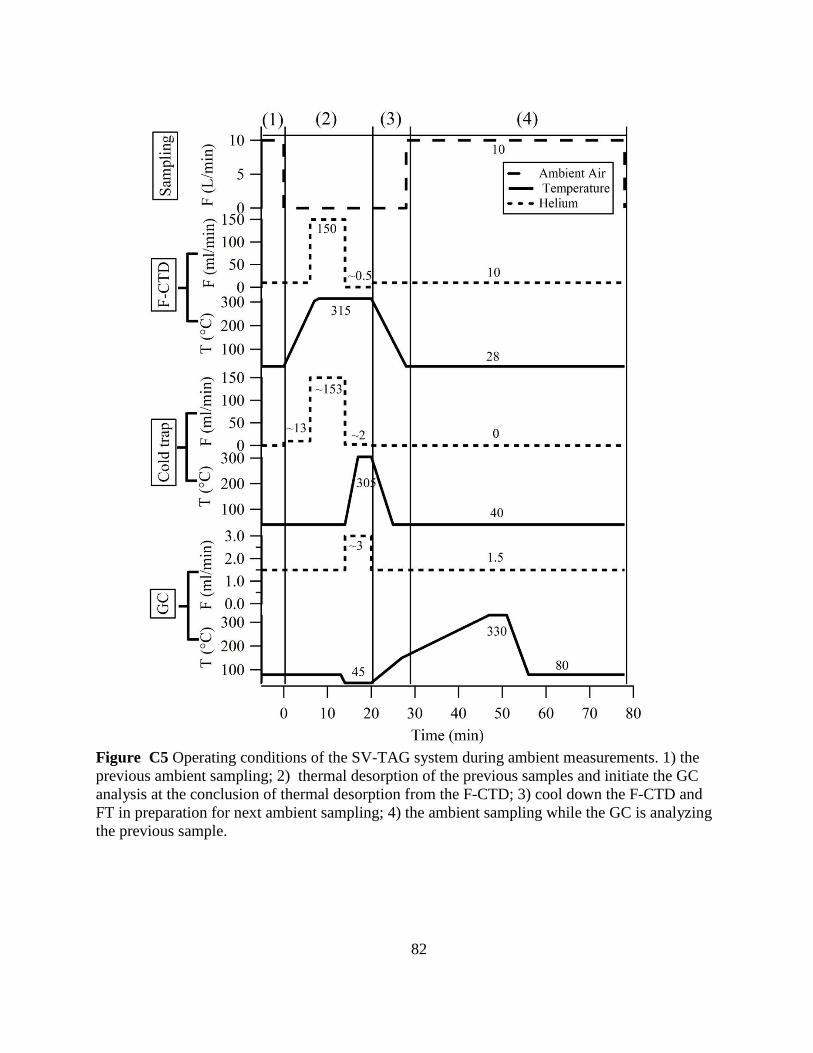
82
Figure C5 Operating conditions of the SV-TAG system during ambient measurements. 1) the
previous ambient sampling; 2) thermal desorption of the previous samples and initiate the GC
analysis at the conclusion of thermal desorption from the F-CTD; 3) cool down the F-CTD and
FT in preparation for next ambient sampling; 4) the ambient sampling while the GC is analyzing
the previous sample.

83
Figure C6 Optimization of the recovery of less volatile organic compounds: recovery of n-
alkanes as a function of carbon number at different purge flow rates.

84
Figure C7 Particle collection efficiency of the F-CTD as a function of the mobility diameter
down to ~ 30 nm. The measurements were made with a home built scanning mobility particle
sizer using TSI model 3081 differential mobility analyzer. The particles were generated by
nebulizing dioctyl sebecate (DOS).

85
Figure C8 Particle collection efficiency of the F-CTD (left axis) inferred from the number
concentration of ambient particles measured upstream and downstream of the F-CTD. The
volume size distribution is shown on the right axis.

86
Figure C9 Effect of organic loading on the recovery of individual compounds. The abundance of
the total ion is normalized to its mean value during the sampling period.