organ donation and transplantation - microsoft · although this report focuses on the statistics of...
TRANSCRIPT

Organ Donation and TransplantationActivity Report 2016/17

Preface

This report has been produced by Statistics and Clinical Studies, NHS Blood and Transplant. All figures quoted in this report are as reported to NHS Blood and Transplant by 16 May 2017 for the UK Transplant Registry, maintained on behalf of the transplant community and National Health Service (NHS), or for the NHS Organ Donor Register, maintained on behalf of the UK Health Departments. Former Strategic Health Authorities have been used throughout the report for convenience in comparisons with the previous year's figures. The information provided in the tables and figures given in Chapters 2-10 does not always distinguish between adult and paediatric transplantation. For the most part, the data also do not distinguish between patients entitled to NHS treatment (Group 1 patients) and those who are not (Group 2 patients). It should also be noted that not all cornea donors or cornea grafts are necessarily reported to NHS Blood and Transplant. The UK definition of an organ donor is any donor from whom at least one organ has been retrieved with the intention to transplant. Organs retrieved solely for research purposes have not been counted in this Activity Report. Organ donation has been recorded to reflect the number of organs retrieved. For example, if both lungs were retrieved, two lungs are recorded even if they were both used in one transplant. Similarly, if one liver is donated, one liver is recorded even if it results in two or more transplants. The number of donors after brain death (DBD) and donors after circulatory death (DCD) by hospital are documented in Appendices I. Donation and transplant rates in this report are presented per million population (pmp): population figures used throughout this report are mid-2015 estimates based on ONS 2011 Census figures and are given in Appendix III. All charts presented in this report are available as an accompanying slide set available from http://www.odt.nhs.uk. A supplementary report on organ donation and transplantation activity for Black, Asian and Minority Ethnic (BAME) groups is published alongside this Activity Report – Organ Donation and Transplantation data for Black, Asian and Minority Ethnic (BAME) communities. It provides additional information on trends in organ donation and transplantation for BAME communities. Acknowledgement NHS Blood and Transplant would like to thank all those in the donation and transplantation communities responsible for providing data to the UK Transplant Registry and the Potential Donor Audit, without whom this report would not be possible. Thanks also go to NHS Blood and Transplant staff responsible for data entry and accuracy and completeness of the data.

Foreword
Every transplant is the result of a complex collaboration between donors and their families, a host of clinicians working in different parts of the NHS and finally the transplant recipient and their family. Ensuring that this collaboration works smoothly every time is a significant challenge.
In 2016/17 the UK showed its ability to improve this collaboration by increasing the number of deceased organ donors to 1413, a 4% increase on the previous year. In addition to this record number of deceased donors, there were also 1043 living donors. This means we have been able to perform 4,753 live-saving and life-transforming transplants this year – another UK record. We're also pleased to announce that since the end of the financial year, we've reached the milestone figure of around 50,000 people alive today thanks to a transplant.
Despite this encouraging progress, opportunities for donation continue to be missed. Transplantation depends on clinicians recognising the potential for organ donation and still this does not always happen, particularly when donation after circulatory death is a possibility. However, it is family refusal that represents our biggest obstacle and as such our most important opportunity to further increase the number of transplants.
Family refusal very often reflects the understandable difficulties that families face when losing a loved one, and there are two ways in which they can be addressed. First of all, family refusal is less likely when the possibility of donation is raised by trained requestors - specialist nurses for organ donation. However there are still occasions when this does not happen and when donation is raised by clinical staff who have had little training in this most delicate of tasks.
Secondly, we know that families are much more likely to support donation when the individual’s decision is known beforehand. Discussing our end of life decision with those closest to us will ease the burden they face and make it more likely that our wishes are respected. This is particularly important for families from our black and Asian communities, where there is little tradition of organ donation but many people waiting for a transplant.
There is also considerable variation between transplant units and clinicians in their approach to risk when offered a donor organ for one of their patients. It can take many transactions to place organs with recipients, slowing down the process and resulting in extra stress for everyone involved. Sometimes donor families withdraw consent because they can no longer cope with the time involved.
While we cannot quantify every missed opportunity precisely, we need to work collaboratively to make sure that these are as few as possible. Eligible donors are rare, with just 5,681 people dying last year in circumstances where donation was possible. We need to make sure that each one is given the opportunity to donate, to bring comfort to the family they leave behind and to save the lives of those waiting for a transplant.

Although this report focuses on the statistics of organ donation and transplantation, behind every statistic there are people. People who choose to donate organs in life or after they die; people waiting for a transformative transplant for themselves or a member of their family. We hope that NHS clinicians, working in this extraordinary branch of medicine will be proud of the success in the last few years and determined to do even more to make sure no opportunity is missed to save lives through transplantation.
Lorna Marson Gary Masterson
President, President,
The British Transplantation Society The Intensive Care Society

Contents

1 Summary of Donor and Transplant Activity .......................................................................... 1
2 Overview of Organ Donation and Transplantation ............................................................... 3
2.1 Summary of activity ............................................................................................................. 4
2.2 Transplant list ...................................................................................................................... 8 2.3 Transplants .......................................................................................................................... 9
3 Organ Donation Activity ........................................................................................................ 12 3.1 Summary of activity ........................................................................................................... 13 3.2 Organ donors .................................................................................................................... 14 3.3 Demographic characteristics ............................................................................................. 17
4 The National Organ Retrieval Service and Usage of Organs ............................................. 19 4.1 The National Organ Retrieval Service (NORS) ................................................................. 20
4.2 Retrieval and usage of organs ........................................................................................... 22
5 Kidney Activity ....................................................................................................................... 32 5.1 Overview ........................................................................................................................... 33 5.2 Transplant list .................................................................................................................... 36 5.3 Donor and organ supply .................................................................................................... 40
5.4 Transplants ........................................................................................................................ 41 5.5 Demographic characteristics ............................................................................................. 49
6 Pancreas Activity .................................................................................................................. 51 6.1 Overview ........................................................................................................................... 52 6.2 Transplant list .................................................................................................................... 53
6.3 Donor and organ supply .................................................................................................... 57 6.4 Transplants ........................................................................................................................ 58
6.5 Demographic characteristics ............................................................................................. 60
7 Cardiothoracic Activity .......................................................................................................... 61 7.1 Overview ........................................................................................................................... 62 7.2 Transplant list .................................................................................................................... 63
7.3 Donor and organ supply .................................................................................................... 70 7.4 Transplants ........................................................................................................................ 73
7.5 Demographic characteristics ............................................................................................. 75
8 Liver Activity ......................................................................................................................... 76
8.1 Overview ........................................................................................................................... 77 8.2 Transplant list .................................................................................................................... 79
8.3 Donor and organ supply .................................................................................................... 82 8.4 Transplants ........................................................................................................................ 84
8.5 Demographic characteristics ............................................................................................. 86
9 Intestinal Activity ................................................................................................................... 87
9.1 Overview ........................................................................................................................... 88 9.2 Transplant list .................................................................................................................... 88 9.3 Donor and Organ Supply ................................................................................................... 90
9.4 Transplants ........................................................................................................................ 91
9.5 Demographic Characteristics ............................................................................................ 92

11 Survival Rates Following Transplantation ........................................................................... 93 11.1 Kidney graft and patient survival ................................................................................. 95
11.1.1 Adult kidney recipients - donor after brain death (DBD) ............................................. 95
11.1.2 Adult kidney recipients - donor after circulatory death (DCD) ..................................... 96 11.1.3 Adult kidney recipients - living donor .......................................................................... 97 11.1.4 Paediatric kidney recipients - donor after brain death (DBD) ..................................... 98 11.1.5 Paediatric kidney recipients - living donor .................................................................. 99 11.2 Pancreas graft and patient survival ........................................................................... 100
11.2.1 Simultaneous kidney/pancreas transplants - donor after brain death (DBD) ............ 100 11.2.2 Simultaneous kidney/pancreas transplants - donor after circulatory death (DCD) ... 101 11.2.3 Pancreas only transplants - donor after brain death (DBD) ...................................... 102 11.2.4 Pancreas only transplants - donor after circulatory death (DCD) ............................. 103
11.3 Cardiothoracic patient survival .................................................................................... 104 11.3.1 Adult heart recipients ................................................................................................ 104
11.3.2 Adult heart-lung block recipients .............................................................................. 105 11.3.3 Adult lung recipients - donors after brain death (DBD) ............................................. 106 11.3.4 Adult lung recipients - donors after circulatory death (DCD) .................................... 107 11.3.5 Paediatric heart recipients ........................................................................................ 108 11.3.6 Paediatric lung recipients – donors after brain death (DBD) .................................... 109
11.4 Liver patient survival ................................................................................................... 110 11.4.1 Adult recipients - donor after brain death (DBD) ...................................................... 110 11.4.2 Adult recipients - donor after circulatory death (DCD) .............................................. 111 11.4.3 Paediatric recipients - donor after brain death (DBD) ............................................... 112
11.5 Intestinal patient survival ............................................................................................ 113 12 NHS Organ Donor Register ................................................................................................. 114 13 National Potential Donor Audit ........................................................................................... 122
13.1 Introduction ................................................................................................................. 123
13.2 Definitions ................................................................................................................... 123 13.3 Breakdown of audited deaths in ICUs and emergency departments .......................... 124 13.4 Eligible donors ............................................................................................................ 127
13.5 Consent/ authorisation rates ....................................................................................... 133 13.6 Specialist Nurse - Organ Donation (SN-OD) involvement ........................................... 137
13.7 Comparison with previous years ................................................................................. 139 14 Appendices ........................................................................................................................ 142

- 1 -
1 Summary of Donor and Transplant Activity
Summary of Donor and
Transplant Activity

- 2 -
In the financial year to 31 March 2017, compared with the previous year
• there was a 4% increase in the number of deceased donors to 1,413, the highest number ever in the UK • the number of donors after brain death increased by 6% to 829, while the number of donors after circulatory death increased by 1% to 584 • the number of living donors fell by 3% to 1,043, accounting for 42% of the total number of
organ donors • the total number of patients whose lives were saved or improved by an organ transplant
increased by 3% to 4,753
The total number of patients registered for a transplant has fallen slightly (by 2%), so that: • there were 6,388 patients waiting for a transplant at the end of March 2017, with a further 3,357 temporarily suspended from transplant lists • 457 patients died while on the active list waiting for their transplant and a further 875 were removed from the transplant list. The removals were mostly as a result of deteriorating health and ineligibility for transplant and many of these patients would have died shortly afterwards.
Some of the other key messages from this report are that, compared with last year, there has been: • an increase of 2% in the total number of kidney transplants • a fall of 3% in the total number of pancreas transplants • an increase of 6% in the total number of liver transplants • an increase of 2% in the total number of heart transplants • a fall of 5% in the total number of lung or heart-lung transplants • an increase in the overall referral rate of potential donors from 86% to 88% and the proportion
of approaches involving a Specialist Nurse - Organ donation from 83% to 86% • an increase in the overall consent/authorisation rate for organ donation from 62 % to 63% • an increase in the number of opt-in registrations on the ODR, from 22.5 to 23.6 million at the
end of March 2017. There were 204,518 opt-out registrants

- 3 -
2 Overview of Organ Donation and Transplantation
Overview of Organ Donation
and Transplantation
A summary of organ donation and transplantation activity in the UK during the financial year from 1 April 2016 to 31 March 2017

- 4 -
2.1 Summary of activity
As the total number of deceased donors and transplants continued to increase this year, the number of patients on the active transplant list at 31 March 2017 is 81 fewer than on the same date last year. This drop reflects an increasing number of transplants performed over the last ten years and a reasonably steady number of patients joining the transplant list each year. The increase in donor and transplant numbers (1 April 2007 to 31 March 2017) and the number of patients registered on the transplant lists at 31 March each year are shown in Figure 2.1. There were 182 more deceased donor transplants in 2016-2017 than in the previous year, representing a 5% increase. The corresponding increase in the number of deceased donors was 4%.
809
2384
899
2569
959
2660
1010
2706
1088
2916
1212
3118
1320
3508
1282
3340
1364
3528
1413
3710
2007-2008 2008-2009 2009-2010 2010-2011 2011-2012 2012-2013 2013-2014 2014-2015 2015-2016 2016-2017
Year
0
1000
2000
3000
4000
5000
6000
7000
8000
9000
Nu
mb
er
Figure 2.1 Number of deceased donors and transplants in the UK, 1 April 2007 - 31 March 2017,
and patients on the active transplant list at 31 March
Donors
Transplants
Transplant list
76617907 8012
78147645
7335
7026 6943
6469 6388

- 5 -
Figure 2.2 shows the number of deceased and living donors for 2007-2017. The numbers of deceased donors after brain death (DBD) and deceased donors after circulatory death (DCD) have both increased year on year, with the exception of 2014-2015. In 2016-2017 the numbers of DBD and DCD donors reached their highest ever, 829 and 584, respectively. The number of living donors has fallen, in the last 4 years, from a peak of 1,148 donors in 2013-2014 to 1,043 in 2016-2017. Compared with last year there was a 3% fall in living donors in 2016-2017.
609
200
858
611
288
961
624
335
1062
637
373
1046
652
436
1055
705
507
1101
780
540
1148
772
510
1092
785
579
1078
829
584
1043
2007-2008 2008-2009 2009-2010 2010-2011 2011-2012 2012-2013 2013-2014 2014-2015 2015-2016 2016-2017
Year
0
200
400
600
800
1000
1200
Nu
mb
er
Living donors
DCD donors
DBD donors
Figure 2.2 Number of deceased and living donors in the UK, 1 April 2007 - 31 March 2017
Figure 2.3 shows the potential deceased organ donor population in the UK. Not everyone can be a deceased organ donor and this figure highlights the small proportion of deaths in the UK that represent potential donors. Please note that the information presented comes from several different sources. The NHSBT Potential Donor Audit collects information on most, but not all, actual donors and the potential for donation could therefore be slightly underestimated. The quoted numbers of transplants and organs transplanted are those achieved using organs from deceased actual donors in the UK, some of which may have been performed overseas, and does not reflect the number of deceased donor transplants in the UK, which may have used organs from overseas donors.

- 6 -
Transplants7,8
3,675
Organs transplanted7,8
4,025
UK population1
~65,000,000
UK deaths2
~600,000
Deaths in hospitals3
~ 290,000
Potential donors4,5
7,024
Eligible donors4,6
5,681
Donation requests4
3,144
Consented donors7
2,082
Actual donors7
1,413
1 Mid 2015 estimates: www.ons.gov.uk2 2015 data: England & Wales www.ons.gov.uk; Scotland www.gro-scotland.gov.uk; Northern Ireland
www.nisra.gov.uk3 2015 data: England & Wales www.ons.gov.uk; Scotland www.isdscotland.org; Northern Ireland
www.nisra.gov.uk4 2016/2017 data: NHSBT, Potential Donor Audit 5 Potential donor - patients for whom death was confirmed following neurological tests or patients
who had treatment withdrawn and death was anticipated within four hours6 Eligible donor - Potential donor with no absolute medical contraindications to solid organ donation7 2016/2017 deceased donor data: NHSBT, UK Transplant Registry8 Using organs from actual donors in the UK
Figure 2.3 UK potential deceased organ donor population,
1 April 2016 – 31 March 2017
Table 2.1 shows the number of deceased donors and transplants in 2016-2017 and patients on the transplant list at 31 March 2017 for each country in the UK.

- 7 -
Table 2.1 Deceased donors and transplants 1 April 2016 - 31 March 2017, and transplant lists as at 31 March 2017, by country of residence
Country of residence1,2
England Wales Scotland Northern Ireland
Organ N (pmp) N (pmp) N (pmp) N (pmp)
Kidney Deceased donors 1094 (20.0) 63 (20.3) 129 (24.0) 41 (22.2) Transplants
3 1871 (34.1) 74 (23.9) 164 (30.5) 45 (24.3)
Transplant list 4463 (81.5) 185 (59.7) 437 (81.4) 125 (67.6)
Pancreas Deceased donors 394 (7.2) 22 (7.1) 40 (7.4) 17 (9.2) Transplants 172 (3.1) 4 (1.3) 34 (6.3) 3 (1.6) Transplant list 174 (3.2) 15 (4.8) 32 (6.0) 3 (1.6)
Heart Deceased donors 173 (3.2) 6 (1.9) 11 (2.0) 9 (4.9) Transplants
4 161 (2.9) 12 (3.9) 16 (3.0) 6 (3.2)
Transplant list 204 (3.7) 7 (2.3) 24 (4.5) 8 (4.3)
Lung Deceased donors 153 (2.8) 4 (1.3) 16 (3.0) 10 (5.4) Transplants 151 (2.8) 9 (2.9) 16 (3.0) 1 (0.5) Transplant list 301 (5.5) 25 (8.1) 34 (6.3) 14 (7.6)
Liver Deceased donors 866 (15.8) 53 (17.1) 85 (15.8) 30 (16.2) Transplants 750 (13.7) 36 (11.6) 117 (21.8) 19 (10.3) Transplant list 423 (7.7) 25 (8.1) 37 (6.9) 30 (16.2)
Intestinal Deceased donors 11 (0.2) 0 (0.0) 1 (0.2) 2 (1.1) Transplants5 13 (0.2) 0 (0.0) 1 (0.2) 1 (0.5) Transplant list 5 (0.1) 0 (0.0) 1 (0.2) 0 (0.0) Total6 Deceased donors 1157 (21.1) 68 (21.9) 137 (25.5) 42 (22.7) Transplants 3118 (56.9) 135 (43.5) 348 (64.8) 75 (40.5) Transplant list 5376 (98.1) 242 (78.1) 540 (100.6) 177 (95.7) 1 Country of residence of donor given for deceased donor numbers, and residence of recipient given for transplant
and waiting list numbers 2 Excludes patients resident in Channel Islands, Isle of Man, overseas and in the Republic of Ireland
3 Kidney only transplants
4 Excludes heart-lung transplants
5 Excludes one abdominal wall only transplant
6 Organ numbers do not add up to total due to multi-organ donors and patients waiting for a multi-organ transplant

- 8 -
2.2 Transplant list At 31 March 2017, 6,388 patients were registered for an organ transplant in the UK on the active transplant list. A further 3,357 patients were temporarily suspended from the active national transplant list because they were unfit or otherwise unavailable for transplant. Details of numbers of patients on each of the organ transplant lists are given in Table 2.2 for 31 March 2016 and 2017. Between these dates the total number fell by 81 (1%) due to decreases in the number of patients on the kidney, pancreas and liver transplant lists.
Table 2.2 Active transplant lists in the UK at 31 March 2016 and 2017
2016 2017 % Change
Kidney & pancreas patients 5308 5220 -2 Kidney 5081 4996 -2 Kidney & pancreas 184 193 +5 Kidney & pancreas islets 0 2 - Pancreas 15 10 -33 Pancreas islets 28 19 -32
Cardiothoracic patients 574 624 +9 Heart 244 246 +1 Heart-lung 14 18 +29 Lung(s) 316 360 +14
Liver patients 533 489 -8
Intestinal patients 6 12 -
Other multi-organ patients
1 48 43 -10
ALL PATIENTS 6469 6388 -1 Percentages not reported when fewer than 10 in either year 1 Includes patients waiting for kidney and liver transplants (44 in 2016, 40 in 2017), kidney and
heart transplants (4 in 2016, 2 in 2017), and liver and heart transplants (1 in 2017)
During 2016-2017, 470 patients died whilst active/suspended on the transplant list or within one year of removal from the list. This information is shown by organ and age group in Table 2.3.

- 9 -
Table 2.3 Number of patient deaths on transplant lists in the UK, 1 April 2016 - 31 March 2017
Total Adult Paediatric
Kidney & pancreas patients 281 281 0 Kidney 261 261 0 Kidney & pancreas 19 19 0 Pancreas 1 1 0
Cardiothoracic patients 104 93 11 Heart 32 22 10 Heart-lung 7 7 0 Lung(s) 65 64 1
Liver patients 74 72 2
Intestinal patients 4 3 1
Other multi-organ patients
1 7 7 0
ALL PATIENTS 470 456 14 1 Includes patients waiting for kidney and liver transplants (6 adults), kidney and
heart transplants (1 adult)
2.3 Transplants
There was a 3% increase in the total number of organ transplants (from deceased and living donors) last year: 4,753 transplants were performed in 2016-2017 compared with 4,605 in 2015-2016 (Table 2.4). All multi-organ transplants are identified separately as are transplants from living donors. The total number of kidney transplants increased by 2% in 2016-2017; kidney transplants from donors after circulatory death increased by 4%, while the number of living donor kidney transplants fell by 3%. The total number of cardiothoracic organ transplants fell by 2%, the number of liver transplants rose by 6% and the number of pancreas transplants (including pancreas only, intestinal, kidney/pancreas and pancreas islets) fell by 3%.

- 10 -
Table 2.4 Transplants performed in the UK, 1 April 2015 - 31 March 2017 Transplant 2015-2016 2016-2017 % Change
DBD kidney 1181 1270 +8 DCD kidney 855 890 +4 Living donor kidney 1038 1009 -3
DBD Kidney & pancreas 123 120 -2 DCD Kidney & pancreas 44 42 -5 Kidney & Pancreas islets 0 1 - DBD Pancreas 13 14 +8 DCD Pancreas 5 3 - Pancreas islets 31 33 +6
DBD heart 175 184 +5 DCD heart 19 13 -32 Heart-lung 6 2 - DBD Single lung 14 20 +43 DCD Single lung 2 2 - DBD Double lung 133 127 -5 DCD Double lung 33 27 -18
DBD liver 553 597 +8 DCD liver 206 207 0 Domino liver 3 3 - DBD liver lobe 95 127 +34 DCD liver lobe 0 1 - Living donor liver lobe 36 31 -14
Bowel only 1 4 - Liver, bowel & pancreas 1 1 - Multivisceral
1 7 4 -
Modified multivisceral2 6 6 -
Kidney & heart 0 1 - Kidney & liver 24 14 -42 Heart & liver 1 0 -
TOTAL ORGAN TRANSPLANTS 4605 4753 +3
Total kidney transplants3 3267 3348 +2
Total pancreas transplants3 230 224 -3
Total cardiothoracic organ transplants 383 376 -2 Total liver transplants
3 926 985 +6
Total intestinal transplants⁴ 15 15 0 Percentage not reported when fewer than 10 in either year 1 Including a kidney (1 in 2016-2017)
2 Including a kidney (2 in 2015-2016)
3 Includes intestinal transplants
⁴ Excludes abdominal wall only transplant (1 in 2016-2017)

- 11 -
The total approximate number of patients with a functioning transplant on 31 March 2017 is 49,600 (Table 2.5). This reflects information held on the UK transplant registry database and excludes those patients who are known to be lost to follow-up.
Table 2.5 Number of transplants reported as functioning at 31 March 2017
Functioning transplants¹
Kidney 35800 Pancreas 1800 Cardiothoracic 3800 Liver 9700 Intestinal 100
ALL PATIENTS2 49600 1 Approximate number being followed up
2 Number of patients with a functioning transplant
Multi-organ transplants (excluding intestinal transplants) are counted in each organ Excludes those patients known to be lost to follow-up

- 12 -
3 Organ Donation Activity
Organ Donation
Activity
Key messages
There has been a 4% increase in deceased donors (to 1,413) and a 3% fall in living organ donors (to 1,043) compared with last year
There has been an increase in donors after brain death of 6% to 829 and an increase of 1% in donors after circulatory death to 584, compared with last year
Donors after brain death provide, on average, one more organ for
transplantation than donors after circulatory death
Donor characteristics are continuing to change: donors are older, more obese, and less likely to have suffered a trauma-related death, all of which have adverse
effects on transplant outcomes

- 13 -
3.1 Summary of activity There was a 4% increase in the number of deceased organ donors in 2016-2017 (1,413), twenty seven short of the target of 1,440 donors set for the year. There was an increase in donors after brain death (DBD) of 6% and a more modest increase of 1% in donors after circulatory death (DCD). The 1,413 deceased organ donors gave 4,741 organs compared with 1,364 donors and 4,660 organs in 2015-2016. This represents a 2% increase in organs donated. Table 3.1 shows deceased organ donors according to the organs they donated. Nearly all deceased donors (95%) gave a kidney and of these the majority (77%) also donated at least one other organ. Only 12% of donors after brain death were single organ donors, with equal proportions being liver only and kidney only donors. By contrast, 48% of donors after circulatory death were single organ donors, the majority (94%) of these donating just their kidneys. Although the vast majority of living organ donors donated a kidney, 34 donated part of their liver. All living donations are approved by the Human Tissue Authority.
Table 3.1 Solid organ donors in the UK, 1 April 2016 - 31 March 2017, by organ types donated
DBD DCD Living donor TOTAL
Kidney only 49 261 1009 1319 Kidney & thoracic 16 5 - 21 Kidney & liver 285 168 - 453 Kidney & pancreas 10 22 - 32 Kidney, thoracic & liver 65 16 - 81 Kidney, thoracic & pancreas 4 2 - 6 Kidney, liver & pancreas 161 70 - 231 Kidney, liver & bowel 1 - - 1 Kidney, liver, pancreas & bowel 5 - - 5 Kidney, thoracic, liver & pancreas 165 23 - 188 Kidney, thoracic, liver, pancreas & bowel 8 - - 8 Thoracic only 3 - - 3 Thoracic & liver 3 - - 3 Thoracic, liver & pancreas 1 - - 1 Liver only 47 17 34 98 Liver & pancreas 6 - - 6
TOTAL 829 584 1043 2456 Bowel may include abdominal wall/colon/stomach/spleen

- 14 -
3.2 Organ donors Organ donor rates per million population (pmp) for 2016-2017 are given by country and former Strategic Health Authority according to where the donor lived in Table 3.2, while the number of deceased donors are shown based on location of the hospital in which they died in Table 3.3. Table 3.4 shows the number of deceased donors by Organ Donation Services Team. Appendix I shows a more detailed breakdown of the number of donors from the donating hospitals and Appendix III details the populations used. Number and rates of utilised donors are given in Chapter 4.
Table 3.2 Organ donation rates per million population (pmp), in the UK, 1 April 2016 - 31 March 2017, by country/ Strategic Health Authority of donor residence
1
Country of donation/ DBD DCD TOTAL Living Strategic Health Authority N (pmp) N (pmp) N (pmp) N (pmp)
North East 53 (20.2) 22 (8.4) 75 (28.6) 52 (19.8) North West 90 (12.6) 72 (10.0) 162 (22.6) 116 (16.2) Yorkshire and The Humber 59 (10.9) 45 (8.3) 104 (19.3) 67 (12.4) North of England 202 (13.3) 139 (9.2) 341 (22.5) 235 (15.5)
East Midlands 39 (8.3) 35 (7.5) 74 (15.8) 50 (10.7) West Midlands 72 (12.5) 49 (8.5) 121 (21.0) 98 (17.0) East of England 74 (12.2) 76 (12.5) 150 (24.7) 78 (12.8) Midlands and East 185 (11.2) 160 (9.7) 345 (20.9) 226 (13.7)
London 96 (11.1) 50 (5.8) 146 (16.8) 168 (19.4)
South East Coast 73 (15.8) 53 (11.4) 126 (27.2) 58 (12.5) South Central 51 (11.8) 38 (8.8) 89 (20.6) 73 (16.9) South West 67 (12.2) 43 (7.9) 110 (20.1) 69 (12.6) South of England 191 (13.2) 134 (9.3) 325 (22.5) 200 (13.9)
England 674 (12.3) 483 (8.8) 1157 (21.1) 829 (15.1) Isle of Man 2 (25.0) 2 (25.0) 4 (50.0) 0 (0.0) Channel Islands 4 (25.0) 1 (6.3) 5 (31.3) 1 (6.3)
Wales 39 (12.6) 29 (9.4) 68 (21.9) 46 (14.8)
Scotland 79 (14.7) 58 (10.8) 137 (25.5) 89 (16.6)
Northern Ireland 31 (16.8) 11 (5.9) 42 (22.7) 78 (42.2)
TOTAL 829 (12.7) 584 (8.9) 1413 (21.6) 1043 (16.0) 1 Includes 113 donors (16 deceased, 97 living) where the hospital postcode was used in place of an unknown
donor postcode

- 15 -
Table 3.2 shows variation in the number of DBD and DCD donors pmp across the UK. There were 12.7 DBD donors pmp for the UK as a whole, but across the former English Strategic Health Authorities (SHA) this ranged between 8.3 and 20.2 pmp. Across the four countries of the UK, Northern Ireland had the highest rate of 16.8 pmp. However, the number of eligible donors pmp also varies and further information can be seen in Chapter 13. It should be noted that these figures are not directly comparable, since not all donors are reported in the Potential Donor Audit. For DCD donors the UK rate is 8.9 pmp, ranging from 5.9 to 10.8 pmp across countries of the UK and from 5.8 to 12.5 pmp in the former English SHAs. No adjustment has been made for any differences in demographics of the populations across countries or SHAs.
Table 3.3 Deceased organ donors in the UK, 1 April 2016 - 31 March 2017, by country/ Strategic Health Authority of hospital of donor death Country of donation/ DBD DCD TOTAL Strategic Health Authority N N N
North East 52 27 79 North West 96 73 169 Yorkshire and The Humber 62 43 105 North of England 210 143 353
East Midlands 31 31 62 West Midlands 66 51 117 East of England 56 74 130 Midlands and East 153 156 309
London 140 69 209
South East Coast 57 48 105 South Central 52 33 85 South West 63 45 108 South of England 172 126 298
England 675 494 1169 Isle of Man 2 1 3 Channel Islands 3 2 5
Wales 40 21 61
Scotland 77 56 133
Northern Ireland 32 10 42
TOTAL 829 584 1413

- 16 -
Table 3.4 Deceased organ donors in the UK, 1 April 2016 - 31 March 2017 by Organ Donation Services Team Team DBD DCD TOTAL
N N N
Eastern 57 74 131 London 111 50 161 Midlands 85 72 157 North West 106 75 181 Northern 55 31 86 Northern Ireland 32 10 42 Scotland 77 56 133 South Central 67 42 109 South East 89 69 158 South Wales 32 17 49 South West 51 40 91 Yorkshire 67 48 115
TOTAL 829 584 1413
The mean number of organs retrieved per donor in 2016-2017 is given by country in Table 3.5. Overall, an average of 3.8 organs were donated per DBD donor and 2.8 per DCD donor. For DBD donors, the rate ranged from 3.4 organs per donor in Wales to 4.2 in Northern Ireland.
Table 3.5 Organs retrieved per donor, in the UK, 1 April 2016 - 31 March 2017, by country of donor residence Country Adult Paediatric All
DBD DCD TOTAL DBD DCD TOTAL DBD DCD TOTAL
England 3.7 2.8 3.3 4.8 2.9 4.2 3.8 2.8 3.4 Wales 3.4 2.7 3.1 4.0 - 4.0 3.4 2.7 3.1 Scotland 3.6 2.4 3.1 5.0 2.3 3.7 3.6 2.4 3.1 Northern Ireland 4.1 2.6 3.7 4.5 - 4.5 4.2 2.6 3.8
TOTAL 3.7 2.8 3.3 4.8 2.8 4.2 3.8 2.8 3.3

- 17 -
3.3 Demographic characteristics While the number of donors overall has increased over the last 10 years, it is important to be aware that there have been changes over time with regard to donor characteristics (Table 3.6). In 2016-2017, 36% of deceased donors were aged 60 years or more compared with 21% in 2007-2008 (Figure 3.1). In particular the proportion of donors aged at least 70 years has increased from 3% to 14% over the same time period. The proportion of clinically obese donors (Body Mass Index (BMI) of 30 or higher) has increased from 19% to 25% in deceased donors in the last 10 years (Figure 3.2). In addition, the proportion of all deceased donors after a trauma death has decreased from 14% to 3% over the same time period. All of these changes may have an adverse impact on the quality and utilisation of the organs, and the subsequent transplant outcome for the recipient. Table 3.6 also indicates the ethnicity of deceased organ donors, highlighting that 6% of donors are from ethnic minority groups. By contrast, ethnic minority groups represent 11% of the UK population.
Table 3.6 Demographic characteristics of organ donors in the UK 1 April 2016 - 31 March 2017
DBD DCD TOTAL N % N % N %
Age 0-17 38 5 17 3 55 4
18-49 343 41 166 28 509 36 50-59 187 23 158 27 345 24 60-69 151 18 157 27 308 22 70+ 110 13 86 15 196 14 Mean (SD) 50 17 54 16 51 17
BMI 0-19 42 5 32 5 74 5
20-29 584 70 395 68 979 69 30+ 203 24 157 27 360 25 Mean (SD) 27 6 27 7 27 6
Cause of death
Intracranial 712 86 473 81 1185 84 Trauma 29 3 15 3 44 3 Other 88 11 96 16 184 13
Ethnicity White 758 92 550 95 1308 94
Asian 17 2 12 2 29 2 Black 17 2 5 1 22 2 Other 28 3 11 2 39 3 Unknown 9 6 15
Blood group
O 381 46 278 48 659 47 A 354 43 237 41 591 42 B 74 9 52 9 126 9 AB 20 2 17 3 37 3
Donor gender
Male 450 54 357 61 807 57 Female 379 46 227 39 606 43
TOTAL 829 100 584 100 1413 100

- 18 -
2007-2008 2008-2009 2009-2010 2010-2011 2011-2012 2012-2013 2013-2014 2014-2015 2015-2016 2016-2017
Age
0
10
20
30
40
50
60
70
80
90
100
Pe
rce
nta
ge
70+60-6950-5918-490-17
Figure 3.1 Age of deceased donors in the UK, 1 April 2007 - 31 March 2017
5
48
26
17
3
7
50
24
15
5
4
46
24
18
8
4
42
23
20
10
4
38
25
23
11
3
37
26
22
12
4
37
22
22
15
4
39
25
22
11
4
36
25
23
13
4
36
24
22
14
809 899 959 1010 1088 1212 1320 1282 1364 1413N=
2007-2008 2008-2009 2009-2010 2010-2011 2011-2012 2012-2013 2013-2014 2014-2015 2015-2016 2016-2017
BMI
0
10
20
30
40
50
60
70
80
90
100
Pe
rce
nta
ge
30+20-290-19
Figure 3.2 BMI of deceased donors in the UK, 1 April 2007 - 31 March 2017
6
75
19
7
72
20
5
70
24
7
73
20
6
71
23
6
68
26
6
70
24
7
67
26
7
68
25
5
69
25
771 886 942 995 1086 1211 1319 1282 1363 1413N=
Note that BMI cannot be determined for all deceased donors thus numbers indicated in Figure 3.2 are the numbers of donors for which BMI was available, not total number of donors.

- 19 -
4 The National Organ Retrieval Service and Usage of Organs
The National Organ Retrieval Service
and Usage of Organs
Key messages
National Organ Retrieval Service teams attended 842 possible DBD donors and 913 possible DCD donors; 98% of these DBD donors and 64% of these DCD donors attended proceeded to donation
Overall, 52% of organs offered from those donors that did proceed were transplanted, but individually, these rates were 85% for kidneys, 63% for livers, 30% for pancreases, 30% for hearts, 16% for lungs and 7% for bowels
The number of deceased donors per million of population was 21.6, however 5% of actual donors resulted in no organ transplants compared to 6% in the
previous year

- 20 -
4.1 The National Organ Retrieval Service (NORS)
As of 4 April 2016 there have been 7 abdominal and 3 cardiothoracic NORS teams available at any given time to retrieve organs from deceased donors in the UK for transplantation. This represents a change in the service which was implemented as a result of a review of the National Organ Retrieval Service, which recommended the reduction in the number of cardiothoracic teams from 6 to 3. Occasionally an off duty team will be called out when all 3 cardiothoracic on-call teams are out attending a donor. The first on-call NORS team is the closest available team to the donor, whereas before this was previously based on designated areas of the UK. If a team is first on-call for a particular donor hospital, they are required to attend possible donors at that hospital within an agreed timescale if at least one organ has been accepted for transplantation. If the team is already retrieving when they are called to attend, then a second team is called in to retrieve and so on. In three areas of the country, two abdominal teams share the on-call responsibilities, each being on-call for different weeks of the year, which means there are in fact 10 abdominal teams in total. The number of possible DBD and DCD donors that were attended by each of the teams in 2016-2017 is shown in Table 4.1. The geographical distribution of donors and the on-call arrangements lead to variation in these numbers across teams. The figures are broken down by whether the possible donor proceeded to organ donation (actual donors) or not. Non-proceeding donors are more common in the pool of potential DCD donors as prolonged time to death after treatment withdrawal can result in unsuitability of organs for transplantation. A small number of possible donors are attended by local kidney transplant teams. This is typically for DCD donors when only the kidneys have been accepted for transplantation and the teams are appropriately reimbursed if they are willing and able to retrieve.

- 21 -
Table 4.1 Number of actual and non-proceeding donors attended by each NORS team
DBD DCD
NORS team Actual
Non- proceeding
% non- proc
No. attended Actual
Non- proceeding
% non- proc
No. attended
Abdominal
Birmingham1 103 0 0 103 62 39 39 101
Cambridge 94 1 1 95 90 40 31 130
Cardiff1 25 0 0 25 27 13 33 40
Edinburgh 82 1 1 83 57 21 27 78
King's 152 6 4 158 98 66 40 164
Leeds2 67 2 3 69 49 22 31 71
Manchester2 62 2 3 64 64 37 37 101
Newcastle 101 3 3 104 60 36 38 96
Oxford3 79 0 0 79 48 31 39 79
Royal Free3 61 0 0 61 29 22 43 51
Abdominal total 826 15 2 841 584 327 36 911
Cardiothoracic
4
Birmingham 49 27 36 76 6 21 78 27
Glasgow 22 14 39 36 3 8 73 11
Harefield 57 36 39 93 8 21 72 29
Manchester 47 17 27 64 5 15 75 20
Newcastle 33 22 40 55 4 6 60 10
Papworth 57 30 34 87 19 25 57 44
Cardiothoracic total 265 146 36 411 45 96 68 141
Total donors attended 829 13 2 842 584 329 36 913
1,2,3,4
Share on-call responsibilities

- 22 -
4.2 Retrieval and usage of organs The number of ‘consented’ donors and 'offered' donors (where at least one organ was offered for transplant) are shown in Table 4.2. On occasion a ‘consented’ donor may not have organs offered because the donor’s condition deteriorates or it is discovered the donor is unsuitable for organ donation. The number of organs offered from these 'offered' donors is also shown. Each year a number of actual organ donors result in no transplants. Donors resulting in at least one transplant are termed 'utilised' donors and the number of actual and utilised donors is shown in Table 4.2. The number of donors per million of population (pmp) is also shown. In 2016-2017, 5% of actual donors resulted in no organ transplants compared with 6% in the previous year.
Table 4.2 Consented, offered, actual and utilised deceased donors in the UK, 1 April 2016 - 31 March 2017
DBD (pmp) DCD (pmp) Total (pmp)
Consented donors1 923 (14.1) 1159 (17.7) 2082 (31.9)
Offered donors
2 890 (13.6) 1025 (15.7) 1915 (29.3)
Kidneys offered 1715 1974 3689 Livers offered 859 952 1811 Pancreases offered 600 335 935 Bowels offered 247 0 247 Hearts offered 541 76 617 Lungs offered 1108 690 1798
Actual donors 829 (12.7) 584 (8.9) 1413 (21.6)
Utilised donors
3 809 (12.4) 537 (8.2) 1346 (20.6)
1 Consented donors defined as patients where consent for at least one organ was given
2 Offered donors defined as donors where one or more organs were offered for transplantation
3 Utilised donors defined as donors where one or more organs were retrieved and transplanted
There were 1,413 actual deceased organ donors last year, but not all organs from these donors were offered for transplantation. Table 4.3 shows the number of organs offered, retrieved and transplanted from the 829 DBD and 584 DCD actual donors. The number of organs from these donors that were subsequently used for research purposes is also shown. The number of organs offered for transplantation excludes those where the donor did not meet the nationally agreed age criteria for suitability for donation of that specific organ. There are no nationally agreed age criteria for kidney and liver donation.

- 23 -
Table 4.3 Donation and transplantation of organs from 1413 deceased donors in the UK,
1 April 2016 – 31 March 2017
Organ
Organs meeting initial suitability
criteria and offered for transplantation
Organs retrieved for transplantation Organs transplanted
Organs used for research (from actual organ
donors) N % of
offered N % of
retrieved % of
offered
DBD donor organs
Kidney 1656 1529 92 1414 92 85 66
Liver 814 747 92 674 90 83 52
Pancreas1 505 349 69 172 49 34 133
Bowel2,3
196 13 7 13 100 7 0
Heart4 589 182 31 175 96 30 2
Lung5 1224 280 23 266 95 22 7
Total 4984 3100 62 2714 88 54 260
DCD donor organs6
Kidney 1166 1129 97 976 86 84 97
Liver 575 294 51 208 71 36 58
Pancreas1 220 114 52 49 43 22 46
Lung5,6
754 64 8 54 84 7 4
Total 2715 1601 59 1287 80 47 205
Deceased donor organs
Kidney 2822 2658 94 2390 90 85 163
Liver 1389 1041 75 882 85 63 110
Pancreas1 725 463 64 221 48 30 179
Bowel2,3
196 13 7 13 100 7 0
Heart4 589 182 31 175 96 30 2
Lung5 1978 344 17 320 93 16 11
Total 7699 4701 61 4001 85 52 465
1
Excludes donors aged > 60 years 2
Excludes 1 bowel transplant from an overseas donor 3
Excludes donors aged >= 56 years or weighing >= 80kg
4 Excludes donors aged > 65 years or died due to myocardial infarction
5 Excludes donors aged > 65 years
6 Excludes DCD hearts because this is not part of the national service, see cardiothoracic section for DCD heart detail
Figures 4.1 and 4.2 show line graphs of the pathway for all donor organs through to transplantation. The charts start at 100% for each organ, representing all organs from the 829 DBD and 584 DCD donors. The proportion of these organs where any national donor age criteria are met is then shown, followed by the proportion with consent (authorisation in Scotland), the proportion offered, the proportion retrieved and finally the proportion transplanted. For example, Figure 4.2 shows that 84% of the kidneys from the 584 DCD donors were transplanted, an increase from 81% in the previous year. Transplantation rates for kidneys and livers are generally high, while for other organs, even after allowing for the agreed age criteria, the rates are generally low.

- 24 -
Donation and transplantation rates of organs from DBD organ donors in the UK,
1 April 2016 – 31 March 2017
1 Hearts – in addition to age criteria, donors who died due to myocardial infarction are excluded
Bowels – in addition to age criteria, donors who weigh >=80kg are excluded
0
10
20
30
40
50
60
70
80
90
100
Organs from
actual DBD
donors
Donor age
criteria met
Consent for
organ donation
Organs offered
for donation
Organs retrieved
for transplant
Organs
transplanted
Pe
rce
nta
ge
Kidney Liver Pancreas Bowel Heart Lungs
Figure 4.1
% of all
organs
% of all organs
meeting age
criteria1
85%
81%
21%21%16%
85%
81%
30%27%20%
1
Transplanted:
2% 5%
0
10
20
30
40
50
60
70
80
90
100
Organs from
actual DCD
donors
Donor age
criteria met
Consent for
organ donation
Organs offered
for donation
Organs retrieved
for transplant
Organs
transplanted
Pe
rce
nta
ge
Kidney Liver Pancreas Lungs
Donation and transplantation rates of organs from DCD organ donors in the UK,
1 April 2016 – 31 March 2017
Figure 4.2
% of all
organs
% of all organs
meeting age
criteria
84%
36%
9%5%
84%
36%
18%6%
Transplanted:

- 25 -
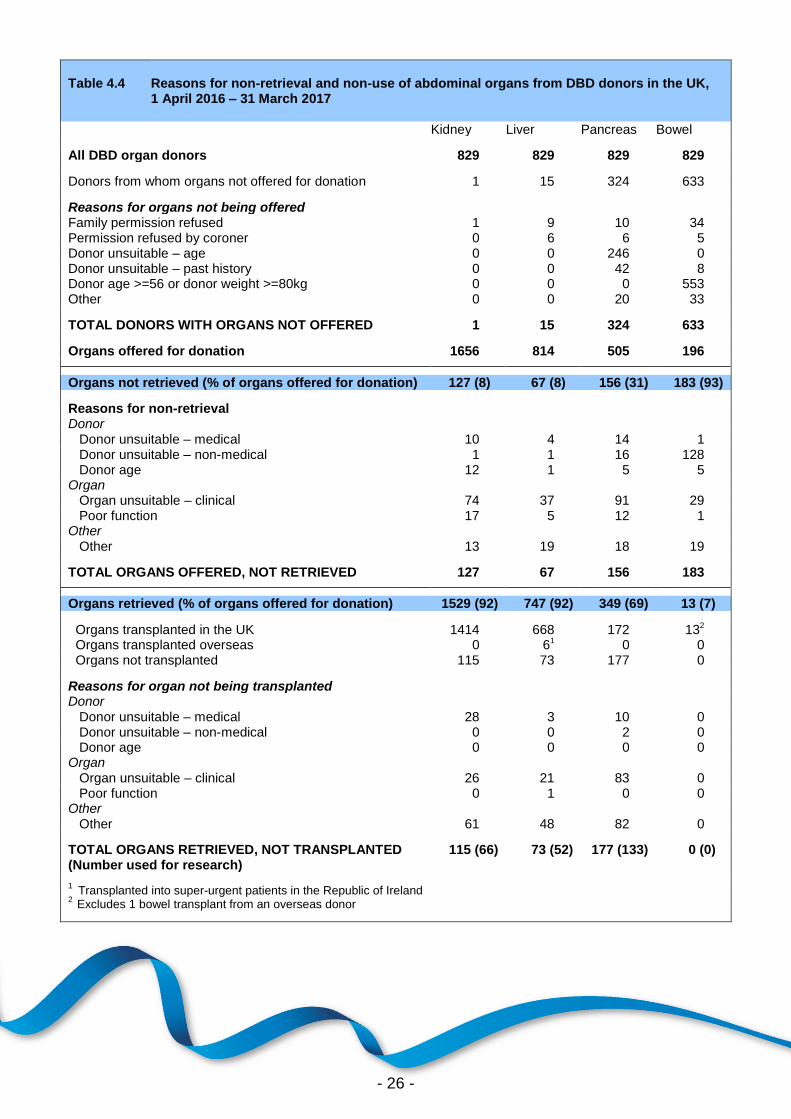
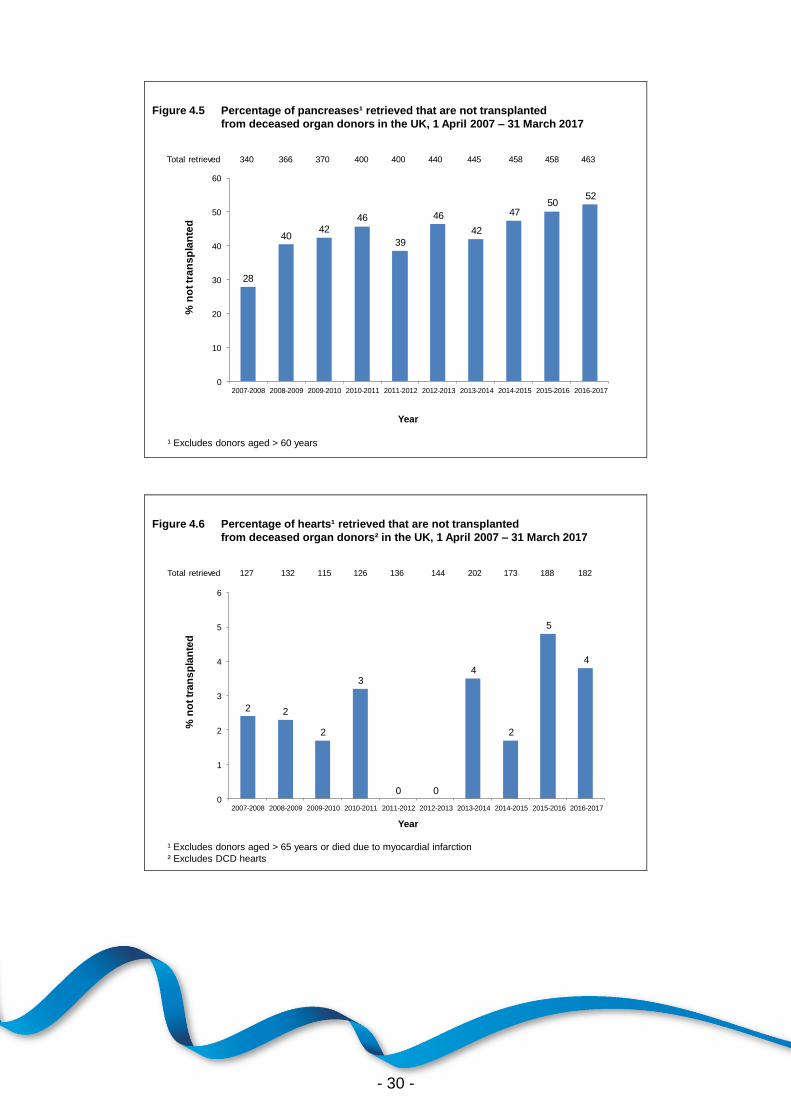
Reasons for organs not being offered for transplantation, being offered but not accepted and being retrieved but not subsequently transplanted are shown in Table 4.4 and Table 4.5 for abdominal organs from DBD and DCD donors, respectively. Table 4.6 shows the same information for cardiothoracic organs. Reasons for the medical unsuitability of an organ include infections, tumours, anatomy and disease. Non-medical reasons include donor size and donor instability. Clinical unsuitability of an organ encompasses poor perfusion, prolonged ischaemia, past history of the donor and, in the case of pancreases for islet usage, insufficiency of viable islet yield. Reasons reported under ‘other’ include logistical and recipient related issues in addition to un-coded reasons reported of a miscellaneous nature. The percentage of organs retrieved that were not transplanted are shown in Figure 4.3, Figure 4.4, Figure 4.5. Figure 4.6 and Figure 4.7 for kidneys, livers, pancreases, hearts and lungs respectively. The rates are shown over the last decade. Some organs are found not to be suitable for transplantation after they have been retrieved and this ‘non-utilisation rate’ is generally increasing over time for each organ, reflecting the ageing donor population. The majority of organs retrieved but found not to be suitable for transplantation are instead used for research (with appropriate consent). These tables also show the number of organs from UK donors that were transplanted overseas. These organs were not accepted for transplantation by any UK transplant centre, but were accepted for suitable recipients identified elsewhere, usually in Europe. In 2016-2017 only a small number of livers, hearts and lungs were exported for transplantation outside the UK. Organs from outside the UK are occasionally imported for transplant. Further information on the import and export of organs can be found in Appendix IV.
- 26 -
Table 4.4
Reasons for non-retrieval and non-use of abdominal organs from DBD donors in the UK, 1 April 2016 – 31 March 2017
Kidney Liver Pancreas Bowel
All DBD organ donors 829 829 829 829
Donors from whom organs not offered for donation 1 15 324 633
Reasons for organs not being offered Family permission refused 1 9 10 34 Permission refused by coroner 0
6 6 5
Donor unsuitable – age 0 0 246 0 Donor unsuitable – past history 0 0 42 8 Donor age >=56 or donor weight >=80kg 0 0 0 553 Other 0 0 20 33
TOTAL DONORS WITH ORGANS NOT OFFERED 1 15 324 633
Organs offered for donation 1656 814 505 196
Organs not retrieved (% of organs offered for donation) 127 (8) 67 (8) 156 (31) 183 (93)
Reasons for non-retrieval Donor Donor unsuitable – medical 10 4 14 1 Donor unsuitable – non-medical 1 1 16 128 Donor age 12 1 5 5 Organ Organ unsuitable – clinical 74 37 91 29 Poor function 17 5 12 1 Other Other 13 19 18 19
TOTAL ORGANS OFFERED, NOT RETRIEVED 127 67 156 183
Organs retrieved (% of organs offered for donation) 1529 (92) 747 (92) 349 (69) 13 (7)
Organs transplanted in the UK 1414 668 172 132 Organs transplanted overseas 0 61 0 0 Organs not transplanted 115 73 177 0
Reasons for organ not being transplanted Donor Donor unsuitable – medical 28 3 10 0 Donor unsuitable – non-medical 0 0 2 0 Donor age 0 0 0 0 Organ Organ unsuitable – clinical 26 21 83 0 Poor function 0 1 0 0 Other Other 61 48 82 0
TOTAL ORGANS RETRIEVED, NOT TRANSPLANTED (Number used for research)
115 (66) 73 (52) 177 (133) 0 (0)
1
Transplanted into super-urgent patients in the Republic of Ireland 2
Excludes 1 bowel transplant from an overseas donor

- 27 -
Table 4.5
Reasons for non-retrieval and non-use of abdominal organs from DCD donors in the UK, 1 April 2016 – 31 March 2017
Kidney Liver Pancreas
All DCD organ donors 584 584 584
Donors from whom organs not offered for donation 1 9 364
Reasons for organs not being offered Family permission refused 1 4 10 Permission refused by coroner 0 5 1 Donor unsuitable – age 0 0 310 Donor unsuitable – past history 0 0 22 Other 0 0 21
TOTAL DONORS WITH ORGANS NOT OFFERED 1 9 364
Organs offered for donation 1166 575 220
Organs not retrieved (% of organs offered for donation) 37 (3) 281 (49) 106 (48)
Reasons for non-retrieval Donor Donor unsuitable – medical 3 0 1 Donor unsuitable – non-medical 1 11 14 Donor age 2 56 11 Organ Organ unsuitable – clinical 22 92 51 Poor function 3 25 4 Other Other 6 97 25
TOTAL ORGANS OFFERED, NOT RETRIEVED 37 281 106
Organs retrieved (% of organs offered for donation) 1129 (97) 294 (51) 114 (52)
Organs transplanted in the UK 976 208 49 Organs transplanted overseas 0 0 0 Organs not transplanted 153 86 65
Reasons for organ not being transplanted Donor Donor unsuitable – medical 39 6 4 Donor unsuitable – non-medical 0 0 1 Donor age 0 0 1 Organ Organ unsuitable – clinical 21 25 26 Poor function 0 0 0 Other Other 93 55 33
TOTAL ORGANS RETRIEVED, NOT TRANSPLANTED (Number used for research)
153 (97) 86 (58) 65 (46)

- 28 -
Table 4.6 Reasons for non-retrieval and non-use of cardiothoracic organs from organ donors
in the UK, 1 April 2016 – 31 March 2017
Heart (DBD) Lung (DBD) Lung (DCD)
All organ donors 829 829 584
Donors from whom organs not offered for donation 240 217 207
Reasons for organs not being offered Family permission refused 38 25 28 Permission refused by coroner 24 22 18 Donor age >65 years 170 170 159 Donor cause of death cardiac arrest or myocardial infarction 8 0 0 Other 0 0 2
TOTAL DONORS WITH ORGANS NOT OFFERED 240 217 207
Organs offered for donation 589 1224 754
Organs not retrieved (% of organs offered for donation) 407 (69) 944 (77) 690 (92)
Reasons for non-retrieval Donor Donor unsuitable – medical 16 31 22 Donor unsuitable – non-medical 61 66 22 Donor age 37 24 50 Organ Organ unsuitable – clinical 102 255 258 Poor function 163 469 276 Other Other 28 99 62
TOTAL ORGANS OFFERED, NOT RETRIEVED 407 944 690
Organs retrieved (% of organs offered for donation) 182 (31) 280 (23) 64 (8)
Organs transplanted in the UK 173 262 54 Organs transplanted overseas 2 4 0 Organs not transplanted 7 14 10
Reasons for organ not being transplanted Donor Donor unsuitable – medical 0 0 0 Donor unsuitable – non-medical 0 0 0 Organ Organ unsuitable – clinical 0 0 0 Poor function 3 2 0 Other Other 4 12 8
TOTAL ORGANS RETRIEVED, NOT TRANSPLANTED (Number used for research)
7 (2) 14 (7) 10 (4)

- 29 -
6
8
99 10
12
9
11 1110
0
2
4
6
8
10
12
14
16
18
20
2007-2008 2008-2009 2009-2010 2010-2011 2011-2012 2012-2013 2013-2014 2014-2015 2015-2016 2016-2017
% n
ot
tra
ns
pla
nte
d
Total retrieved 1564 1704 1837 1889 2032 2265 2469 2387 2565 2658
Percentage of kidneys retrieved that are not transplanted
from deceased organ donors in the UK, 1 April 2007 – 31 March 2017
Figure 4.3
Year
8
12 12
1313
14
11
13
17
15
0
2
4
6
8
10
12
14
16
18
20
2007-2008 2008-2009 2009-2010 2010-2011 2011-2012 2012-2013 2013-2014 2014-2015 2015-2016 2016-2017
% n
ot
tra
ns
pla
nte
d
Total retrieved 632 676 706 712 783 825 932 924 1011 1041
Percentage of livers retrieved that are not transplanted
from deceased organ donors in the UK, 1 April 2007 – 31 March 2017
Figure 4.4
Year
- 30 -
28
4042
46
39
46
42
4750
52
0
10
20
30
40
50
60
2007-2008 2008-2009 2009-2010 2010-2011 2011-2012 2012-2013 2013-2014 2014-2015 2015-2016 2016-2017
% n
ot
tra
ns
pla
nte
d
Total retrieved 340 366 370 400 400 440 445 458 458 463
Percentage of pancreases¹ retrieved that are not transplanted
from deceased organ donors in the UK, 1 April 2007 – 31 March 2017
Figure 4.5
Year
¹ Excludes donors aged > 60 years
2 2
2
3
0 0
4
2
5
4
0
1
2
3
4
5
6
2007-2008 2008-2009 2009-2010 2010-2011 2011-2012 2012-2013 2013-2014 2014-2015 2015-2016 2016-2017
% n
ot
tra
ns
pla
nte
d
Total retrieved 127 132 115 126 136 144 202 173 188 182
Percentage of hearts¹ retrieved that are not transplanted
from deceased organ donors² in the UK, 1 April 2007 – 31 March 2017
Figure 4.6
Year
¹ Excludes donors aged > 65 years or died due to myocardial infarction
² Excludes DCD hearts

- 31 -
15
19
16
11
5
119 9
87
0
5
10
15
20
25
2007-2008 2008-2009 2009-2010 2010-2011 2011-2012 2012-2013 2013-2014 2014-2015 2015-2016 2016-2017
% n
ot
tra
ns
pla
nte
d
Total retrieved 246 324 315 362 364 409 435 373 378 344
Percentage of lungs¹ retrieved that are not transplanted
from deceased organ donors in the UK, 1 April 2007 – 31 March 2017
Figure 4.7
Year
¹ Excludes donors aged > 65 years
- 32 -
5 Kidney Activity
Kidney Activity
Key messages
The number of patients registered on the kidney transplant list this year fell by 2% from 5313 to 5233
The number of deceased kidney donors increased by 3% to 1336
Kidney transplants from living donors fell by 3% to 1009, while transplants from deceased donors increased by 5% to 2338
74 kidney transplants were made possible by the paired living kidney donation
programme
There were 86 non-directed altruistic living kidney donors, this led to 122 patients benefitting from a living donor transplant

- 33 -
5.1 Overview The number of deceased kidney donors increased by 3% in 2016-2017 compared to 2015-2016 and the number of deceased donor kidney transplants increased by 5%. There were 5233 patients waiting for a kidney transplant at 31 March 2017, and for the 8th year running the number of patients on the national list for a kidney transplant has declined. A summary of activity for deceased donor kidney transplants and the transplant list at year end for the last ten years is shown in Figure 5.1. The number of patients registered on the active transplant list at 31 March 2017 for a kidney only or multi-organ kidney transplant has fallen by 25% since 2008. These registrations include patients suspended on the kidney waiting list but active on the liver waiting list for a combined liver and kidney transplant.
789
1453
859
1570
931
1657
957
1667
1031
1792
1148
1930
1243
2141
1204
2069
1293
2227
1336
2338
2007-2008 2008-2009 2009-2010 2010-2011 2011-2012 2012-2013 2013-2014 2014-2015 2015-2016 2016-2017
Year
0
1000
2000
3000
4000
5000
6000
7000
8000
Nu
mb
er
Figure 5.1 Deceased donor kidney programme in the UK, 1 April 2007 - 31 March 2017,
Number of donors, transplants and patients on the active transplant list at 31 March
Donors
Transplants
Transplant list
69807190 7183
68716633
6344
58815686
5313 5233
- 34 -
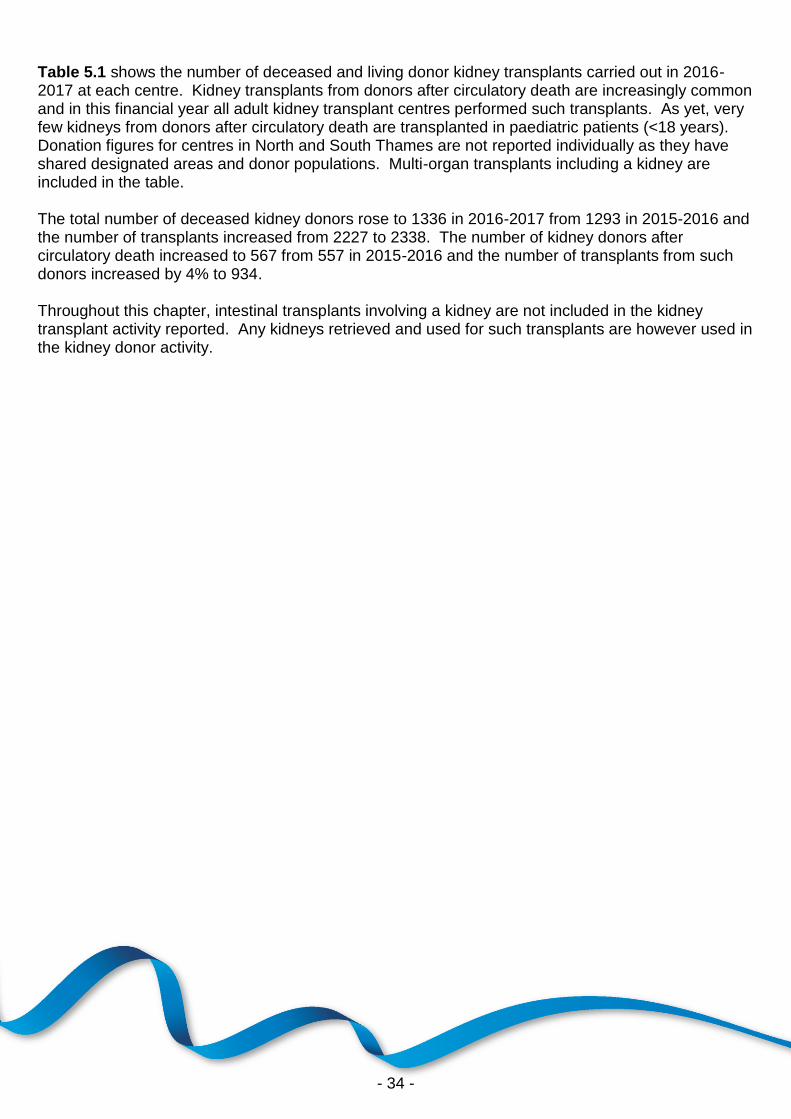
Table 5.1 shows the number of deceased and living donor kidney transplants carried out in 2016-2017 at each centre. Kidney transplants from donors after circulatory death are increasingly common and in this financial year all adult kidney transplant centres performed such transplants. As yet, very few kidneys from donors after circulatory death are transplanted in paediatric patients (<18 years). Donation figures for centres in North and South Thames are not reported individually as they have shared designated areas and donor populations. Multi-organ transplants including a kidney are included in the table. The total number of deceased kidney donors rose to 1336 in 2016-2017 from 1293 in 2015-2016 and the number of transplants increased from 2227 to 2338. The number of kidney donors after circulatory death increased to 567 from 557 in 2015-2016 and the number of transplants from such donors increased by 4% to 934. Throughout this chapter, intestinal transplants involving a kidney are not included in the kidney transplant activity reported. Any kidneys retrieved and used for such transplants are however used in the kidney donor activity.

- 35 -
Table 5.1 Kidney donors and transplants, 1 April 2016 - 31 March 2017 (2015-2016) and transplant list at 31 March 2017 (2016) in the UK, by centre Centre Deceased kidney donors Deceased donor transplants Living donor
transplants Active transplant list
DBD DCD DBD DCD
Belfast 31 (28) 10 (18) 35 (27) 10 (23) 79 (66) 120 (115) Birmingham 47 (51) 44 (29) 96 (111) 31 (32) 65 (64) 413 (425) Bristol 32 (28) 19 (27) 63 (57) 31 (36) 30 (45) 227 (262) Cambridge 36 (30) 51 (59) 58 (46) 87 (82) 41 (53) 211 (184) Cardiff 27 (31) 15 (18) 28 (32) 25 (37) 38 (29) 135 (98) Coventry
1 10 (11) 5 (9) 19 (14) 11 (12) 22 (29) 84 (92)
Edinburgh 29 (19) 34 (31) 46 (56) 33 (23) 36 (39) 169 (165) Glasgow 43 (34) 19 (11) 61 (66) 45 (51) 47 (41) 271 (264) Great Ormond Street 0 (0) 0 (0) 4 (7) 0 (0) 18 (19) 12 (6) Leeds 42 (43) 33 (27) 87 (84) 57 (58) 45 (46) 216 (227) Leicester 10 (18) 10 (7) 59 (42) 25 (29) 26 (21) 154 (190) Liverpool 46 (34) 32 (30) 35 (39) 38 (30) 41 (43) 155 (185) Manchester 57 (42) 41 (41) 140 (127) 104 (91) 78 (105) 395 (482) Newcastle 50 (50) 31 (34) 63 (44) 48 (30) 59 (51) 244 (218) North Thames
2 90 (93) 52 (49) - - - - - - - -
Royal Free - - - - 60 (52) 33 (30) 33 (39) 243 (246) Royal London - - - - 77 (57) 38 (27) 33 (34) 295 (306) WLRTC - - - - 86 (86) 44 (47) 48 (36) 429 (400) Nottingham 16 (15) 18 (28) 40 (40) 32 (34) 10 (19) 145 (128) Oxford
1 34 (25) 25 (19) 98 (87) 71 (72) 54 (48) 273 (280)
Plymouth 18 (36) 20 (21) 18 (22) 22 (24) 17 (13) 90 (67) Portsmouth 35 (33) 18 (26) 58 (31) 26 (33) 23 (23) 188 (203) Sheffield 18 (14) 11 (12) 27 (32) 20 (19) 22 (23) 151 (164) South Thames
2 98 (101) 79 (61) - - - - - - - -
Guy's - - - - 93 (114) 72 (55) 79 (89) 343 (331) St George's - - - - 53 (55) 31 (24) 54 (49) 270 (275)
TOTAL 769 (736) 567 (557) 1404 (1328) 934 (899) 10093,5
(10384,6
) 5233 (5313)
WLRTC - West London Renal and Transplant Centre 1 As of 1 June 2016 Coventry and Oxford began working in partnership as a transplant network
2 Donor figures in this area cannot be linked to individual transplant centres due to shared retrieval areas
3 Includes an additional 1 transplant performed at The London Clinic; 1 at The London Independent Hospital; 5 at London, Cromwell Hospital and 4 at London Bridge Hospital
4 Includes an additional 3 transplants performed at The London Independent Hospital; 7 at London, Cromwell Hospital; and 4 at London Bridge Hospital
5 Includes 2 domino donors;
6 Includes 2 domino donors

- 36 -
5.2 Transplant list The number of patients registered on the kidney or kidney and pancreas transplant list fell by 2% in the year: on 31 March 2017, 5,233 patients were registered as active, compared with 5,313 at the end of March 2016. The number of patients waiting for a kidney transplant represents 80.1 patients per million population (pmp). Of the 5,233 patients on the active transplant list at 31 March 2017, 195 required a kidney and pancreas transplant (184 at 31 March 2016). Additionally, 29 patients were registered for a pancreas only transplant (43 at 31 March 2016). The outcome of patients registered on the UK kidney and kidney/pancreas transplant list at 1 April 2016, or subsequently registered during the financial year, is shown in Table 5.2. A total of 3,710 patients joined the kidney transplant list last year, while a further 215 joined the kidney/pancreas transplant list.
Table 5.2 Kidney transplant list and new registrations in the UK,
1 April 2016 - 31 March 2017 Outcome of patient at 31 March 2017
Active and suspended patients at 1 April
2016
New registrations
in 2016-20171
TOTAL
N % N % N % Kidney transplant list Remained active/suspended 5129 62 2966 80 8095 68 Transplanted 2332 28 705 19 3037 25 Removed 520 6 21 1 541 5 Died 248 3 18 0 266 2 TOTAL 8229 3710 11939 Kidney/pancreas transplant list Remained active/suspended 152 47 180 84 332 62 Transplanted 132 41 30 14 162 30 Removed 24 7 1 0 25 5 Died 14 4 4 2 18 3 TOTAL 322 215 537 1 Includes re-registrations for second or subsequent transplants
Table 5.3 shows the active transplant list in the UK at 31 March 2017 and 2016 by country/ former Strategic Health Authority of patient's residence. In 2017, the overall kidney transplant list rate was 80.1 pmp with rates across the Strategic Health Authorities ranging from 58.1 pmp to 130.2 pmp.

- 37 -
Table 5.3 Active kidney transplant list at 31 March, by country/ Strategic Health Authority of patient residence Country/ Strategic Health Kidney transplant list (pmp) Authority of residence 2017 2016
North East 206 (78.6) 187 (71.4) North West 520 (72.5) 619 (86.3) Yorkshire and The Humber 342 (63.5) 375 (69.6) North of England 1068 (70.4) 1181 (77.8)
East Midlands 359 (76.7) 373 (79.7) West Midlands 509 (88.5) 524 (91.1) East of England 384 (63.2) 371 (61.0) Midlands and East 1252 (75.8) 1268 (76.8)
London 1129 (130.2) 1106 (127.6)
South East Coast 269 (58.1) 275 (59.4) South Central 356 (82.4) 367 (85.0) South West 389 (71.1) 398 (72.8) South of England 1014 (70.3) 1040 (72.1)
England 4463 (81.5) 4595 (83.9) Isle of Man 6 (75.0) 9 (112.5) Channel Islands 11 (68.8) 12 (75.0)
Wales 185 (59.7) 145 (46.8)
Scotland 437 (81.4) 427 (79.5)
Northern Ireland 125 (67.6) 121 (65.4)
TOTAL
1 5233 (80.1) 5313 (81.3)
1
Includes patients in 2017 (2016) residing in: Unspecified UK 6 (1); Republic of Ireland 0 (1); Overseas 0 (2)
An indication of outcomes for adult patients listed for a kidney only transplant is summarised in Figure 5.2. This shows the proportion of patients transplanted or still waiting one, three and five years after joining the list. It also shows the proportion removed from the transplant list (typically because they become too unwell for transplant) and those dying while on the transplant list. Only 25% of patients are transplanted within one year, while five years after listing 72% of patients have received a transplant.
The median (average) waiting time for a kidney only transplant has fallen from 944 days reported last year to 864 days for an adult patient and is shown by blood group in Table 5.4 and patient ethnicity in Table 5.5. Because of the need to match donor and recipient blood groups and tissue types, waiting times to transplant differ according to patient blood groups and ethnicity due to differences between the donor pool and patients awaiting a kidney transplant. Note that these waiting times are not adjusted for other relevant factors which may be influential and which may differ across blood or ethnic groups.

- 38 -
1 year 3 year 5 year
Time since listing
0
10
20
30
40
50
60
70
80
90
100
Pe
rce
nta
ge
DiedRemovedStill w aitingTransplanted
Figure 5.2 Post-registration outcome for 2804 new adult kidney only registrations made in the UK,
1 April 2011 - 31 March 2012
25
72
21
56
32
6
5
72
11
10
7
Table 5.4 Median waiting time to kidney only transplant in the UK, for patients registered 1 April 2010 - 31 March 2014 Blood group Number of patients Waiting time (days)
registered Median 95% Confidence interval Adult O 4081 1032 1005 - 1059 A 3192 664 637 - 691 B 1273 1029 975 - 1083 AB 375 293 242 - 344 TOTAL 8921 864 845 - 883
Paediatric O 110 367 288 - 446 A 97 217 115 - 319 B 41 177 110 - 244 AB 11 287 214 - 360 TOTAL 259 266 205 - 327

- 39 -
Table 5.5 Median waiting time to kidney only transplant in the UK, for patients registered 1 April 2010 - 31 March 2014 Ethnicity Number of patients Waiting time (days)
registered Median 95% Confidence interval Adult White 6312 806 785 - 827 Asian 1447 962 917 - 1007 Black 789 1074 1025 - 1123 Other 259 929 863 - 995 TOTAL¹ 8921 864 845 - 883
Paediatric White 155 222 156 - 288 Asian 69 397 194 - 600 Black 20 323 0 - 669 Other³ 9 - - TOTAL² 259 266 205 - 327
¹ Includes 114 patients whose ethnicity was not reported ² Includes 6 patients whose ethnicity was not reported ³ Median waiting time not calculated for fewer than 10 patients

- 40 -
5.3 Donor and organ supply Of the 829 organ donors after brain death in the UK in 2016-2017, 769 (93%) were kidney donors. From these donors, 1,529 kidneys were retrieved. There were 567 kidney donors after circulatory death in 2016-2017. From these donors, 1,129 kidneys were retrieved. Table 5.6 shows this activity by donor country/Strategic Health Authority of donor's residence. No adjustments have been made for potential demographic differences in populations. The overall rate for kidney donors after brain death is 11.8 pmp, with rates across the Strategic Health Authorities ranging from 7.5 to 18.7 pmp. The number of kidneys retrieved from donors after brain death in the UK is 23.4 pmp and varies from 15 to 36.6 pmp. The overall rate for kidney donors after circulatory death is 8.7 pmp, with rates across the Strategic Health Authorities ranging from 5.5 to 12.3 pmp. The number of kidneys retrieved from donors after circulatory death is 17.3 pmp and varies from 11.1 to 24.7 pmp.
Table 5.6 Kidney donation and retrieval rates for deceased donors in the UK, 1 April 2016 - 31 March 2017, by country/ Strategic Health Authority Country/ Strategic Health Kidney donors (pmp) Kidneys retrieved (pmp) Authority of residence DBD DCD DBD DCD
North East 49 (18.7) 22 (8.4) 96 (36.6) 44 (16.8) North West 87 (12.1) 70 (9.8) 172 (24.0) 140 (19.5) Yorkshire and The Humber 56 (10.4) 44 (8.2) 111 (20.6) 86 (16.0) North of England 192 (12.6) 136 (9.0) 379 (25.0) 270 (17.8)
East Midlands 35 (7.5) 35 (7.5) 70 (15.0) 70 (15.0) West Midlands 63 (11.0) 48 (8.3) 125 (21.7) 96 (16.7) East of England 69 (11.3) 75 (12.3) 138 (22.7) 150 (24.7) Midlands and East 167 (10.1) 158 (9.6) 333 (20.2) 316 (19.1)
London 86 (9.9) 48 (5.5) 172 (19.8) 96 (11.1)
South East Coast 69 (14.9) 51 (11.0) 138 (29.8) 102 (22.0) South Central 47 (10.9) 36 (8.3) 94 (21.8) 71 (16.4) South West 62 (11.3) 42 (7.7) 124 (22.7) 82 (15.0) South of England 178 (12.3) 129 (8.9) 356 (24.7) 255 (17.7)
England 623 (11.4) 471 (8.6) 1240 (22.6) 937 (17.1) Isle of Man 2 (25.0) 2 (25.0) 4 (50.0) 4 (50.0) Channel Islands 4 (25.0) 1 (6.3) 8 (50.0) 2 (12.5)
Wales 36 (11.6) 27 (8.7) 69 (22.3) 54 (17.4)
Scotland 74 (13.8) 55 (10.2) 148 (27.6) 110 (20.5)
Northern Ireland 30 (16.2) 11 (5.9) 60 (32.4) 22 (11.9)
TOTAL1 769 (11.8) 567 (8.7) 1529 (23.4) 1129 (17.3) 1
Includes 14 donors where the hospital postcode was used in place of an unknown donor postcode

- 41 -
5.4 Transplants The number of kidney transplants by recipient country/Strategic Health Authority of residence is shown in Table 5.7. No adjustments have been made for potential demographic differences in populations. The deceased donor transplant rate ranged from 23.5 to 45.6 pmp across Strategic Health Authorities and overall was 33 pmp. The living donor transplant rate ranged from 8.8 to 21.4 pmp across the Strategic Health Authorities and overall was 15.1 pmp.
Table 5.7 Kidney only transplant rates per million population (pmp), in the UK, 1 April 2016 - 31 March 2017, by country and English Strategic Health Authority Country/ Strategic Health DBD DCD TOTAL Living Authority of residence N (pmp) N (pmp) N (pmp) N (pmp)
North East 47 (17.9) 39 (14.9) 86 (32.8) 56 (21.4) North West 152 (21.2) 121 (16.9) 273 (38.1) 113 (15.8) Yorkshire and The Humber 116 (21.5) 75 (13.9) 191 (35.4) 65 (12.1) North of England 315 (20.8) 235 (15.5) 550 (36.2) 234 (15.4)
East Midlands 99 (21.2) 57 (12.2) 156 (33.3) 41 (8.8) West Midlands 108 (18.8) 44 (7.7) 152 (26.4) 80 (13.9) East of England 76 (12.5) 112 (18.4) 188 (30.9) 86 (14.1) Midlands and East 283 (17.1) 213 (12.9) 496 (30) 207 (12.5)
London 254 (29.3) 141 (16.3) 395 (45.6) 138 (15.9)
South East Coast 68 (14.7) 41 (8.9) 109 (23.5) 59 (12.7) South Central 95 (22) 67 (15.5) 162 (37.5) 76 (17.6) South West 95 (17.4) 64 (11.7) 159 (29.1) 63 (11.5) South of England 258 (17.9) 172 (11.9) 430 (29.8) 198 (13.7)
England 1110 (20.3) 761 (13.9) 1871 (34.1) 777 (14.2) Isle of Man 1 (12.5) 2 (25) 3 (37.5) 0 (0) Channel Islands 1 (6.3) 0 (0) 1 (6.3) 1 (6.3)
Wales 36 (11.6) 38 (12.3) 74 (23.9) 51 (16.5)
Scotland 86 (16) 78 (14.5) 164 (30.5) 83 (15.5)
Northern Ireland 35 (18.9) 10 (5.4) 45 (24.3) 77 (41.6)
TOTAL1, 2 1269 (19.4) 890 (13.6) 2159 (33) 990 (15.1) 1 Excludes recipients of a kidney who reside outside of the UK (1 deceased donor, 19 living donors)
2 Includes recipients of a kidney with an unspecified postcode in the UK (1 deceased donor, 1 living donor)
The number of kidney only transplants from deceased donors at each transplant centre is shown in Table 5.8 for adult patients only. Kidney transplants from donors after brain death include 5 en bloc kidneys and 16 double kidney transplants in 2016-2017 (4 and 14 in 2015-2016). Kidney transplants from donors after circulatory death include 8 en bloc and 37 double kidney transplants in 2016-2017 (8 and 32 in 2015-2016). This table excludes multi-organ transplants: 10 kidney and liver, 1 kidney and heart, 162 kidney and pancreas, 1 kidney and islets and 1 multivisceral.

- 42 -
Table 5.8 Adult kidney only transplants in the UK, 1 April 2015 - 31 March 2017, by transplant centre
2015-2016 2016-2017 Transplant centre DBD DCD
Living donor
TOTAL DBD DCD
Living donor
TOTAL
Belfast 27 23 66 116 34 10 74 118 Birmingham 96 32 58 186 82 31 56 169 Bristol 55 36 42 133 55 31 29 115 Cambridge 29 72 53 154 39 79 41 159 Cardiff 28 35 26 89 24 24 35 83 Coventry
1 14 12 29 55 19 11 22 52
Edinburgh 39 23 39 101 25 33 36 94 Glasgow 62 51 39 152 60 45 43 148 Guy's 84 46 74 204 75 64 68 207 Leeds 73 57 41 171 79 57 43 179 Leicester 42 29 20 91 59 25 26 110 Liverpool 39 30 43 112 35 38 41 114 Manchester 108 77 86 271 118 91 68 277 Newcastle 35 30 49 114 52 48 53 153 Nottingham 30 34 16 80 30 30 8 68 Oxford
1 50 63 48 161 59 59 54 172
Plymouth 22 24 13 59 18 22 16 56 Portsmouth 31 33 23 87 58 26 23 107 Sheffield 32 19 23 74 27 20 22 69 St George's 55 24 49 128 53 31 54 138 The Royal Free 49 30 39 118 58 33 33 124 The Royal London 57 27 34 118 77 38 33 148 WLRTC 77 44 36 157 82 41 48 171
TOTAL 1134 851 9602 2945 1218 887 9373 3042
WLRTC - West London Renal and Transplant Centre
1 As of 1 June 2016 Coventry and Oxford began working in partnership as a transplant network
2 Includes 3 transplant performed at London Independent, 7 at London Cromwell Hospital and 4 at London Bridge
3 Includes 1 transplant performed at London Clinic, 1 at London Independent, 5 at London Cromwell Hospital and 4 at London Bridge
Living donor kidney transplants fell by 3% to 1009 in 2016-2017, representing 30% of the total kidney transplant programme. The total number of living donor adult transplants performed by each transplant centre is shown in Table 5.9. Also shown is the number as a percentage of patients listed at the end of the year, to indicate the size of the living donor programme relative to the centre's transplant list.
Most living donor transplants are 'directed'. This means that a kidney is donated to a specific recipient known to the donor - a close family member or friend. There has been a 1% decrease in these transplants. In addition there are now a number of 'undirected' living donor transplants (also known as altruistic donor transplants). Last year 86 such donors donated a kidney to a recipient, 82 transplanted into an adult recipient and 4 transplanted into a paediatric recipient. Of the 86 altruistic donors, 24 went into an altruistic donor chain (12 short (2 transplants each) and 12 long chains (3 transplants each)) benefiting 35 adult and 1 paediatric patient in the paired/pooled scheme. The kidneys from the paired donors of these recipients led to 23 adult and 1 paediatric transplant for patients on the deceased donor transplant list. Thus 24 altruistic donors creating chains benefited 58 adult and 2 paediatric patients in total.

- 43 -
When a potential donor and recipient are biologically incompatible (blood group or tissue type), they may consider joining a list of others in the same situation with the hope that an exchange of kidneys between them can lead to a compatible living donor transplant. The scheme also includes compatible pairs that would like a better match. This type of exchange is known as paired donation and most exchanges are between two pairs (i.e. two donors and their respective incompatible recipients), or between three pairs. In 2016-2017, there were also 74 paired living kidney donor transplants (72 adult and 2 paediatric recipients). As a percentage of the number of patients on the active transplant list at 31 March 2017, the number of living donor adult transplants in the year was 18% and ranged from 6% to 62% at individual transplant centres.
Table 5.9 Adult living donor kidney transplants in the UK,
1 April 2016 - 31 March 2017, and percentage of active transplant list at 31 March, by transplant centre
2016-2017 TOTAL
Transplant centre
Directed Non-directed (altruistic) to waiting list
Paired/ pooled
exchanges
Altruistic donor
chain⁴
N % list
Belfast 58 1 11 4 74 62 Birmingham 47 5 4 0 56 15 Bristol 24 3 0 2 29 14 Cambridge 35 3 2 1 41 20 Cardiff 28 3 1 3 35 26 Coventry¹ 12 3 6 1 22 26 Edinburgh 29 2 1 4 36 21 Glasgow 30 7 3 3 43 16 Guy's 58 2 4 4 68 21 Leeds 33 2 5 3 43 21 Leicester 25 1 0 0 26 17 Liverpool 34 3 0 4 41 26 Manchester 60 2 4 2 68 18 Newcastle 45 4 4 0 53 22 Nottingham 7 1 0 0 8 6 Oxford¹ 33 4 11 6 54 20 Plymouth 13 1 0 2 16 18 Portsmouth 16 3 2 2 23 12 Sheffield 15 3 2 2 22 15 St George's 40 2 5 7 54 20 The Royal Free 28 2 2 1 33 14 The Royal London 29 2 1 1 33 11 WLRTC 36 2 4 6 48 11
TOTAL 746² 61³ 72 58 937² 18
WLRTC – West London Renal and Transplant Centre ¹ As of 1 June 2016 Coventry and Oxford began working in partnership as a transplant network ² Includes 1 transplant performed at London Clinic, 1 at London Independent, 5 at London Cromwell
Hospital and 4 at London Bridge
³ Includes 2 domino donor transplants
⁴ Includes transplants for paired pooled and deceased donor transplant list patients
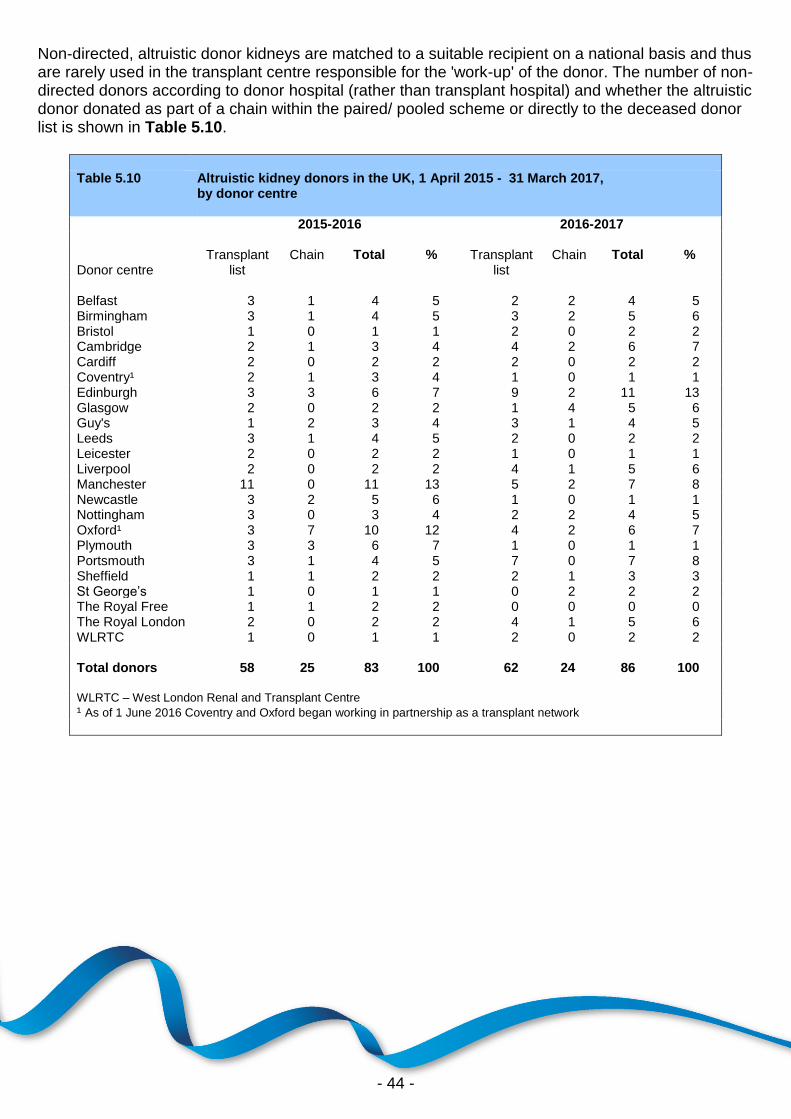
- 44 -
Non-directed, altruistic donor kidneys are matched to a suitable recipient on a national basis and thus are rarely used in the transplant centre responsible for the 'work-up' of the donor. The number of non-directed donors according to donor hospital (rather than transplant hospital) and whether the altruistic donor donated as part of a chain within the paired/ pooled scheme or directly to the deceased donor list is shown in Table 5.10.
Table 5.10 Altruistic kidney donors in the UK, 1 April 2015 - 31 March 2017,
by donor centre 2015-2016 2016-2017
Donor centre Transplant
list Chain Total % Transplant
list Chain Total %
Belfast 3 1 4 5 2 2 4 5 Birmingham 3 1 4 5 3 2 5 6 Bristol 1 0 1 1 2 0 2 2 Cambridge 2 1 3 4 4 2 6 7 Cardiff 2 0 2 2 2 0 2 2 Coventry¹ 2 1 3 4 1 0 1 1 Edinburgh 3 3 6 7 9 2 11 13 Glasgow 2 0 2 2 1 4 5 6 Guy's 1 2 3 4 3 1 4 5 Leeds 3 1 4 5 2 0 2 2 Leicester 2 0 2 2 1 0 1 1 Liverpool 2 0 2 2 4 1 5 6 Manchester 11 0 11 13 5 2 7 8 Newcastle 3 2 5 6 1 0 1 1 Nottingham 3 0 3 4 2 2 4 5 Oxford¹ 3 7 10 12 4 2 6 7 Plymouth 3 3 6 7 1 0 1 1 Portsmouth 3 1 4 5 7 0 7 8 Sheffield 1 1 2 2 2 1 3 3 St George’s 1 0 1 1 0 2 2 2 The Royal Free 1 1 2 2 0 0 0 0 The Royal London 2 0 2 2 4 1 5 6 WLRTC 1 0 1 1 2 0 2 2 Total donors 58 25 83 100 62 24 86 100 WLRTC – West London Renal and Transplant Centre ¹ As of 1 June 2016 Coventry and Oxford began working in partnership as a transplant network

- 45 -
The number of deceased donor and living donor transplants in paediatric patients (<18 years) performed by each paediatric transplant centre is shown in Table 5.11. There were 72 living donor transplants and 55 deceased donor transplants in paediatric patients in 2016-2017. The paediatric transplant list has increased by 9% from 77 patients at 31 March 2016 to 84 at the end of March 2017. Occasionally older paediatric patients are listed and/or transplanted at adult kidney transplant centres and these are indicated in Table 5.11.
Table 5.11 Paediatric patient kidney transplants in the UK, 1 April 2015 - 31 March 2017, by transplant centre
2015-2016 2016-2017 Paediatric transplant centre DBD DCD
Living donor
TOTAL DBD DCD
Living donor
TOTAL
Belfast 0 0 0 0 1 0 5 6 Birmingham 5 0 6 11 7 0 9 16 Bristol 2 0 3 5 8 0 1 9 Glasgow 4 0 2 6 1 0 4 5 Great Ormond Street 7 0 19 26 4 0 18 22 Guy's 4 1 15 20 2 0 11 13 Leeds 8 1 5 14 8 0 2 10 Manchester 5 2 19 26 6 1 10 17 Newcastle 2 0 2 4 3 0 6 9 Nottingham 10 0 3 13 10 2 2 14 Adult centres 0 0 4 4 2 0 4 6
TOTAL 47 4 78 129¹ 52 3 72² 127
¹ Includes 2 non-directed donor transplants and 3 altruistic donor chains (as patients on transplant list at end of chain) ² Includes 3 non-directed donor transplants, 2 paired living donor transplants, and 2 altruistic donor chains (1 as a patient on transplant list at end of chain, and 1 as part of a paired programme)
At 31 March 2017, there were approximately 35,800 recipients with a functioning kidney transplant (including multi-organ transplants) being followed-up as reported to the UK Transplant Registry. Rates of pre-emptive kidney only transplantation are shown in Table 5.12. Of the 3,169 kidney only transplant recipients in 2016-2017, dialysis status at time of transplant was reported for 3,039 (96%). Of these 3,039 transplants, 671 (22%) were carried out in pre-dialysis patients. Pre-emptive transplants accounted for 28% of all paediatric kidney only transplants with reported dialysis status, compared with 22% of those in adults. Living donor transplants are more likely to be carried out before the need for dialysis than deceased donor transplants: 34% and 15% respectively. This is because a living donor transplant can often be carried out more quickly than a deceased donor kidney transplant as the latter often necessitates a long waiting time.

- 46 -
Table 5.12 Pre-emptive kidney only transplants in the UK, 1 April 2016 - 31 March 2017
Number of kidney only transplants
Number of transplants with known dialysis status at transplant
(% of all)
Percentage of patients transplanted prior to the
need for dialysis (of those with known
status) Adult Deceased donor transplant 2105 2016 (95.8) 14.9 Living donor transplant 937 900 (96.1) 34.6
Paediatric Deceased donor transplant 55 54 (98.2) 20.0 Living donor transplant 72 69 (95.8) 31.9
The length of time that elapses between a kidney being removed from the donor to its transplantation into the recipient is called cold ischaemia time (CIT). Generally, the shorter this time, the more likely the kidney is to work immediately and the better the long-term outcome. The factors which determine CIT include a) transportation of the kidney from the retrieval hospital to the hospital where the transplant is performed, b) the need to tissue type the donor and cross-match the donor and potential recipients, c) the occasional necessity of moving the kidney to another hospital if a transplant cannot go ahead, d) contacting and preparing the recipient for the transplant and e) access to the operating theatre. Median CITs are shown in addition to inter-quartile ranges in Table 5.13.
Table 5.13 Median cold ischaemia time for kidney only transplants in the UK, 1 April 2016 - 31 March 2017
Number of kidney only transplants
1 Median (hours)
Inter-quartile range2
Q1 Q3 Adult DBD donor transplant 1218 13.6 10.5 17.3 DCD donor transplant 887 12.9 9.9 16.3 Total 2105 13.3 10.3 17.0
Paediatric DBD donor transplant 52 14.0 10.4 16.6 DCD donor transplant 3 13.3 12.2 15.0 Total 55 13.9 10.8 16.6
TOTAL 2160 13.3 10.3 17.0
1 Not all cold ischaemia times are reported
2 25% of times are shorter than Q1, 25% are longer than Q3

- 47 -
Kidneys from donors after brain death and some kidneys from donors after cardiothoracic death are allocated on the basis of a national Kidney Allocation Scheme which incorporates HLA matching between donor and recipient. These HLA matches are based on four levels which are described in Table 5.14. Patients with 000 HLA-A, B, DR mismatch (Level 1) are prioritised in the schemes, whereas kidneys are rarely transplanted as a Level 4 match. More information about the allocation scheme can be found at www.odt.nhs.uk. Table 5.15 gives the HLA mismatch group for adult and paediatric patients for DBD donor transplants but also for DCD and living donor transplants. For living donor transplantation, many transplants have a less good HLA match between donor and recipient. Very often there is no genetic relationship between donor and recipient.
Table 5.14 HLA mismatch groups Level HLA mismatch summary HLA mismatch combinations included 1 000 000 2 [0 DR and 0/1 B] 100, 010, 110, 200, 210 3 [0 DR and 2 B] or [1 DR and 0/1 B] 020, 120, 220, 001, 101, 201, 011, 111, 211 4 [1 DR and 2 B] or [2 DR] 021, 121, 221, 002, 102, 202, 012, 112, 212,
022, 122, 222
Table 5.15 HLA matching for kidney only transplants in the UK,
1 April 2016 - 31 March 2017 DBD DCD Living N (%) N (%) N (%) Adult Level 1 (Best match) 187 (15) 48 (5) 102 (11) Level 2 507 (42) 212 (24) 153 (17) Level 3 479 (39) 527 (59) 393 (43) Level 4 45 (4) 100 (11) 256 (28) Not reported 33 Paediatric Level 1 (Best match) 4 (8) 1 (33) 1 (1) Level 2 42 (81) 2 (67) 17 (24) Level 3 6 (12) 0 (0) 50 (71) Level 4 0 (0) 0 (0) 2 (3) Not reported 2

- 48 -
Often potential living donors and their recipients are HLA or blood group incompatible. Increasingly it is possible to proceed with transplantation across the incompatibilities with appropriate management. The number of HLA and ABO blood group incompatible transplants over the last ten years is shown in Figure 5.3. Of the 654 HLA incompatible (HLAi) transplants performed; 188 used kidneys from deceased donors and 466 used living donor kidneys whilst the vast majority of ABO incompatible (ABOi) transplants used living donor kidneys (681 of 686). Due to the nature of reporting HLA incompatible transplants the numbers presented may be subject to change over time.
53
25
3
73
45
5
82
73
13
63
84
10
7578
12
68
95
10
75
86
8
63
72
2
50
56
2
52
72
2007-2008 2008-2009 2009-2010 2010-2011 2011-2012 2012-2013 2013-2014 2014-2015 2015-2016 2016-2017
Year
0
20
40
60
80
100
120
Nu
mb
er
HLAi & ABOi
ABOi
HLAi
Figure 5.3 Incompatible kidney only transplants in the UK, 1 April 2007 - 31 March 2017

- 49 -
5.5 Demographic characteristics The age group, sex, ethnicity and blood group of deceased donors, transplant recipients and patients on the transplant list are shown in Table 5.16 and for living donors and transplants in Table 5.17. Note that all percentages quoted are based only on data where relevant information was available. Changes made to the Kidney Allocation Scheme in 2006 mean that tissue matching criteria between donor and recipient are less strict than previously and waiting time to transplant is now more important than it was in deciding kidney allocation. These changes have an indirect benefit for patients from ethnic minority groups, who are less often a good tissue match with the predominantly white donor pool. As a result, access to transplantation is becoming more equitable.
Table 5.16 Demographic characteristics of deceased kidney donors and transplant recipients, 1 April 2016 - 31 March 2017, and transplant list patients at 31 March Age group (years)
Donors Transplant recipients Active transplant list patients
N (%) N (%) N (%)
0 - 17 52 (4) 59 (3) 84 (2) 18 - 34 181 (14) 293 (13) 602 (12) 35 - 49 303 (23) 685 (29) 1473 (28) 50 - 59 330 (25) 614 (26) 1461 (28) 60 - 69 294 (22) 526 (22) 1202 (23) 70+ 176 (13) 161 (7) 411 (8) mean (SD) 51 (17) 50 (15) 51 (14)
Male 760 (57) 1472 (63) 3095 (59) Female 576 (43) 866 (37) 2138 (41)
White 1243 (94) 1661 (72) 3416 (66) Asian 27 (2) 384 (17) 923 (18) Black 17 (1) 189 (8) 600 (12) Chinese 3 (0) 24 (1) 71 (1) Other 31 (2) 46 (2) 133 (3) Not reported 15 34 90
O 619 (46) 1006 (43) 2775 (53) A 564 (42) 953 (41) 1418 (27) B 119 (9) 278 (12) 914 (17) AB 34 (3) 101 (4) 126 (2)
First graft 2004 (86) 3997 (76) Re-graft 334 (14) 1236 (24)
TOTAL 1336 (100) 2338 (100) 5233 (100)

- 50 -
Table 5.17 Demographic characteristics of living kidney donors and transplant recipients, 1 April 2016 - 31 March 2017 Age group (years)
Donors Transplant recipients
N (%) N (%)
0 - 17 0 (0) 72 (7) 18 - 34 191 (19) 224 (22) 35 - 49 363 (36) 265 (26) 50 - 59 263 (26) 240 (24) 60 - 69 159 (16) 161 (16) 70+ 33 (3) 47 (5) mean (SD) 48 (13) 45 (17)
Male 485 (48) 611 (61) Female 524 (52) 398 (39)
White 876 (87) 843 (84) Asian 75 (7) 80 (8) Black 17 (2) 29 (3) Chinese 7 (1) 6 (1) Other 33 (3) 41 (4) Not reported 1 10
O 580 (58) 458 (45) A 311 (31) 377 (37) B 95 (9) 128 (13) AB 21 (2) 46 (5) Not reported 2
First graft 865 (86) Re-graft 144 (14)
TOTAL 1009 (100) 1009 (100)

- 51 -
6 Pancreas Activity
Pancreas Activity
Key messages
The number of patients waiting on the pancreas transplant list fell by 1% during the year, to 224 at 31 March 2017
The number of pancreas donors after brain death increased by 5% to 360, while transplants from donors after brain death increased by 2% to 164
The number of pancreas donors after circulatory death fell by 6% to 117, while transplants from donors after circulatory death fell by 11% to 49
34 islet transplants were made possible by the pancreas islet transplant programme, an increase of 10% compared with last year

- 52 -
6.1 Overview The number of patients registered on the active transplant list at 31 March for a pancreas, simultaneous kidney/pancreas (SPK) or islet transplant has increased slightly over the last ten years from 219 patients in 2008 to 224 patients in 2017. The number of pancreas donors has increased steadily from 305 to 477. However the number of transplants has decreased in the last 4 years to 213 transplants in 2016-2017. A summary of activity for deceased donor pancreas transplants and the transplant list for 1 April 2007 - 31 March 2017 is shown in Figure 6.1. A National Pancreas Allocation Scheme was introduced on 1 December 2010. Patients are prioritised according to a points system based on a range of clinical factors. A score is calculated for every potentially suitable patient on the national active transplant list and the pancreas is allocated preferentially to the patient with the most points. Pancreases from donors after brain death and donors after circulatory death are allocated through this scheme. Patients listed for a vascularized pancreas or islet transplant are prioritised through one combined national transplant list. The scheme has reduced the incidence of long waiting patients and is improving equity in access to transplant irrespective of where in the UK each patient resides. Throughout this chapter, intestinal transplants involving a pancreas are not included in the pancreas transplant activity reported. Any pancreases retrieved and used for such transplants are however included in the pancreas donor activity. In 2016-2017 there were 14 intestinal transplants including a pancreas.
305
245
380
214
386
205
406
210
409
239
452
233
456
246
462
226
468
216
477
213
2007-2008 2008-2009 2009-2010 2010-2011 2011-2012 2012-2013 2013-2014 2014-2015 2015-2016 2016-2017
Year
0
50
100
150
200
250
300
350
400
450
500
Nu
mb
er
Figure 6.1 Deceased pancreas and islet programme in the UK, 1 April 2007 - 31 March 2017,
Number of donors, transplants and patients on the active transplant list at 31 March
Donors
Transplants
Transplant list
219
313
333322
252
271 269
252
227 224
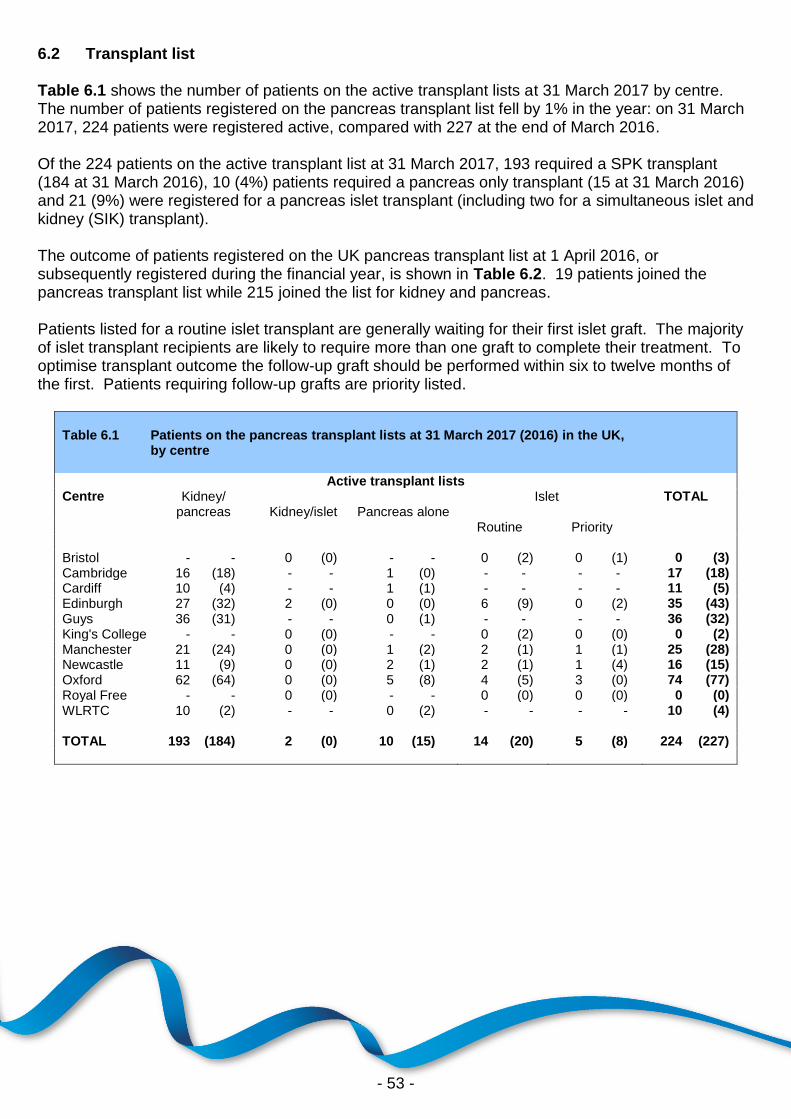
- 53 -
6.2 Transplant list Table 6.1 shows the number of patients on the active transplant lists at 31 March 2017 by centre. The number of patients registered on the pancreas transplant list fell by 1% in the year: on 31 March 2017, 224 patients were registered active, compared with 227 at the end of March 2016. Of the 224 patients on the active transplant list at 31 March 2017, 193 required a SPK transplant (184 at 31 March 2016), 10 (4%) patients required a pancreas only transplant (15 at 31 March 2016) and 21 (9%) were registered for a pancreas islet transplant (including two for a simultaneous islet and kidney (SIK) transplant). The outcome of patients registered on the UK pancreas transplant list at 1 April 2016, or subsequently registered during the financial year, is shown in Table 6.2. 19 patients joined the pancreas transplant list while 215 joined the list for kidney and pancreas. Patients listed for a routine islet transplant are generally waiting for their first islet graft. The majority of islet transplant recipients are likely to require more than one graft to complete their treatment. To optimise transplant outcome the follow-up graft should be performed within six to twelve months of the first. Patients requiring follow-up grafts are priority listed.
Table 6.1 Patients on the pancreas transplant lists at 31 March 2017 (2016) in the UK, by centre
Active transplant lists Centre Kidney/
pancreas Kidney/islet Pancreas alone Islet TOTAL
Routine Priority
Bristol - - 0 (0) - - 0 (2) 0 (1) 0 (3) Cambridge 16 (18) - - 1 (0) - - - - 17 (18) Cardiff 10 (4) - - 1 (1) - - - - 11 (5) Edinburgh 27 (32) 2 (0) 0 (0) 6 (9) 0 (2) 35 (43) Guys 36 (31) - - 0 (1) - - - - 36 (32) King's College - - 0 (0) - - 0 (2) 0 (0) 0 (2) Manchester 21 (24) 0 (0) 1 (2) 2 (1) 1 (1) 25 (28) Newcastle 11 (9) 0 (0) 2 (1) 2 (1) 1 (4) 16 (15) Oxford 62 (64) 0 (0) 5 (8) 4 (5) 3 (0) 74 (77) Royal Free - - 0 (0) - - 0 (0) 0 (0) 0 (0) WLRTC 10 (2) - - 0 (2) - - - - 10 (4)
TOTAL 193 (184) 2 (0) 10 (15) 14 (20) 5 (8) 224 (227)

- 54 -
Table 6.2 Whole pancreas transplant list and new registrations in the UK,
1 April 2016 - 31 March 2017 Outcome of patient at 31 March 2017
Active and suspended patients at
1 April 2016
New registrations
in 2016-20171
TOTAL
N % N % N % Pancreas transplant list Remained active/suspended 67 71 7 37 74 65 Transplanted 6 6 11 58 17 15 Removed 21 22 1 5 22 19 Died 1 1 0 0 1 1 TOTAL 95 19 114 Kidney/pancreas transplant list Remained active/suspended 152 47 180 84 332 62 Transplanted 132 41 30 14 162 30 Removed 24 7 1 0 25 5 Died 14 4 4 2 18 3 TOTAL 322 215 537 1
Includes re-registrations for second or subsequent transplants
The active pancreas transplant list rates by country/ Strategic Health Authority of patient's residence are shown in Table 6.3. At 31 March 2017, the overall transplant list rate was 3.4 pmp and across the Strategic Health Authorities ranged from 1.3 to 6.0 pmp.

- 55 -
Table 6.3 Active pancreas transplant lists at 31 March,
by country/Strategic Health Authority of patient residence
Country/ Strategic Health Pancreas transplant list (pmp) Authority of residence 2017 2016
North East 10 (3.8) 12 (4.6) North West 15 (2.1) 12 (1.7) Yorkshire and The Humber 7 (1.3) 12 (2.2) North of England 32 (2.1) 36 (2.4)
East Midlands 14 (3.0) 18 (3.8) West Midlands 22 (3.8) 24 (4.2) East of England 18 (3.0) 17 (2.8) Midlands and East 54 (3.3) 59 (3.6)
London 30 (3.5) 23 (2.7)
South East Coast 17 (3.7) 13 (2.8) South Central 26 (6.0) 27 (6.3) South West 15 (2.7) 22 (4.0) South of England 58 (4.0) 62 (4.3)
England 174 (3.2) 180 (3.3) Isle of Man 0 (0.0) 0 (0.0) Channel Islands 0 (0.0) 0 (0.0)
Wales 15 (4.8) 4 (1.3)
Scotland 32 (6.0) 40 (7.4)
Northern Ireland 3 (1.6) 3 (1.6)
TOTAL 224 (3.4) 227 (3.5)
An indication of longer term outcomes for patients listed for a pancreas or kidney/pancreas transplant are summarised in Figure 6.2. This shows the proportion of patients transplanted or still waiting six months, one year, two years and three years after joining the list. It also shows the proportion removed from the transplant list (typically because they become too unwell for transplant) and those dying while on the transplant list. 40% of patients are transplanted within one year, while three years after listing 76% of patients have received a transplant. The median (average) waiting time for a pancreas transplant is 346 days and is shown by blood group in Table 6.4 and ethnicity in Table 6.5. Note that these waiting times are not adjusted for other relevant factors which may be influential and which may differ across blood or ethnic groups.

- 56 -
6 months 1 year 2 years 3 years
Time since listing
0
10
20
30
40
50
60
70
80
90
100
Pe
rce
nta
ge
DiedRemovedStill w aitingTransplanted
Figure 6.2 Post-registration outcome for 259 new pancreas only and kidney/pancreas
registrations made in the UK, 1 April 2013 - 31 March 2014
16
81
20
40
55
32
74
15
6
5
76
11
7
7
Table 6.4 Median waiting time to pancreas only and kidney/pancreas transplant in the UK, for patients registered 1 April 2011 - 31 March 2015 Blood group Number of patients Waiting time (days)
registered Median 95% Confidence interval Adult O 454 452 428 - 476 A 392 290 264 - 316 B 108 258 190 - 326 AB 44 121 82 - 160
TOTAL 998 346 329 - 363
Table 6.5 Median waiting time to pancreas only and kidney/pancreas transplant in the UK, for patients registered 1 April 2011 - 31 March 2015 Ethnicity Number of patients Waiting time (days)
registered Median 95% Confidence interval Adult White 881 355 334 - 376 Asian 53 279 196 - 362 Black 38 279 219 - 339 Other 12 320 107 - 533
TOTAL¹ 998 346 329 - 363
¹ Includes 14 patients whose ethnicity was not reported

- 57 -
6.3 Donor and organ supply Of the 829 organ donors after brain death in the UK in 2016-2017, 360 (43%) donated a pancreas. There were 117 pancreas donors after circulatory death in 2016-2017. Table 6.6 shows this activity by country/Strategic Health Authority of the donor's residence. No adjustments have been made for potential demographic differences in populations. The overall rate for pancreas donors after brain death is 5.5 pmp, with rates ranging from 3.8 to 10.3 pmp across the Strategic Health Authorities and for donors after circulatory death is 1.8 pmp, with rates ranging from 1.3 to 2.4 pmp across the Strategic Health Authorities.
Table 6.6 Pancreas donation rates for deceased donors in the UK, 1 April 2016 - 31 March 2017, by country/ Strategic Health Authority Country/ Strategic Health Pancreas donors (pmp) Authority of residence DBD DCD TOTAL
North East 27 (10.3) 6 (2.3) 33 (12.6) North West 33 (4.6) 10 (1.4) 43 (6.0) Yorkshire and The Humber 30 (5.6) 12 (2.2) 42 (7.8) North of England 90 (5.9) 28 (1.8) 118 (7.8)
East Midlands 18 (3.8) 11 (2.4) 29 (6.2) West Midlands 34 (5.9) 14 (2.4) 48 (8.3) East of England 29 (4.8) 14 (2.3) 43 (7.1) Midlands and East 81 (4.9) 39 (2.4) 120 (7.3)
London 35 (4.0) 11 (1.3) 46 (5.3)
South East Coast 26 (5.6) 10 (2.2) 36 (7.8) South Central 26 (6.0) 7 (1.6) 33 (7.6) South West 32 (5.9) 9 (1.6) 41 (7.5) South of England 84 (5.8) 26 (1.8) 110 (7.6)
England 290 (5.3) 104 (1.9) 394 (7.2) Isle of Man 2 (25.0) 0 (0.0) 2 (25.0) Channel Islands 1 (6.3) 1 (6.3) 2 (12.5)
Wales 17 (5.5) 5 (1.6) 22 (7.1)
Scotland 34 (6.3) 6 (1.1) 40 (7.4)
Northern Ireland 16 (8.6) 1 (0.5) 17 (9.2)
TOTAL¹ 360 (5.5) 117 (1.8) 477 (7.3)
¹ There were 7 hospitals where hospital postcode was used in place of an unknown postcode

- 58 -
6.4 Transplants The number of pancreas transplants by recipient country/ Strategic Health Authority of residence is shown in Table 6.7. No adjustments have been made for potential demographic differences in populations. For donors after brain death the transplant rate ranged from 1 to 3.9 pmp across Strategic Health Authorities and overall was 2.5 pmp. For donors after circulatory death the overall rate was 0.7 pmp and ranged from 0 to 1.4 pmp across Strategic Health Authorities.
Table 6.7 Pancreas transplant rates per million population (pmp), in the UK, 1 April 2016 - 31 March 2017, by country and English Strategic Health Authority Country/ Strategic Health DBD DCD TOTAL Authority of residence N (pmp) N (pmp) N (pmp)
North East 8 (3.1) 0 (0.0) 8 (3.1) North West 8 (1.1) 6 (0.8) 14 (2) Yorkshire and The Humber 10 (1.9) 5 (0.9) 15 (2.8) North of England 26 (1.7) 11 (0.7) 37 (2.4)
East Midlands 12 (2.6) 5 (1.1) 17 (3.6) West Midlands 22 (3.8) 5 (0.9) 27 (4.7) East of England 18 (3) 4 (0.7) 22 (3.6) Midlands and East 52 (3.1) 14 (0.8) 66 (4)
London 9 (1) 6 (0.7) 15 (1.7)
South East Coast 7 (1.5) 5 (1.1) 12 (2.6) South Central 17 (3.9) 6 (1.4) 23 (5.3) South West 15 (2.7) 4 (0.7) 19 (3.5) South of England 39 (2.7) 15 (1) 54 (3.7)
England 126 (2.3) 46 (0.8) 172 (3.1) Isle of Man 0 (0.0) 0 (0.0) 0 (0.0) Channel Islands 0 (0.0) 0 (0.0) 0 (0.0)
Wales 3 (1) 1 (0.3) 4 (1.3)
Scotland 32 (6) 2 (0.4) 34 (6.3)
Northern Ireland 3 (1.6) 0 (0.0) 3 (1.6)
TOTAL 164 (2.5) 49 (0.7) 213 (3.3)
There were 213 deceased donor pancreas transplants in 2016-2017 representing a fall of 1% on the 216 transplants performed in 2015-2016. Of these 213, 162 (76%) were SPK transplants, 17 (8%) were pancreas only transplants (pancreas alone (PTA) or pancreas after kidney (PAK)) and 34 (16%) were islet transplants (including one simultaneous islet and kidney transplant SIK). The number of transplants performed at each centre is shown in Table 6.8 by transplant type and Table 6.9 by donor type. Note that King's College, The Royal Free and Bristol only perform islet transplants. Cambridge, Guy’s, WLRTC and Cardiff only perform pancreas transplants.

- 59 -
The length of time that elapses between a pancreas being removed from the donor to its transplantation into the recipient is called the cold ischaemia time (CIT). Generally, the shorter this time, the more likely the pancreas is to work immediately and the better the long-term outcome. The median CIT for a DBD donor whole pancreas transplant is 10.5 hours (Inter-Quartile (IQ) range 9.3 - 12) and for a DCD donor transplant is 10.5 hours (IQ range 9.1 – 12.1) and overall is 10.5 hours (IQ range 9.2 – 12.1). At 31 March 2017, there were approximately 1,800 recipients with a functioning pancreas transplant (including multi-organ transplants) being followed-up, as reported to the UK Transplant Registry.
Table 6.8 Pancreas transplants, 1 April 2016 - 31 March 2017 (2015-2016) by centre
Transplant type Centre SPK SIK PTA PAK Islet
Routine Priority
Bristol - - 0 (0) - - - - 0 (1) 1 (0) Cambridge 24 (26) - - 0 (0) 0 (0) - - - - Cardiff 4 (6) - - 1 (1) 0 (2) - - - - Edinburgh 20 (16) 0 (0) 0 (0) 0 (0) 9 (10) 8 (9) Guys 22 (28) - - 0 (0) 0 (0) - - - - King's College - - - - - - - - 2 (1) 1 (0) Manchester 27 (26) 1 (0) 0 (1) 4 (2) 1 (0) 1 (1) Newcastle 7 (7) 0 (0) 0 (0) 1 (0) 1 (5) 2 (2) Oxford 51 (46) 0 (0) 6 (10) 5 (2) 6 (1) 1 (1) WLRTC 7 (12) - - 0 (0) 0 (0) - - - -
TOTAL 162 (167) 1 (0) 7 (12) 10 (6) 19 (18) 14 (13) WLRTC - West London Renal and Transplant Centre
Table 6.9 Pancreas transplants, 1 April 2016 - 31 March 2017 by centre Centre Transplant and donor type
SPK SIK PTA Islet TOTAL DBD DCD DCD DBD DCD DBD DCD DBD DCD
Bristol - - 0 - - 1 0 1 0 Cambridge 17 7 - 0 0 - - 17 7 Cardiff 3 1 - 1 0 - - 4 1 Edinburgh 20 0 0 0 0 15 2 35 2 Guys 14 8 - 0 0 - - 14 8 King's College - - - - - 3 0 3 0 Manchester 16 11 1 2 2 2 0 20 14 Newcastle 7 0 0 1 0 3 0 11 0 Oxford 39 12 0 10 1 6 1 55 14 WLRTC 4 3 - 0 0 - - 4 3
TOTAL 120 42 1 14 3 30 3 164 49 WLRTC - West London Renal and Transplant Centre

- 60 -
6.5 Demographic characteristics The age group, sex, ethnicity and blood group of deceased donors, transplant recipients and patients on the transplant list are shown in Table 6.10.
Table 6.10 Demographic characteristics of deceased pancreas donors and transplant recipients, 1 April 2016 - 31 March 2017, and transplant list patients at 31 March Age group (years)
Donors Transplant recipients Active transplant list patients
N (%) N (%) N (%)
0 - 17 30 (6) - - 18 - 34 120 (25) 41 (19) 49 (22) 35 - 49 175 (37) 115 (54) 120 (54) 50 - 59 132 (28) 48 (23) 49 (22) 60 - 69 17 (4) 8 (4) 5 (2) 70+ 3 (1) 1 (0) 1 (0) mean (SD) 41 (14) 44 (9) 43 (9)
Male 280 (59) 106 (50) 122 (54) Female 197 (41) 107 (50) 102 (46)
White 441 (93) 194 (93) 193 (87) Asian 9 (2) 10 (5) 12 (5) Black 7 (1) 5 (2) 13 (6) Chinese 2 (0) 0 (0) 0 (0) Other 14 (3) 0 (0) 3 (1) Not reported 4 4 3
O 229 (48) 93 (44) 127 (57) A 197 (41) 86 (40) 64 (29) B 44 (9) 20 (9) 32 (14) AB 7 (1) 14 (7) 1 (0)
First graft 185 (87) 201 (90) Re-graft 28 (13) 23 (10)
TOTAL 477 (100) 213 (100) 224 (100)

- 61 -
7 Cardiothoracic Activity
Cardiothoracic Activity
Key messages
At 31 March 2017, there were 249 patients on the active heart transplant list, 360 on the lung list and 18 on the heart-lung list
Of the 829 organ donors after brain death during 2016-2017, 265 (32%) were cardiothoracic organ donors
As of 26 October 2016 patients can now be registered as super-urgent for a heart transplant
The number of heart transplants increased by 2% to 198 this year; 72% of these were urgent heart transplants, 8% were super-urgent and 20% were non-urgent
The number of lung and heart-lung transplants from deceased donors fell by 5% this year to 178
There were 14 DCD heart transplants in 2016-2017

- 62 -
7.1 Overview
Last year the number of heart transplants rose by 2% to 198 and the number of lung or heart-lung transplants fell by 5% to 178. There have been increases in both the heart and the lung transplant lists since March 2016. The number of patients waiting on the active heart transplant list at year end has increased by 162% since 2008, while the number of patients registered for a lung or heart-lung transplant has increased by 32% since 2008. A summary of the deceased donor cardiothoracic activity from 1 April 2007 to 31 March 2017 is shown in Figure 7.1 for heart activity and Figure 7.2 for lung activity. Donors who donate both heart and lung(s) are included in both figures, but heart-lung block transplants and patients active on the transplant list for a heart-lung block are only included in Figure 7.2.
127 128132 130
115120
126131
136 138144 145
204198
175181
210
195199 198
2007-2008 2008-2009 2009-2010 2010-2011 2011-2012 2012-2013 2013-2014 2014-2015 2015-2016 2016-2017
Year
0
50
100
150
200
250
300
Nu
mb
er
Figure 7.1 Deceased donor heart programme in the UK, 1 April 2007 - 31 March 2017,
Number of donors, transplants and patients on the active transplant list at 31 March
Donors
Transplants
Transplant list
95 93
126130
169
200
246
267
248 249
135
122
169
146
164
151
188
172
192180
213
191
233
218
203
187
202
188 183 178
2007-2008 2008-2009 2009-2010 2010-2011 2011-2012 2012-2013 2013-2014 2014-2015 2015-2016 2016-2017
Year
0
50
100
150
200
250
300
350
400
Nu
mb
er
Figure 7.2 Deceased donor lung and heart-lung programme in the UK, 1 April 2007 - 31 March 2017,
Number of donors, transplants and patients on the active transplant list at 31 March
Donors
Transplants
Transplant list
287
229
266
225232
242
287
338330
378

- 63 -
7.2 Transplant list As of 26 October 2016 patients can be registered super-urgently on the heart transplant waiting list. This additional category is a result of the growing number of patients registered urgently and will help to prioritise the patients with the greatest need for a transplant. It will also be possible for patients to be registered urgently or super-urgently for a lung transplant from May 2017 (during 2016-2017 and before there was no national facility for this). Table 7.1 shows the number of patients on the active transplant lists at 31 March 2017 by centre. There were no patients waiting super-urgently for a heart on this date, although 19 patients had been on the super-urgent waiting list at some point between 26 October 2016 and 31 March 2017. The lung transplant list accounts for 60% of the patients waiting for a cardiothoracic organ transplant. Overall, Newcastle and Harefield had the largest cardiothoracic lists on 31 March 2017.
Table 7.1 Patients on the cardiothoracic organ transplant lists at 31 March 2017 (2016) in the UK, by centre
Active transplant lists Centre Heart Heart-lung Lung TOTAL
Non-urgent Urgent Super- urgent
Adult
Birmingham 26 (18) 4 (3) 0 2 (1) 44 (30) 76 (52) Glasgow 13 (13) 0 (4) 0 0 (0) 0 (0) 13 (17) Great Ormond Street¹ 1 (2) 0 (0) 0 0 (0) 0 (2) 1 (4) Harefield 51 (62) 9 (5) 0 3 (2) 141 (125) 204 (194) Manchester 23 (17) 1 (1) 0 4 (1) 42 (46) 70 (65) Newcastle 50 (43) 5 (4) 0 5 (4) 95 (61) 155 (112) Papworth 35 (39) 2 (2) 0 2 (6) 30 (45) 69 (92)
TOTAL 199 (194) 21 (19) 0 16 (14) 352 (309) 588 (536) Paediatric
Great Ormond Street 14 (17) 4 (5) 0 2 (0) 3 (7) 23 (29) Newcastle 7 (6) 4 (7) 0 0 (0) 5 (0) 16 (13)
TOTAL 21 (23) 8 (12) 0 2 (0) 8 (7) 39 (42) ¹ Paediatric patients are aged under 16 years at 31 March 2017 (2016). Note that 1 patient active at 31 March 2017 and 4 patients active at 31 March 2016 at Great Ormond Street had turned 16 whilst on the list and so are categorised here as adults

- 64 -
During 2016-2017, 311 patients joined the heart transplant list while 17 joined the heart-lung transplant list and 338 joined the lung transplant list. Outcomes as at 31 March 2017 for patients on the list at 1 April 2016 and those joining the list during the year are shown in Table 7.2.
Table 7.2 Cardiothoracic organ transplant lists and new registrations in the UK,
1 April 2016 - 31 March 2017 Outcome of patient at 31 March 2017
Active and suspended patients
at 1 April 2016
New registrations in 2016-2017
1
TOTAL
N % N % N % Heart transplant list Remained active/suspended 144 54 126 41 270 47 Transplanted 68 26 127 41 195 34 Removed 40 15 42 14 82 14 Died 13 5 16 5 29 5 TOTAL 265 311 576 Heart-lung transplant list Remained active/suspended 6 46 11 65 17 57 Transplanted
2 2 15 2 12 4 13
Removed 2 15 0 0 2 7 Died 3 23 4 24 7 23 TOTAL 13 17 30 Lung transplant list Remained active/suspended 153 52 215 64 368 58 Transplanted 83 28 85 25 168 26 Removed 28 9 7 2 35 6 Died 33 11 31 9 64 10 TOTAL 297 338 635 1
Includes re-registrations for second or subsequent transplants 2
Patient may have received heart, lung or heart-lung
Table 7.3 shows the transplant list rate per million population by country/Strategic Health Authority of patient's residence. The overall UK heart transplant list rate at 31 March 2017 was 3.8 pmp and ranged from 2.6 to 6.1 across the Strategic Health Authorities. The overall UK lung transplant list rate was 5.8 pmp and ranged from 3.6 to 8.0 across the Strategic Health Authorities.

- 65 -
Table 7.3 Active cardiothoracic organ transplant list at 31 March, by country/ Strategic Health Authority of patient residence Country/ Strategic Health Heart transplant list (pmp) Lung transplant list (pmp)1 Authority of residence 2017 2016 2017 2016
North East 16 (6.1) 21 (8.0) 13 (5.0) 7 (2.7) North West 36 (5.0) 22 (3.1) 38 (5.3) 39 (5.4) Yorkshire and The Humber 14 (2.6) 21 (3.9) 37 (6.9) 26 (4.8) North of England 66 (4.3) 64 (4.2) 88 (5.8) 72 (4.7)
East Midlands 12 (2.6) 12 (2.6) 17 (3.6) 16 (3.4) West Midlands 28 (4.9) 23 (4.0) 39 (6.8) 29 (5.0) East of England 16 (2.6) 22 (3.6) 23 (3.8) 32 (5.3) Midlands and East 56 (3.4) 57 (3.5) 79 (4.8) 77 (4.7)
London 32 (3.7) 33 (3.8) 35 (4.0) 46 (5.3)
South East Coast 20 (4.3) 19 (4.1) 37 (8.0) 26 (5.6) South Central 16 (3.7) 15 (3.5) 25 (5.8) 27 (6.3) South West 14 (2.6) 19 (3.5) 37 (6.8) 34 (6.2) South of England 50 (3.5) 53 (3.7) 99 (6.9) 87 (6.0)
England 204 (3.7) 207 (3.8) 301 (5.5) 282 (5.1) Isle of Man 0 (0.0) 0 (0.0) 0 (0.0) 0 (0.0) Channel Islands 0 (0.0) 0 (0.0) 0 (0.0) 0 (0.0)
Wales 7 (2.3) 9 (2.9) 25 (8.1) 17 (5.5)
Scotland 24 (4.5) 23 (4.3) 34 (6.3) 22 (4.1)
Northern Ireland 8 (4.3) 4 (2.2) 14 (7.6) 7 (3.8)
TOTAL
2,3 249 (3.8) 248 (3.8) 378 (5.8) 330 (5.0)
1
Includes patients waiting for both heart and lungs
2 Includes heart patients in 2017 (2016) resident in: UK unknown 1 (0); Republic of Ireland 2 (4); Overseas 3 (1)
3 Includes lung patients in 2017 (2016) resident in: UK unknown 1 (0); Republic of Ireland 3 (2)
The transplant list outcomes for adult patients listed for a cardiothoracic organ transplant between 1 April 2013 and 31 March 2014 are summarised in Figure 7.3, Figure 7.4 and Figure 7.5. These show the proportion of patients transplanted, still waiting, removed and those who died within six months, one year, two years and three years after joining the non-urgent or urgent heart list or the lung list, respectively. Within six months of listing, 15% of non-urgent heart patients were transplanted while 5% had died, compared with 69% transplanted and 8% died for urgent heart patients. Of those listed for a lung transplant, 39% were transplanted within six months, rising to 65% after three years. The patients removed from these lists may have subsequently died.

- 66 -
6 months 1 year 2 years 3 years
Time since listing
0
10
20
30
40
50
60
70
80
90
100
Pe
rce
nta
ge
DiedRemovedBecame urgent/SUStill w aitingTransplanted
Figure 7.3 Post-registration outcome for 203 first non-urgent heart only registrations made in the
UK, 1 April 2013 - 31 March 2014
15
55
21
35
18
40
27
6
8
22
25
34
7
13
22
17
36
10
14
6 months 1 year 2 years 3 years
Time since listing
0
10
20
30
40
50
60
70
80
90
100
Pe
rce
nta
ge
DiedRemovedBecame non-urgentStill w aitingTransplanted
Figure 7.4 Post-registration outcome for 204 first urgent heart only registrations made in the
UK, 1 April 2013 - 31 March 2014
69
2
16
8
72
2
16
9
72
2
16
9
72
2
17
9

- 67 -
6 months 1 year 2 years 3 years
Time since listing
0
10
20
30
40
50
60
70
80
90
100
Pe
rce
nta
ge
DiedRemovedStill w aitingTransplanted
Figure 7.5 Post-registration outcome for 320 first lung only registrations made in the UK,
1 April 2013 - 31 March 2014
39
48
1
12
50
30
3
17
61
14
5
20
65
8
6
21
Table 7.4 and Table 7.5 show the median waiting time to cardiothoracic organ transplant by blood group and ethnicity of patient, respectively, for patients registered between 1 April 2011 and 31 March 2014. The overall median waiting time to heart transplantation, for adults, was 1,280 days for patients who had never been on the urgent waiting list (‘never urgent’). For patients who had been on the urgent list (‘ever urgent’), the overall median time on the urgent list before transplant was 26 days. The overall median waiting time to lung transplantation, for adults, was 255 days, but for blood group O patients alone was 406 days. For paediatric heart patients, the median waiting time was 463 days for non-urgent registrations and 70 days for urgent registrations (this is not broken down by blood group or ethnicity due to low numbers). Median waiting time is not calculated for paediatric lung patients due to the small number of registrations. Note that these waiting times are not adjusted for other relevant factors which may be influential and which may differ across blood or ethnic groups.

- 68 -
Table 7.4 Median waiting time to cardiothoracic organ transplant in the UK, for patients registered 1 April 2011 - 31 March 2014 Blood group Number of patients Waiting time (days)
registered Median 95% Confidence interval Adult never urgent heart O¹ 116 - - A 135 418 289 - 547 B 24 344 9 - 679 AB 15 58 19 - 97 TOTAL 290 1280 703 - 1857
Adult ever urgent heart (urgent waiting time only) O 184 44 35 - 53 A 151 15 12 - 18 B 56 30 23 - 37 AB 17 13 10 - 16 TOTAL 408 26 21 - 31
Paediatric never urgent heart 24 463 0 - 1460
Paediatric ever urgent heart (urgent waiting time only)
116 70 41 - 99
Adult lung O 377 406 332 - 480 A 315 137 107 - 167 B 83 182 87 - 277 AB 18 186 121 - 251 TOTAL 793 255 216 - 294
¹ Median and/or 95% confidence interval cannot be estimated

- 69 -
Table 7.5 Median waiting time to cardiothoracic organ transplant in the UK, for patients registered 1 April 2011 - 31 March 2014 Ethnicity Number of patients Waiting time (days)
registered Median 95% Confidence interval Adult never urgent heart White 260 1283 590 - 1976 Asian 11 143 0 - 357 Black¹ 12 - - TOTAL3 290 1280 703 - 1857
Adult ever urgent heart (urgent waiting time only) White 351 23 18 - 28 Asian 32 43 27 - 59 Black 11 71 65 - 77 Other 10 38 5 - 71 TOTAL3 408 26 21 - 31
Paediatric never urgent heart 24 463 0 - 1460
Paediatric ever urgent heart (urgent waiting time only)
116 70 41 - 99
Adult lung White 756 239 202 - 276 Asian 24 1217 121 - 2313 Black1, 2 6 - - Other1, 2 3 - - TOTAL3 793 255 216 - 294
¹ Median and/or 95% confidence interval cannot be estimated ² Median waiting time not calculated for fewer than 10 patients 3 Totals do not add up where we do not have ethnicity reported for all patients

- 70 -
7.3 Donor and organ supply The number of cardiothoracic organ donors classified by allocation zone of the donor hospital is summarised in Table 7.6. The numbers reflect the donors within each centre’s allocation zone (attended by any retrieval team) rather than the donors attended by that centre. 28 of the 107 adult lung only donors were donors after circulatory death and there were no living donors during the time period. There were also no domino heart donors. Of the 250 adult cardiothoracic organ donors after brain death, 43% donated only the heart, 26% heart and lung and 32% lung only. Of the 15 paediatric cardiothoracic organ donors after brain death, 53% donated only the heart, 20% heart and lung and 27% lung only.
Table 7.6 Cardiothoracic organ donors in the UK, 1 April 2016 - 31 March 2017 (2015-2016), by age group and allocation zone
Type of cardiothoracic organ donor Allocation zone Heart only Heart & lung Lung(s) only TOTAL
DBD DCD DBD DCD DBD DCD Adult
Birmingham 16 (11) 1 (0) 6 (7) 0 (0) 6 (11) 3 (6) 32 (35) Glasgow 9 (4) 0 (0) 5 (6) 0 (0) 10 (10) 4 (5) 28 (25) Harefield 26 (26) 4 (4) 25 (20) 0 (0) 23 (17) 10 (11) 88 (78) Manchester 25 (27) 1 (0) 8 (12) 2 (1) 20 (7) 5 (3) 61 (50) Newcastle 13 (12) 0 (0) 13 (13) 0 (0) 8 (16) 2 (6) 36 (47) Papworth 18 (20) 7 (15) 7 (16) 2 (1) 12 (16) 4 (3) 50 (71)
TOTAL 107 (100) 13 (19) 64 (74) 4 (2) 79 (77) 28 (34) 295 (306) Paediatric
1
Birmingham 2 (2) 0 (0) 0 (2) 0 (0) 0 (0) 0 (1) 2 (5) Glasgow 0 (1) 0 (0) 0 (1) 0 (0) 0 (1) 0 (0) 0 (3) Harefield 3 (2) 0 (0) 1 (1) 0 (0) 1 (0) 0 (1) 5 (4) Manchester 2 (0) 0 (0) 2 (1) 0 (0) 1 (0) 0 (0) 5 (1) Newcastle 0 (0) 0 (0) 0 (5) 0 (0) 2 (0) 1 (2) 3 (7) Papworth 1 (0) 0 (0) 0 (0) 0 (0) 0 (0) 0 (0) 1 (0)
TOTAL 8 (5) 0 (0) 3 (10) 0 (0) 4 (1) 1 (4) 16 (20) 1 Paediatric donors are aged <16 years

- 71 -
Table 7.7 shows the number of organ donors after brain death and circulatory death identified in each allocation zone, and the number of organs retrieved and transplanted. Of the 829 organ donors after brain death, 265 (32%) donated cardiothoracic organs. Overall, 96% of the 470 DBD organs retrieved were used for transplantation: 96% of hearts and 95% of lungs. Of the DCD organs retrieved, 84% were used for transplantation: 82% of hearts and 84% of lungs.
Table 7.7 Cardiothoracic organ donation and retrieval rates from deceased donors in the UK, 1 April 2016 - 31 March 2017, by allocation zone Allocation zone
Number of donors Number of organs retrieved (used)
TOTAL retrieved
Solid organ
Cardiothoracic Hearts Lungs (used)
DBD Birmingham 102 30 24 (24) 24 (24) 48 (48) Glasgow 91 24 14 (14) 30 (28) 44 (42) Harefield 210 79 55 (50) 97 (94) 152 (144) Manchester 160 58 37 (36) 56 (53) 93 (89) Newcastle 123 36 26 (26) 45 (41) 71 (67) Papworth 143 38 26 (25) 36 (34) 62 (59)
TOTAL 829 265 182 (175) 288 (274) 470 (449)
DCD Birmingham 54 4 1 (1) 6 (6) 7 (7) Glasgow 62 4 0 (0) 8 (6) 8 (6) Harefield 134 14 4 (4) 20 (16) 24 (20) Manchester 126 8 3 (2) 13 (13) 16 (15) Newcastle 76 3 0 (0) 6 (6) 6 (6) Papworth 132 13 9 (7) 11 (7) 20 (14)
TOTAL 584 46 17 (14) 64 (54) 81 (68)

- 72 -
The rates per million population for cardiothoracic organ donors are shown in Table 7.8 by country/Strategic Health Authority of residence. No adjustments have been made for potential demographic differences in populations. The overall cardiothoracic organ donor rate was 4.8 pmp in 2016-2017 and varied across the Strategic Health Authorities from 2.6 pmp to 6.9 pmp. Of the four nations the highest cardiothoracic organ donor rate was in Northern Ireland at 7.6 pmp.
Table 7.8 Cardiothoracic organ donation and retrieval rates for deceased donors in
the UK, 1 April 2016 - 31 March 2017, by country/ Strategic Health Authority
Country/ Strategic Health Authority
Heart (pmp) Lungs (pmp) Total (pmp)
DBD DCD¹ DBD DCD
North East 15 (5.7) 0 (0.0) 10 (3.8) 1 (0.4) 18 (6.9) North West 23 (3.2) 1 (0.1) 19 (2.6) 4 (0.6) 41 (5.7) Yorkshire and The Humber 7 (1.3) 0 (0.0) 9 (1.7) 0 (0.0) 14 (2.6) North of England 45 (3.0) 1 (0.1) 38 (2.5) 5 (0.3) 73 (4.8)
East Midlands 10 (2.1) 2 (0.4) 7 (1.5) 4 (0.9) 17 (3.6) West Midlands 24 (4.2) 0 (0.0) 11 (1.9) 1 (0.2) 32 (5.6) East of England 14 (2.3) 4 (0.7) 13 (2.1) 5 (0.8) 31 (5.1) Midlands and East 48 (2.9) 6 (0.4) 31 (1.9) 10 (0.6) 80 (4.8)
London 24 (2.8) 4 (0.5) 18 (2.1) 1 (0.1) 38 (4.4)
South East Coast 12 (2.6) 5 (1.1) 12 (2.6) 6 (1.3) 32 (6.9) South Central 12 (2.8) 0 (0.0) 14 (3.2) 2 (0.5) 19 (4.4) South West 15 (2.7) 1 (0.2) 14 (2.6) 2 (0.4) 22 (4.0) South of England 39 (2.7) 6 (0.4) 40 (2.8) 10 (0.7) 73 (5.1)
England 156 (2.8) 17 (0.3) 127 (2.3) 26 (0.5) 264 (4.8) Isle of Man 0 (0.0) 0 (0.0) 0 (0.0) 0 (0.0) 0 (0.0) Channel Islands 0 (0.0) 0 (0.0) 0 (0.0) 0 (0.0) 0 (0.0)
Wales 6 (1.9) 0 (0.0) 2 (0.6) 2 (0.6) 10 (3.2)
Scotland 11 (2.0) 0 (0.0) 13 (2.4) 3 (0.6) 23 (4.3)
Northern Ireland 9 (4.9) 0 (0.0) 8 (4.3) 2 (1.1) 14 (7.6)
TOTAL² 182 (2.8) 17 (0.3) 150 (2.3) 33 (0.5) 311 (4.8) ¹ DCD heart donation is not operational in all areas ² Includes 6 donors where the hospital postcode was used in place of an unknown donor postcode

- 73 -
7.4 Transplants The number of cardiothoracic organ transplants by recipient country/Strategic Health Authority of residence is shown in Table 7.9. No adjustments have been made for potential demographic differences in populations. The cardiothoracic organ transplant rate ranged from 4.4 to 7.4 pmp across Strategic Health Authorities and overall was 5.7 pmp. Lung transplant rates include a small number of heart-lung transplants.
Table 7.9 Cardiothoracic organ transplant rates per million population (pmp) in the
UK, 1 April 2016 - 31 March 2017, by country/ Strategic Health Authority
Country/ Strategic Health Authority
Heart (pmp) Lungs (pmp) Total (pmp)
DBD DCD1 DBD DCD
North East 13 (5.0) 0 (0.0) 4 (1.5) 0 (0.0) 17 (6.5) North West 25 (3.5) 0 (0.0) 26 (3.6) 2 (0.3) 53 (7.4) Yorkshire and The Humber 18 (3.3) 1 (0.2) 12 (2.2) 4 (0.7) 35 (6.5) North of England 56 (3.7) 1 (0.1) 42 (2.8) 6 (0.4) 105 (6.9)
East Midlands 12 (2.6) 2 (0.4) 10 (2.1) 3 (0.6) 27 (5.8) West Midlands 22 (3.8) 0 (0.0) 7 (1.2) 3 (0.5) 32 (5.6) East of England 12 (2.0) 3 (0.5) 22 (3.6) 3 (0.5) 40 (6.6) Midlands and East 46 (2.8) 5 (0.3) 39 (2.4) 9 (0.5) 99 (6.0)
London 20 (2.3) 3 (0.3) 14 (1.6) 1 (0.1) 38 (4.4)
South East Coast 7 (1.5) 2 (0.4) 13 (2.8) 1 (0.2) 23 (5.0) South Central 7 (1.6) 1 (0.2) 12 (2.8) 2 (0.5) 22 (5.1) South West 11 (2.0) 2 (0.4) 11 (2.0) 1 (0.2) 25 (4.6) South of England 25 (1.7) 5 (0.3) 36 (2.5) 4 (0.3) 70 (4.9)
England 147 (2.7) 14 (0.3) 131 (2.4) 20 (0.4) 312 (5.7) Isle of Man 0 (0.0) 0 (0.0) 0 (0.0) 0 (0.0) 0 (0.0) Channel Islands 0 (0.0) 0 (0.0) 0 (0.0) 0 (0.0) 0 (0.0)
Wales 12 (3.9) 0 (0.0) 6 (1.9) 3 (1.0) 21 (6.8)
Scotland 16 (3.0) 0 (0.0) 10 (1.9) 6 (1.1) 32 (6.0)
Northern Ireland 6 (3.2) 0 (0.0) 1 (0.5) 0 (0.0) 7 (3.8)
TOTAL2, 3 183 (2.8) 14 (0.2) 148 (2.3) 29 (0.4) 374 (5.7) 1 DCD heart transplantation is not operational in all areas
2 Excludes 2 recipients who reside in the Republic of Ireland
3 Includes 2 recipients in the UK with an unknown postcode
Table 7.10 and Table 7.11 show cardiothoracic organ transplant activity for each centre by urgency status and donor type, respectively. In 2016-2017, a total of 376 transplants were carried out; a fall of 2% on 2015-2016. Of these, 198 were heart transplants, of which 158 (80%) were in urgent or super-urgent patients and additionally, 14 (7%) were achieved from donors after circulatory death . There were a total of 178 lung transplants including 29 (16%) from donors after circulatory death.

- 74 -
Table 7.10 Cardiothoracic transplants from deceased donors, 1 April 2016 - 31 March 2017 (2015-2016), by age group and centre Transplant centre Transplant type TOTAL
Heart Heart- lung Lung(s)
Non-urgent Urgent Super- urgent
Adult Birmingham 1 (3) 20 (23) 5 (0) 0 (1) 15 (24) 41 (51) Glasgow 2 (0) 9 (7) 4 (0) 0 (0) 0 (0) 15 (7) Great Ormond Street 0 (0) 0 (0) 0 (0) 0 (0) 1 (0) 1 (0) Harefield 3 (4) 18 (21) 0 (0) 0 (1) 41 (49) 62 (75) Manchester 5 (2) 20 (27) 3 (0) 1 (2) 33 (21) 62 (52) Newcastle 5 (4) 23 (19) 0 (0) 0 (0) 33 (42) 61 (65) Papworth 19 (21) 25 (30) 3 (0) 1 (2) 43 (37) 91 (90)
TOTAL 35 (34) 115 (127) 15 (0) 2 (6) 166 (173) 333 (340) Paediatric
1
Great Ormond Street 3 (3) 11 (12) 0 (0) 0 (0) 8 (7) 22 (22) Harefield 0 (0) 1 (0) 0 (0) 0 (0) 0 (0) 1 (0) Newcastle 2 (1) 16 (18) 0 (0) 0 (0) 2 (2) 20 (21)
TOTAL 5 (4) 28 (30) 0 (0) 0 (0) 10 (9) 43 (43) 1 Paediatric recipients are aged under 16 years at time of transplant
Table 7.11 Cardiothoracic transplants from deceased donors, 1 April 2016 - 31 March 2017 (2015-2016), by age group and centre Transplant centre Transplant type TOTAL
Heart Heart-lung Lung(s) DBD DCD DBD DCD DBD DCD
Adult Birmingham 26 (26) 0 (0) 0 (1) 0 (0) 11 (21) 4 (3) 41 (51) Glasgow 15 (7) 0 (0) 0 (0) 0 (0) 0 (0) 0 (0) 15 (7) Great Ormond Street 0 (0) 0 (0) 0 (0) 0 (0) 1 (0) 0 (0) 1 (0) Harefield 19 (21) 2 (4) 0 (1) 0 (0) 36 (37) 5 (12) 62 (75) Manchester 28 (29) 0 (0) 1 (2) 0 (0) 27 (18) 6 (3) 62 (52) Newcastle 28 (23) 0 (0) 0 (0) 0 (0) 26 (31) 7 (11) 61 (65) Papworth 35 (36) 12 (15) 1 (2) 0 (0) 37 (33) 6 (4) 91 (90)
TOTAL 151 (142) 14 (19) 2 (6) 0 (0) 138 (140) 28 (33) 333 (340) Paediatric
1
Great Ormond Street 14 (15) 0 (0) 0 (0) 0 (0) 7 (5) 1 (2) 22 (22) Harefield 1 (0) 0 (0) 0 (0) 0 (0) 0 (0) 0 (0) 1 (0) Newcastle 18 (19) 0 (0) 0 (0) 0 (0) 2 (2) 0 (0) 20 (21)
TOTAL 33 (34) 0 (0) 0 (0) 0 (0) 9 (7) 1 (2) 43 (43) 1 Paediatric recipients are aged under 16 years at time of transplant
At 31 March 2017 there were approximately 3,800 recipients with a functioning cardiothoracic organ transplant being followed-up as reported to the UK Transplant Registry.

- 75 -
The length of time that elapses between cardiothoracic organs being removed from the donor and their transplantation into the recipient is called the total ischaemia time (IT). Generally, the shorter this time, the more likely the organ is to work immediately and the better the long-term outcome. In 2016-2017 the median IT for a DBD heart transplant was 3.3 hours (Inter-Quartile (IQ) range 2.6 – 3.9) and for a DCD heart transplant was 4.5 hours (IQ range 4 – 4.7) and overall was 3.3 hours (IQ range 2.6 – 4). The median IT for DBD donor lung transplant was 4.9 hours (IQ range 3.9 - 6) and for a DCD donor lung transplant was 5.3 hours (IQ range 4.9 – 6.2) and overall was 5 hours (IQ range 4 - 6). Please note some of these data include the use of donor organ maintenance systems, in which cases the IT reported will be an overestimate of the true ischaemia time. 7.5 Demographic characteristics The age group, sex, ethnicity and blood group of deceased donors, transplant recipients and patients on the transplant list are shown in Table 7.12.
Table 7.12 Demographic characteristics of deceased cardiothoracic organ donors and transplant recipients 1 April 2016 - 31 March 2017, and transplant list patients at 31 March in the UK Age group (years)
Donors Transplant recipients Active transplant list patients
N (%) N (%) N (%)
0 - 17 25 (8) 46 (12) 41 (7) 18 - 34 84 (27) 77 (20) 100 (16) 35 - 49 103 (33) 74 (20) 139 (22) 50 - 59 76 (24) 104 (28) 201 (32) 60 - 69 23 (7) 73 (19) 143 (23) 70+ 0 (0) 2 (1) 3 (0) mean (SD) 40 (15) 43 (18) 47 (16)
Male 179 (58) 242 (64) 365 (58) Female 132 (42) 134 (36) 262 (42)
White 281 (92) 340 (90) 560 (90) Asian 8 (3) 21 (6) 37 (6) Black 5 (2) 11 (3) 21 (3) Chinese 1 (0) 2 (1) 1 (0) Other 10 (3) 2 (1) 6 (1) Not reported 6 2
O 154 (50) 139 (37) 327 (52) A 125 (40) 172 (46) 218 (35) B 25 (8) 47 (13) 67 (11) AB 7 (2) 18 (5) 15 (2)
First graft 372 (99) 612 (98) Re-graft 4 (1) 15 (2)
TOTAL 311 (100) 376 (100) 627 (100)

- 76 -
8 Liver Activity
Liver Activity
Key messages
The number of patients on the active liver transplant list at 31 March 2017 was 530, a fall of 8% from 2016
The number of liver donors after brain death increased by 4% to 747, while
transplants from donors after brain death increased by 10% to 738
The number of liver donors after circulatory death fell by 1% to 294, while
transplants from donors after circulatory death increased by 1% to 208

- 77 -
8.1 Overview
The number of deceased liver donors and transplants in the UK in the last ten years is shown in Figure 8.1. Over this period, there has been an increase in the number of patients registered on the active transplant list at 31 March, although this number has fallen in the last two years. The numbers of donors and transplants has steadily increased over the last decade.
632 633
676657
706679
712675
782
739
825
784
932
880
924
843
1011
879
1041
946
2007-2008 2008-2009 2009-2010 2010-2011 2011-2012 2012-2013 2013-2014 2014-2015 2015-2016 2016-2017
Year
0
200
400
600
800
1000
1200
Nu
mb
er
Figure 8.1 Deceased donor liver programme in the UK, 1 April 2007 - 31 March 2017,
Number of donors, transplants and patients on the active transplant list at 31 March
Donors
Transplants
Transplant list
268
338371
510
553
492
549
611577
530
Intestinal transplants that used a liver are not included in the liver activity reported. However, any livers retrieved and used for such transplants are included in the liver donor activity. Liver only transplants in intestinal failure patients are included in the liver transplant activity. Intestinal transplant activity is reported in the Chapter 9.
The number of deceased donors, deceased and living donor transplants, and patients on the active transplant list, by centre, is shown in Table 8.1. The numbers of liver donors reflect the number of organs retrieved from within each centre’s allocation zone (by any retrieval team) rather than the number of retrievals made by that centre. In 2016-2017, 1041 organ donors donated their liver for transplant: 747 donors after brain death and 294 donors after circulatory death. There were 530 patients on the active transplant list at 31 March 2017, a fall of 8% from 2016.
Overall, the number of liver transplants (either whole liver or liver lobe transplants) from donors after brain death increased by 10% to 738, and donors after circulatory death increased by 1% to 208, compared with the previous financial year. Additionally, there were 31 living liver lobe donor transplants in NHS Group 1 (23) and Group 2 (8) paediatric and adult recipients, and 3 domino donor transplants in NHS Group 1 adult recipients.
Patients are prioritised as super-urgent if they require a new liver as soon as possible due to rapid failure of the native organ. Other patients are referred to as elective. There were 76 deceased donor adult super-urgent transplants in 2016-2017, representing 9% of all adult transplants. There were 12 deceased donor paediatric super-urgent transplants in 2016-2017, representing 13% of all paediatric transplants. There was one living donor paediatric super-urgent transplant.

- 78 -
Table 8.1 Deceased and living liver donors and transplants, 1 April 2016 - 31 March 2017 (2015-2016) and transplant list patients at 31 March 2017 (2016) in the UK, by age group and centre Allocation zone/ transplant
Deceased donors¹ Deceased transplants Living donor transplants
Active transplant list
centre DBD DCD TOTAL DBD DCD TOTAL Adult
Birmingham 151 (144) 48 (64) 199 (208) 142 (141) 54 (58) 196 (199) 5 (6) 86 (115) Cambridge 62 (58) 44 (43) 106 (101) 68 (56) 34 (34) 102 (90) 0 (0) 37 (59) Edinburgh 96 (74) 21 (29) 117 (103) 85 (73) 18 (23) 103 (96) 0 (1) 35 (50) King's College 171 (179) 74 (64) 245 (243) 127 (130) 59 (37) 186 (167) 6 (6) 131 (140) Leeds 128 (111) 57 (55) 185 (166) 105 (79) 19 (24) 124 (103) 2 (5) 104 (84) Newcastle 42 (40) 10 (11) 52 (51) 36 (38) 6 (7) 42 (45) 0 (0) 15 (23) Royal Free 76 (84) 28 (18) 104 (102) 90 (84) 13 (18) 103 (102) 1 (2) 76 (57)
TOTAL 726 (690) 282 (284) 1008 (974) 653 (601) 203 (201) 856 (802) 142 (20)
3 484 (528)
Paediatric
Birmingham 6 (9) 4 (5) 10 (14) 26 (35) 3 (2) 29 (37) 7 (5) 15 (19) Cambridge 1 (3) 0 (2) 1 (5) 0 (1) 0 (0) 0 (1) 0 (0) 0 (0) Edinburgh 1 (5) 1 (0) 2 (5) 0 (0) 0 (0) 0 (0) 0 (0) 0 (0) King's College 4 (2) 5 (1) 9 (3) 42 (20) 2 (3) 44 (23) 11 (11) 25 (23) Leeds 5 (4) 1 (4) 6 (8) 17 (16) 0 (0) 17 (16) 2 (3) 6 (7) Newcastle 3 (2) 0 (0) 3 (2) 0 (0) 0 (0) 0 (0) 0 (0) 0 (0) Royal Free 1 (0) 1 (0) 2 (0) 0 (0) 0 (0) 0 (0) 0 (0) 0 (0)
TOTAL 21 (25) 12 (12) 33 (37) 85 (72) 5 (5) 90 (77) 204 (19)
5 46 (49)
1 Includes donors whose livers were retrieved by other teams
2 Includes 7 and 4 living liver lobe transplants, 3 and 0 domino transplants in NHS Group 1 and Group 2 recipients, respectively
3 Includes 11 and 5 living liver lobe transplants, 1 and 0 altruistic donor transplants, and 3 and 0 domino transplants in NHS Group 1 and Group 2 recipients, respectively
4 Includes 16 and 4 living liver lobe transplants in NHS Group 1 and Group 2 recipients, respectively
5 Includes 15 and 3 living liver lobe transplants, 1 and 0 altruistic donor transplants in NHS Group 1 and Group 2 recipients, respectively

- 79 -
8.2 Transplant list
During 2016-2017, 1,169 patients joined the liver transplant list. Outcomes for patients on the list at 1 April 2016 and those joining the list during the year are shown in Table 8.2. There have been 127 (11%) new registrations that were super-urgent.
Table 8.2 Liver transplant list and new registrations in the UK,
1 April 2016 – 31 March 2017 Outcome of patient at 31 March 2017
Active and suspended patients at
1 April 2016
New registrations in
2016-20171
TOTAL
N % N % N % Remained active/suspended 164 27 388 33 552 31 Transplanted 324 54 653 56 977 55 Removed 88 15 80 7 168 9 Died 24 4 48 4 72 4 TOTAL 600 1169 1769 1
Includes re-registrations for second or subsequent transplants
Table 8.3 shows the transplant list rate per million population in the UK, by country/Strategic Health Authority of patient's residence. At 31 March 2017, the overall rate was 8.1 pmp and ranged from 5.3 to 10.2 pmp across the Strategic Health Authorities.

- 80 -
Table 8.3 Active liver transplant list at 31 March, by country/ Strategic Health Authority of patient residence Country/ Strategic Health Liver transplant list (pmp) Authority of residence 2017 2016
North East 14 (5.3) 18 (6.9) North West 68 (9.5) 68 (9.5) Yorkshire and The Humber 55 (10.2) 51 (9.5) North of England 137 (9.0) 137 (9.0)
East Midlands 25 (5.3) 32 (6.8) West Midlands 32 (5.6) 47 (8.2) East of England 44 (7.2) 56 (9.2) Midlands and East 101 (6.1) 135 (8.2)
London 69 (8.0) 64 (7.4)
South East Coast 47 (10.2) 46 (9.9) South Central 29 (6.7) 33 (7.6) South West 40 (7.3) 51 (9.3) South of England 116 (8.0) 130 (9.0)
England 423 (7.7) 466 (8.5) Isle of Man 0 (0.0) 1 (12.5) Channel Islands 0 (0.0) 1 (6.3)
Wales 25 (8.1) 21 (6.8)
Scotland 37 (6.9) 53 (9.9)
Northern Ireland 30 (16.2) 21 (11.4)
TOTAL
1 530 (8.1) 577 (8.8)
1
Includes patients in 2017 (2016) resident in: UK unknown – 4 (0); Republic of Ireland - 3 (4); Overseas - 8 (10)
An indication of longer term outcomes for patients listed for a liver transplant is summarised in Figure 8.2. This shows the proportion of patients transplanted or still waiting six months, one year and two years after joining the transplant list. It also shows the proportion removed from the transplant list and those dying while on the transplant list (which includes those patients removed due to condition deteriorated). At one year post-registration, 67% of patients had received a liver transplant while 11% of patients had died whilst waiting or had been removed due to their condition deteriorating. 6% had been removed for other reasons such as the patient's condition improving, as a result of non-compliance or at the request of the patient or family.

- 81 -
6 months 1 year 2 years
Time since listing
0
10
20
30
40
50
60
70
80
90
100
Pe
rce
nta
ge
DiedRemovedStill w aitingTransplanted
Figure 8.2 Post-registration outcome for 1029 new elective liver only registrations made in the UK,
1 April 2014 - 31 March 2015
51
38
3
8
67
17
6
11
74
5
8
13
Table 8.4 and Table 8.5 show the median waiting time to liver transplant for adult and paediatric elective registrations, separately, including a breakdown by blood group and ethnicity for adult elective registrations only. On average, adult patients wait 138 days for a transplant while paediatric patients wait an average of 92 days. Note that these waiting times are not adjusted for other relevant factors which may be influential and which may differ across blood or ethnic groups.
Table 8.4 Median waiting time to liver transplant in the UK, for patients registered 1 April 2012 - 31 March 2015 Blood group Number of patients Waiting time (days)
registered Median 95% Confidence interval Adult O 1269 234 211 - 257 A 1036 87 77 - 97 B 313 133 105 - 161 AB 85 51 36 - 66 TOTAL 2703 138 127 - 149
Paediatric 203 92 68 - 116
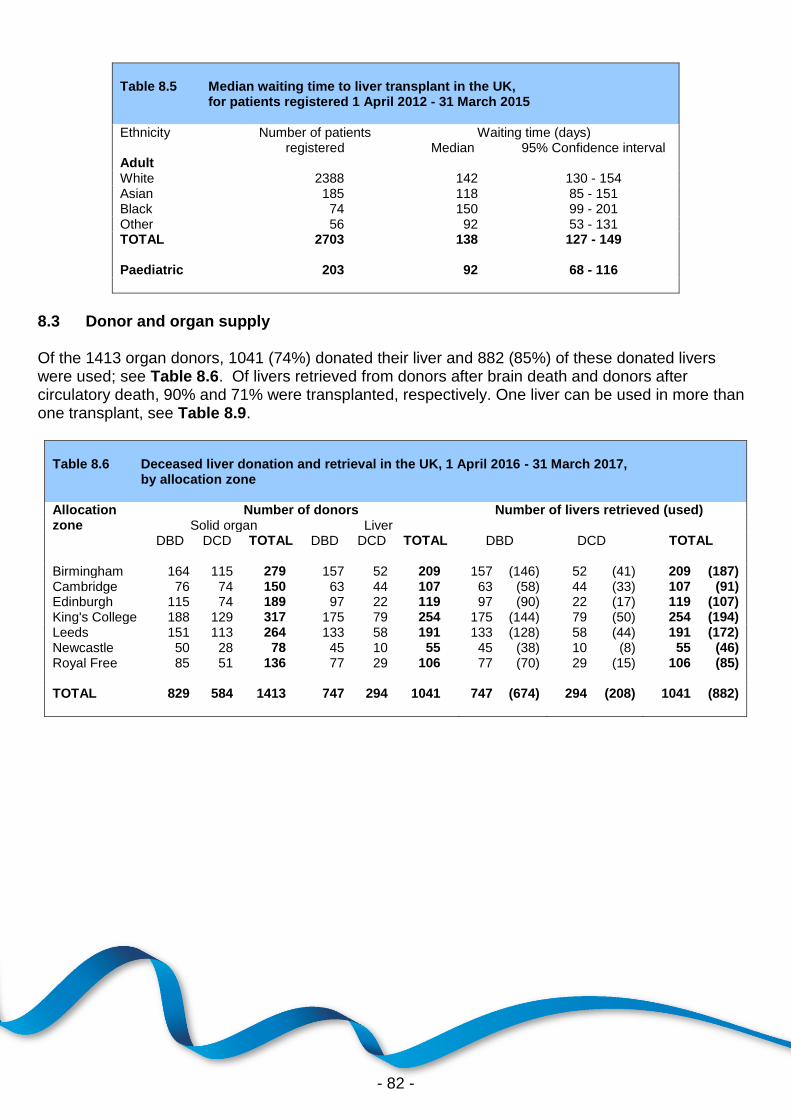
- 82 -
Table 8.5 Median waiting time to liver transplant in the UK, for patients registered 1 April 2012 - 31 March 2015 Ethnicity Number of patients Waiting time (days)
registered Median 95% Confidence interval Adult White 2388 142 130 - 154 Asian 185 118 85 - 151 Black 74 150 99 - 201 Other 56 92 53 - 131 TOTAL 2703 138 127 - 149
Paediatric 203 92 68 - 116
8.3 Donor and organ supply Of the 1413 organ donors, 1041 (74%) donated their liver and 882 (85%) of these donated livers were used; see Table 8.6. Of livers retrieved from donors after brain death and donors after circulatory death, 90% and 71% were transplanted, respectively. One liver can be used in more than one transplant, see Table 8.9.
Table 8.6 Deceased liver donation and retrieval in the UK, 1 April 2016 - 31 March 2017, by allocation zone Allocation Number of donors Number of livers retrieved (used) zone Solid organ Liver
DBD DCD TOTAL DBD DCD TOTAL DBD DCD TOTAL
Birmingham 164 115 279 157 52 209 157 (146) 52 (41) 209 (187) Cambridge 76 74 150 63 44 107 63 (58) 44 (33) 107 (91) Edinburgh 115 74 189 97 22 119 97 (90) 22 (17) 119 (107) King's College 188 129 317 175 79 254 175 (144) 79 (50) 254 (194) Leeds 151 113 264 133 58 191 133 (128) 58 (44) 191 (172) Newcastle 50 28 78 45 10 55 45 (38) 10 (8) 55 (46) Royal Free 85 51 136 77 29 106 77 (70) 29 (15) 106 (85)
TOTAL 829 584 1413 747 294 1041 747 (674) 294 (208) 1041 (882)

- 83 -
The rates per million population (pmp) for liver donors are shown in Table 8.7 by donor country/Strategic Health Authority of residence. No adjustments have been made for potential demographic differences in populations. The overall deceased liver donor rate was 15.9 pmp in 2016-2017 and varied across the Strategic Health Authorities from 10.7 pmp to 21.8 pmp.
Table 8.7 Liver donor rates in the UK, 1 April 2016 - 31 March 2017, by country/ Strategic Health Authority Country/ Deceased donors (pmp) Strategic Health Authority DBD DCD Total
North East 47 (17.9) 10 (3.8) 57 (21.8) North West 77 (10.7) 32 (4.5) 109 (15.2) Yorkshire and The Humber 50 (9.3) 20 (3.7) 70 (13.0) North of England 174 (11.5) 62 (4.1) 236 (15.5)
East Midlands 34 (7.3) 16 (3.4) 50 (10.7) West Midlands 68 (11.8) 21 (3.7) 89 (15.5) East of England 65 (10.7) 48 (7.9) 113 (18.6) Midlands and East 167 (10.1) 85 (5.1) 252 (15.3)
London 87 (10.0) 30 (3.5) 117 (13.5)
South East Coast 70 (15.1) 31 (6.7) 101 (21.8) South Central 47 (10.9) 24 (5.6) 71 (16.4) South West 63 (11.5) 26 (4.8) 89 (16.3) South of England 180 (12.5) 81 (5.6) 261 (18.1)
England 608 (11.1) 258 (4.7) 866 (15.8) Isle of Man 2 (25.0) 0 (0.0) 2 (25.0) Channel Islands 4 (25.0) 1 (6.3) 5 (31.3)
Wales 38 (12.3) 15 (4.8) 53 (17.1)
Scotland 67 (12.5) 18 (3.4) 85 (15.8)
Northern Ireland 28 (15.1) 2 (1.1) 30 (16.2)
TOTAL¹ 747 (11.4) 294 (4.5) 1041 (15.9)
¹ Includes 13 donors where the hospital postcode was used in place of an unknown donor postcode

- 84 -
8.4 Transplants The number of liver transplants by recipient country/Strategic Health Authority of residence are shown in Table 8.8. No adjustments have been made for potential demographic differences in populations. The deceased donor transplant rate ranged from 10 to 16.9 pmp across the Strategic Health Authorities and overall was 14.2 pmp.
Table 8.8 Liver transplant rates per million population (pmp) in the UK, 1 April 2016 - 31 March 2017, by country/ Strategic Health Authority Country/ Strategic Health Authority
Deceased transplants (pmp) Living transplants
DBD DCD Total (pmp)
North East 28 (10.7) 5 (1.9) 33 (12.6) 0 (0.0) North West 87 (12.1) 24 (3.3) 111 (15.5) 3 (0.4) Yorkshire and The Humber 61 (11.3) 10 (1.9) 71 (13.2) 2 (0.4) North of England 176 (11.6) 39 (2.6) 215 (14.2) 5 (0.3)
East Midlands 35 (7.5) 12 (2.6) 47 (10.0) 0 (0.0) West Midlands 69 (12.0) 20 (3.5) 89 (15.5) 2 (0.3) East of England 76 (12.5) 27 (4.4) 103 (16.9) 1 (0.2) Midlands and East 180 (10.9) 59 (3.6) 239 (14.5) 3 (0.2)
London 82 (9.5) 23 (2.7) 105 (12.1) 1 (0.1)
South East Coast 42 (9.1) 18 (3.9) 60 (13.0) 0 (0.0) South Central 44 (10.2) 14 (3.2) 58 (13.4) 2 (0.5) South West 59 (10.8) 18 (3.3) 77 (14.1) 4 (0.7) South of England 145 (10.1) 50 (3.5) 195 (13.5) 6 (0.4)
England 583 (10.6) 171 (3.1) 754 (13.8) 15 (0.3) Isle of Man 2 (25.0) 0 (0.0) 2 (25.0) 1 (12.5) Channel Islands 1 (6.3) 0 (0.0) 1 (6.3) 0 (0.0)
Wales 25 (8.1) 11 (3.5) 36 (11.6) 1 (0.3)
Scotland 98 (18.2) 19 (3.5) 117 (21.8) 0 (0.0)
Northern Ireland 14 (7.6) 5 (2.7) 19 (10.3) 4 (2.2)
TOTAL1, 2 725 (11.1) 206 (3.2) 931 (14.2) 22³ (0.3) 1 Excludes 27 recipients who reside outside the UK (13 DBD, 2 DCD, 12 Living)
2 Includes 3 recipients in the UK with an unknown postcode
3 Includes 3 domino donor transplants
The number of whole, reduced and split liver transplants by urgency status of the transplant (elective, super-urgent) in 2016-2017 is shown in Table 8.9. The term 'reduced' is used when only one lobe of the liver is transplanted and the term 'split' applies when both lobes of the liver are transplanted into two different recipients.

- 85 -
Overall, the number of deceased donor liver transplants increased by 8% in 2016-2017. There were 946 deceased donor liver transplants performed in 2016-2017: 814 whole liver, including 10 liver and kidney; 120 split liver, including 2 liver and kidney; and 12 deceased liver lobe, including 2 liver and kidney. Split liver transplants accounted for 91% of liver lobe transplant activity.
Table 8.9 Deceased liver transplants performed in the UK, 1 April 2015 - 31 March 2017
2015 - 2016 2016 - 2017 Transplant centre
Whole liver
Reduced liver
Split liver
TOTAL Whole liver
Reduced liver
Split liver
TOTAL
E SU E SU E SU E SU E SU E SU E SU E SU
Birmingham 172 22 4 0 34 4 210 26 174 15 6 1 27 2 207 18 Cambridge 75 11 1 0 4 0 80 11 85 7 0 0 10 0 95 7 Edinburgh 84 10 0 0 2 0 86 10 92 6 0 0 5 0 97 6 King's College 148 14 2 3 21 2 171 19 167 14 1 3 41 4 209 21 Leeds 87 13 3 1 11 4 101 18 110 14 1 0 14 2 125 16 Newcastle 36 8 0 0 1 0 37 8 38 3 0 0 1 0 39 3 Royal Free 84 14 0 1 2 1 86 16 72 17 0 0 14 0 86 17
TOTAL 686 92 10 5 75 11 771 108 738 76 8 4 112 8 858 88 E=Elective, SU=Super-urgent Birmingham, King's College and Leeds transplant paediatric patients
The length of time that elapses between a liver being removed from the donor to its transplantation into the recipient is called the cold ischaemia time (CIT). Generally, the shorter this time, the more likely the liver is to work immediately and the better the long-term outcome. In 2016-2017, the median CIT for a DBD donor whole liver only transplant was 8.5 hours (Inter-Quartile (IQ) range 6.8 – 10.4) and for a DCD donor whole liver only transplant was 7.5 hours (IQ range 6.6 - 8.8) and overall is 8.2 hours (IQ range 6.7 - 10). At 31 March 2017 there were approximately 9,700 recipients with a functioning liver transplant (or multi-organ including the liver) being followed-up as reported to the UK Transplant Registry.

- 86 -
8.5 Demographic characteristics The age group, sex, ethnicity and blood group of liver donors, transplant recipients and transplant list patients are shown in Table 8.10.
Table 8.10 Demographic characteristics of deceased liver donors and transplant recipients 1 April 2016 - 31 March 2017, and transplant list patients at 31 March in the UK Age group (years)
Donors Transplant recipients Active transplant list patients
N (%) N (%) N (%)
0 - 17 46 (4) 93 (10) 47 (9) 18 - 34 159 (15) 119 (13) 70 (13) 35 - 49 245 (24) 187 (20) 91 (17) 50 - 59 240 (23) 262 (28) 173 (33) 60 - 69 220 (21) 271 (29) 141 (27) 70+ 131 (13) 14 (1) 8 (2) mean (SD) 50 (17) 47 (19) 47 (18)
Male 594 (57) 594 (63) 298 (56) Female 447 (43) 352 (37) 232 (44)
White 964 (94) 815 (86) 444 (84) Asian 17 (2) 84 (9) 54 (10) Black 18 (2) 32 (3) 18 (3) Chinese 4 (0) 6 (1) 1 (0) Other 27 (3) 8 (1) 12 (2) Not reported 11 1 1
O 496 (48) 415 (44) 337 (64) A 439 (42) 402 (42) 107 (20) B 90 (9) 94 (10) 84 (16) AB 16 (2) 35 (4) 2 (0)
First graft 849 (90) 484 (91) Re-graft 97 (10) 46 (9)
TOTAL 1041 (100) 946 (100) 530 (100)
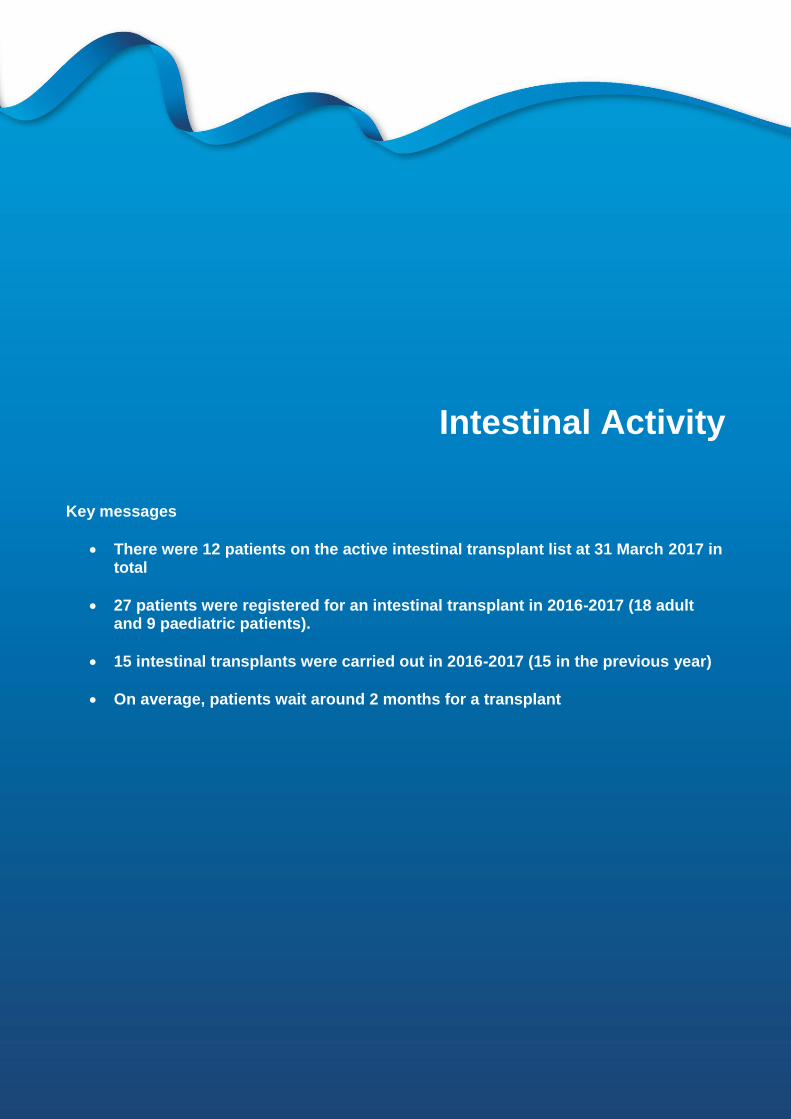
- 87 -
9 Intestinal Activity
Intestinal Activity
Key messages
There were 12 patients on the active intestinal transplant list at 31 March 2017 in total
27 patients were registered for an intestinal transplant in 2016-2017 (18 adult and 9 paediatric patients).
15 intestinal transplants were carried out in 2016-2017 (15 in the previous year)
On average, patients wait around 2 months for a transplant

- 88 -
9.1 Overview During 2016-2017, there were 27 registrations for an intestinal transplant. As at 31 March 2017, 11 (41%) registrations remained active/suspended, 13 (48%) resulted in a transplant, 3 (11%) resulted in a death on the transplant list. Over the last two years (between 1 April 2015 and 31 March 2017), the number of intestinal transplants has remained at 15 transplants carried out in 2016-2017 and in 2015-2016. A national Intestinal Allocation Scheme was introduced in July 2013. Patients are prioritised according to a points system based on a range of clinical factors including donor-recipient age matching, loss of intravenous line access, liver failure, diagnosis of malignancy, in-hospital status, additional organs required, sensitisation and waiting time. A score is calculated for every potentially suitable patient on the national active transplant list and the intestine is allocated preferentially to the patient with the most points. This differs from the previous system in which donor intestines were allocated to patients purely on waiting time. 9.2 Transplant list In 2016-2017, there were 27 registrations for an intestinal transplant. The outcome of these registrations for paediatric (aged <18 years) and adult patients, as at 31 March 2017, broken down by transplant centre can be found in Table 9.1.
Table 9.1 Outcome of intestinal registrations in the UK, 1 April 2016 and 31 March 2017 Transplant Outcome of registrations as at 31 March 2017 centre Transplanted Died Removed Active/Susp TOTAL
N % N % N % N % Adult
Cambridge 5 42 2 17 0 0 5 42 12 Oxford 5 83 1 17 0 0 0 0 6
TOTAL 10 56 3 17 0 0 5 28 18 Paediatric
Birmingham 0 0 0 0 0 0 4 100 4 King's College 3 60 0 0 0 0 2 40 5
TOTAL 3 33 0 0 0 0 6 67 9
Table 9.2 shows the intestinal transplant list rate in the UK by country/Strategic Health Authority of patient's residence. At 31 March 2017, the overall transplant list rate was 0.2 pmp and ranged from 0 to 0.2 pmp across the Strategic Health Authorities, although these numbers are very small so these are not meaningful differences.

- 89 -
Table 9.2 Active intestinal transplant list at 31 March, by country/ Strategic Health Authority of patient residence Country/ Strategic Health Intestinal transplant list (pmp) Authority of residence 2017 2016
North East 0 (0.0) 0 (0.0) North West 0 (0.0) 0 (0.0) Yorkshire and The Humber 0 (0.0) 0 (0.0) North of England 0 (0.0) 0 (0.0)
East Midlands 2 (0.4) 1 (0.2) West Midlands 0 (0.0) 1 (0.2) East of England 0 (0.0) 1 (0.2) Midlands and East 2 (0.1) 3 (0.2)
London 1 (0.1) 1 (0.1)
South East Coast 1 (0.2) 0 (0.0) South Central 0 (0.0) 1 (0.2) South West 1 (0.2) 1 (0.2) South of England 2 (0.1) 2 (0.1)
England 5 (0.1) 6 (0.1) Isle of Man 0 (0.0) 0 (0.0) Channel Islands 0 (0.0) 0 (0.0)
Wales 0 (0.0) 0 (0.0)
Scotland 1 (0.2) 0 (0.0)
Northern Ireland 0 (0.0) 0 (0.0)
TOTAL
1 12 (0.2) 6 (0.1)
1
Includes 6 patients in 2017 resident in the UK with an unknown postcode
Table 9.3 shows median waiting time to elective intestinal transplant by registration type. On average, patients wait 66 days for a transplant.
Table 9.3 Median waiting time to intestinal transplant in the UK, for patients registered 1 April 2013 - 31 March 2016 Registration type Number of patients Waiting time (days)
registered Median 95% Confidence interval
Bowel only1
10 58 30 – 86 Liver, bowel and pancreas
1 39 134 49 – 219
Bowel and pancreas1
16 65 16 – 114
TOTAL 65 66 43 – 89
1 May also include any of: stomach, spleen, abdominal wall, kidney

- 90 -
9.3 Donor and Organ Supply The rates per million population (pmp) for intestinal donors are shown in Table 9.4 by donor country/Strategic Health Authority of residence. The overall DBD intestinal donor rate was 0.2 pmp and ranged from 0 to 0.7 pmp across the Strategic Health Authorities. Of the 829 DBD solid organ donors, 14 (2%) donated their small bowel.
Table 9.4 Intestinal donation rates for deceased donors after brain death in the UK, 1 April 2016 - 31 March 2017, by country/Strategic Health Authority Country/ Strategic Health Authority of residence Solid organ
donors (pmp) Intestinal
donors (pmp) % of solid
organ donors
Organs used
North East 53 (20.2) 0 (0.0) - - North West 90 (12.6) 1 (0.1) 1.1 1 Yorkshire and The Humber 59 (10.9) 1 (0.2) 1.7 1 North of England 202 (13.3) 2 (0.1) 1.0 2
East Midlands 39 (8.3) 2 (0.4) 5.1 2 West Midlands 72 (12.5) 4 (0.7) 5.6 4 East of England 74 (12.2) 1 (0.2) 1.4 1 Midlands and East 185 (11.2) 7 (0.4) 3.8 7
London 96 (11.1) 1 (0.1) 1.0 1
South East Coast 73 (15.8) 1 (0.2) 1.4 1 South Central 51 (11.8) 0 (0.0) - - South West 67 (12.2) 0 (0.0) - - South of England 191 (13.2) 1 (0.1) 0.5 1
England 674 (12.3) 11 (0.2) 1.6 11 Isle of Man 2 (25.0) 0 (0.0) - - Channel Islands 4 (25.0) 0 (0.0) - -
Wales 39 (12.6) 0 (0.0) - -
Scotland 79 (14.7) 1 (0.2) 1.3 1
Northern Ireland 31 (16.8) 2 (1.1) 6.5 2
TOTAL¹ 829 (12.7) 14 (0.2) 1.7 14 ¹ Includes 13 donors where the hospital postcode was used in place of an unknown donor postcode
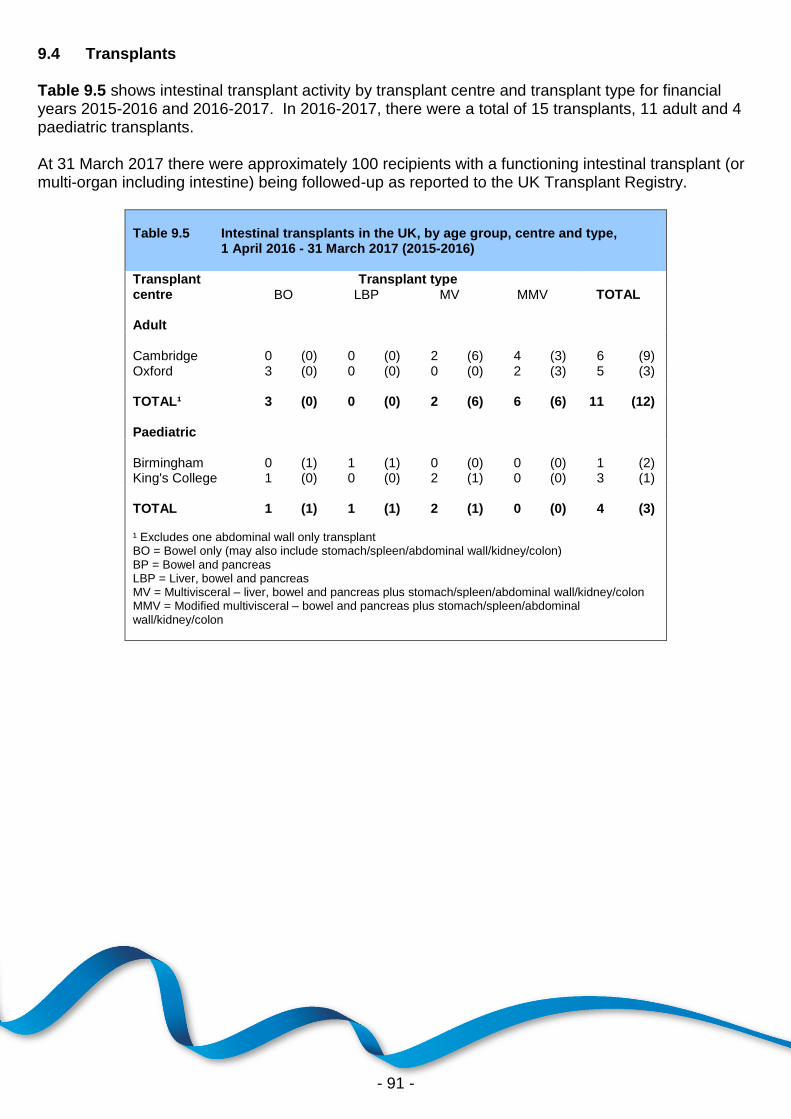
- 91 -
9.4 Transplants Table 9.5 shows intestinal transplant activity by transplant centre and transplant type for financial years 2015-2016 and 2016-2017. In 2016-2017, there were a total of 15 transplants, 11 adult and 4 paediatric transplants. At 31 March 2017 there were approximately 100 recipients with a functioning intestinal transplant (or multi-organ including intestine) being followed-up as reported to the UK Transplant Registry.
Table 9.5 Intestinal transplants in the UK, by age group, centre and type, 1 April 2016 - 31 March 2017 (2015-2016) Transplant Transplant type centre BO LBP MV MMV TOTAL Adult
Cambridge 0 (0) 0 (0) 2 (6) 4 (3) 6 (9) Oxford 3 (0) 0 (0) 0 (0) 2 (3) 5 (3)
TOTAL¹ 3 (0) 0 (0) 2 (6) 6 (6) 11 (12) Paediatric
Birmingham 0 (1) 1 (1) 0 (0) 0 (0) 1 (2) King's College 1 (0) 0 (0) 2 (1) 0 (0) 3 (1)
TOTAL 1 (1) 1 (1) 2 (1) 0 (0) 4 (3) ¹ Excludes one abdominal wall only transplant BO = Bowel only (may also include stomach/spleen/abdominal wall/kidney/colon) BP = Bowel and pancreas LBP = Liver, bowel and pancreas MV = Multivisceral – liver, bowel and pancreas plus stomach/spleen/abdominal wall/kidney/colon MMV = Modified multivisceral – bowel and pancreas plus stomach/spleen/abdominal wall/kidney/colon

- 92 -
9.5 Demographic Characteristics The age group, sex, ethnicity and blood group of intestinal donors, transplant recipients and transplant list patients are shown in Table 9.6.
Table 9.6 Demographic characteristics of deceased intestinal donors and transplant recipients 1 April 2016 - 31 March 2017, and transplant list patients at 31 March in the UK Age group (years)
Donors Transplant recipients Active transplant list patients
N (%) N (%) N (%)
0 - 17 6 (43) 4 (27) 7 (58) 18 - 34 5 (36) 2 (13) 2 (17) 35 - 49 2 (14) 5 (33) 2 (17) 50 - 59 1 (7) 4 (27) 1 (8) mean (SD) 25 (14) 36 (19) 19 (21)
Male 6 (43) 11 (73) 5 (42) Female 8 (57) 4 (27) 7 (58)
White 11 (79) 12 (80) 12 (100) Asian 1 (7) 1 (7) 0 (0) Other 2 (14) 2 (13) 0 (0)
O 6 (43) 3 (20) 7 (58) A 7 (50) 7 (47) 5 (42) B 1 (7) 3 (20) 0 (0) AB 0 (0) 2 (13) 0 (0)
First graft 14 (93) 11 (92) Re-graft 1 (7) 1 (8)
TOTAL 14 (100) 15¹ (100) 12 (100)
¹ Includes 1 overseas donors

- 93 -
11 Survival Rates Following Transplantation
Survival Rates Following
Transplantation

- 94 -
This chapter shows graft survival rates over time for kidney and pancreas transplants, and patient survival estimates for kidney, pancreas, cardiothoracic, liver and intestinal transplants, performed in the UK. Separate estimates are presented for adult and paediatric patients (using organ specific age definitions) and for transplants from donors after brain death and donors after circulatory death. In all cases, the Kaplan-Meier estimate of the survivor function was used to provide the survival rate and groups (years) were compared using the log-rank test. The analyses do not take account of risk factors which may change over time. Graft survival is defined as time from transplant to graft failure, censoring for death with a functioning graft and grafts still functioning at time of analysis. Patient survival is defined as time from transplant to patient death, censoring for patients still alive at time of analysis. Both analyses consider only first transplants.
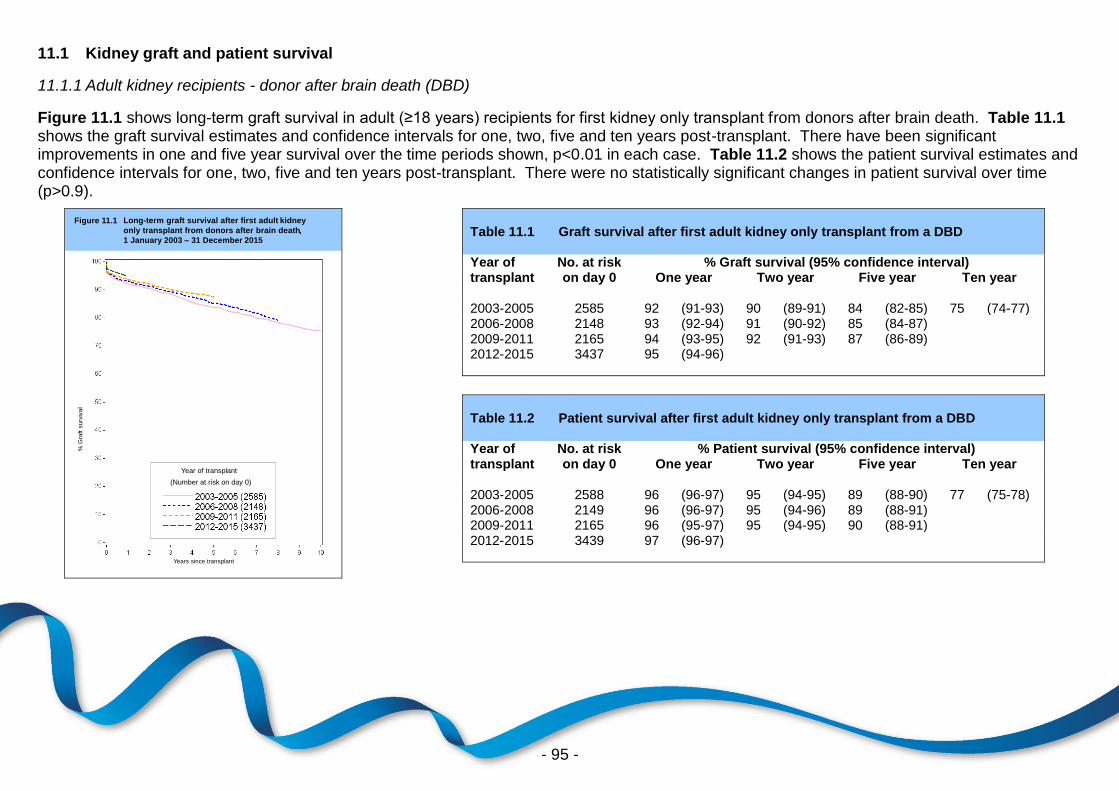
- 95 -
11.1 Kidney graft and patient survival
11.1.1 Adult kidney recipients - donor after brain death (DBD)
Figure 11.1 shows long-term graft survival in adult (≥18 years) recipients for first kidney only transplant from donors after brain death. Table 11.1 shows the graft survival estimates and confidence intervals for one, two, five and ten years post-transplant. There have been significant improvements in one and five year survival over the time periods shown, p<0.01 in each case. Table 11.2 shows the patient survival estimates and confidence intervals for one, two, five and ten years post-transplant. There were no statistically significant changes in patient survival over time (p>0.9).
% G
raft s
urv
iva
l
Years since transplant
Year of transplant
(Number at risk on day 0)
Long-term graft survival after first adult kidney
only transplant from donors after brain death,
1 January 2003 – 31 December 2015
Figure 11.1
Table 11.1 Graft survival after first adult kidney only transplant from a DBD Year of No. at risk % Graft survival (95% confidence interval) transplant on day 0 One year Two year Five year Ten year
2003-2005 2585 92 (91-93) 90 (89-91) 84 (82-85) 75 (74-77) 2006-2008 2148 93 (92-94) 91 (90-92) 85 (84-87) 2009-2011 2165 94 (93-95) 92 (91-93) 87 (86-89) 2012-2015 3437 95 (94-96)
Table 11.2 Patient survival after first adult kidney only transplant from a DBD Year of No. at risk % Patient survival (95% confidence interval) transplant on day 0 One year Two year Five year Ten year
2003-2005 2588 96 (96-97) 95 (94-95) 89 (88-90) 77 (75-78) 2006-2008 2149 96 (96-97) 95 (94-96) 89 (88-91) 2009-2011 2165 96 (95-97) 95 (94-95) 90 (88-91) 2012-2015 3439 97 (96-97)

- 96 -
11.1.2 Adult kidney recipients - donor after circulatory death (DCD) Long-term graft survival in adult recipients for kidney transplants from donors after circulatory death is shown in Figure 11.2. Table 11.3 shows the graft survival estimates and confidence intervals for one, two, five and ten years post-transplant. There has been significant variation in one year survival over the time periods shown, p=0.007. One year graft and patient survival are comparable for DBD and DCD donor transplants in the most recent time periods. Table 11.4 shows the patient survival estimates and confidence intervals for each time period analysed. There was a borderline statistically significant decline in patient survival over time at five years post-transplant (p=0.06).
% G
raft s
urv
iva
l
Years since transplant
Long-term graft survival after first adult kidney
only transplant from donors after circulatory
death, 1 January 2003 – 31 December 2015
Figure 11.2
Year of transplant
(Number at risk on day 0)
Year of transplant
(Number at risk on day 0)
Table 11.3 Graft survival after first adult kidney only transplant from a DCD Year of No. at risk % Graft survival (95% confidence interval) transplant on day 0 One year Two year Five year Ten year
2003-2005 410 93 (90-95) 92 (89-95) 87 (83-90) 77 (73-81) 2006-2008 888 93 (91-94) 91 (89-93) 87 (84-89) 2009-2011 1518 91 (90-93) 90 (88-91) 85 (83-87) 2012-2015 2727 94 (93-95)
Table 11.4 Patient survival after first adult kidney only transplant from a DCD Year of No. at risk % Patient survival (95% confidence interval) transplant on day 0 One year Two year Five year Ten year
2003-2005 411 97 (94-98) 95 (92-97) 89 (85-91) 74 (69-78) 2006-2008 888 96 (95-97) 95 (93-96) 88 (86-90) 2009-2011 1518 95 (94-96) 93 (91-94) 85 (83-87) 2012-2015 2728 96 (95-97)
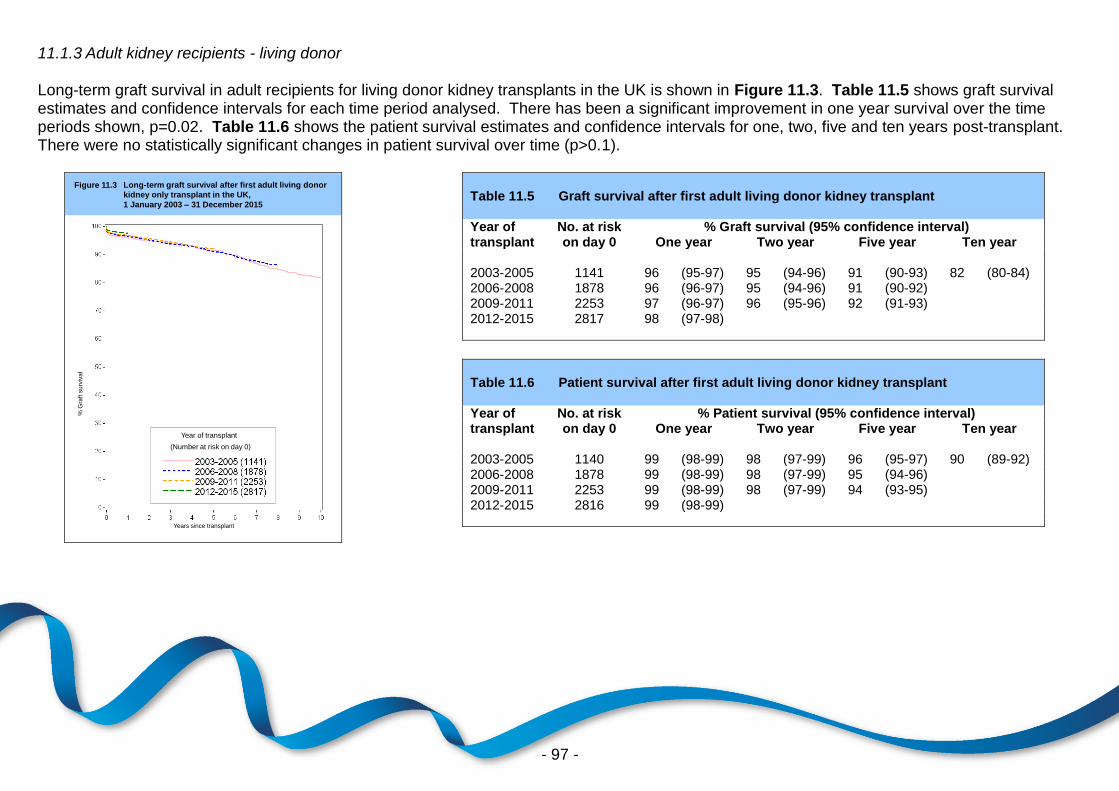
- 97 -
11.1.3 Adult kidney recipients - living donor Long-term graft survival in adult recipients for living donor kidney transplants in the UK is shown in Figure 11.3. Table 11.5 shows graft survival estimates and confidence intervals for each time period analysed. There has been a significant improvement in one year survival over the time periods shown, p=0.02. Table 11.6 shows the patient survival estimates and confidence intervals for one, two, five and ten years post-transplant. There were no statistically significant changes in patient survival over time (p>0.1).
% G
raft
surv
ival
Years since transplant
Long-term graft survival after first adult living donor
kidney only transplant in the UK,
1 January 2003 – 31 December 2015
Figure 11.3
Year of transplant
(Number at risk on day 0)
Table 11.5 Graft survival after first adult living donor kidney transplant Year of No. at risk % Graft survival (95% confidence interval) transplant on day 0 One year Two year Five year Ten year
2003-2005 1141 96 (95-97) 95 (94-96) 91 (90-93) 82 (80-84) 2006-2008 1878 96 (96-97) 95 (94-96) 91 (90-92) 2009-2011 2253 97 (96-97) 96 (95-96) 92 (91-93) 2012-2015 2817 98 (97-98)
Table 11.6 Patient survival after first adult living donor kidney transplant Year of No. at risk % Patient survival (95% confidence interval) transplant on day 0 One year Two year Five year Ten year
2003-2005 1140 99 (98-99) 98 (97-99) 96 (95-97) 90 (89-92) 2006-2008 1878 99 (98-99) 98 (97-99) 95 (94-96) 2009-2011 2253 99 (98-99) 98 (97-99) 94 (93-95) 2012-2015 2816 99 (98-99)

- 98 -
11.1.4 Paediatric kidney recipients - donor after brain death (DBD) Figure 11.4 shows long-term graft survival in paediatric (<18 years) recipients for first kidney only transplants from donors after brain death. Graft survival estimates and confidence intervals are shown for each time period analysed in Table 11.7. There were no statistically significant changes in graft survival over time (p>0.06).Table 11.8 shows the patient survival estimates and confidence intervals for one, two, five and ten years post-transplant. There were no statistically significant changes in patient survival over time (p>0.4). There were insufficient paediatric recipients of first kidney only transplants from donors after circulatory death to permit reliable analysis.
% G
raft
surv
ival
Years since transplant
Long-term graft survival after first paediatric kidney
only transplant from donors after brain death,
1 January 2003 – 31 December 2015
Figure 11.4
Year of transplant
(Number at risk on day 0)
Table 11.7 Graft survival after first paediatric kidney only transplant from a DBD Year of No. at risk % Graft survival (95% confidence interval) transplant on day 0 One year Two year Five year Ten year
2003-2005 205 92 (87-95) 90 (85-94) 83 (77-87) 66 (59-72) 2006-2008 187 95 (91-97) 92 (87-95) 87 (81-91) 2009-2011 180 96 (91-98) 91 (86-94) 83 (77-88) 2012-2015 178 98 (94-99)
Table 11.8 Patient survival after first paediatric kidney only transplant from a DBD Year of No. at risk % Patient survival (95% confidence interval) transplant on day 0 One year Two year Five year Ten year
2003-2005 205 100 (-) 100 (-) 98 (95-100) 97 (93-99) 2006-2008 188 100 (-) 99 (96-100) 99 (96-100) 2009-2011 180 99 (96-100) 99 (96-100) 97 (93-99) 2012-2015 178 99 (96-100)

- 99 -
11.1.5 Paediatric kidney recipients - living donor Long-term graft survival in paediatric recipients for living donor kidney transplants in the UK is shown in Figure 11.5. Table 11.9 shows graft survival estimates and confidence intervals for each time period analysed. There has been a significant decrease in five year survival over the time periods shown, p=0.02. Table 11.10 shows the patient survival estimates and confidence intervals for one, two, five and ten years post-transplant. There were no statistically significant differences in patient survival over time (p>0.7).
% G
raft
surv
ival
Years since transplant
Long-term graft survival after first paediatric living
donor kidney only transplant in the UK,
1 January 2003 – 31 December 2015
Figure 11.5
Year of transplant
(Number at risk on day 0)
Table 11.9 Graft survival after first paediatric living donor kidney transplant Year of No. at risk % Graft survival (95% confidence interval) transplant on day 0 One year Two year Five year Ten year
2003-2005 121 97 (91-99) 97 (91-99) 94 (87-97) 81 (72-87) 2006-2008 157 97 (93-99) 97 (93-99) 93 (88-96) 2009-2011 181 94 (90-97) 92 (87-95) 85 (78-89) 2012-2015 258 98 (95-99)
Table 11.10 Patient survival after first paediatric living donor kidney transplant Year of No. at risk % Patient survival (95% confidence interval) transplant on day 0 One year Two year Five year Ten year
2003-2005 121 98 (93-100) 98 (93-100) 98 (93-100) 95 (89-98) 2006-2008 157 99 (96-100) 99 (96-100) 99 (95-100) 2009-2011 181 99 (96-100) 99 (96-100) 98 (94-99) 2012-2015 258 99 (97-100)

- 100 -
11.2 Pancreas graft and patient survival
11.2.1 Simultaneous kidney/pancreas transplants - donor after brain death (DBD)
Figure 11.6 shows long-term graft survival in recipients receiving their first simultaneous kidney/pancreas (SPK) transplant performed from donors after brain death. Graft and patient survival estimates and confidence intervals are shown at one, two, five and ten years post-transplant in Table 11.11 and Table 11.12 respectively. Results relate to adults only as there are no paediatric pancreas transplant recipients. There has been no significant variation in graft survival over time (p>0.06). Differences in patient survival are also not significant over time (p>0.3).
Long-term graft survival after first SPK transplant
from donors after brain death,
1 January 2003 – 31 December 2015
% G
raft
su
rviv
al
Years since transplant
Figure 11.6
Year of transplant
(Number at risk on day 0)
Table 11.11 Graft survival after first SPK transplant from a DBD
Year of No. at risk % Graft survival (95% confidence interval) transplant on day 0 One year Two year Five year Ten year
2003-2005 205 82 (76-87) 79 (72-84) 73 (67-79) 67 (60-73) 2006-2008 430 88 (85-91) 85 (82-88) 78 (74-82) 2009-2011 369 85 (81-88) 80 (76-84) 77 (72-81) 2012-2015 506 88 (85-91)
Table 11.12 Patient survival after first SPK transplant from a DBD
Year of No. at risk % Patient survival (95% confidence interval) transplant on day 0 One year Two year Five year Ten year
2003-2005 206 94 (90-96) 92 (88-95) 86 (81-90) 75 (68-80) 2006-2008 433 96 (93-97) 94 (91-96) 90 (87-92) 2009-2011 369 96 (94-98) 93 (90-95) 87 (83-90) 2012-2015 508 96 (94-98)

- 101 -
11.2.2 Simultaneous kidney/pancreas transplants - donor after circulatory death (DCD) The majority of simultaneous kidney/pancreas (SPK) transplants from a DCD have been performed since 1 January 2007, so there are insufficient data available to analyse long-term survival. Figure 11.7 shows pancreas graft survival in recipients receiving their first SPK transplant performed from donors after circulatory death, 2009-2011 and 2012-2015. Graft and patient survival estimates and confidence intervals are shown at one, two and three years in Table 11.13 and Table 11.14 respectively. Results are for adult patients only.
Pancreas graft survival after first SPK transplant
from donors after circulatory death,
1 January 2009 – 31 December 2015
% G
raft
su
rviv
al
Years since transplant
Figure 11.7
Year of transplant
(Number at risk on day 0)
Table 11.13 Graft survival after first SPK transplant from a DCD Year of No. at risk % Graft survival (95% confidence interval) transplant on day 0 One year Two year Three year
2009-2011 75 89 (80-95) 87 (77-93) 81 (70-88) 2012-2015 164 85 (79-90)
Table 11.14 Patient survival after first SPK transplant from a DCD Year of No. at risk % Patient survival (95% confidence interval) transplant on day 0 One year Two year Three year
2009-2011 75 99 (91-100) 94 (86-98) 94 (86-98) 2012-2015 164 99 (95-100)

- 102 -
11.2.3 Pancreas only transplants - donor after brain death (DBD) Figure 11.8 shows long-term graft survival in recipients receiving their first pancreas only transplant performed from donors after brain death. Graft and patient survival estimates and confidence intervals are shown at one, two, five and ten years in Table 11.15 and Table 11.16 respectively. Results are for adult patients only. There were no statistically significant differences in graft or patient survival over time (p>0.6 and p>0.2).
Long-term graft survival after pancreas only
transplant from donors after brain death,
1 January 2003 – 31 December 2015
% G
raft
su
rviv
al
Years since transplant
Figure 11.8
Year of transplant
(Number at risk on day 0)
Table 11.15 Graft survival after first pancreas only transplant from a DBD
Year of No. at risk % Graft survival (95% confidence interval) transplant on day 0 One year Two year Five year Ten year
2003-2005 30 70 (50-83) 57 (37-72) 50 (31-66) 34 (18-52) 2006-2008 74 72 (60-81) 62 (50-72) 46 (34-57) 2009-2011 61 69 (56-79) 67 (54-77) 55 (41-66) 2012-2015 68 78 (66-86)
Table 11.16 Patient survival after first pancreas only transplant from a DBD
Year of No. at risk % Patient survival (95% confidence interval) transplant on day 0 One year Two year Five year Ten year
2003-2005 31 100 (-) 100 (-) 92 (73-98) 50 (29-68) 2006-2008 74 94 (86-98) 91 (82-96) 86 (75-93) 2009-2011 62 96 (85-99) 94 (83-98) 81 (66-90) 2012-2015 68 98 (88-100)

- 103 -
11.2.4 Pancreas only transplants - donor after circulatory death (DCD) Figure 11.9 shows pancreas graft survival in recipients receiving their first pancreas only transplant performed from donors after circulatory death, 2009-2011 and 2012-2015. Graft and patient survival estimates and confidence intervals are shown at one, two and three years in Table 11.17 and Table 11.18 respectively. Results are for adult patients only.
Pancreas graft survival after pancreas only transplant
from donors after circulatory death,
1 January 2009 – 31 December 2015
% G
raft
su
rviv
al
Years since transplant
Figure 11.9
Year of transplant
(Number at risk on day 0)
Table 11.17 Graft survival after first pancreas only transplant from a DCD Year of No. at risk % Graft survival (95% confidence interval) transplant on day 0 One year Two year Three year
2009-2011 25 68 (46-83) 68 (46-83) 68 (46-83) 2012-2015 20 90 (66-97)
Table 11.18 Patient survival after first pancreas only transplant from a DCD Year of No. at risk % Patient survival (95% confidence interval) transplant on day 0 One year Two year Three year
2009-2011 25 100 (-) 100 (-) 95 (71-99) 2012-2015 20 95 (69-99)

- 104 -
11.3 Cardiothoracic patient survival 11.3.1 Adult heart recipients Long-term patient survival for adult (≥16 years) recipients after first heart only transplant is shown in Figure 11.10. Domino and deceased donor (DBD only) transplants are included as well as both urgent and non-urgent patients. Table 11.19 shows the patient survival estimates and confidence intervals for one, two, five and ten years post-transplant for each transplant era. There was statistically significant variation in patient survival across eras at five years post-transplant (p=0.02).
Long-term patient survival after first adult heart only
transplant in the UK,
1 January 2003 – 31 December 2015
% P
atie
nt su
rviv
al
Years since transplant
Figure 11.10
Year of transplant
(Number at risk on day 0)
Table 11.19 Patient survival after first adult heart only transplant Year of No. at risk % Patient survival (95% confidence interval) transplant on day 0 One year Two year Five year Ten year
2003-2005 375 78 (74-82) 76 (71-80) 67 (62-72) 55 (50-60) 2006-2008 311 84 (80-88) 82 (78-86) 78 (73-82) 2009-2011 283 81 (76-85) 80 (75-84) 71 (66-76) 2012-2015 551 83 (79-85)

- 105 -
11.3.2 Adult heart-lung block recipients Patient survival for adult recipients after first heart-lung block transplant is shown in Figure 11.11. Patient survival estimates and confidence intervals for each time period analysed are shown in Table 11.20. There is some variation between survival rates across transplant eras, with shorter term outcomes generally seeing an improvement, however these statistics are based on small numbers and are not statistically significantly different (p>0.4).
Long-term patient survival after first adult heart/lung
block transplant in the UK,
1 January 2003 – 31 December 2015
% P
atie
nt
su
rviv
al
Years since transplant
Figure 11.11
Year of transplant
(Number at risk on day 0)
Table 11.20 Patient survival after first adult heart-lung block transplant Year of No. at risk % Patient survival (95% confidence interval) transplant on day 0 One year Two year Five year Ten year
2003-2005 29 66 (45-80) 66 (45-80) 66 (45-80) 47 (28-64) 2006-2008 14 86 (54-96) 79 (47-93) 79 (47-93) 2009-2011 11 82 (45-95) 73 (37-90) 62 (28-84) 2012-2015 16 81 (52-94)

- 106 -
11.3.3 Adult lung recipients - donors after brain death (DBD) Patient survival for adult recipients after first lung only transplant from donors after brain death is shown in Figure 11.12, with survival estimates and confidence intervals shown in Table 11.21. There was statistically significant variation in patient survival at one year post-transplant (p=0.005).
Long-term patient survival after first adult lung only
transplant from donors after brain death,
1 January 2003 – 31 December 2015
% P
atient surv
ival
Figure 11.12
Years since transplant
Year of transplant
(Number at risk on day 0)
Table 11.21 Patient survival after first adult lung only transplant from a DBD Year of No. at risk % Patient survival (95% confidence interval) transplant on day 0 One year Two year Five year Ten year
2003-2005 363 73 (68-78) 67 (62-72) 52 (47-57) 33 (28-38) 2006-2008 333 81 (76-85) 70 (65-75) 55 (49-60) 2009-2011 416 82 (78-86) 74 (69-78) 59 (54-64) 2012-2015 581 80 (77-83)

- 107 -
11.3.4 Adult lung recipients - donors after circulatory death (DCD) The majority of lung transplants from a DCD have been performed since 1 January 2007, so there are insufficient data available to analyse long-term patient survival. Patient survival for adult recipients after first lung only transplant from donors after circulatory death is shown in Figure 11.13, with survival estimates and confidence intervals shown in Table 11.22.
Patient survival after first adult lung only transplant
from donors after circulatory death,
1 January 2009 – 31 December 2015
% P
atient surv
ival
Figure 11.13
Years since transplant
Year of transplant
(Number at risk on day 0)
Table 11.22 Patient survival after first adult lung only transplant from a DCD Year of No. at risk % Patient survival (95% confidence interval) transplant on day 0 One year Two year Three year
2009-2011 51 86 (73-93) 78 (64-87) 64 (49-75) 2012-2015 141 77 (69-83)

- 108 -
11.3.5 Paediatric heart recipients Long-term patient survival for paediatric recipients after first heart only transplant is shown in Figure 11.14. Domino and deceased donor transplants (DBD donors only) are included as well as transplants for urgent patients. Table 11.23 shows the patient survival estimates and confidence intervals for one, two, five and ten years post-transplant. There is statistically significant variation in one, two or five year survival over the time period analysed, p<0.05. The number of heart-lung transplant recipients was too small for analysis.
Long-term patient survival after first paediatric heart
only transplant in the UK,
1 January 2003 – 31 December 2015
% P
atie
nt
su
rviv
al
Years since transplant
Figure 11.14
Year of transplant
(Number at risk on day 0)
Table 11.23 Patient survival after first paediatric heart only transplant Year of No. at risk % Patient survival (95% confidence interval) transplant on day 0 One year Two year Five year Ten year
2003-2005 76 93 (85-97) 93 (85-97) 85 (75-92) 79 (67-86) 2006-2008 83 99 (92-100) 98 (91-99) 93 (85-97) 2009-2011 108 88 (80-93) 87 (79-92) 80 (72-87) 2012-2015 115 93 (87-96)

- 109 -
11.3.6 Paediatric lung recipients - donors after brain death (DBD) Long-term patient survival for paediatric recipients after first lung only transplant from donors after brain death is shown in Figure 11.15. Table 11.24 shows the patient survival estimates and confidence intervals for one, two, five and ten years post-transplant. There were no statistically significant differences in patient survival over time (p>0.4).
Long-term patient survival after first paediatric lung
only transplant from donors after brain death,
1 January 2003 – 31 December 2015
% P
atie
nt
su
rviv
al
Years since transplant
Figure 11.15
Year of transplant
(Number at risk on day 0)
Table 11.24 Patient survival after first paediatric lung only transplant from a DBD Year of No. at risk % Patient survival (95% confidence interval) transplant on day 0 One year Two year Five year Ten year
2003-2005 12 100 (-) 100 (-) 75 (41-91) 67 (34-86) 2006-2008 18 94 (67-99) 89 (62-97) 72 (46-87) 2009-2011 16 88 (59-97) 88 (59-97) 81 (52-94) 2012-2015 20 89 (64-97)

- 110 -
11.4 Liver patient survival 11.4.1 Adult recipients - donor after brain death (DBD) Long-term patient survival for adult (>=17 years) recipients after first elective liver only transplants from donors after brain death is shown in Figure 11.16. Table 11.25 shows patient survival estimates at one, two, five and ten years post-transplant. There have been significant improvements in one, two and five year patient survival, p<0.003 in each case, over the time periods analysed from 2003-2005 to 2012-2015.
Long-term patient survival after first elective adult
liver only transplant from donors after brain death,
1 January 2003 – 31 December 2015
% P
atie
nt
su
rviv
al
Years since transplant
Figure 11.16
Year of transplant
(Number at risk on day 0)
Table 11.25 Patient survival after first elective adult liver only transplant from a DBD Year of No. at risk % Patient survival (95% confidence interval) transplant on day 0 One year Two year Five year Ten year
2003-2005 1148 89 (87-90) 86 (84-88) 76 (74-79) 64 (61-67) 2006-2008 1100 91 (89-93) 88 (86-90) 80 (78-83) 2009-2011 1153 93 (92-95) 91 (89-93) 82 (79-84) 2012-2015 1808 94 (92-95)

- 111 -
11.4.2 Adult recipients - donor after circulatory death (DCD) Patient survival for adult (>=17 years) recipients after first elective liver only transplants from donors after circulatory death is shown in Figure 11.17. Due to small numbers prior to 2006 it is not possible to estimate long term patient survival. Table 11.26 shows patient survival estimates at one, two and five years post-transplant.
Liver patient survival after first elective adult liver
only transplant from donors after circulatory death,
1 January 2006 – 31 December 2015
% P
atie
nt su
rviv
al
Years since transplant
Figure 11.17
Year of transplant
(Number at risk on day 0)
Table 11.26 Patient survival after first elective adult liver only transplant from a DCD
Year of No. at risk % Patient survival (95% confidence interval) transplant on day 0 One year Two year Five year
2006-2008 149 91 (85-94) 85 (78-90) 76 (68-82) 2009-2011 291 85 (80-89) 81 (75-85) 74 (68-79) 2012-2015 633 95 (93-97)

- 112 -
11.4.3 Paediatric recipients - donor after brain death (DBD) Figure 11.18 and Table 11.27 show long-term patient survival estimates for first elective liver only transplants from donors after brain death in paediatric (<17 years) recipients. There have been no statistically significant improvements in one, two or five year patient survival over the time period analysed (p>0.2). The number of paediatric transplants from donors after circulatory death was too small to estimate meaningful patient survival.
Long-term patient survival after first elective
paediatric liver only transplant from donors after
brain death, 1 January 2003 – 31 December 2015
% P
atie
nt
su
rviv
al
Years since transplant
Figure 11.18
Year of transplant
(Number at risk on day 0)
Table 11.27 Patient survival after first elective paediatric liver only transplant from a DBD Year of No. at risk % Patient survival (95% confidence interval) transplant on day 0 One year Two year Five year Ten year
2003-2005 143 96 (91-98) 94 (88-97) 91 (85-95) 86 (79-91) 2006-2008 151 93 (88-96) 91 (86-95) 89 (82-93) 2009-2011 137 94 (89-97) 92 (86-95) 90 (84-94) 2012-2015 202 98 (94-99)
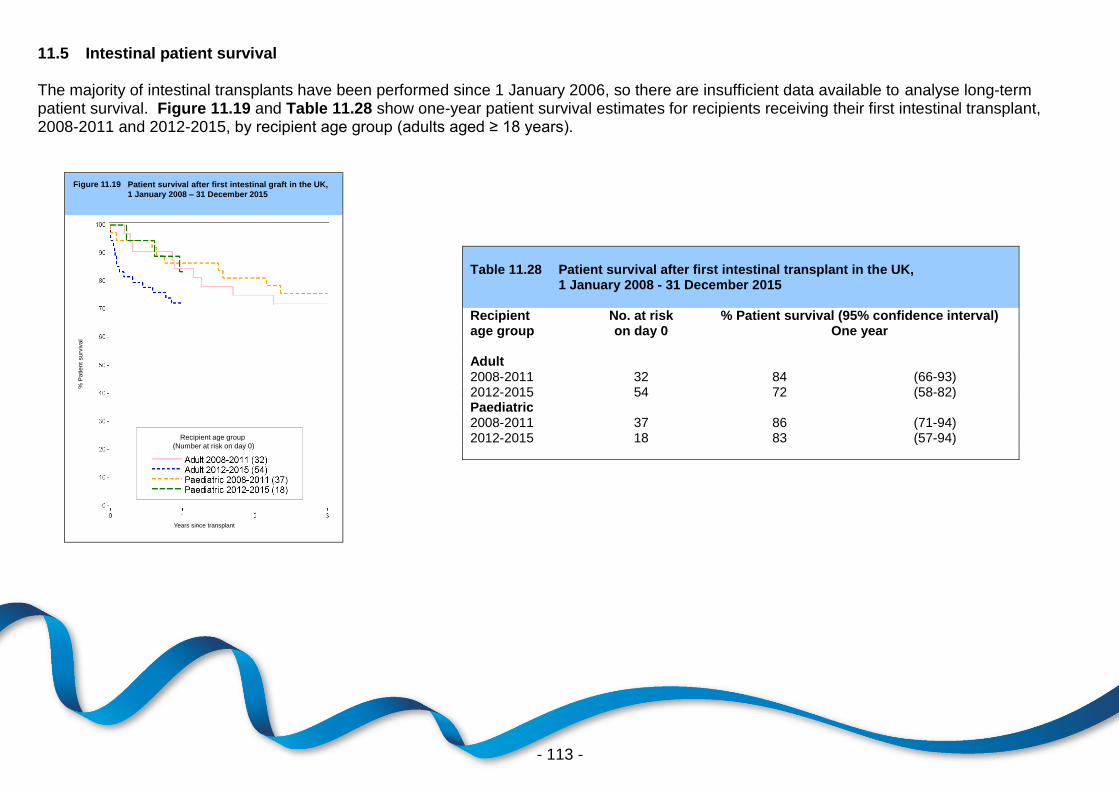
- 113 -
11.5 Intestinal patient survival The majority of intestinal transplants have been performed since 1 January 2006, so there are insufficient data available to analyse long-term patient survival. Figure 11.19 and Table 11.28 show one-year patient survival estimates for recipients receiving their first intestinal transplant, 2008-2011 and 2012-2015, by recipient age group (adults aged ≥ 18 years).
Patient survival after first intestinal graft in the UK,
1 January 2008 – 31 December 2015
Figure 11.19
Years since transplant
% P
atient
surv
ival
Recipient age group
(Number at risk on day 0)
Table 11.28 Patient survival after first intestinal transplant in the UK, 1 January 2008 - 31 December 2015 Recipient No. at risk % Patient survival (95% confidence interval) age group on day 0 One year
Adult 2008-2011 32 84 (66-93) 2012-2015 54 72 (58-82) Paediatric 2008-2011 37 86 (71-94) 2012-2015 18 83 (57-94)

- 114 -
12 NHS Organ Donor Register
NHS Organ Donor
Register
Key messages
23.6 million people on the opt-in ODR at March 2017 (36% of the population)
204,518 people on the opt-out ODR at March 2017, with a further 72 appointed representative registrations
44% of the 1,413 deceased organ donors last year were on the opt-in ODR
58% of 1,158,699 registrations last year were through the Driver and Vehicle
Licensing Agency (DVLA).
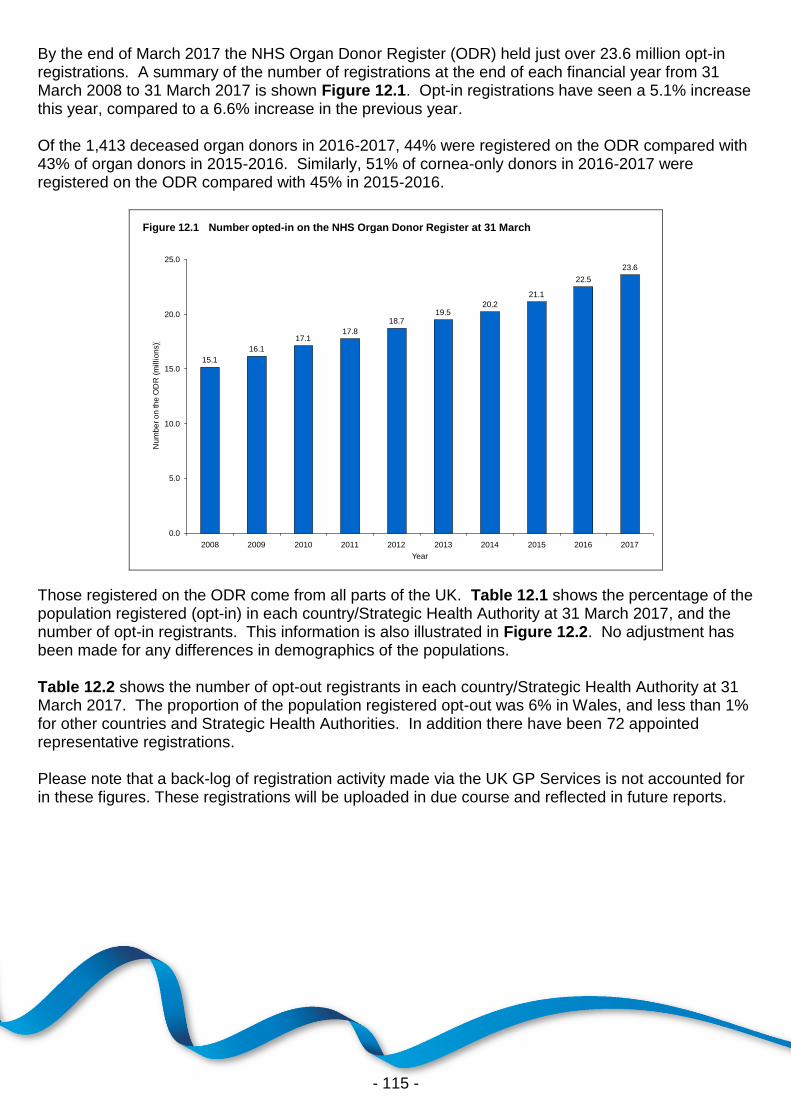
- 115 -
By the end of March 2017 the NHS Organ Donor Register (ODR) held just over 23.6 million opt-in registrations. A summary of the number of registrations at the end of each financial year from 31 March 2008 to 31 March 2017 is shown Figure 12.1. Opt-in registrations have seen a 5.1% increase this year, compared to a 6.6% increase in the previous year. Of the 1,413 deceased organ donors in 2016-2017, 44% were registered on the ODR compared with 43% of organ donors in 2015-2016. Similarly, 51% of cornea-only donors in 2016-2017 were registered on the ODR compared with 45% in 2015-2016.
15.1
16.1
17.117.8
18.719.5
20.2
21.1
22.5
23.6
0.0
5.0
10.0
15.0
20.0
25.0
2008 2009 2010 2011 2012 2013 2014 2015 2016 2017
Year
Nu
mb
er
on
th
e O
DR
(m
illio
ns))
Number opted-in on the NHS Organ Donor Register at 31 MarchFigure 12.1
Those registered on the ODR come from all parts of the UK. Table 12.1 shows the percentage of the population registered (opt-in) in each country/Strategic Health Authority at 31 March 2017, and the number of opt-in registrants. This information is also illustrated in Figure 12.2. No adjustment has been made for any differences in demographics of the populations. Table 12.2 shows the number of opt-out registrants in each country/Strategic Health Authority at 31 March 2017. The proportion of the population registered opt-out was 6% in Wales, and less than 1% for other countries and Strategic Health Authorities. In addition there have been 72 appointed representative registrations. Please note that a back-log of registration activity made via the UK GP Services is not accounted for in these figures. These registrations will be uploaded in due course and reflected in future reports.

- 116 -
Table 12.1 Opt-in registrations1 on the NHS Organ Donor Register by 31 March 2017, by country/ Strategic Health Authority Country/ Strategic Health Opt-in registrants Authority N pmp Proportion registered
North East 920,073 351,173 35% North West 2,425,102 338,229 34% Yorkshire and The Humber 1,828,230 339,189 34% North of England 5,173,405 340,804 34%
East Midlands 1,617,861 345,697 35% West Midlands 1,715,585 298,363 30% East of England 2,280,013 375,002 38% Midlands and East 5,613,459 340,004 34%
London 2,472,211 285,145 29%
South East Coast 1,885,693 407,277 41% South Central 1,712,612 396,438 40% South West 2,396,024 438,030 44% South of England 5,994,329 415,696 42%
England 19,253,404 351,404 35% Isle of Man 12,584 157,300 16% Channel Islands 18,165 113,531 11%
Wales 1,171,300 377,839 38%
Scotland 2,388,348 444,758 44%
Northern Ireland 734,366 396,955 40%
TOTAL
2 23,642,565 361,784 36%
1 Please note that a back-log of registration activity made via the UK GP Services is not accounted for in these
figures. These registrations will be uploaded in due course and reflected in future reports 2 Includes 64,398 registrants where the postcode was unknown

- 117 -
Table 12.2 Opt-out registrations on the NHS Organ Donor Register by 31 March 2017, by country/ Strategic Health Authority Country/ Strategic Health Opt-out registrants Authority N pmp
North East 1,047 400 North West 3,624 505 Yorkshire and The Humber 2,638 489 North of England 7,309 482
East Midlands 2,216 474 West Midlands 3,432 597 East of England 3,011 495 Midlands and East 8,659 525
London 4,511 520
South East Coast 2,124 459 South Central 2,121 491 South West 2,845 520 South of England 7,090 492
England 27,569 503 Isle of Man 2 25 Channel Islands 7 44
Wales 174,806 56,389
Scotland 1,834 342
Northern Ireland 205 111
TOTAL
1 204,518 3,130
1 Includes 95 registrants where the postcode was unknown

- 118 -
Figure 12.2 Proportion of population who opted-in on the NHS Organ Donor Register by 31 March 2017, by Strategic Health Authority
Registrants (million)
<1.00
1.00-<1.20
1.20-<1.40
1.40-<1.60
1.60-<1.80
1.80-<2.00
>=2.00
% %
40%
35%
34%
34%
35%
30%
38%
29%
41%
40%
44%
44%
38%
There are a number of registration routes to opt-in on the ODR: Health Department registration leaflets readily available in the community; campaigns in both national and regional newspapers and by community groups; the European Health Insurance Card; when registering as a patient with a General Practitioner (via the Family Health Services Authorities); with driving licence applications and reminders (via the Driver and Vehicle Licensing Agency (DVLA); from the Passport Agency when applying for a new passport; when applying for a Boots Advantage Card; online registrations via the Organ Donation and Transplantation (ODT) website (www.odt.nhs.uk) and by telephone. The source of applications for opt-in registration on the ODR is illustrated in Figure 12.3. This figure shows that 9% of registrations in 2016-2017 arrived by means of registering through a GP, 58% from driving licence applications and reminders through the DVLA and 30% online through the ODT website.

- 119 -
DVLA58%
GP registration9%
Boots2%
Other0%
Paper1%
Online30%
DVLA50%
GP registration14%
Boots3%
Other0%
Paper1%
Online32%
Source of applications for opt-in registration¹ on the NHS Organ Donor Register,
1 April 2015 - 31 March 2017
2015-2016 2016-2017
Figure 12.3
¹ Please note that a back-log of registration activity made via the UK GP Services is not accounted for in these
figures. These registrations will be uploaded in due course and reflected in future reports
At the end of March 2017, 88% of registrants, where the information was available, indicated a willingness to donate all organs and tissue (kidneys, pancreas, heart, lungs, liver and corneas). However, of those who were not willing to donate all organs, the majority (90%) did not wish to donate their corneas. Of the restricted registrations, only 7% (less than 1% of the total register) did not wish to donate their kidneys. Willingness to donate, by organ type, is shown in Table 12.3.
Table 12.3 Preparedness of those opted-in on the NHS Organ Donor Register at 31 March 2017 to donate different organs
1
Registrants prepared to donate all organs 88% Of those not prepared to donate all organs ('restricted donors'):
Not prepared to donate: % of 'Restricted donors' % of all registrants
Kidney 7 0.8 Pancreas 22 2.6 Heart 23 2.7 Lungs 21 2.5 Liver 13 1.5 Corneas 90 10.7 1
This information was not available for approximately 4% of the total register

- 120 -
People of all ages are eligible for organ donor registration: the distribution of age by sex at time of opt-in registration is shown in Figure 12.4. The highest proportion of registrations (21.9% of males and 23.9% of females) are in the 21-30 years age group. The lowest proportions are in the under 11 and 11-15 age groups. Of all people registered on the NHS Organ Donor Register, 46% are male and 54% are female (<1% unknown).
2.5%
19.1%
21.9%
18.4%
14.2%
10.1%
8.8%
3.6%
21.2%
23.9%
14.0%
7.8%
3.2%
1.3%2.1%
1.7%
17.8%
13.7%
2.8%
6.9%
9.8%
2.3%
1.5%
20.2%
23.0%
18.1%
9.9%
0%
5%
10%
15%
20%
25%
30%
<11 11-15 16-20 21-30 31-40 41-50 51-60 61-70 71+
Age group (years)
Male
Female
Total
Figure 12.4 Age and gender of total people registered as opt-in on the NHS Organ Donor
Register by 31 March 2017
Pe
rce
nta
ge
of
pe
op
le r
eg
iste
red
Additionally, the distribution of age of people registering on the opt-in ODR during the latest financial year, 2016-2017, is shown in Figure 12.5. The highest proportion of registrations in this year were in the 21-30 years age group. Of the registrants in 2016-2017, 47% were male and 53% were female.
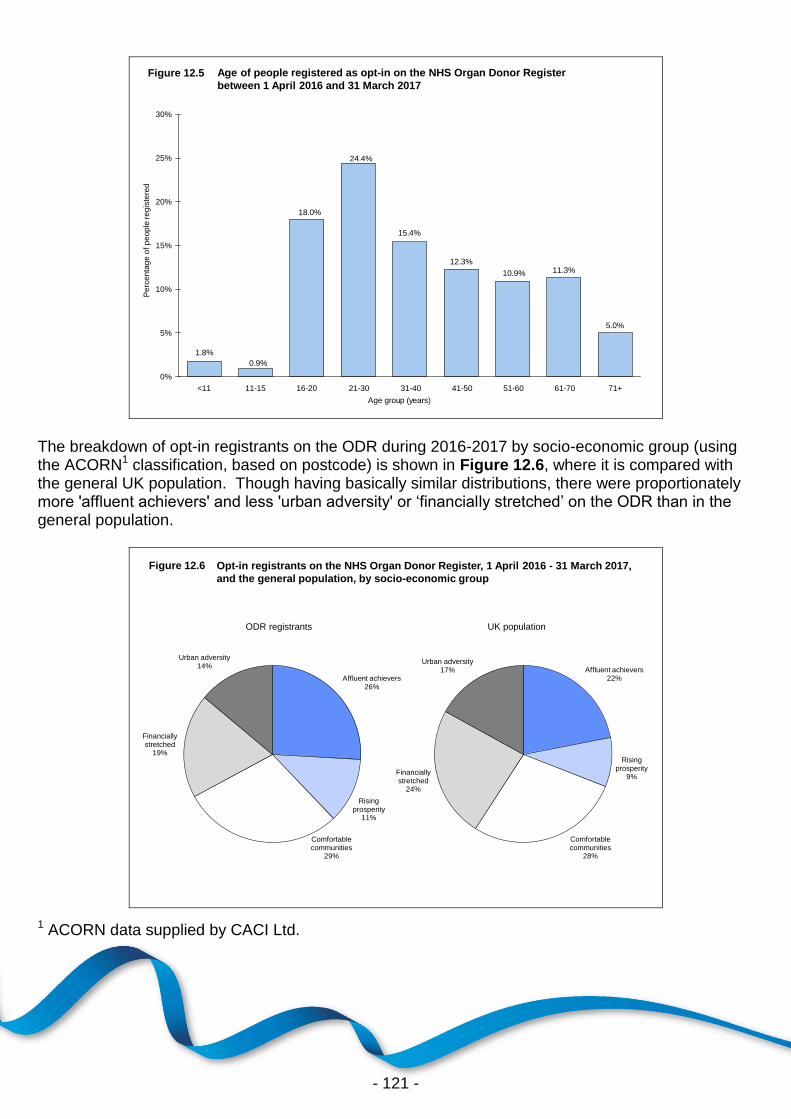
- 121 -
12.3%11.3%
5.0%
1.8%
0.9%
18.0%
24.4%
15.4%
10.9%
0%
5%
10%
15%
20%
25%
30%
<11 11-15 16-20 21-30 31-40 41-50 51-60 61-70 71+
Age group (years)
Figure 12.5 Age of people registered as opt-in on the NHS Organ Donor Register
between 1 April 2016 and 31 March 2017
Pe
rce
nta
ge
of
pe
op
le r
eg
iste
red
The breakdown of opt-in registrants on the ODR during 2016-2017 by socio-economic group (using the ACORN1 classification, based on postcode) is shown in Figure 12.6, where it is compared with the general UK population. Though having basically similar distributions, there were proportionately more 'affluent achievers' and less 'urban adversity' or ‘financially stretched’ on the ODR than in the general population.
Opt-in registrants on the NHS Organ Donor Register, 1 April 2016 - 31 March 2017,
and the general population, by socio-economic group
ODR registrants UK population
Figure 12.6
Affluent achievers26%
Rising prosperity
11%
Comfortable communities
29%
Financially stretched
19%
Urban adversity14%
Affluent achievers22%
Rising prosperity
9%
Comfortable communities
28%
Financially stretched
24%
Urban adversity17%
1 ACORN data supplied by CACI Ltd.

- 122 -
13 National Potential Donor Audit
National Potential
Donor Audit
Key messages
There were 34,369 audited deaths reported through the Potential Donor Audit in the financial year to 31 March 2017, including 1,384 (98%) of the 1,413 deceased organ donors.
Improvements have been observed in the overall referral rate of potential donors
(from 86% to 88%), in the proportion of approaches involving a Specialist Nurse – Organ Donation (from 83% to 86%), and in the overall consent/authorisation rate (from 62% to 63%).
The consent/authorisation rate was 91% when a patient’s decision was known at
the time of potential donation, but 100 families overruled their loved one’s known decision to be an organ donor.
A significant difference is still apparent in the consent/authorisation rates for
white patients and patients from minority ethnic groups (66% and 35%
respectively).

- 123 -
13.1 Introduction
In this chapter, summary data from the National Potential Donor Audit (PDA) are shown for 1 April 2016 to 31 March 2017 and data from the previous three financial years are also provided for comparison purposes. The data comprise all audited patient deaths in UK Intensive Care Units (ICUs) and emergency departments, excluding wards and patients over 80 years of age, in the time period. Paediatric ICU data are included however neonatal ICU data have been excluded. The data are based on information received by 8 May 2017. The number of solid organ donors reported in this chapter will differ from that shown in the rest of the report, due to the national PDA excluding specific patients.
On 1 December 2015, The Human Transplantation (Wales) Act 2013 became operational in Wales, introducing new legislation for a soft opt-out system for organ donation (deemed consent). More information can be found here http://organdonationwales.org/
13.2 Definitions
All data shown in this chapter use the following definitions.
Eligible donors after brain death (DBD) are defined as patients for whom death was confirmed following neurological tests and who had no absolute medical contraindications to solid organ donation.
Eligible donors after circulatory death (DCD) are defined as patients who had treatment withdrawn and death was anticipated within four hours, with no absolute medical contraindications to solid organ donation.
Absolute medical contraindications to organ donation are listed here: http://www.odt.nhs.uk/pdf/contraindications_to_organ_donation.pdf
Imminent death anticipated patients who are not confirmed dead using neurological criteria, receiving assisted ventilation, a clinical decision to withdraw treatment has been made and death is anticipated within four hours. Neurological death suspected patients who meet all of the following criteria: apnoea, coma from known aetiology and unresponsive, ventilated, fixed pupils. Excluding those not tested as cardiac arrest occurred despite resuscitation, brain stem reflexes returned, or neonates less than 2 months post term. The neurological death testing rate is the percentage of patients for whom neurological death was suspected who were tested.
The referral rate is the percentage of patients for whom neurological death was suspected, or imminent death was anticipated, that were discussed with the Specialist Nurse - Organ Donation (SN-OD).
The proportion of approaches involving a SN-OD is the percentage of eligible donor families or appointed/nominated representatives approached where a SN-OD was involved.

- 124 -
Deemed consent applies if a person has not registered an organ donation decision either to opt-in or opt-out or appoint a representative, is aged 18 or over, has lived for longer than 12 months and is ordinarily resident and also died in Wales, and had the capacity to understand the notion of deemed consent for a significant period before their death.
The consent/authorisation rate is the percentage of eligible donor families or appointed/nominated representatives approached for formal organ donation discussion where consent/authorisation was ascertained.
13.3 Breakdown of audited deaths in ICUs and emergency departments
In the 12-month period there were a total of 34,369 audited patient deaths in the UK. Figures 13.1 and 13.2 show a detailed breakdown from the number of audited patient deaths to the number of solid organ donors for potential DBD and DCD donors, respectively. In total there were 1384 solid organ donors reported through the PDA.
Table 13.1 shows the key percentages calculated from the flow chart information. Consent/ authorisation rates have also been provided for cases where the SN-OD was/was not involved in the approach to the family and/or whether the patient's decision to be a donor was known at the time of potential donation. Details of ODR, known decision and deemed consent overrides are included in the footnote of the table.
An ODR override is a case where the family overruled their loved one's known decision to be an organ donor where the decision was recorded on the ODR. This decision was known at the time that the families were approached. Similarly, a known decision override is a case where the family overruled their loved one's known decision to donate and includes decisions registered on the ODR, those expressed via carrying a donor card, verbally, in a will, or via an appointed/nominated representative. Again, the decision was known at the time that the family were approached. A deemed consent override is a case where the family did not support deemed consent.
Figure 13.3 uses the flow chart information to illustrate the stages where opportunities are lost pre-donation. Current practice within DCD donation has led to a significant proportion of DCD patients dropping out of the donation process prior to the approach stage; this is because eligible donors are screened out due to medical unsuitability and therefore families or nominated/appointed representatives are not approached for a formal organ donation discussion.

- 125 -
No Yes No Yes
15,530 18,839 15,530 18,839
No Yes No Yes
17,064 1,775 17,337 1,502
No Yes No Yes
253 1,522 11,133 6,204
No Yes No Yes
20 1,502 682 5,522
No Yes No Yes
1,444 58 4,237 1,285
No Yes No Yes
115 1,329 2,422 1,815
No Yes No Yes
412 917 760 1,055
No Yes No Yes
98 819 490 565
DBD DCD2 DCD
808 11 565
¹ Patients for whom tests were not performed due to; cardiac arrest despite resuscitation occurring, brainstem
reflexes returned, or neonates - less than 2 months post term, are excluded from the calculation of the
neurological death testing rate
Was treatment withdrawn?
What type of donation happened?
Audited Deaths
34,369
Were neurological tests to confirm death
performed? ¹
Was death confirmed using neurological
criteria?
Were there any absolute medical
contraindications to solid organ donation?
Were the family or nominated/appointed
representative formally approached for
formal organ donation discussion?
Was consent/authorisation for solid organ
donation ascertained?
Was the patient ever on mechanical
ventilation?
Figure 13.1 Donation after brain death
Audited Deaths
34,369
Was the patient ever on mechanical
ventilation?
Was death confirmed using neurological
criteria?
Did solid organ donation occur?
Was imminent death anticipated?
Were all criteria for neurological testing
met?
What type of donation happened?
Figure 13.2 Donation after circulatory death
Were there any absolute medical
contraindications to solid organ donation?
Were the family or nominated/appointed
representative formally approached for
formal organ donation discussion?
Was consent/authorisation for solid organ
donation ascertained?
Did solid organ donation occur?

- 126 -
Table 13.1 Summary of key percentages, 1 April 2016 to 31 March 2017
DBD DCD ALL Neurological death testing rate 85.7% Referral rate 97.4% 85.6% 88.2% Proportion of approaches involving a SN-OD 93.0% 80.4% 85.8% Consent/authorisation rate 69.0% 58.1% 62.7% - when SN-OD not involved in approach 38.7% 24.5% 27.5% - when SN-OD involved in approach 71.3% 66.3% 68.6% - when patient had not expressed a wish to donate or the patient's ODR status was not known at the time of potential donation
54.1% 41.5% 46.7%
- when patient’s wish on ODR and known at time of potential donation*
93.7% 88.0% 90.5%
- when patient’s wish (by any method) is known at time of potential donation**
94.0% 89.0% 91.2%
- when SN-OD involved in approach and patient known to be on ODR at time of potential donation
94.3% 91.3% 92.6%
- when deemed consent applied*** 66.7% 57.1% 60.6% *89 families overruled their loved one's known ODR decision to be an organ donor ** 100 families overruled their loved one's known decision (by any method) to be an organ donor *** 13 families did not support deemed consent (of 33 cases where deemed consent applied)
% o
f p
ote
nti
al d
on
ors
0
10
20
30
40
50
60
70
80
90
100
Potentialdonors1
Neurologicaldeath testsperformed(DBD only)
Neurologicaldeath
confirmed(DBD only)
Contraindications Familyapproach
Consent/authorisation
Donation
Figure 13.3 Stages at which potential organ donors lose the opportunity to become actual donors, Figure 13.3 1 April 2016 to 31 March 2017
1 Potential DCD donor - A patient who had treatment withdrawn and death was anticipated within four hours
1 brain stem reflexes returned, and neonates less than 2 months post term
1 Potential DBD donor - A patient who meets all four criteria for neurological death testing excluding those for which cardiac arrest occurred despite resuscitation,
1
DBD, 819 donated (46% of potential donors)DCD, 565 donated (10% of potential donors, 13% of those not contraindicated)
14% 1%4%
8%
31%
11%
23%
57%
42%
46%

- 127 -
13.4 Eligible donors
The number of eligible donors (as defined earlier) and rates per million population (pmp) are shown in Table 13.2, by country/Strategic Health Authority (SHA). The number of actual donors pmp can be found in Table 3.2 of Chapter 3. Eligible DBD ranged from 13.2 pmp in East of England SHA to 35.1 pmp in North East SHA. Eligible DCD ranged from 47.7 pmp in South West SHA to 110.3 pmp in North East SHA. Across the countries, there was a range of 72.8 eligible donors pmp in Scotland to 98.4 eligible donors pmp in Wales. Overall, there were 1,444 eligible DBD (22.1 pmp) and 4,237 eligible DCD (64.8 pmp) in the UK, resulting in a total of 86.9 eligible donors per million population. Tables 13.3 and 13.4 show more detailed information by country/SHA for DBD and DCD data, respectively.
Table 13.2 Eligible donor rates per million population (pmp), in the UK, 1 April 2016 to 31 March 2017, by country and Strategic Health Authority
Eligible DBD Eligible DCD TOTAL Country/ Strategic Health Authority of donation N (pmp) N (pmp) N (pmp)
North East 92 (35.1) 289 (110.3) 381 (145.4) North West 170 (23.7) 657 (91.6) 827 (115.3) Yorkshire and the Humber 105 (19.5) 304 (56.4) 409 (75.9) North of England 367 (24.2) 1250 (82.3) 1617 (106.5)
East Midlands 64 (13.7) 252 (53.8) 316 (67.5) West Midlands 109 (19.0) 397 (69.0) 506 (88.0) East of England 80 (13.2) 429 (70.6) 509 (83.7) Midlands and East 253 (15.3) 1078 (65.3) 1331 (80.6)
London 297 (34.3) 464 (53.5) 761 (87.8)
South East Coast 102 (22.0) 276 (59.6) 378 (81.6) South Central 83 (19.2) 279 (64.6) 362 (83.8) South West 112 (20.5) 261 (47.7) 373 (68.2) South of England 297 (20.6) 816 (56.6) 1113 (77.2)
England 1214 (22.2) 3608 (65.9) 4822 (88.0) Isle of Man 2 (25.0) 2 (25.0) 4 (50.0) Channel Islands 3 (18.8) 4 (25.0) 7 (43.8)
Wales 54 (17.4) 251 (81.0) 305 (98.4)
Scotland 118 (22.0) 273 (50.8) 391 (72.8)
Northern Ireland 53 (28.6) 99 (53.5) 152 (82.2)
TOTAL 1444 (22.1) 4237 (64.8) 5681 (86.9)

- 128 -
Table 13.3 DBD key metrics from the Potential Donor Audit, 1 April 2016 to 31 March 2017, by country and former English Strategic Health Authority
Country/ Strategic Health Authority of donation
Number of patients where neurological
death was suspected
Neurological death testing
rate (%)
DBD referral rate (%)
Number of eligible DBD donors whose
family were approached
Percentage of DBD approaches that
involved a SN-OD (%)
DBD consent/ authorisation rate
(%)
North East 98 95.9 100.0 89 96.6 62.9 North West 228 80.7 98.7 163 98.8 66.9 Yorkshire and the Humber 124 88.7 100.0 96 92.7 66.7 North of England 450 86.2 99.3 348 96.6 65.8
East Midlands 83 78.3 95.2 54 88.9 66.7 West Midlands 150 79.3 93.3 98 89.8 72.4 East of England 108 74.1 97.2 78 91.0 78.2 Midlands and East 341 77.4 95.0 230 90.0 73.0
London 357 90.2 97.2 264 94.7 58.7
South East Coast 130 81.5 96.2 93 86.0 71.0 South Central 101 88.1 99.0 80 91.3 70.0 South West 129 90.7 99.2 99 92.9 77.8 South of England 360 86.7 98.1 272 90.1 73.2
England 1508 85.3 97.5 1114 93.2 67.4 Isle of Man 2 100.0 100.0 2 50.0 100.0 Channel Islands 3 100.0 100.0 3 100.0 100.0
Wales 62 88.7 98.4 50 96.0 78.0
Scotland 136 89.7 93.4 111 90.1 78.4
Northern Ireland 64 84.4 100.0 49 93.9 71.4
TOTAL 1775 85.7 97.4 1329 93.0 69.0

- 129 -
Table 13.4 DCD key metrics from the Potential Donor Audit, 1 April 2016 to 31 March 2017, by country and former English Strategic Health Authority
Country/ Strategic Health Authority of donation
Number of patients for whom imminent death
was anticipated DCD referral
rate (%)
Number of eligible DCD donors whose
family were approached
Percentage of DCD approaches that
involved a SN-OD (%)
DCD consent/ authorisation rate
(%)
North East 384 94.0 83 83.1 63.9 North West 924 84.2 239 85.8 58.2 Yorkshire and the Humber 596 89.4 134 83.6 56.0 North of England 1904 87.8 456 84.6 58.6
East Midlands 335 82.1 125 72.0 53.6 West Midlands 550 80.5 173 73.4 53.2 East of England 632 83.5 185 80.5 60.5 Midlands and East 1517 82.1 483 75.8 56.1
London 727 88.9 215 86.5 58.1
South East Coast 404 89.1 119 85.7 72.3 South Central 386 81.9 124 75.8 54.8 South West 379 90.2 127 84.3 63.0 South of England 1169 87.1 370 81.9 63.2
England 5317 86.2 1524 81.4 58.9 Isle of Man 5 100.0 1 100.0 100.0 Channel Islands 7 71.4 3 100.0 66.7
Wales 357 87.4 91 83.5 56.0
Scotland 313 81.2 158 66.5 52.5
Northern Ireland 205 73.2 38 89.5 55.3
TOTAL 6204 85.6 1815 80.4 58.1
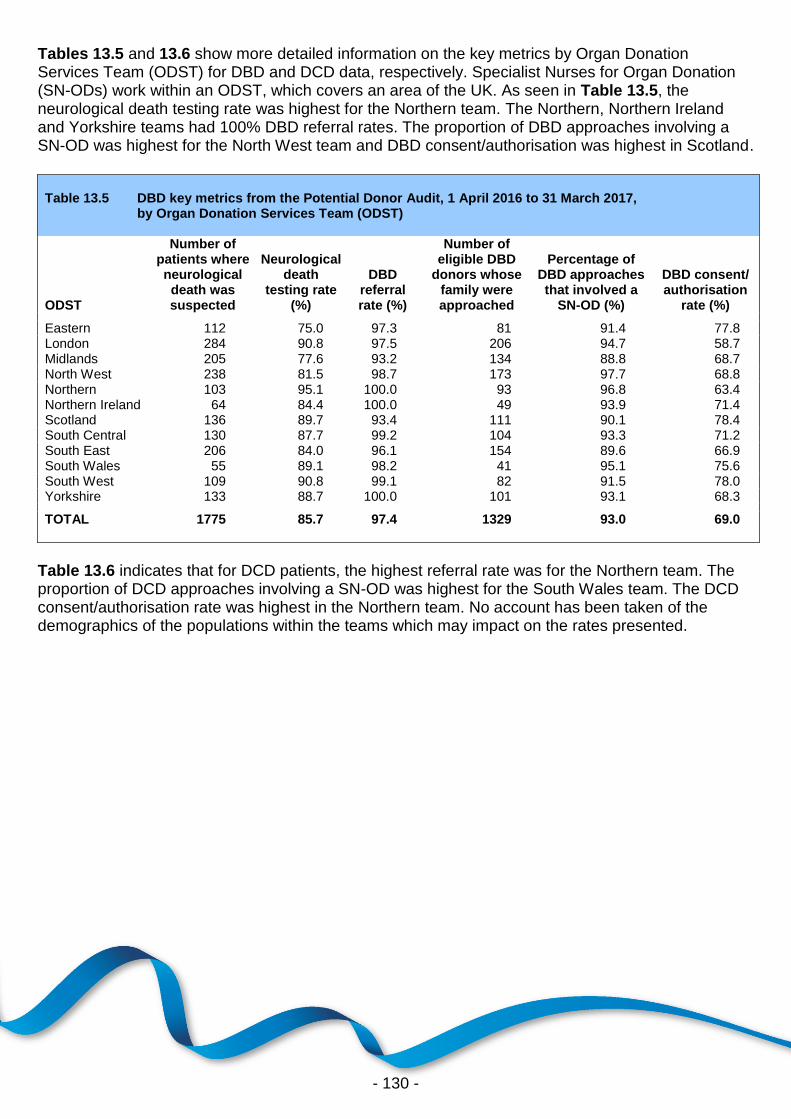
- 130 -
Tables 13.5 and 13.6 show more detailed information on the key metrics by Organ Donation Services Team (ODST) for DBD and DCD data, respectively. Specialist Nurses for Organ Donation (SN-ODs) work within an ODST, which covers an area of the UK. As seen in Table 13.5, the neurological death testing rate was highest for the Northern team. The Northern, Northern Ireland and Yorkshire teams had 100% DBD referral rates. The proportion of DBD approaches involving a SN-OD was highest for the North West team and DBD consent/authorisation was highest in Scotland.
Table 13.6 indicates that for DCD patients, the highest referral rate was for the Northern team. The proportion of DCD approaches involving a SN-OD was highest for the South Wales team. The DCD consent/authorisation rate was highest in the Northern team. No account has been taken of the demographics of the populations within the teams which may impact on the rates presented.
Table 13.5 DBD key metrics from the Potential Donor Audit, 1 April 2016 to 31 March 2017, by Organ Donation Services Team (ODST)
ODST
Number of patients where neurological death was suspected
Neurological death
testing rate (%)
DBD referral rate (%)
Number of eligible DBD
donors whose family were approached
Percentage of DBD approaches that involved a
SN-OD (%)
DBD consent/ authorisation
rate (%)
Eastern 112 75.0 97.3 81 91.4 77.8 London 284 90.8 97.5 206 94.7 58.7 Midlands 205 77.6 93.2 134 88.8 68.7 North West 238 81.5 98.7 173 97.7 68.8 Northern 103 95.1 100.0 93 96.8 63.4 Northern Ireland 64 84.4 100.0 49 93.9 71.4 Scotland 136 89.7 93.4 111 90.1 78.4 South Central 130 87.7 99.2 104 93.3 71.2 South East 206 84.0 96.1 154 89.6 66.9 South Wales 55 89.1 98.2 41 95.1 75.6 South West 109 90.8 99.1 82 91.5 78.0 Yorkshire 133 88.7 100.0 101 93.1 68.3
TOTAL 1775 85.7 97.4 1329 93.0 69.0
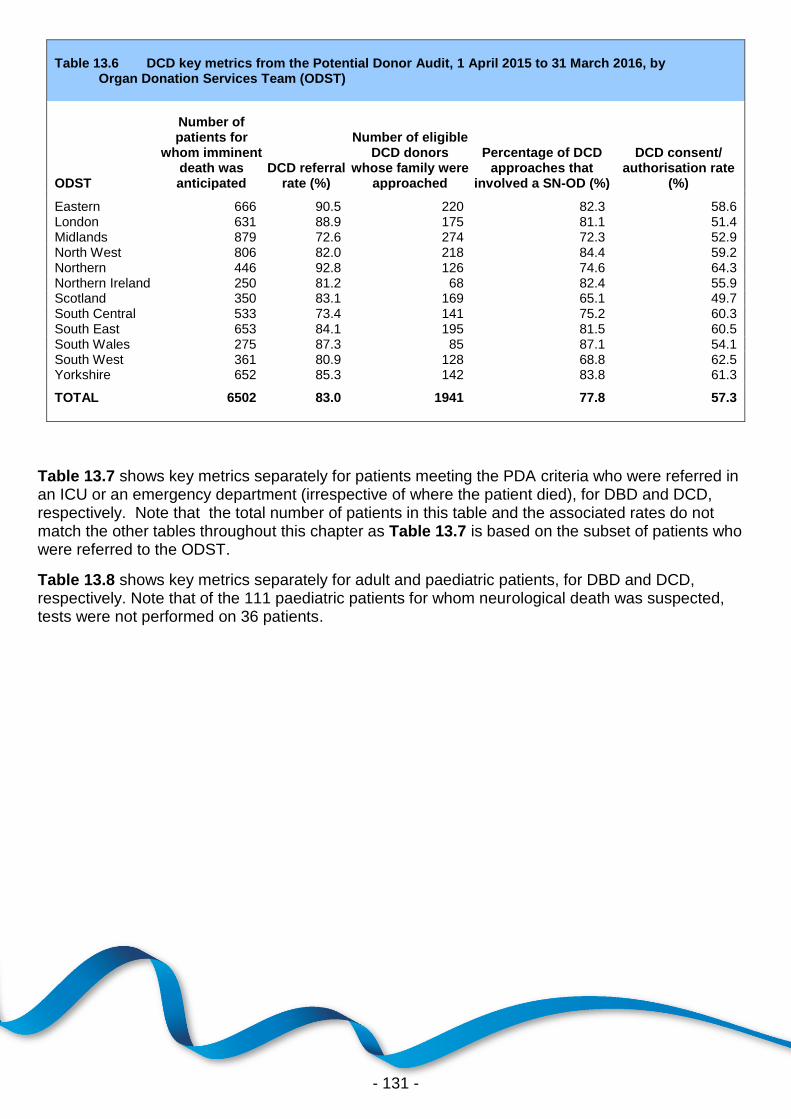
- 131 -
Table 13.7 shows key metrics separately for patients meeting the PDA criteria who were referred in an ICU or an emergency department (irrespective of where the patient died), for DBD and DCD, respectively. Note that the total number of patients in this table and the associated rates do not match the other tables throughout this chapter as Table 13.7 is based on the subset of patients who were referred to the ODST.
Table 13.8 shows key metrics separately for adult and paediatric patients, for DBD and DCD, respectively. Note that of the 111 paediatric patients for whom neurological death was suspected, tests were not performed on 36 patients.
Table 13.6 DCD key metrics from the Potential Donor Audit, 1 April 2015 to 31 March 2016, by Organ Donation Services Team (ODST)
ODST
Number of patients for
whom imminent death was anticipated
DCD referral rate (%)
Number of eligible DCD donors
whose family were approached
Percentage of DCD approaches that
involved a SN-OD (%)
DCD consent/ authorisation rate
(%)
Eastern 666 90.5 220 82.3 58.6 London 631 88.9 175 81.1 51.4 Midlands 879 72.6 274 72.3 52.9 North West 806 82.0 218 84.4 59.2 Northern 446 92.8 126 74.6 64.3 Northern Ireland 250 81.2 68 82.4 55.9 Scotland 350 83.1 169 65.1 49.7 South Central 533 73.4 141 75.2 60.3 South East 653 84.1 195 81.5 60.5 South Wales 275 87.3 85 87.1 54.1 South West 361 80.9 128 68.8 62.5 Yorkshire 652 85.3 142 83.8 61.3
TOTAL 6502 83.0 1941 77.8 57.3

- 132 -
Table 13.8 DBD and DCD key metrics from the Potential Donor Audit, 1 April 2016 to 31 March 2017, by age group
Eligible donor type Age group
Number of patients who met referral
criteria1
Neurological death testing
rate (%) Referral rate (%)
Number of eligible donors whose family
were approached
Percentage of approaches
involving a SN-OD (%)
Consent/ authorisation
rate (%)
Number of actual
donors2
DBD Adult (>=18) 1664 86.7 97.9 1266 93.6 69.2 782 Paediatric (<18) 111 72.1 89.2 63 81.0 65.1 37 TOTAL 1775 85.7 97.4 1329 93.0 69.0 819
DCD Adult (>=18) 5990 85.9 1747 80.9 59.3 553 Paediatric (<18) 214 75.7 68 67.6 27.9 12 TOTAL 6204 85.6 1815 80.4 58.1 565
1 DBD referral criteria: patients where neurological death was suspected; DCD referral criteria: patients for whom imminent death was anticipated
2 Actual donors resulting from eligible DBD donors includes 2 DCD donors under 18 and 9 DCD donors aged 18 and over
Table 13.7 DBD and DCD key metrics from the Potential Donor Audit, 1 April 2016 to 31 March 2017, by unit where patient referred from, for patients who met the PDA criteria and were referred
Eligible donor type
Unit where patient was referred from
Number of patients who were referred
1
Neurological death testing
rate (%)
Number of eligible donors whose family
were approached
Percentage of approaches involving a
SN-OD (%)
Consent/ authorisation rate
(%)
Number of actual
donors2
DBD Critical care 1566 87.8 1202 92.9 68.1 732 Emergency dept. 162 83.3 125 95.2 78.4 87 TOTAL 1728 87.4 1327 93.1 69.1 819
DCD Critical care 5011 1619 82.2 59.4 513 Emergency dept. 297 157 82.2 59.9 52 TOTAL 5308 1776 82.2 59.4 565
1 DBD referral criteria: patients where neurological death was suspected; DCD referral criteria: patients for whom imminent death was anticipated
2 Actual donors resulting from eligible DBD donors includes 11 DCD donors referred from critical care and 0 DCD donors referred from emergency departments

- 133 -
13.5 Consent/ authorisation rates The overall DBD consent/authorisation rate was 69% and the 95% confidence limits for this percentage are 67% - 72%. For DCD, the overall rate was 58% and the 95% confidence limits are 56% - 60%.
Consent/authorisation rates by country/Strategic Health Authority are illustrated in Figure 13.4 and by Organ Donation Services Team in Figure 13.5 for both DBD and DCD. Caution should be applied when interpreting these consent/authorisation rates as no adjustment has been made for the mix of patients in terms of age, sex and ethnicity.
Across the countries and SHAs, the DBD consent/authorisation rates range from 59% in London to 78% in several areas. DCD consent/authorisation rates range from 53% in Scotland and the West Midlands to 72% in South East Coast.
The overall consent/authorisation rates (combining DBD and DCD) for England, Wales, Scotland and Northern Ireland were 63%, 64%, 63% and 64%, respectively.
DBD
Consent/authorisation rates
40 - <45%
45 - <50%
50 - <55%
55 - <60%
60 - <65%
65 - <70%
70 - <75%
>=75%
DCD
71%
63%
67%
67%
67%
72% 78%
59%
71%
70%
78%
78%
78%
55%
64%
58%
56%
54%
53% 61%
58%
72%
55%
63%
53%
56%
Figure 13.4 Consent/authorisation rates by English SHA/country

- 134 -
Across the Organ Donation Services Teams, the DBD consent/authorisation rates range from 59% in the London team to 78% in the Eastern, Scotland, and South West teams. DCD consent/authorisation rates range from 52% in the Midlands team to 71% in the South East team.
DBD
Consent/authorisation rates
40 - <45%
45 - <50%
50 - <55%
55 - <60%
60 - <65%
65 - <70%
70 - <75%
>=75%
DCD
78%
59%
69%
69%
63% 71%
78%
71% 67%
76%
78%
68%
59%
55%
52%
60%
60% 55%
53%
59% 71%
54%
61%
58%
Figure 13.5 Consent/authorisation rates by Organ Donation Services Team

- 135 -
Table 13.9 shows the consent/authorisation rate separately for white patients and patients from ethnic minority groups. The DBD consent/authorisation rates for white patients and patients from ethnic minority groups were 74% and 34%, respectively. A smaller, but still significant, difference was observed for DCD consent/authorisation rates: 61% and 37%, respectively. Note that there were an additional 35 DBD and 67 DCD families approached where the ethnicity was not known or not reported.
The Northern, Scotland, South Wales and South West teams each accounted for only 1-2% of families from ethnic minority groups approached for a formal organ donation discussion, with Northern Ireland at less than 1%, whereas London accounted for 37%. Most teams had a very small proportion, therefore accounting for some of the variation observed in overall consent/authorisation rates between teams. Note that consent/authorisation rates have not been provided where the number of families approached is less than ten.
Table 13.9 DBD and DCD consent/authorisation rates from the Potential Donor Audit, 1 April 2016 to 31 March 2017, by Organ Donation Services Team (ODST) and ethnicity
White eligible donors Eligible donors from ethnic minority groups All
ODST
Number of eligible DBD
donors whose family
were approached
DBD consent/
authorisation rate (%)
Number of eligible DCD
donors whose family
were approached
DCD consent/
authorisation rate (%)
Overall consent/
authorisation rate (%)
Number of eligible DBD
donors whose family
were approached
DBD consent/
authorisation rate (%)
Number of eligible DCD
donors whose family
were approached
DCD consent/
authorisation rate (%)
Overall consent/
authorisation rate (%)
Overall consent/
authorisation rate (%)
1
Eastern 73 83.6 177 62.7 68.8 6 16.7 6 16.7 16.7 64.8 London 135 71.9 122 59.0 65.8 70 32.9 40 47.5 38.2 57.0 Midlands 103 76.7 244 54.5 61.1 27 37.0 20 25.0 31.9 57.3 North West 148 73.6 226 60.6 65.8 22 36.4 5 40.0 37.0 63.7 Northern 88 62.5 89 64.0 63.3 3 66.7 3 33.3 50.0 61.9 Northern Ireland 47 70.2 37 56.8 64.3 0 1 0.0 0.0 64.4 Scotland 101 77.2 151 53.6 63.1 1 0.0 3 33.3 25.0 63.2 South Central 91 74.7 130 62.3 67.4 12 41.7 10 40.0 40.9 64.1 South East 119 73.1 153 73.9 73.5 32 40.6 13 30.8 37.8 69.2 South Wales 39 76.9 68 58.8 65.4 0 3 66.7 66.7 61.5 South West 77 80.5 105 61.0 69.2 2 0.0 1 100.0 33.3 68.0 Yorkshire 86 75.6 134 59.7 65.9 12 16.7 7 14.3 15.8 62.2
TOTAL 1107 74.4 1636 60.5 66.1 187 34.2 112 36.6 35.1 62.7 1 Includes 102 families approached where the ethnicity was not known or not reported

- 136 -
Table 13.10 shows the reasons why the family did not give consent/authorisation, by donor type. The most common reason reported for why the families of both eligible DBD and DCD families did not give consent/authorisation was that the patient had previously expressed a wish not to donate. Overall, this reason was reported in 21% of cases
Table 13.10 Reasons why the family did not support organ donation, 1 April 2016 to 31 March 2017, by donor type
Primary reason why family did not support organ donation
Donor type Total
DBD DCD
N % N % N %
Patient previously expressed a wish not to donate 83 20.2 162 21.3 245 20.9
Family were not sure whether the patient would have agreed to donation 63 15.3 114 15.0 177 15.1
Family did not believe in donation 20 4.9 23 3.0 43 3.7
Family felt it was against their religious/cultural beliefs 45 10.9 21 2.8 66 5.6
Family were divided over the decision 25 6.1 32 4.2 57 4.9
Family felt the patient had suffered enough 21 5.1 59 7.8 80 6.8
Family did not want surgery to the body 53 12.9 65 8.6 118 10.1
Family wanted to stay with the patient after death 2 0.5 11 1.5 13 1.1
Family had difficulty understanding/accepting neurological testing 3 0.7 2 0.3 5 0.4
Family felt the length of time for donation process was too long 19 4.6 125 16.5 144 12.3
Family concerned that other people may disapprove/be offended 1 0.2 . . 1 0.1
Family felt the body needs to be buried whole (unrelated to religious or cultural reasons) 21 5.1 23 3.0 44 3.8
Family concerned that organs may not be transplanted 4 1.0 8 1.1 12 1.0
Families concerned about organ allocation . . 2 0.3 2 0.2
Strong refusal - probing not appropriate 27 6.6 39 5.1 66 5.6
Other 25 6.1 74 9.7 99 8.5
TOTAL 412 100 760 100 1172 100

- 137 -
13.6 Specialist Nurse - Organ Donation (SN-OD) involvement
Table 13.11 shows the proportion of family approaches that involved a SN-OD, for DBD and DCD separately, and overall. Nationally, 93% of DBD and 80% of DCD family approaches involved a SN-OD, but there is wide variation between teams.
Table 13.11 Percentage of family approaches involving a Specialist Nurse - Organ Donation (SN-OD) from the Potential Donor Audit, 1 April 2016 to 31 March 2017, by Organ Donation Services Team (ODST)
ODST
Number of eligible DBD
donors whose family were approached
Number of eligible DBD
donors where SN-OD
involved in approach
Percentage of DBD
approaches that involved a
SN-OD (%)
Number of eligible DCD
donors whose family were approached
Number of eligible DCD
donors where SN-OD
involved in approach
Percentage of DCD
approaches that involved a
SN-OD (%)
Overall percentage of
DBD/DCD approaches
that involved a SN-OD (%)
Eastern 81 74 91.4 192 154 80.2 83.5 London 206 195 94.7 166 141 84.9 90.3 Midlands 134 119 88.8 271 193 71.2 77.0 North West 173 169 97.7 238 213 89.5 92.9 Northern 93 90 96.8 96 73 76.0 86.2 Northern Ireland 49 46 93.9 38 34 89.5 92.0 Scotland 111 100 90.1 158 105 66.5 76.2 South Central 104 97 93.3 144 113 78.5 84.7 South East 154 138 89.6 171 150 87.7 88.6 South Wales 41 39 95.1 81 66 81.5 86.1 South West 82 75 91.5 115 96 83.5 86.8 Yorkshire 101 94 93.1 145 122 84.1 87.8
TOTAL 1329 1236 93.0 1815 1460 80.4 85.8

- 138 -
Table 13.12 shows the effect on the consent/authorisation rate when a SN-OD is involved or not involved in the approach to a family for a formal organ donation discussion. Evidence shows that the family is more likely to support organ donation when a trained SN-OD is involved in the approach and this is particularly apparent for eligible DCD donors. Again, there is wide variation between teams. Caution should be applied when interpreting these rates as no account has been taken of approaches initiated by the family, ODR status or ethnicity.
Table 13.12 DBD and DCD consent/authorisation rates with/without SN-OD involvement from the Potential Donor Audit, 1 April 2016 to 31 March 2017, by Organ Donation Services Team (ODST)
SN-OD involved in approach SN-OD not involved in approach All
ODST
Number of eligible DBD
donors whose family
were approached
DBD consent/
authorisation rate (%)
Number of eligible DCD
donors whose family
were approached
DCD consent/
authorisation rate (%)
Overall consent/
authorisation rate (%)
Number of eligible DBD
donors whose family
were approached
DBD consent/
authorisation rate (%)
Number of eligible DCD
donors whose family
were approached
DCD consent/
authorisation rate (%)
Overall consent/
authorisation rate (%)
Overall consent/
authorisation rate (%)
Eastern 74 81.1 154 67.5 71.9 7 42.9 38 26.3 28.9 64.8 London 195 60.0 141 61.7 60.7 11 36.4 25 16.0 22.2 57.0 Midlands 119 69.7 193 57.0 61.9 15 60.0 78 38.5 41.9 57.3 North West 169 69.8 213 67.1 68.3 4 25.0 25 0.0 3.4 63.7 Northern 90 65.6 73 69.9 67.5 3 0.0 23 30.4 26.9 61.9 Northern Ireland 46 76.1 34 61.8 70.0 3 0.0 4 0.0 0.0 64.4 Scotland 100 86.0 105 73.3 79.5 11 9.1 53 11.3 10.9 63.2 South Central 97 75.3 113 71.7 73.3 7 14.3 31 12.9 13.2 64.1 South East 138 67.4 150 72.7 70.1 16 62.5 21 61.9 62.2 69.2 South Wales 39 76.9 66 63.6 68.6 2 50.0 15 13.3 17.6 61.5 South West 75 81.3 96 66.7 73.1 7 42.9 19 31.6 34.6 68.0 Yorkshire 94 70.2 122 64.8 67.1 7 42.9 23 21.7 26.7 62.2
TOTAL 1236 71.3 1460 66.3 68.6 93 38.7 355 24.5 27.5 62.7

- 139 -
13.7 Comparison with previous years Table 13.13 and Figure 13.6 show the key metrics from the PDA for the last four financial years.
Table 13.13 DBD and DCD key metrics from the Potential Donor Audit, by financial year
Eligible donor type
Financial year
Number of patients who met referral criteria
1
Neurological death testing
rate (%) Referral rate (%)
Number of eligible donors whose
family were approached
Proportion of family approaches
involving a SN-OD (%)
Number of families who consented to/
authorised donation
Consent/ authorisation rate
(%)
Number of actual
donors 2
DBD 2013-2014 1717 82.9 95.4 1258 84.4 857 68.1 788 2014-2015 1734 83.3 96.4 1284 86.7 859 66.9 780 2015-2016 1747 84.5 96.4 1296 91.0 891 68.8 786 2016-2017 1775 85.7 97.4 1329 93.0 917 69.0 819
DCD 2013-2014 7201 70.9 1992 71.4 1073 53.9 522 2014-2015 6761 76.3 2019 72.3 1046 51.8 492 2015-2016 6500 83.1 1942 77.8 1113 57.3 564 2016-2017 6204 85.6 1815 80.4 1055 58.1 565
TOTAL 2013-2014 8918 75.7 3250 76.4 1930 59.4 1310 2014-2015 8495 80.4 3303 77.9 1905 57.7 1272 2015-2016 8247 85.9 3238 83.1 2004 61.9 1350 2016-2017 7979 88.2 3144 85.8 1972 62.7 1384
1 DBD referral criteria: patients where neurological death was suspected (excluding those for which cardiac arrest occurred despite resuscitation, brain stem
reflexes returned, and neonates less than 2 months post term; DCD referral criteria: patients for whom imminent death was anticipated 2 Actual donors resulting from eligible DBD donors includes 15 DCD donors in 2013-2014, 13 DCD donors in 2014-2015, 7 DCD donors in 2015-2016 and 11
DCD donors in 2016-2017

- 140 -
An increase has been observed in the neurological death testing rate, but 14% of patients who met the criteria were not tested in 2016-2017. Details, such as the reasons for not testing, can be found in the accompanying PDA Annual Report available at http://www.odt.nhs.uk/odt/potential-donor-audit/. Increases have been observed in the rates of referral to the SN-ODs, especially for DCD. Increases have also been observed in the proportion of approaches involving a SN-OD for both DBD and DCD as well as the DCD consent/authorisation rate.
2013/14 2014/15 2015/16 2016/17
Financial year
40
50
60
70
80
90
100
Rate
(%
)
DCD Consent/Authorisation rate
DCD SN-OD involvement
DCD Referral
DBD Consent/Authorisation rate
DBD SN-OD involvement
DBD Referral
DBD Testing
Figure 13.6 DBD and DCD key metrics from the Potential Donor Audit
13.8 Consented/authorised cases not proceeding to solid organ donation
Consent/authorisation for donation was ascertained for 917 eligible DBD donors and 1,055 eligible DCD donors; 819 (89%) and 565 (54%) of these cases proceeded to donate at least one solid organ, respectively. Table 13.14 shows the reasons why donation did not proceed for the 98 eligible DBD and 490 eligible DCD cases where consent/authorisation was ascertained. The main reason reported for consented/authorised eligible DBD donors not proceeding to donate was that the organs were deemed to be medically unsuitable by transplant centres. The main reason for consented/authorised DCD donors was prolonged time to asystole, meaning that the donor did not die in a timeframe suitable for organ donation.

- 141 -
Table 13.14 Reasons why consented/authorised eligible donors did not proceed to donate, 1 April 2016 to 31 March 2017, by donor type
Primary reason why donation did not proceed
Donor type TOTAL
DBD DCD
N % N % N %
Family changed mind 10 10.2 18 3.7 28 4.8
Coroner/Procurator Fiscal refusal 10 10.2 24 4.9 34 5.8
Organs deemed medically unsuitable by recipient centres 40 40.8 141 28.8 181 30.8
Organs deemed medically unsuitable on surgical inspection 6 6.1 12 2.5 18 3.1
Prolonged time to asystole 0 0 222 45.3 222 37.8
Cardiac Arrest 10 10.2 7 1.4 17 2.9
General instability 9 9.2 26 5.3 35 6.0
Logistic reasons 0 0 2 0.4 2 0.3
Positive virology 6 6.1 5 1.0 11 1.9
Other 7 7.1 33 6.7 40 6.8
TOTAL 98 100.0 490 100.0 588 100.0

- 142 -
14 Appendices
Appendices

- 143 -
Appendix I provides details of the 1413 deceased solid organ donors reported in 2016-2017. Details are given for each donating hospital and the hospitals have been grouped by former English Strategic Health Authority and country. The number of donors by donor country/ former Strategic Health Authority of residence is given for donors after brain death in Appendix IIA and donors after circulatory death in Appendix IIB. The populations used for country/ former Strategic Health Authority per million population are given in Appendix III these populations are mid-2015 estimates based on ONS 2011 Census figures. Appendix IV shows the import and export of organs to and from the UK in the last three financial years. Appendix IVA shows the number and type of transplants in the UK into non-UK residents. Appendix IVB and Appendix IVC show the number and type of transplants resulting from the import to and export from the UK, respectively. When organs are donated from deceased donors and cannot be used in that country, the organs are offered for use in other countries. This is usually because there is no suitable recipient because of blood group or size. The current EU Directive ensures that all organs that are imported into the UK are evaluated to the same high standards as in the UK. The UK has special arrangements with the Republic of Ireland so that some patients from Ireland will come to the UK for the transplant procedure where units in the UK have particular expertise. For those with fulminant hepatic failure, the UK and Ireland will also share livers. International sharing of organs represents a very small proportion of the UK transplant activity and is set up to ensure that all donated organs are used whenever appropriate.

- 144 -
Appendix I Deceased solid organ donors and donated organs in the UK, 1 April 2016 – 31 March 2017 (2015-2016), by donating hospital
Donating hospital DBD DCD All donors Multi-organ donor
Kidney Heart Lung Liver Pancreas Bowel
East Midlands Boston, Pilgrim Hospital 2 (3) 0 (0) 2 (3) 1 (3) 2 1 0 2 1 0 Chesterfield, Chesterfield Royal Hospital 1 (0) 2 (0) 3 (0) 1 (0) 6 0 0 1 0 0 Derby, Royal Derby Hospital 2 (1) 1 (10) 3 (11) 1 (6) 6 0 0 1 0 0 Grantham, Grantham And District Hospital 0 (1) 0 (0) 0 (1) 0 (1) 0 0 0 0 0 0 Kettering, Kettering General Hospital 1 (10) 0 (0) 1 (10) 1 (9) 2 0 0 1 1 0 Leicester, Glenfield General Hospital 1 (0) 1 (1) 2 (1) 1 (1) 4 0 0 1 0 0 Leicester, Leicester Royal Infirmary 5 (6) 3 (3) 8 (9) 5 (8) 12 0 2 6 3 1 Lincoln, Lincoln County Hospital 2 (0) 3 (1) 5 (1) 4 (0) 10 0 0 4 0 0 Northampton, Northampton General Hospital 3 (2) 4 (3) 7 (5) 2 (4) 13 1 0 2 1 0 Nottingham, Nottingham City Hospital 1 (1) 5 (0) 6 (1) 3 (1) 12 0 0 3 1 0 Nottingham, Nottingham University Hospital 11 (14) 9 (17) 20 (31) 18 (23) 40 6 10 18 10 1 Sutton-In-Ashfield, King's Mill Hospital 2 (0) 3 (1) 5 (1) 3 (1) 10 1 2 3 2 0 Total 31 (38) 31 (36) 62 (74) 40 (57) 117 9 14 42 19 2
East of England Basildon, Basildon Hospital 2 (4) 4 (2) 6 (6) 3 (4) 12 0 0 3 1 0 Bedford, Bedford Hospital 1 (0) 4 (2) 5 (2) 5 (2) 10 1 0 4 2 0 Bury St Edmunds, West Suffolk Hospital 2 (1) 0 (2) 2 (3) 2 (1) 4 0 0 2 0 0 Cambridge, Addenbrooke's Hospital 17 (16) 21 (32) 38 (48) 31 (35) 76 5 4 29 15 0 Chelmsford, Broomfield Hospital 2 (4) 0 (1) 2 (5) 2 (3) 4 0 0 2 1 0 Colchester, Colchester General Hospital 3 (1) 4 (3) 7 (4) 7 (3) 14 0 4 7 1 0 Great Yarmouth, James Paget Hospital 1 (0) 6 (6) 7 (6) 2 (2) 12 1 0 2 1 0 Harlow, Princess Alexandra Hospital 0 (1) 0 (0) 0 (1) 0 (1) 0 0 0 0 0 0 Huntingdon, Hinchingbrooke Hospital 1 (1) 2 (1) 3 (2) 3 (1) 6 0 0 2 2 0 Ipswich, Ipswich Hospital 4 (1) 3 (4) 7 (5) 6 (2) 14 0 2 6 2 0 Kings Lynn, The Queen Elizabeth Hospital 1 (1) 1 (3) 2 (4) 2 (2) 4 0 0 1 1 0 Luton, Luton And Dunstable Hospital 4 (4) 5 (1) 9 (5) 7 (5) 18 2 2 7 2 0 Norwich, Norfolk And Norwich University Hospital 6 (9) 9 (10) 15 (19) 9 (17) 30 0 2 8 3 0 Papworth, Papworth Hospital 0 (0) 0 (3) 0 (3) 0 (1) 0 0 0 0 0 0 Peterborough, Peterborough City Hospital 2 (0) 3 (2) 5 (2) 4 (1) 10 0 0 4 1 0 Stevenage, Lister Hospital 4 (2) 9 (5) 13 (7) 6 (4) 22 1 6 8 2 0 Watford, Watford General Hospital 2 (4) 3 (2) 5 (6) 5 (4) 10 0 4 5 1 0 Westcliff On Sea, Southend Hospital 4 (3) 0 (0) 4 (3) 4 (2) 8 1 0 4 2 0 Total 56 (52) 74 (79) 130 (131) 98 (90) 254 11 24 94 37 0

- 145 -
Appendix I Deceased solid organ donors and donated organs in the UK, 1 April 2016 – 31 March 2017 (2015-2016), by donating hospital
Donating hospital DBD DCD All donors Multi-organ donor
Kidney Heart Lung Liver Pancreas Bowel
London Barnet, Barnet General Hospital 1 (3) 0 (0) 1 (3) 1 (3) 2 0 0 1 1 0 Carshalton, St Helier Hospital 4 (0) 1 (0) 5 (0) 3 (0) 8 0 0 4 1 0 Chelsea, Chelsea And Westminster Hospital 1 (0) 0 (0) 1 (0) 0 (0) 2 0 0 0 0 0 Croydon, Mayday University Hospital 4 (0) 0 (2) 4 (2) 3 (1) 6 1 2 4 1 0 Evelina Childrens Hospital 1 (0) 0 (0) 1 (0) 1 (0) 2 0 0 1 1 0 Harefield, Harefield Hospital 4 (3) 4 (3) 8 (6) 4 (2) 14 0 2 4 1 0 Harrow, Northwick Park Hospital 2 (4) 2 (2) 4 (6) 3 (4) 8 1 0 3 2 0 Ilford, King George Hospital 2 (0) 0 (0) 2 (0) 0 (0) 2 0 0 1 0 0 Isleworth, West Middlesex University Hospital 5 (1) 0 (0) 5 (1) 4 (1) 8 2 1 5 3 0 Kingston, Kingston Hospital 1 (0) 4 (1) 5 (1) 4 (0) 10 1 0 4 1 0 London, Central Middlesex Hospital 0 (0) 0 (1) 0 (1) 0 (0) 0 0 0 0 0 0 London, Charing Cross Hospital 10 (6) 3 (2) 13 (8) 10 (6) 22 3 7 12 6 0 London, Great Ormond Street Hospital For Children 1 (0) 0 (1) 1 (1) 0 (0) 0 1 0 0 0 0 London, Hammersmith Hospital 1 (1) 1 (2) 2 (3) 2 (3) 4 0 0 2 1 0 London, Homerton Hospital 0 (1) 0 (1) 0 (2) 0 (1) 0 0 0 0 0 0 London, King's College Hospital 21 (16) 11 (8) 32 (24) 27 (20) 62 6 10 27 12 0 London, National Hospital For Neurology And Neurosurgery 6 (17) 2 (0) 8 (17) 6 (17) 16 1 2 6 2 0 London, Newham General Hospital 1 (1) 0 (0) 1 (1) 1 (1) 2 0 0 1 0 0 London, North Middlesex Hospital 1 (2) 0 (1) 1 (3) 1 (3) 2 1 2 1 0 0 London, Queen Elizabeth Hospital 2 (1) 1 (2) 3 (3) 3 (2) 6 0 0 3 0 0 London, Royal Brompton Hospital 0 (0) 1 (1) 1 (1) 1 (1) 2 0 0 1 0 0 London, Royal Free Hospital 5 (2) 1 (0) 6 (2) 6 (2) 12 1 2 6 1 0 London, St Bartholomew's Hospital 0 (3) 3 (2) 3 (5) 2 (2) 6 0 0 2 0 0 London, St George's Hospital 17 (37) 12 (12) 29 (49) 23 (38) 56 5 10 24 9 1 London, St Mary's Hospital 7 (3) 6 (7) 13 (10) 10 (5) 26 3 6 8 5 1 London, St Thomas' Hospital 1 (5) 2 (4) 3 (9) 2 (7) 6 2 0 2 1 0 London, The Harley Street Clinic 1 (0) 0 (0) 1 (0) 1 (0) 2 0 2 1 0 0 London, The Royal London Hospital (Whitechapel) 17 (20) 4 (6) 21 (26) 17 (22) 34 7 8 19 9 0 London, The Whittington Hospital 2 (0) 0 (1) 2 (1) 0 (0) 2 0 0 1 0 0 London, University College Hospital 3 (3) 0 (0) 3 (3) 2 (2) 6 1 2 2 1 0 London, University Hospital Lewisham 1 (1) 1 (0) 2 (1) 2 (0) 4 0 2 2 1 0 London, Whipps Cross Hospital 1 (1) 1 (0) 2 (1) 1 (1) 2 0 0 2 0 0 Orpington, Princess Royal University Hospital 2 (6) 2 (1) 4 (7) 3 (4) 8 0 0 3 0 0 Romford, Queens Hospital 14 (8) 5 (4) 19 (12) 16 (10) 36 5 3 17 9 0 Southall, Ealing Hospital 1 (1) 1 (0) 2 (1) 1 (1) 4 1 0 1 1 0 Uxbridge, Hillingdon Hospital 0 (1) 1 (2) 1 (3) 0 (3) 2 0 0 0 0 0 Total 140 (147) 69 (66) 209 (213) 160 (162) 384 42 61 170 69 2

- 146 -
Appendix I Deceased solid organ donors and donated organs in the UK, 1 April 2016 – 31 March 2017 (2015-2016), by donating hospital
Donating hospital DBD DCD All donors Multi-organ donor
Kidney Heart Lung Liver Pancreas Bowel
North East Darlington, Darlington Memorial Hospital 3 (1) 1 (1) 4 (2) 3 (2) 6 0 0 4 2 0 Durham, University Hospital Of North Durham 4 (1) 2 (2) 6 (3) 5 (3) 9 1 2 6 3 0 Gateshead, Queen Elizabeth Hospital 0 (1) 0 (3) 0 (4) 0 (3) 0 0 0 0 0 0 Middlesbrough, The James Cook University Hospital 11 (15) 3 (8) 14 (23) 12 (17) 27 2 4 9 6 0 Newcastle, Freeman Hospital 3 (3) 1 (3) 4 (6) 3 (2) 8 1 1 2 1 0 Newcastle, Royal Victoria Infirmary 16 (15) 13 (10) 29 (25) 19 (17) 56 4 4 18 11 0 Northallerton, Friarage Hospital 0 (1) 0 (0) 0 (1) 0 (1) 0 0 0 0 0 0 Northumbria, Nsech 7 (4) 5 (3) 12 (7) 9 (4) 24 3 4 9 6 0 South Shields, South Tyneside District General Hospital 0 (1) 1 (1) 1 (2) 1 (1) 2 0 0 1 0 0 Stockton-On-Tees, University Hospital Of North Tees 4 (2) 0 (2) 4 (4) 3 (4) 6 1 2 3 2 0 Sunderland, Sunderland Royal Hospital 4 (5) 1 (2) 5 (7) 4 (5) 10 2 2 4 2 0 Total 52 (49) 27 (35) 79 (84) 59 (59) 148 14 19 56 33 0
North West Ashton-Under-Lyne, Tameside General Hospital 0 (1) 2 (1) 2 (2) 1 (1) 2 0 0 2 1 0 Barrow-In-Furness, Furness General Hospital 0 (1) 1 (1) 1 (2) 1 (1) 2 0 0 1 0 0 Blackburn, Royal Blackburn Hospital 7 (1) 1 (6) 8 (7) 6 (4) 14 2 6 6 1 0 Blackpool, Blackpool Victoria Hospital 3 (2) 2 (2) 5 (4) 3 (2) 10 1 0 2 1 0 Bolton, Royal Bolton Hospital 4 (0) 1 (0) 5 (0) 4 (0) 10 1 0 4 1 0 Bury, Fairfield General Hospital 1 (3) 1 (0) 2 (3) 1 (3) 4 0 0 1 0 0 Carlisle, Cumberland Infirmary 2 (2) 2 (0) 4 (2) 2 (1) 8 0 0 2 1 0 Chester, Countess Of Chester Hospital 5 (4) 2 (0) 7 (4) 6 (3) 14 1 0 6 2 0 Crewe, Leighton Hospital 1 (2) 2 (0) 3 (2) 3 (2) 6 0 0 3 1 0 Lancaster, Royal Lancaster Infirmary 1 (1) 2 (2) 3 (3) 2 (2) 6 0 0 2 1 0 Liverpool, Alder Hey Children's Hospital 2 (0) 1 (0) 3 (0) 3 (0) 6 1 0 1 2 0 Liverpool, Liverpool Heart And Chest Hospital 0 (0) 1 (0) 1 (0) 0 (0) 2 0 0 0 0 0 Liverpool, Royal Liverpool University Hospital 2 (4) 1 (0) 3 (4) 2 (3) 6 0 0 2 1 0 Liverpool, University Hospital Aintree 3 (3) 3 (5) 6 (8) 3 (7) 12 1 2 3 0 0 Liverpool, Walton Centre For Neurology And Neurosurgery 14 (10) 6 (8) 20 (18) 16 (15) 39 2 10 16 11 1 Manchester, Manchester Royal Infirmary 0 (6) 1 (3) 1 (9) 1 (7) 2 0 0 0 1 0 Manchester, North Manchester General Hospital 0 (2) 3 (0) 3 (2) 1 (2) 6 0 2 1 1 0 Manchester, Royal Manchester Children's Hospital 1 (1) 1 (2) 2 (3) 1 (2) 4 1 2 1 1 1 Manchester, St Marys Hospital 0 (0) 0 (1) 0 (1) 0 (1) 0 0 0 0 0 0 Manchester, Wythenshawe Hospital 2 (3) 8 (4) 10 (7) 7 (4) 20 0 0 7 2 0 Oldham, Royal Oldham Hospital (Rochdale Road) 2 (0) 0 (0) 2 (0) 2 (0) 4 0 2 1 1 0 Prescot, Whiston Hospital 5 (1) 3 (4) 8 (5) 6 (3) 16 2 0 6 2 0

- 147 -
Appendix I Deceased solid organ donors and donated organs in the UK, 1 April 2016 – 31 March 2017 (2015-2016), by donating hospital
Donating hospital DBD DCD All donors Multi-organ donor
Kidney Heart Lung Liver Pancreas Bowel
Preston, Royal Preston Hospital 12 (4) 8 (8) 20 (12) 15 (8) 39 5 0 14 7 0 Salford, Salford Royal 20 (15) 11 (9) 31 (24) 24 (19) 59 5 15 23 8 0 Southport, Southport District General Hospital 0 (1) 1 (1) 1 (2) 1 (1) 2 0 0 1 0 0 Stockport, Stepping Hill Hospital 3 (0) 0 (0) 3 (0) 3 (0) 6 1 2 3 2 0 Warrington, Warrington Hospital 1 (3) 3 (1) 4 (4) 2 (3) 8 0 1 2 0 0 Whitehaven, West Cumberland Hospital 1 (1) 2 (0) 3 (1) 0 (1) 4 0 0 1 0 0 Wigan, Royal Albert Edward Infirmary 2 (3) 1 (4) 3 (7) 3 (5) 6 0 0 3 0 0 Wirral, Arrowe Park Hospital 2 (4) 3 (3) 5 (7) 1 (4) 8 0 0 2 0 0 Total 96 (78) 73 (65) 169 (143) 120 (104) 325 23 42 116 48 2
South Central Aylesbury, Stoke Mandeville Hospital 2 (1) 2 (2) 4 (3) 2 (2) 6 0 0 3 1 0 Banbury, Horton General Hospital 0 (1) 0 (0) 0 (1) 0 (0) 0 0 0 0 0 0 Basingstoke, North Hampshire Hospital 2 (3) 0 (1) 2 (4) 1 (3) 2 0 0 2 1 0 Milton Keynes, Milton Keynes General Hospital 1 (1) 0 (2) 1 (3) 0 (2) 0 0 0 1 0 0 Newport, St Mary's Hospital 1 (2) 3 (3) 4 (5) 4 (3) 8 0 0 4 1 0 Oxford, John Radcliffe Hospital 19 (11) 12 (7) 31 (18) 25 (13) 60 8 12 21 14 0 Portsmouth, Queen Alexandra Hospital 8 (7) 4 (4) 12 (11) 10 (6) 24 2 2 10 5 0 Reading, Royal Berkshire Hospital 0 (3) 2 (1) 2 (4) 2 (4) 3 0 2 2 1 0 Southampton, Southampton University Hospitals 18 (17) 9 (15) 27 (32) 20 (26) 50 7 16 22 13 1 Winchester, Royal Hampshire County Hospital 1 (1) 1 (0) 2 (1) 2 (0) 4 0 0 2 1 0 Wycombe, Wycombe General Hospital 0 (1) 0 (0) 0 (1) 0 (1) 0 0 0 0 0 0 Total 52 (48) 33 (35) 85 (83) 66 (60) 157 17 32 67 37 1
South East Coast Ashford, William Harvey Hospital 8 (5) 5 (4) 13 (9) 9 (6) 24 2 2 9 2 0 Brighton, Royal Sussex County Hospital 11 (10) 13 (9) 24 (19) 19 (15) 48 4 8 19 4 0 Camberley, Frimley Park Hospital 4 (2) 1 (3) 5 (5) 3 (3) 10 0 2 3 1 0 Canterbury, Kent And Canterbury Hospital 0 (0) 0 (1) 0 (1) 0 (0) 0 0 0 0 0 0 Chertsey, St Peter's Hospital 1 (1) 7 (3) 8 (4) 5 (2) 14 0 2 6 1 0 Chichester, St Richard's Hospital 6 (4) 1 (2) 7 (6) 7 (4) 14 1 6 6 1 0 Dartford, Darent Valley Hospital 4 (1) 1 (5) 5 (6) 3 (2) 8 0 0 4 2 0 Eastbourne, Eastbourne District General Hospital 2 (1) 1 (2) 3 (3) 2 (2) 6 2 0 2 2 0 Gillingham, Medway Hospital 4 (9) 5 (1) 9 (10) 5 (7) 16 1 0 6 1 0 Guildford, Royal Surrey County Hospital 1 (0) 0 (1) 1 (1) 1 (0) 2 0 0 1 0 0 Hastings, Conquest Hospital 3 (0) 3 (1) 6 (1) 4 (0) 12 1 0 4 1 0 Haywards Heath, Hurstwood Park Hospital 0 (0) 0 (1) 0 (1) 0 (0) 0 0 0 0 0 0 Haywards Heath, Princess Royal Hospital 0 (1) 1 (0) 1 (1) 1 (0) 2 0 0 1 1 0

- 148 -
Appendix I Deceased solid organ donors and donated organs in the UK, 1 April 2016 – 31 March 2017 (2015-2016), by donating hospital
Donating hospital DBD DCD All donors Multi-organ donor
Kidney Heart Lung Liver Pancreas Bowel
Maidstone, Maidstone District General Hospital 0 (2) 1 (0) 1 (2) 1 (0) 2 0 0 1 0 0 Margate, Queen Elizabeth The Queen Mother Hospital 2 (1) 3 (1) 5 (2) 4 (2) 10 0 0 4 3 0 Redhill, East Surrey Hospital 3 (3) 0 (0) 3 (3) 3 (3) 6 1 0 3 2 0 Slough, Wexham Park Hospital 4 (7) 3 (4) 7 (11) 7 (6) 14 0 2 7 4 0 Tunbridge Wells, Tunbridge Wells Hospital 2 (3) 0 (0) 2 (3) 2 (3) 4 0 4 1 1 0 Worthing, Worthing Hospital 2 (4) 3 (3) 5 (7) 3 (3) 10 0 0 3 0 0 Total 57 (54) 48 (41) 105 (95) 79 (58) 202 12 26 80 26 0
South West Barnstaple, North Devon District Hospital 0 (2) 2 (1) 2 (3) 1 (3) 2 0 0 2 1 0 Bath, Royal United Hospital 6 (0) 2 (2) 8 (2) 8 (0) 16 1 4 7 6 0 Bournemouth, Royal Bournemouth General Hospital 0 (1) 4 (3) 4 (4) 1 (4) 8 0 0 1 0 0 Bristol, Bristol Royal Hospital For Children 1 (3) 2 (3) 3 (6) 3 (6) 6 0 0 3 1 0 Bristol, Bristol Royal Infirmary 6 (2) 6 (5) 12 (7) 10 (4) 23 0 2 10 3 0 Bristol, Southmead Hospital 15 (16) 7 (11) 22 (27) 17 (20) 38 5 4 19 8 0 Cheltenham, Cheltenham General Hospital 1 (1) 0 (0) 1 (1) 1 (1) 2 0 0 1 1 0 Dorchester, Dorset County Hospital 0 (3) 1 (2) 1 (5) 1 (4) 2 0 0 1 0 0 Exeter, Royal Devon And Exeter Hospital (Wonford) 1 (7) 2 (5) 3 (12) 3 (9) 6 0 2 2 0 0 Gloucester, Gloucestershire Royal Hospital 4 (4) 1 (3) 5 (7) 4 (5) 10 0 2 4 1 0 Plymouth, Derriford Hospital 15 (18) 8 (7) 23 (25) 20 (19) 46 6 9 19 13 0 Poole, Poole General Hospital 2 (4) 1 (0) 3 (4) 1 (4) 4 0 0 2 0 0 Salisbury, Salisbury District Hospital 1 (1) 1 (1) 2 (2) 2 (1) 4 0 0 2 1 0 Swindon, Great Western Hospital 6 (3) 3 (1) 9 (4) 8 (3) 17 1 2 8 3 0 Taunton, Taunton And Somerset Hospital (Musgrove Park) 2 (1) 1 (3) 3 (4) 2 (2) 6 2 4 2 2 0 Torquay, Torbay Hospital 2 (2) 1 (3) 3 (5) 1 (4) 4 0 0 2 0 0 Truro, Royal Cornwall Hospital (Treliske) 1 (3) 3 (1) 4 (4) 1 (3) 6 0 0 2 0 0 Yeovil, Yeovil District Hospital 0 (2) 0 (0) 0 (2) 0 (1) 0 0 0 0 0 0 Total 63 (73) 45 (51) 108 (124) 84 (93) 200 15 29 87 40 0
West Midlands Birmingham, Birmingham Children's Hospital 2 (3) 3 (0) 5 (3) 3 (3) 8 2 0 4 3 0 Birmingham, Birmingham Heartlands Hospital 11 (4) 1 (1) 12 (5) 10 (5) 20 5 4 9 4 0 Birmingham, City Hospital 2 (1) 0 (3) 2 (4) 2 (3) 4 1 0 2 1 0 Birmingham, Queen Elizabeth Hospital Birmingham 17 (17) 6 (5) 23 (22) 17 (19) 38 3 6 20 10 0 Burton-On-Trent, Queen's Hospital 5 (1) 3 (0) 8 (1) 6 (1) 12 2 4 6 4 0 Coventry, University Hospital 9 (9) 5 (7) 14 (16) 12 (12) 28 5 2 12 8 0 Dudley, Russells Hall Hospital 0 (0) 2 (0) 2 (0) 1 (0) 4 0 0 1 0 0 Hereford, The County Hospital 3 (2) 1 (0) 4 (2) 4 (2) 8 0 2 4 1 0

- 149 -
Appendix I Deceased solid organ donors and donated organs in the UK, 1 April 2016 – 31 March 2017 (2015-2016), by donating hospital
Donating hospital DBD DCD All donors Multi-organ donor
Kidney Heart Lung Liver Pancreas Bowel
Nuneaton, George Eliot Hospital 0 (1) 0 (1) 0 (2) 0 (2) 0 0 0 0 0 0 Redditch, The Alexandra Hospital 1 (1) 0 (1) 1 (2) 1 (1) 1 0 0 1 0 0 Shrewsbury, Royal Shrewsbury Hospital 0 (4) 2 (1) 2 (5) 1 (3) 4 0 0 0 1 0 Stoke-On-Trent, Royal Stoke University Hospital 7 (9) 18 (15) 25 (24) 14 (17) 46 3 2 15 6 1 Sutton Coldfield, Good Hope District General Hosp. 3 (1) 3 (0) 6 (1) 3 (1) 12 0 2 3 2 0 Telford, The Princess Royal Hospital 0 (4) 0 (1) 0 (5) 0 (4) 0 0 0 0 0 0 Walsall, Manor Hospital 1 (2) 1 (0) 2 (2) 2 (2) 4 0 2 2 0 1 Warwick, Warwick Hospital 1 (3) 0 (1) 1 (4) 1 (3) 2 0 0 1 1 1 West Bromwich, Sandwell General Hospital 2 (1) 0 (1) 2 (2) 2 (2) 4 1 0 2 0 0 Wolverhampton, New Cross Hospital 2 (1) 5 (0) 7 (1) 4 (1) 14 0 0 4 3 0 Worcester, Worcestershire Royal Hospital 0 (1) 1 (3) 1 (4) 0 (3) 2 0 0 0 0 0 Total 66 (65) 51 (40) 117 (105) 83 (84) 211 22 24 86 44 3
Yorkshire and the Humber Barnsley, Barnsley District General Hospital 0 (2) 2 (2) 2 (4) 1 (3) 4 0 0 1 0 0 Bradford, Bradford Royal Infirmary 2 (4) 0 (1) 2 (5) 1 (3) 4 0 0 1 1 0 Cottingham, Castle Hill Hospital 0 (0) 0 (1) 0 (1) 0 (0) 0 0 0 0 0 0 Dewsbury, Dewsbury And District Hospital 1 (0) 2 (0) 3 (0) 2 (0) 6 0 0 1 1 0 Doncaster, Doncaster Royal Infirmary 3 (0) 1 (0) 4 (0) 4 (0) 8 0 2 3 1 0 Grimsby, Diana Princess Of Wales Hospital 0 (0) 0 (1) 0 (1) 0 (0) 0 0 0 0 0 0 Halifax, Calderdale Royal Hospital 4 (1) 0 (1) 4 (2) 3 (1) 8 0 2 3 2 0 Harrogate, Harrogate District Hospital 1 (2) 1 (0) 2 (2) 1 (2) 4 0 0 1 0 0 Huddersfield, Huddersfield Royal Infirmary 4 (3) 3 (4) 7 (7) 6 (3) 14 1 0 5 4 0 Hull, Hull Royal Infirmary 5 (6) 9 (8) 14 (14) 10 (8) 28 0 2 9 7 0 Keighley, Airedale General Hospital 2 (1) 0 (1) 2 (2) 1 (2) 4 0 0 1 0 0 Leeds, Leeds General Infirmary 16 (16) 11 (8) 27 (24) 21 (20) 52 3 6 21 11 1 Leeds, St James's University Hospital 0 (4) 1 (1) 1 (5) 1 (3) 2 0 0 1 1 0 Rotherham, Rotherham District General Hospital 2 (0) 0 (1) 2 (1) 2 (1) 4 1 0 2 1 0 Scarborough, Scarborough General Hospital 2 (0) 1 (0) 3 (0) 2 (0) 6 0 0 2 1 0 Sheffield, Northern General Hospital 7 (8) 1 (4) 8 (12) 6 (11) 13 1 2 7 3 0 Sheffield, Royal Hallamshire Hospital 7 (4) 3 (3) 10 (7) 7 (6) 16 1 5 8 5 0 Sheffield, Sheffield Children's Hospital 0 (0) 1 (2) 1 (2) 1 (2) 2 0 2 1 0 0 Wakefield, Pinderfields General Hospital 3 (3) 2 (2) 5 (5) 3 (2) 9 0 0 3 2 0 Worksop, Bassetlaw District General Hospital 1 (0) 1 (0) 2 (0) 2 (0) 4 0 0 2 1 0 York, York District Hospital 2 (5) 4 (1) 6 (6) 3 (6) 12 1 0 3 2 0 Total 62 (59) 43 (41) 105 (100) 77 (73) 200 8 21 75 43 1

- 150 -
Appendix I Deceased solid organ donors and donated organs in the UK, 1 April 2016 – 31 March 2017 (2015-2016), by donating hospital
Donating hospital DBD DCD All donors Multi-organ donor
Kidney Heart Lung Liver Pancreas Bowel
Channel Islands Guernsey, Princess Elizabeth Hospital 2 (0) 0 (0) 2 (0) 2 (0) 4 0 0 2 0 0 St Helier, Jersey General Hospital 1 (1) 2 (0) 3 (1) 3 (1) 6 0 0 3 2 0 Total 3 (1) 2 (0) 5 (1) 5 (1) 10 0 0 5 2 0
Isle of Man Douglas, Nobles I-O-M Hospital 2 (1) 1 (0) 3 (1) 2 (1) 6 0 0 2 2 0 Total 2 (1) 1 (0) 3 (1) 2 (1) 6 0 0 2 2 0
England 680 (665) 497 (489) 1177 1154) 873 (842) 2214 173 292 880 400 11
Northern Ireland Belfast, Antrim Hospital 3 (0) 1 (1) 4 (1) 3 (0) 8 2 2 2 0 0 Belfast, Belfast City Hospital 1 (3) 0 (1) 1 (4) 1 (4) 2 1 0 1 1 0 Belfast, Mater Infirmorum Hospital 1 (2) 0 (0) 1 (2) 1 (2) 2 0 0 1 0 0 Belfast, Royal Belfast Hospital For Sick Children 0 (3) 0 (1) 0 (4) 0 (4) 0 0 0 0 0 0 Belfast, Royal Victoria Hospital 16 (11) 3 (7) 19 (18) 15 (11) 36 5 14 15 11 1 Belfast, The Ulster Hospital 3 (1) 0 (2) 3 (3) 3 (1) 6 0 0 3 1 1 Coleraine, Causeway Hospital 2 (0) 1 (1) 3 (1) 3 (0) 6 2 0 3 1 0 Enniskillen, South West Acute Hospital 3 (2) 1 (1) 4 (3) 2 (2) 8 0 0 2 1 0 Londonderry, Altnagelvin Area Hospital 2 (4) 1 (1) 3 (5) 2 (5) 6 0 0 2 1 0 Portadown, Craigavon Area Hospital 1 (2) 3 (4) 4 (6) 2 (2) 8 0 4 1 1 0 Total 32 (28) 10 (19) 42 (47) 32 (31) 82 10 20 30 17 2
Scotland Aberdeen, Aberdeen Royal Infirmary 4 (4) 13 (11) 17 (15) 6 (6) 32 0 2 5 2 0 Airdrie, Monklands District General Hospital 0 (1) 0 (1) 0 (2) 0 (2) 0 0 0 0 0 0 Ayr, The Ayr Hospital 1 (0) 1 (1) 2 (1) 1 (0) 4 0 0 1 0 0 Dumfries, Dumfries And Galloway Royal Infirmary 2 (3) 0 (0) 2 (3) 0 (2) 0 0 0 2 0 0 Dundee, Ninewells Hospital 5 (2) 3 (1) 8 (3) 6 (3) 16 0 0 6 1 0 East Kilbride, Hairmyres Hospital 5 (2) 2 (1) 7 (3) 6 (2) 10 1 4 5 1 0 Edinburgh, Royal Hospital For Sick Children 0 (1) 0 (0) 0 (1) 0 (1) 0 0 0 0 0 0 Edinburgh, Royal Infirmary Of Edinburgh 7 (2) 10 (7) 17 (9) 13 (7) 34 2 8 10 6 0 Edinburgh, Western General Hospital 5 (5) 8 (7) 13 (12) 5 (10) 24 1 2 6 5 1 Fort William, Belford Hospital 0 (1) 0 (0) 0 (1) 0 (1) 0 0 0 0 0 0 Glasgow, Glasgow Royal Infirmary 4 (3) 2 (0) 6 (3) 5 (2) 12 0 2 4 4 0

- 151 -
Appendix I Deceased solid organ donors and donated organs in the UK, 1 April 2016 – 31 March 2017 (2015-2016), by donating hospital
Donating hospital DBD DCD All donors Multi-organ donor
Kidney Heart Lung Liver Pancreas Bowel
Glasgow, Golden Jubilee National Hospital 0 (1) 3 (0) 3 (1) 2 (1) 6 0 0 1 1 0 Glasgow, Queen Elizabeth University Hospital 20 (9) 4 (2) 24 (11) 17 (11) 46 2 6 17 7 0 Glasgow, Southern General Hospital 0 (1) 0 (0) 0 (1) 0 (1) 0 0 0 0 0 0 Glasgow, The Royal Hospital For Children 0 (2) 2 (0) 2 (2) 1 (2) 4 0 0 1 0 0 Greenock, Inverclyde Royal Hospital 0 (0) 0 (2) 0 (2) 0 (2) 0 0 0 0 0 0 Inverness, Raigmore Hospital 1 (2) 1 (1) 2 (3) 1 (3) 4 1 0 1 0 0 Kilmarnock, Crosshouse Hospital 5 (2) 1 (0) 6 (2) 5 (2) 12 1 0 5 3 0 Kirkcaldy, Victoria Hospital 4 (2) 1 (2) 5 (4) 5 (3) 10 0 0 5 2 0 Larbert, Forth Valley Royal Hospital 4 (4) 0 (3) 4 (7) 4 (6) 6 0 4 4 2 0 Livingston, St John's Hospital 1 (0) 0 (0) 1 (0) 1 (0) 2 1 2 1 0 0 Melrose, Borders General Hospital 0 (0) 0 (1) 0 (1) 0 (1) 0 0 0 0 0 0 Paisley, Royal Alexandra Hospital 1 (1) 2 (1) 3 (2) 1 (2) 6 0 0 1 0 0 Perth, Perth Royal Infirmary 2 (2) 0 (2) 2 (4) 2 (2) 4 0 0 2 1 0 Wishaw, Wishaw General Hospital 6 (6) 3 (0) 9 (6) 5 (5) 18 0 2 5 4 0 Total 77 (56) 56 (43) 133 (99) 86 (77) 250 9 32 82 39 1
Wales Abergavenny, Nevill Hall Hospital 3 (1) 1 (1) 4 (2) 2 (2) 6 2 3 2 0 Aberystwyth, Bronglais Hospital 1 (0) 0 (0) 1 (0) 1 (0) 2 0 0 1 0 0 Bangor, Ysbyty Gwynedd District General Hospital 4 (3) 0 (1) 4 (4) 4 (3) 8 0 0 4 1 0 Bodelwyddan, Glan Clwyd District General Hospital 2 (2) 2 (6) 4 (8) 2 (2) 5 0 0 3 2 0 Bridgend, Princess Of Wales Hospital 0 (2) 1 (1) 1 (3) 0 (3) 0 0 0 1 0 0 Cardiff, University Of Wales Hospital 14 (14) 8 (10) 22 (24) 17 (21) 41 4 4 18 10 0 Carmarthen, Glangwili General Hospital 0 (0) 1 (1) 1 (1) 1 (0) 2 0 0 1 0 0 Haverford West, Withybush General Hospital 0 (1) 0 (1) 0 (2) 0 (1) 0 0 0 0 0 0 Llanelli, Prince Philips Hospital 1 (0) 0 (0) 1 (0) 1 (0) 2 0 0 1 0 0 Merthyr Tydfil, Prince Charles Hospital 4 (3) 0 (1) 4 (4) 4 (3) 8 0 0 4 3 0 Newport, Royal Gwent Hospital 4 (3) 4 (2) 8 (5) 5 (4) 16 0 0 5 0 0 Pontypridd, Royal Glamorgan Hospital 0 (2) 0 (1) 0 (3) 0 (3) 0 0 0 0 0 0 Swansea, Morriston Hospital 2 (5) 1 (1) 3 (6) 3 (6) 6 0 0 3 0 0 Wrexham, Maelor General Hospital 5 (0) 3 (2) 8 (2) 5 (2) 16 2 2 5 3 0 Total 40 (36) 21 (28) 61 (64) 45 (50) 112 7 8 49 21 0

- 152 -
Appendix IIA Numbers of donors after brain death and organs retrieved in the UK, 1 April 2016 - 31 March 2017, by country/ Strategic Health Authority
Donors Organs Country/ Strategic Health Authority
All donors
pmp Multi-organ donors
pmp Kidney Heart Lung Liver Pancreas Bowel
North East 53 20.2 47 17.9 96 15 19 47 27 0 North West 90 12.6 79 11.0 172 23 34 77 33 1 Yorkshire and The Humber 59 10.9 51 9.5 111 7 17 50 30 1 East Midlands 39 8.3 34 7.3 70 10 13 34 18 2 West Midlands 72 12.5 66 11.5 125 24 22 68 34 4 East of England 74 12.2 65 10.7 138 14 24 65 29 1 London 96 11.1 78 9.0 172 24 34 87 35 1 South East Coast 73 15.8 69 14.9 138 12 24 70 26 1 South Central 51 11.8 45 10.4 94 12 28 47 26 0 South West 67 12.2 58 10.6 124 15 27 63 32 0 England 674 12.3 592 10.8 1240 156 242 608 290 11 Isle of Man 2 25.0 2 25.0 4 0 0 2 2 0 Channel Islands 4 25.0 4 25.0 8 0 0 4 1 0 Wales 39 12.6 36 11.6 69 6 4 38 17 0 Scotland 79 14.7 68 12.7 148 11 26 67 34 1 Northern Ireland 31 16.8 28 15.1 60 9 16 28 16 2 TOTAL 829 12.7 730 11.2 1529 182 288 747 360 14
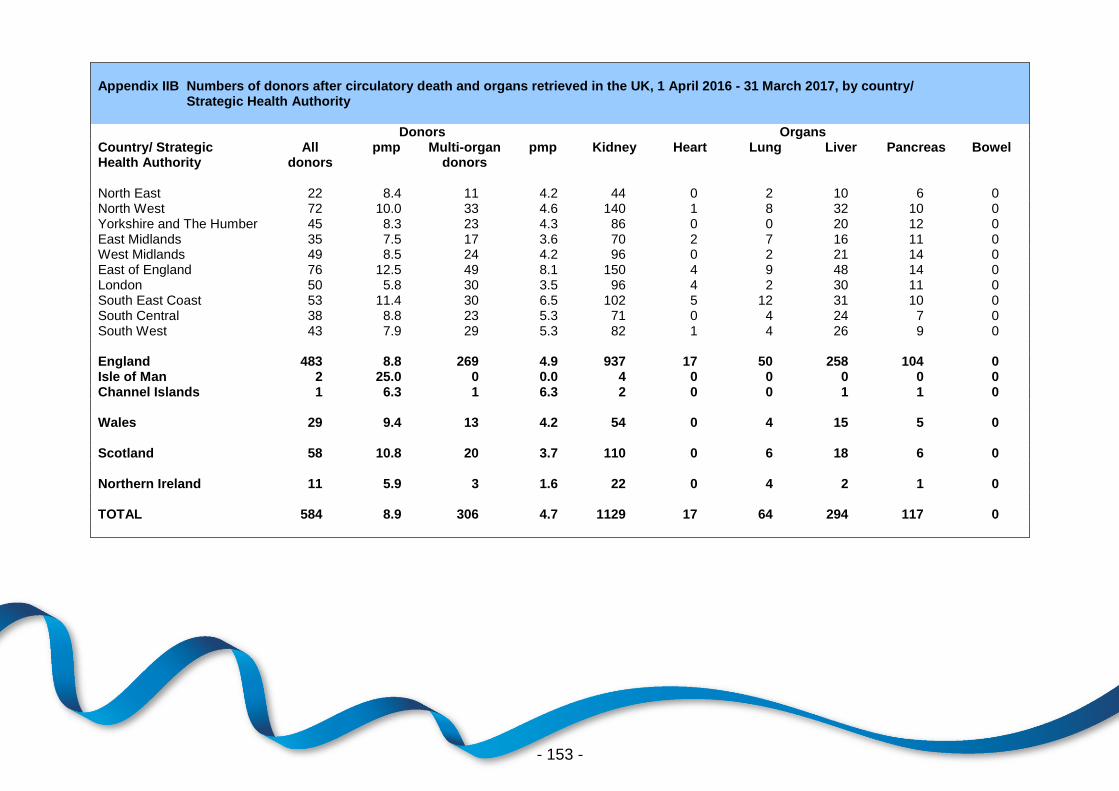
- 153 -
Appendix IIB Numbers of donors after circulatory death and organs retrieved in the UK, 1 April 2016 - 31 March 2017, by country/ Strategic Health Authority
Donors Organs Country/ Strategic Health Authority
All donors
pmp Multi-organ donors
pmp Kidney Heart Lung Liver Pancreas Bowel
North East 22 8.4 11 4.2 44 0 2 10 6 0 North West 72 10.0 33 4.6 140 1 8 32 10 0 Yorkshire and The Humber 45 8.3 23 4.3 86 0 0 20 12 0 East Midlands 35 7.5 17 3.6 70 2 7 16 11 0 West Midlands 49 8.5 24 4.2 96 0 2 21 14 0 East of England 76 12.5 49 8.1 150 4 9 48 14 0 London 50 5.8 30 3.5 96 4 2 30 11 0 South East Coast 53 11.4 30 6.5 102 5 12 31 10 0 South Central 38 8.8 23 5.3 71 0 4 24 7 0 South West 43 7.9 29 5.3 82 1 4 26 9 0 England 483 8.8 269 4.9 937 17 50 258 104 0 Isle of Man 2 25.0 0 0.0 4 0 0 0 0 0 Channel Islands 1 6.3 1 6.3 2 0 0 1 1 0 Wales 29 9.4 13 4.2 54 0 4 15 5 0 Scotland 58 10.8 20 3.7 110 0 6 18 6 0 Northern Ireland 11 5.9 3 1.6 22 0 4 2 1 0 TOTAL 584 8.9 306 4.7 1129 17 64 294 117 0
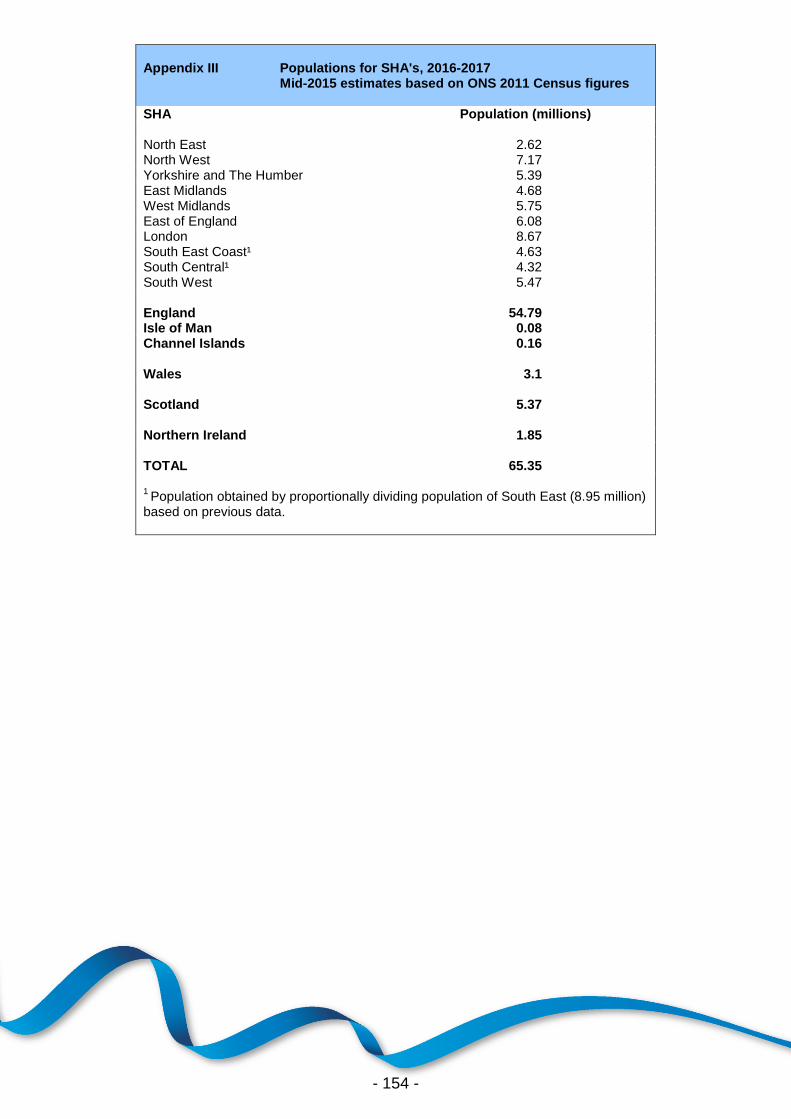
- 154 -
Appendix III Populations for SHA's, 2016-2017 Mid-2015 estimates based on ONS 2011 Census figures SHA Population (millions) North East 2.62 North West 7.17 Yorkshire and The Humber 5.39 East Midlands 4.68 West Midlands 5.75 East of England 6.08 London 8.67 South East Coast¹ 4.63 South Central¹ 4.32 South West 5.47 England 54.79 Isle of Man 0.08 Channel Islands 0.16 Wales 3.1 Scotland 5.37 Northern Ireland 1.85 TOTAL 65.35 1 Population obtained by proportionally dividing population of South East (8.95 million)
based on previous data.

- 155 -
Appendix IVA UK solid organ transplants from deceased UK donors1 to
non-UK residents, 1 April 2014 to 31 March 2017
Transplant type by year
Residency of recipient
Year Transplant type ROI Other EU Non-EU Total
2014/15 Kidney 1 0 0 1
Heart 1 0 0 1
Liver 4 14 2 20
Double lung 1 0 0 1
Bowel only 0 0 1 1
Mulitvisceral 0 1 0 1
Total 7 15 3 25
2015/16 Heart 1 0 0 1
Liver 1 11 1 13
Double lung 2 0 0 2
Bowel only 0 0 1 1
Modified Mulitvisceral 1 0 0 1
Total 5 11 2 18
2016/17 Kidney 0 0 1 1
Heart 1 0 0 1
Liver 4 4 1 9
Double lung 1 0 0 1
Liver and kidney 2 0 0 2
Total 8 4 2 14
ROI = Republic of Ireland 1 based on country of donor hospital
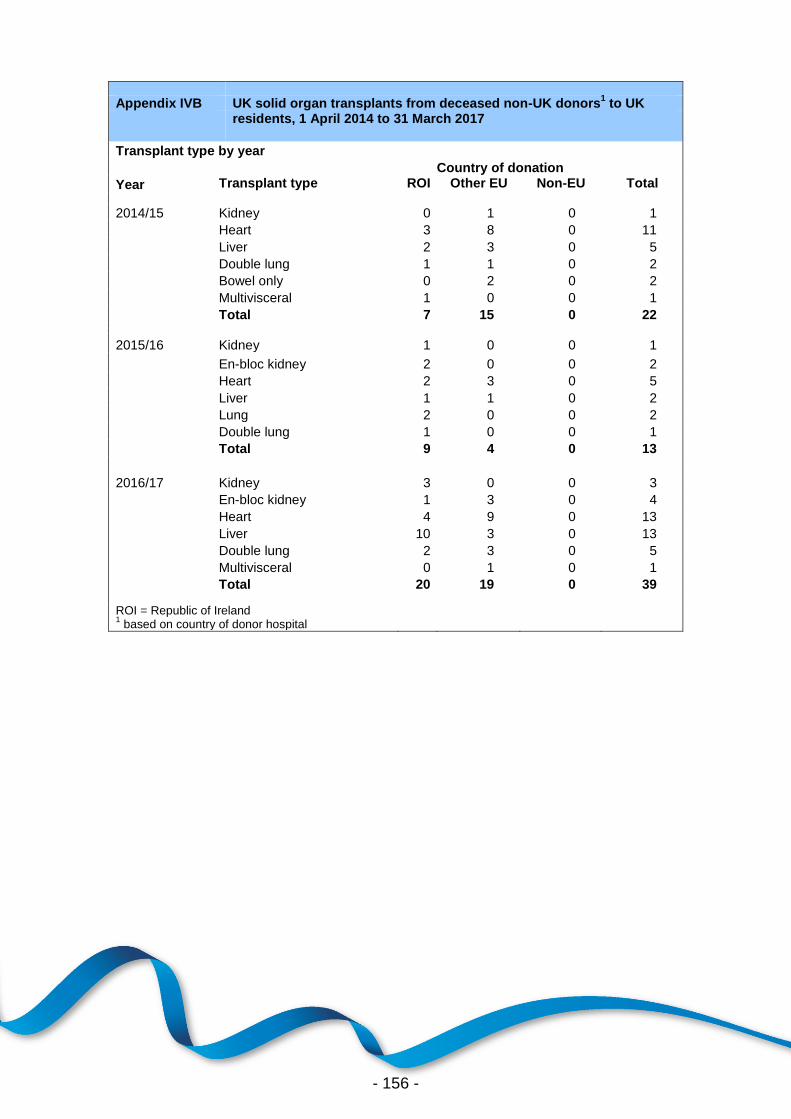
- 156 -
Appendix IVB UK solid organ transplants from deceased non-UK donors1 to UK
residents, 1 April 2014 to 31 March 2017
Transplant type by year
Country of donation
Year Transplant type ROI Other EU Non-EU Total
2014/15 Kidney 0 1 0 1
Heart 3 8 0 11
Liver 2 3 0 5
Double lung 1 1 0 2
Bowel only 0 2 0 2
Multivisceral 1 0 0 1
Total 7 15 0 22
2015/16 Kidney 1 0 0 1
En-bloc kidney 2 0 0 2
Heart 2 3 0 5
Liver 1 1 0 2
Lung 2 0 0 2
Double lung 1 0 0 1
Total 9 4 0 13
2016/17 Kidney 3 0 0 3
En-bloc kidney 1 3 0 4
Heart 4 9 0 13
Liver 10 3 0 13
Double lung 2 3 0 5
Multivisceral 0 1 0 1
Total 20 19 0 39 ROI = Republic of Ireland 1 based on country of donor hospital

- 157 -
Appendix IVC Non-UK solid organ transplants from deceased UK donors1 to
non-UK hospitals, 1 April 2014 to 31 March 2017
Transplant type by year
Residency of recipient
Year Transplant type ROI Other EU Non-EU Total
2014/15 Heart 0 2 0 2 Liver 2 0 0 2
Double lung 0 5 0 5
Total 2 7 0 9
2015/16 Heart 0 3 0 3 Liver 3 0 0 3
Double lung 0 2 0 2
Total 3 5 0 8
2016/17 Heart 0 2 0 2
Liver 6 0 0 6
Double lung 0 2 0 2
Total 6 4 0 10
ROI = Republic of Ireland 1 based on country of donor hospital

- -