oregon workers’ compensation premium rate · pdf filecalendar year 2014 oregon...
TRANSCRIPT
Oregon Workers’ Compensation
Premium Rate RankingCalendar Year 2014
Central Services Division
Information Technology and Research Section
February 2015
Oregon Department of Consumerand Business Services


Oregon Workers’ CompensationPremium Rate Ranking
Calendar Year 2014Department of Consumer and Business Services
Patrick M. Allen, Director
Central Services DivisionNancy Boysen, Administrator
Information Technology and Research Section
Sandy Wheeler, CIO Ronni Rachele, Research Manager
Gary Helmer, Economist Mike Manley, Research Coordinator
Jay Dotter, Research Analyst
DCBS CommunicationsAngela Van Grunsven, Designer
Mark Peterson, Editor
350 Winter St. NE, Room 300
P.O. Box 14480 Salem, OR 97309-0405
503-378-8254
February 2015
The information in this report is in the public domain and may be reprinted without permission. Visit the DCBS website, http://dcbs.oregon.gov.
To sign up for e-mail notification of new publications please see the Research Unit home page, http://www4.cbs.state.or.us/ex/imd/external/.
In compliance with the Americans with Disabilities Act (ADA), this publication is available in alternative formats. Please call 503-378-8254.


Calendar Year 2014 ■ Oregon Workers’ Compensation Premium Rate Ranking
Table of contentsHighlights .............................................................................................................. 1Introduction .......................................................................................................... 3Findings ................................................................................................................. 3Methodology ......................................................................................................... 5Time series ........................................................................................................... 9Comparing states’ rate trends ....................................................................... 10An additional historical comparison ........................................................... 10Notes about using the rankings ..................................................................... 12Figures 1. 2014 workers’ compensation premium index rates ................................................................. 3 2. Oregon’s rate ranking among 51 jurisdictions, 1986-2014 ...................................................... 8 3. Workers’ compensation national median index rate, 1986-2014 ............................................ 8 4. Oregon premium index rate relative to the national median value, 1986-2014...................... 9 5.Netfive-yearvoluntarypremiumlevelchange,2010-2014 ................................................... 11
Tables 1. Workers’ compensation premium rate ranking ....................................................................... 4 2. Oregon’s ranking in the top 10 of 50 occupational classes ...................................................... 5 3. States by workers’ compensation rating organization .............................................................. 6 4. Load factors used for competitive states .................................................................................. 7 5.Effectof approvedratechangesonpremiumlevelinOregonandcountrywide .................. 10 6. Maximum, median, and minimum index rates comparison, 2006-2014 .............................. 10
Appendices 1. Occupational classes used for 2014 premium rate ranking ................................................... 16 2. 2013 assigned risk pool size, by state, for coverages in pools managed by NCCI .................. 17 3. Voluntary premium level changes, 2010-2014 ....................................................................... 18 4. Workers’ compensation premium rate ranking by class ........................................................ 19


1
Calendar Year 2014 ■ Oregon Workers’ Compensation Premium Rate Ranking
1 One state was tied with Oregon. In cases of ties, our study practice is to assign the higher numerical rank to both states.
2 See Methodology section for explanation of class set substitutions.
Highlightsu Oregon employers pay, on average, the 43rd highest
workers’ compensation premium rates in the nation; i.e., 41 states1 had higher rates in 2014. Oregon ranked 39th in 2012.
u The premium index rate in Oregon is $1.37 per $100 of payroll. The national median index rate is $1.85. Premium indices rate range from a low of $0.88 per $100 of payroll in North Dakota to a high of $3.48 in California.
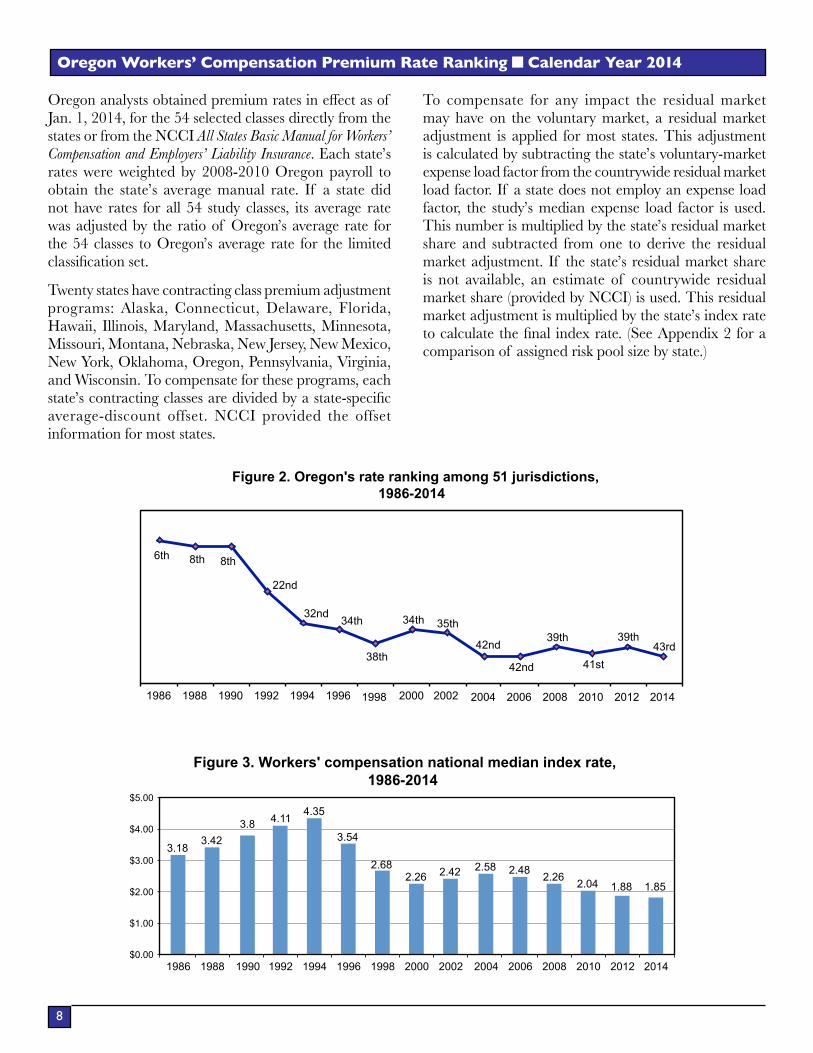
u The national median index rate is currently at its lowest value since the inception of this study in 1986. It peaked in 1994 at $4.35.
u Oregon’s index rate is 74 percent of the national median, its lowest recorded level. It peaked at 149 percent of the national median in 1990.
u From 2004 through 2012, the range between the highest and lowest-rate states narrowed. In 2014, however, this trend reversed somewhat, primarily due to divergence of the highest-rate and lowest-rate states. By other measures, states continued to cluster near the median.
u Oregon’s ranking in the 54 occupational classes used in this study2 ranged from fourth highest for “Farm: Cattle/Livestock” to 49th highest for “Store: Auto Parts.”

3
Calendar Year 2014 ■ Oregon Workers’ Compensation Premium Rate Ranking
Oregon Workers’ Compensation Premium Rate Ranking Findings by state
Jan. 1, 2014IntroductionThe comparison of workers’ compensation rates by state can be used as a factor in plant relocation, as an indicator of possibledifferencesinbenefitlevels,ortotrackchangesin workers’ compensation premium rates among states over time. The Information Technology and Research Section in the Oregon Department of Consumer and Business Services has used the same methodology (with minor enhancements) to examine rates on a biennial basis since 1986. Analysts use this methodology to create a comparable hazard mix across states, thus controlling for interstatedifferences in industrycomposition.Thisedition of the study provides data as of Jan. 1, 2014.
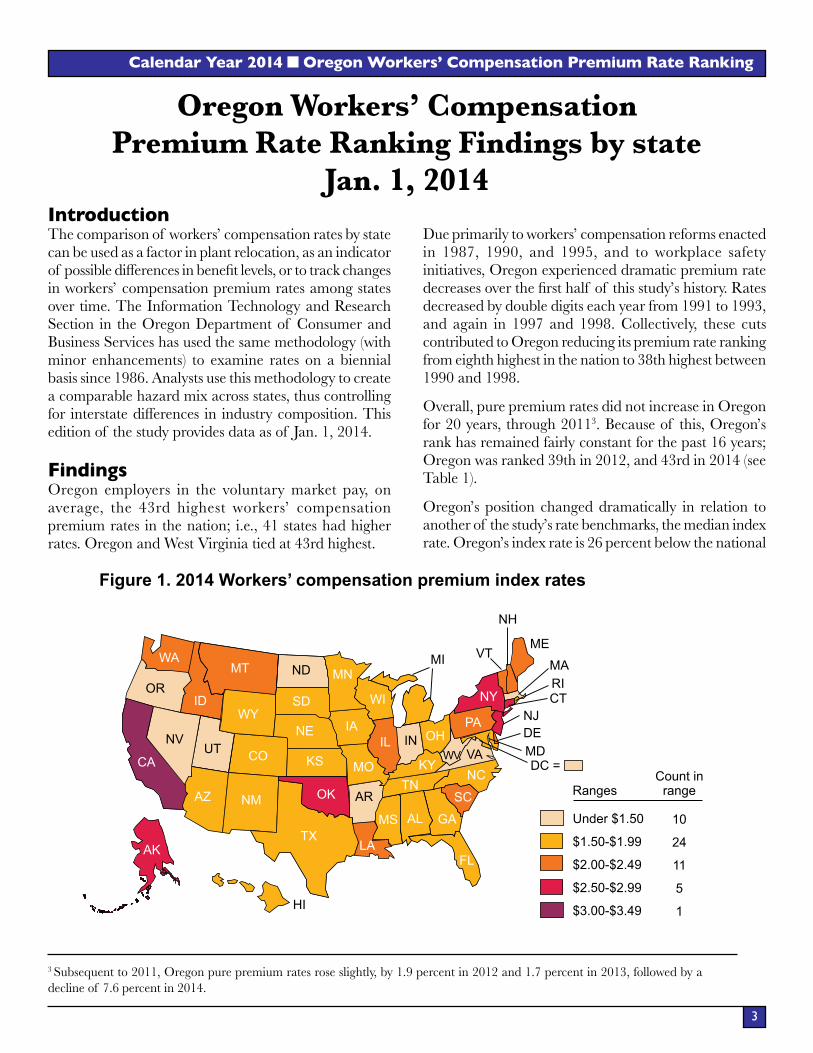
FindingsOregon employers in the voluntary market pay, on average, the 43rd highest workers’ compensation premium rates in the nation; i.e., 41 states had higher rates. Oregon and West Virginia tied at 43rd highest.
Due primarily to workers’ compensation reforms enacted in 1987, 1990, and 1995, and to workplace safety initiatives, Oregon experienced dramatic premium rate decreasesoverthefirsthalf of thisstudy’shistory.Ratesdecreased by double digits each year from 1991 to 1993, and again in 1997 and 1998. Collectively, these cuts contributed to Oregon reducing its premium rate ranking from eighth highest in the nation to 38th highest between 1990 and 1998.
Overall, pure premium rates did not increase in Oregon for 20 years, through 20113. Because of this, Oregon’s rank has remained fairly constant for the past 16 years; Oregon was ranked 39th in 2012, and 43rd in 2014 (see Table 1).
Oregon’s position changed dramatically in relation to another of the study’s rate benchmarks, the median index rate. Oregon’s index rate is 26 percent below the national
Figure 1. 2014 Workers’ compensation premium index rates
OR
CA
WA
AK
NV
ID
MT
WY
CO
NM
ND
SD
NE
KS
OK
TX
MN
IA
MO
AR
UT
AZ
LA
HI
WI
IL
MS AL
TNKY
IN
FL
GA
SC
NCWV VA
DC =MDDENJPA
CTRIMA
ME
NH
VTMI
NY
OH
Ranges
Under $1.50
$1.50-$1.99
$2.00-$2.49
$2.50-$2.99
$3.00-$3.49
Count in range
10
24
11
5
1
3 Subsequent to 2011, Oregon pure premium rates rose slightly, by 1.9 percent in 2012 and 1.7 percent in 2013, followed by a decline of 7.6 percent in 2014.

4
Oregon Workers’ Compensation Premium Rate Ranking ■ Calendar Year 2014
Table 1. Workers’ compensation premium rate ranking2014
ranking2012
ranking State Index rate
Percent of study median Effective date
1 3 California 3.48 188% January 1, 20142 2 Connecticut 2.87 155% January 1, 20143 7 New Jersey 2.82 152% January 1, 20144 5 New York 2.75 148% January 1, 20145 1 Alaska 2.68 145% January 1, 20146 6 Oklahoma 2.55 137% 11/1/13 State Fund, 1/1/14 Private7 4 Illinois 2.35 127% January 1, 20148 14 Vermont 2.33 125% April 1, 20139 30 Delaware 2.31 125% December 1, 2013
10 15 Louisiana 2.23 120% January 1, 201411 8 Montana 2.21 119% July 1, 201312 9 New Hampshire 2.18 118% January 1, 201413 10 Maine 2.15 116% April 1, 201314 19 Idaho 2.01 109% January 1, 201417 13 Washington 2.00 108% January 1, 201417 16 South Carolina 2.00 108% September 1, 201317 12 Pennsylvania 2.00 108% April 1, 201320 27 New Mexico 1.99 108% January 1, 201420 20 Rhode Island 1.99 107% July 1, 201320 17 Minnesota 1.99 107% January 1, 201421 36 Missouri 1.98 107% January 1, 201422 19 Tennessee 1.95 105% March 1, 201323 12 Wisconsin 1.92 104% October 1, 201324 25 Iowa 1.88 101% January 1, 201425 23 South Dakota 1.86 100% July 1, 201327 35 Hawaii 1.85 100% January 1, 201427 25 North Carolina 1.85 100% April 1, 201328 29 Florida 1.82 98% January 1, 201429 21 Alabama 1.81 97% March 1, 201330 33 Nebraska 1.78 96% February 1, 201331 31 Wyoming 1.76 95% January 1, 201432 27 Georgia 1.75 95% July 1, 201333 28 Ohio 1.74 94% July 1, 201334 32 Michigan 1.68 91% January 1, 201335 34 Maryland 1.64 88% January 1, 201436 38 Texas 1.61 87% June 1, 201337 37 Arizona 1.60 86% January 1, 201438 42 Mississippi 1.59 85% March 1, 201339 41 Kansas 1.55 83% January 1, 201440 22 Kentucky 1.51 82% October 1, 201341 43 Colorado 1.50 81% January 1, 201443 40 West Virginia 1.37 74% November 1, 201343 39 Oregon 1.37 74% January 1, 201445 45 Utah 1.31 71% December 1, 201345 47 District of Columbia 1.31 70% November 1, 201346 46 Nevada 1.26 68% March 1, 201348 44 Massachusetts 1.17 63% September 1, 201048 48 Virginia 1.17 63% April 1, 201349 49 Arkansas 1.08 58% July 1, 201350 50 Indiana 1.06 57% January 1, 201451 51 North Dakota 0.88 47% July 1, 2013

5
Calendar Year 2014 ■ Oregon Workers’ Compensation Premium Rate Ranking
median in 2014, the lowest recorded level (see Figure 4). The index rate peaked at 49 percent above the median in 1990 and was at previous lows in 2004 and 2006.
Oregon’s premium index rate (premium per $100 of payroll) is $1.37 (see Figure 1) Premium indices rate range from $0.88 in North Dakota to $3.48 in California. Percent of median, a state’s index rate divided by the median index rate, ranged from a low of 47 percent for North Dakota to a high of 188 percent for California. Oregon’s 2014 percent of median is 74 percent. Thirteen jurisdictions were more than 10 percent above the study median, 21 were between 90 percent and 110 percent, and 17 were below 90 percent (see Table 1).
Oregon’s ranking in the 54 occupational classes4 used in this study ranged from the 4th highest for “Farm: Cattle/Livestock” to 49th for “Store: Auto Parts.” Table 2 illustrates Oregon’s ranking in the 10 largest (by payroll) of the 50 classes this study is based on. Oregon’s rates were higher than the median class rates for eight of the 54 study classes (see Appendix 4).
Table 2. Oregon’s ranking in the top 10 of 50 occupational classesClasscode Occupation
Oregon payroll (policy years 2008-2010)
Oregonranking
8810 Clerical Office Employees NOC 35,794,077,091 448742 Salespersons - Outside 9,651,924,847 468868 COLLEGE: Professional Employees & Clerical 7,304,026,745 428832 Physician and Clerical 6,737,289,705 379079 Restaurant NOC 4,398,201,794 438833 Hospital: Professional Employees 3,378,727,495 388017 STORE: Retail, NOC 2,199,088,458 418380 Automobile Service/Repair Center & Drivers 1,646,509,894 327219 Trucking: NOC - All Employees & Drivers 1,462,687,561 378824 Retirement Living Centers: Health Care Employees 1,144,962,307 32
Note: To more closely approximate the typical state’s coding methodology, State special code 9079 (Restaurant NOC & Drivers) was split into four codes for the survey: 9058 (Hotel: Restaurant Employees), 9082 (Restaurant NOC), 9083 (Restaurant: Fast Food), and 9084 (Bar, Discotheque, Lounge, Night Club or Tavern). State special code 7219 (Trucking: Local & Long haul - all employees & drivers) was split into two codes for the survey, 7228 (Trucking: Local hauling - all employees & drivers) and 7229 (Trucking: Long distance hauling - all employees & drivers).
Source: Information Technology & Research Section, Central Services Division, Oregon Department of Consumer and Business Services (8/2014)
MethodologyThis study is designed to produce a comparison of premiumratesforacomparablesetof riskclassificationsacross all states. The study uses the National Council on CompensationInsurance(NCCI)classificationcodes.Of the approximately 450 active classes in Oregon, 50 were selected based on relative importance as measured by share of losses in Oregon. These 50 classes represent 67.9 percent of 2008-2010 Oregon payroll and 59.2 percent of 2008-2010 Oregon losses, as reported by NCCI on a policy-year basis. Appendix 1 lists occupational classes, payroll, and loss information used in this study.
ThestatesthatdonotusetheNCCIclassificationsystemare also included in the study. Analysts in these states select analogous classes to the NCCI classes, making it possible to compare these states with the states served by NCCI.
The study compares the average manual rates, rates for expected claim costs plus factors for insurer expense andprofit.Forcomparisonof averagemanualrates,itisnecessary to derive manual rates for states for which only pure premium or advisory loss cost rates are available.
4 The top 50 Oregon classes include codes 7219 and 9079, codes that are not generally used by other states. In order to provide the most representative set of classes, these have been replaced in the study with 7228 and 7229 for 7219, and 9058, 9092, 9083, and 9084 for 9070. This brings the number of codes in the study up to 54 NCCI class codes.

6
Oregon Workers’ Compensation Premium Rate Ranking ■ Calendar Year 2014
Pure premium is the amount of premium necessary to pay for workers’ compensation claims, excluding all loss adjustment or claim management expenses, otheroperatingexpenses,assessments,taxes,andprofitallowance. The ratemaking organization for each state develops pure premium rates for each occupational class based on aggregate loss information submitted by workers’ compensation carriers. NCCI is the ratemaking organization for 35 states and the District of Columbia, and provides advisory ratemaking services to the local rating organization in three other states (see Table 3).
Expense loading factors, or loss cost multipliers, are the factors by which pure premium rates are multiplied to account for the insurer’s expenses, taxes, andprofitto create a manual rate. An expense loading factor is used to modify each competitive state’s rates unless they provide manual rates. For Oregon, the average expense loading factor of 26.8 percent was computed based on the loadingfactorsineffectduring2014,foreachof thetop30 private insurers and the SAIF Corporation, weighted
Table 3. States by workers’ compensation rating organization
NCCI rating/advisory organizationIndependentrating bureau
Monopolisticstate funds
Alabama 1 Mississippi 1 California 1 North DakotaAlaska1 Missouri 1 Delaware 1 OhioArizona Montana 1 Indiana 1 WashingtonArkansas 1 Nebraska 1 Massachusetts WyomingColorado 1 Nevada 1 Michigan 1
Connecticut 1 New Hampshire 1 Minnesota 1
District of Columbia 1 New Mexico 1 New Jersey Florida Oklahoma 1 New York 1
Georgia 1 OREGON 1 North Carolina 1
Hawaii 1 Rhode Island 1 Pennsylvania 1
Idaho South Carolina 1 Texas 1
Illinois 1 South Dakota 1 WisconsinIowa Tennessee 1
Kansas 1 Utah 1
Kentucky 1 Vermont 1
Louisiana 1 Virginia 1
Maine 1 West Virginia 1
Maryland 1
1 States with Competitive Rating Laws and effective dates: Arkansas (6/17/81), Oregon (7/1/82), Kentucky (7/15/82), Illinois (8/18/82), Rhode Island (9/1/82), Michigan (1/1/83), Georgia (1/1/84), Minnesota (1/1/84), Vermont (7/1/84), New Mexico (10/1/87), Maryland (1/1/88), Louisiana (9/1/88), Indiana (9/1/89), Connecticut (10/1/89), Hawaii (6/25/90), South Carolina (7/1/90), District of Columbia (1/1/91), Colorado (3/1/91), Alabama (11/1/91), Texas (3/1/92), Utah (5/20/92), Maine (1/1/93), South Dakota (7/1/93), Nebraska (9/1/93), Pennsylvania (12/1/93), Kansas (1/1/94), Missouri (1/1/94), New Hampshire (1/1/94), Oklahoma (1/1/94), Virginia (1/1/94), Delaware (8/1/94), California (1/1/95), North Carolina (7/28/95), Montana (10/1/95), Mississippi (1/1/96), Tennessee (1/1/97), Alaska (1/1/98), Nevada (7/1/99), West Virginia (7/1/06), New York (1/1/2008)
Source: NCCI Annual Statistical Bulletin, 2013 Edition
by2013directearnedpremiums.Thisfigurerepresentsa 1.0 percent increase from the 2012 Oregon value. See Table 4 for load factors by state. Between 2012 and 2014, 31 jurisdictions reported load factor increases andfivereported decreases.
In states with competitive rating laws, each carrier determines its own loading factor. Pure premium, increased by the expense loading factor, represents the manual rate per $100 of earnings for each employee. However, the insurance premium paid by an employer is not just the manual rate multiplied by payroll. Other factors, such as premium discounts for quantity purchases, experiencemodificationfactors,premiumreductionsonpolicies carrying deductible features, retrospective rating plans,anddividends,affect therateanemployerpays.Because comparable data across states do not exist, these factors are not accounted for in this study.
States differ substantially in theway inwhich they setand apply their manual rates. Monopolistic states

7
Calendar Year 2014 ■ Oregon Workers’ Compensation Premium Rate Ranking
Table 4. Load factors used for competitive states
State 2012 Load Factor 2014 Load FactorPercent change
2012 to 2014Alabama 31.8% 39.0% 5.50%Alaska 51.5% 54.7% 2.08%Arkansas 43.8% 54.2% 7.23%California 38.0% 11.9% -18.91%Colorado 21.7% 25.6% 3.24%Connecticut 39.8% 35.5% -3.08%Delaware 35.5% 39.5% 2.97%District of Columbia 47.0% 52.2% 3.51%Georgia 35.0% 40.0% 3.70%Hawaii 55.7% 62.9% 4.63%Illinois NCCI advisory rates used NCCI advisory rates used NAIndiana NCCI advisory rates used NCCI advisory rates used NAKansas 42.8% 45.3% 1.72%Kentucky 46.7% 39.0% -5.25%Louisiana 54.0% 64.9% 7.09%Maine 43.9% 48.5% 3.20%Maryland 47.2% 45.8% -0.90%Michigan Average manual rates used Average manual rates used NAMinnesota 77.9% 92.0% 7.93%Mississippi 1 34.7% 36.5% 1.35%Missouri 2 33.9% 43.6% 7.25%Montana 18.0% 19.7% 1.45%Nebraska 35.5% 44.8% 6.82%Nevada 30.8% 36.1% 4.05%New Hampshire 29.7% 36.5% 5.24%New Mexico 39.6% 42.4% 1.99%New York 26.0% 30.0% 3.17%North Carolina 31.0% 35.3% 3.28%Oklahoma 33.7% 48.6% 11.18%Oregon 25.6% 26.8% 0.97%Pennsylvania 45.1% 56.8% 8.11%Rhode Island 38.9% 32.3% -4.80%South Carolina 43.7% 46.9% 2.25%South Dakota 49.0% 61.2% 8.18%Tennessee 27.0% 37.0% 7.87%Texas Average manual rates used Average manual rates used NAUtah 33.5% 42.6% 6.80%Vermont 34.1% 47.7% 10.12%Virginia 38.0% 40.0% 1.46%West Virginia 21.6% 35.8% 11.71%1Mississippi insurers can choose to use loss costs rates from each of the past six years modified by a loss cost multiplier. The multipliers shown here are the premium weighted average applied to the sets of loss costs.
2The Missouri Insurance Dept. maintains a Web site that gives the average manual rate for any valid class code entered.
Source: Information Technology & Research Section, Central Services Division, Oregon Department of Consumer and Business Services (7/2014)
have a state-operated workers’ compensation system and set their own manual rates. States that allow private insurers to compete for business either use NCCI to prepare their manual rates/loss costs or use their own rating bureau. Some state rating bureaus are completely independent of NCCI, while others contract with NCCI for their rate preparation (See Table 3 for states by
workers’ compensation rating organization). On top of the variation in rating organizations, many states allow insurers to compete for business by setting their own expense loading factors. These expense loading factors, alsocalledlosscostmodifiers,arethenappliedtopurepremium rates to produce manual rates.
8
Oregon Workers’ Compensation Premium Rate Ranking ■ Calendar Year 2014
Oregonanalystsobtainedpremiumratesineffectasof Jan. 1, 2014, for the 54 selected classes directly from the states or from the NCCI All States Basic Manual for Workers’ Compensation and Employers’ Liability Insurance. Each state’s rates were weighted by 2008-2010 Oregon payroll to obtain the state’s average manual rate. If a state did not have rates for all 54 study classes, its average rate was adjusted by the ratio of Oregon’s average rate for the 54 classes to Oregon’s average rate for the limited classificationset.
Twenty states have contracting class premium adjustment programs: Alaska, Connecticut, Delaware, Florida, Hawaii, Illinois, Maryland, Massachusetts, Minnesota, Missouri, Montana, Nebraska, New Jersey, New Mexico, New York, Oklahoma, Oregon, Pennsylvania, Virginia, and Wisconsin. To compensate for these programs, each state’scontractingclassesaredividedbyastate-specificaverage-discount offset. NCCI provided the offset information for most states.
To compensate for any impact the residual market may have on the voluntary market, a residual market adjustment is applied for most states. This adjustment is calculated by subtracting the state’s voluntary-market expense load factor from the countrywide residual market load factor. If a state does not employ an expense load factor, the study’s median expense load factor is used. This number is multiplied by the state’s residual market share and subtracted from one to derive the residual market adjustment. If the state’s residual market share is not available, an estimate of countrywide residual market share (provided by NCCI) is used. This residual market adjustment is multiplied by the state’s index rate tocalculatethefinal indexrate. (SeeAppendix2foracomparison of assigned risk pool size by state.)
Figure 2. Oregon's rate ranking among 51 jurisdictions, 1986-2014
8th 8th
22nd
32nd 34th
38th
34th 35th
42nd
42nd
39th 39th
41st
6th
1986 1988 1990 1992 1994 1996 1998 2000 2002 2004 2006 2008 2010 2012
43rd
2014
3.18 3.42
3.8 4.11 4.35
3.54
2.68 2.26 2.42 2.58 2.48 2.26 2.04 1.88
$0.00
$1.00
$2.00
$3.00
$4.00
$5.00
1986 1988 1990 1992 1994 1996 1998 2000 2002 2004 2006 2008 2010 2012
Figure 3. Workers' compensation national median index rate, 1986-2014
1.85
2014

9
Calendar Year 2014 ■ Oregon Workers’ Compensation Premium Rate Ranking
Time seriesThe 2014 study marks the 15th biennial study using the same basic methodology. This provides a data series useful for describing rate trends. Figure 2 shows Oregon’s rate rankings over the past 28 years.
The study methodology imposes some limitations on its usefulness as a time series. The set of surveyed classes and associated payroll weights both change over time; thus, index values are not strictly comparable across studies. This means that a change in a state’s index values from one study to the next are less meaningful than the change in its placement relative to other states. To overcome this problem, the median index rate for each study is also used as a benchmark. This creates a data series of states’ rates as a percentage of the median index rate for each study (shown in Table 1). Compared to an overall average, use of the median tends to curtailtheinfluenceof outliersattheendsof thedistribution.Thus, a state’s index rate as a percentage of the median can be used, along with its ranking, as an indicator of its relative cost. It may be a better indicator than the actual index value
of changes from one study to the next.
As can be seen from Figure 3, the national median rate began to drop in the mid-1990s and reached its previous low point in 2000. The national median then rose in 2002 and 2004, followed by declines through 2014. The 2014 rate is the lowest yet recorded. This general trend has also been observed in other, independent data series on national workers’ compensation costs, such as those published by the U.S. Bureau of Labor Statistics5 and the National Academy of Social Insurance6.
Oregon’s rates with respect to the median are shown in Figure4.Thismeasureshowsasomewhatdifferenttrendthan the rate ranking for Oregon, particularly during the early years of the study. While Oregon’s ranking dropped from sixth in the initial study to eighth in 1988 and 1990, the index rate for Oregon was increasing as a percentage of the median, peaking at 49 percent above the median in 1990. Oregon’s post-1990 rate reductions occurred while rates were increasing nationally, and the drop in the following
5 U.S. Bureau of Labor Statistics “Employer Costs for Employee Compensation (ECEC)” http://www.bls.gov/news.release/ecec.toc.htm
Workers’ compensation costs as a percent of payroll can be derived from the data in this quarterly national survey of employers.
6NationalAcademyof SocialInsurance“Workers’Compensation:Benefits,Coverage,andCosts,2012”. http://www.nasi.org/research/2014/report-workers-compensation-benefits-coverage-costs-2012 http://www.nasi.org/research/2012/report-workers-compensation-benefits-coverage-costs-2010. Table 12 of this publication provides a data series for employer cost per $100 of wages.
Figure 4. Oregon premium index rate relative to national median value, 1986-2014
37% 42%
49%
7%
-15% -11% -16% -15% -15%
-21% -21% -17% -17% -16% -20%
0%
30%
50%
-30%
1986 1988 1990 1992 1994 1996 1998 2000 2002 2004 2006 2008 2010 2012 -26% 2014
60%
40%
20%
10%
-10%

10
Oregon Workers’ Compensation Premium Rate Ranking ■ Calendar Year 2014
two studies was dramatic. By 1994, Oregon’s index rate had declined to 15 percent below the national median. This relationship was fairly stable until 2004, when Oregon’s index rate dropped further, to 21 percent below the national median. Oregon’s index rate is 26 percent below the national median for 2014.
An additional historical comparisonAs Appendix 3 illustrates, there have been many changes in states’ workers’ compensation premium rates over the pastfiveyears.In2010,decreasesoutnumberedincreases.For 2011, there were similar numbers of decreases and increases, while in 2012 and 2013, the increases outnumbered the decreases. This trend appears to have reversed: as of mid-2014 there were equal numbers of increases and decreases in 2014, but nine states show no change7.Roughly three-fifths of the states that reportpremium level changes to the NCCI had a net rate decreaseoverthefive-yearperiodfromJan.1,2010,toapproximately May 20148. Table 5 compares premium rate changes in Oregon with premium rate changes nationwide, excluding states with monopolistic state funds, for years 2002 through 2013.
Notes about using the rankingsUsers of this premium rate ranking study should be aware of some of the issues in comparing premium rates among states. There are many factors that cannot be measured in each state but contribute to overall rate level and individual class rates. These factors vary by state. Some issues that the users of this report should consider:
1. Because not all premium classes were included in the study, the actual average premium rate for a state will differfromtheweightedpremiumindexrate,whichis based on the characteristics of Oregon’s economy.
Comparing states’ rate trends
This study was first done in 1986, and was originally intended to inform Oregon policy makers of how Oregon’s rates ranked nationally on a timely, compre-hensive, and comparable basis. In recent studies, the rankings have been closely watched by other states interested in how their rates compare nationally. Since the start of this series of studies, trends in workers’ compensation systems and insurance markets have resulted in declining differences in states’ rates, a notable trend between 2004 and 2014. A tighter rate distribution (decreasing difference between maximum and minimum values) makes rank values more volatile from one study to the next, in turn making the nu-merical ranking less meaningful.
The tightening of the rate distribution can be seen in Table 6. The maximum range narrowed by more than half between 2004 and 2012. Although the 2014 range increased from the 2012 value, it continued to tighten in other ways, as evidenced a record number of states (21) that fell within plus or minus 10 percent of the study median.
Table 6: Maximum, median, and minimum index rates comparison, 2006 - 2014
Study Year > 2006 2008 2010 2012 2014Maximum 5.00 3.97 3.33 3.01 3.48Median 2.48 2.26 2.04 1.88 1.85Minimum 1.10 1.08 1.02 1.01 0.88Absolute Difference relative to MinimumMax - Min 3.90 2.89 2.31 2.00 2.60Median - Min 1.38 1.18 1.02 0.87 0.97
Table 5. Effect of approved rate changes on premium level in Oregon and countrywide2002 2003 2004 2005 2006 2007 2008 2009 2010 2011 2012 2013
Oregon -0.1% 0.0% 0.0% 0.0% 0.0% -2.1% -2.3% -5.9% -1.3% -1.8% 1.9% 1.4%Avg. countrywide1 4.9% 6.6% -6.0% -5.1% -5.7% -6.6% -3.4% -2.4% -1.0% 0.0% 8.4% 2.2%Source: NCCI Annual Statistical Bulletin, 2014 Edition.Note: Oregon 2002 change reflects net effect of 9/1/01 increase of 2.1% and 1/1/2002 decrease of 2.2%.1The average countrywide values have been recalculated by NCCI to reflect additional states.
7 These 9 are all states that usually review rate changes, if any, in the last half of the calendar year.
8 Ratesineffectasof 1-1-2014wereusedinthestudy.

11
Calendar Year 2014 ■ Oregon Workers’ Compensation Premium Rate Ranking
Figure 5. Net five-year voluntary premium level change, 2010-2014Based on NCCI data
52.3% 28.7%
24.2% 21.4%
17.1% 16.2%
15.6% 15.4% 15.1%
11.1% 9.9%
6.5% 4.0%
3.9% 3.7%
2.9% 1.8% 1.7%
1.3% 0.2%
-1.2% -2.3%
-2.9% -2.9%
-3.6% -4.0% -4.1%
-5.1% -6.8%
-7.5% -8.1% -8.5% -8.9% -9.2% -10.1%
-10.4% -12.7% -12.8% -12.8%
-15.6% -16.6%
-18.8% -19.5%
-25.1% -25.4%
-30.65 -39.1%
-50.0% -40.0% -30.0% -20.0% -10.0% 0.0% 10.0% 20.0% 30.0%
Connecticut New Jersey
Rhode Island
New Mexico
Utah
Kansas
New HampshireVirginia
Minnesota
IndianaWisconsin
Idaho
LouisianaDistrict of Columbia
Michigan
Montana
40.0% 50.0% 60.0%
KentuckyWest Virginia
AlabamaMaineAlaska
ArkansasPennsylvania
OklahomaIllinois
South CarolinaNorth Carolina
TennesseeNevada
NebraskaOregon
GeorgiaMassachusetts
TexasMississippi
South DakotaVermont
MissouriColorado
Arizona
Delaware New York
Iowa California
Maryland
Florida Hawaii
Note: All data are from the NCCI Annual Statistical Bulletin, Exhibit II, 2014 Edition and Oregon rate filing history. Data do not include changes in residual markets. The 2014 component of change is based upon preliminary listings, which may not reflect rate changes for mid-to-late 2014. Data are not available for North Dakota, Ohio, Washington, and Wyoming.

12
Oregon Workers’ Compensation Premium Rate Ranking ■ Calendar Year 2014
2. If differentclasseshadbeenselected,orpayrollfroma state other than Oregon had been used to weight the rates by class, the results would be somewhat different.
3. SeveralstatesuseclassificationsystemsotherthanNCCI, and the conversion is not perfect. Rates for similar classes were used, and these classes were based on the recommendations of respondents in those states.
4. Many states have unique classes within the NCCI system9, or do not have rates for all of the classes. The data were adjusted to account for the classes without rates. When a state had more than one substitute class included in a single NCCI class, the rates were apportioned by class using available data, otherwise they were averaged.
5. The premium rate listed for a class in any state will often not be the rate that an individual employer in that state would pay. Premium rates for an employer are adjusted based on the employer’s experience rating, premium discounts, premium reductions associated with deductibles, retrospective rating, insurer deviations, schedule rating plans, and other modificationplans.
6. Employers in Oregon and many other states have the option to purchase large deductible policies, or to pay a part of some claims’ medical costs (in Oregon, thefirst$1,80010 of costs) to contain expenses and improve experience ratings. These cost-saving measuresarenotreflectedintheindicesrateusedinthisstudy,asthefulleffectsof lossesarereportedandreflected inclass ratesduring theratemakingprocess.
7. In the competitive rating states, individual insurers mayapplydifferentexpenseloadingfactors(losscostmultipliers) to the pure premium rate. This results in a range of premium rates that are available to an employer.
8. The premium rates do not reflect any insurer dividends paid to employers.
9. This study is based on payroll rates.
For Washington, hourly rates must be converted to payroll rates. The Washington payroll data include overtime pay that may overstate the average wage for purposes of premium computation, thus understatingtheeffectiveaveragepayrollrate.
10. Thepayrollbasismaydifferbystate.
• In Nevada and North Dakota, workers’ compensation premium is based on the first $36,000 and $31,800 of payroll per employee, per year, respectively. Anything more than $36,000 in Nevada and $31,800 in North Dakota (up from $25,000 in 2012) is exempt. In order to compare Nevada’s and North Dakota’s index rate with those of other states lacking a payroll limitation, their rates are adjusted according to the proportion of payroll ineachclassificationthat is subject toapremiumcomputationduringfiscalyear2013.The2012studywas thefirst timeNevada’s payroll caphadbeentaken into account; this contributed to their large drop from the 2010 study.
• Payroll base exclusions (e.g., exclusion of vacation pay) exist in Oregon and South Dakota. Manual rates in these states havebeen reduced to reflectNCCI’s estimate of the effect of these payroll exclusions on premium rates. Additionally, some states assess overtime at the full overtime wage, but most states use the normal hourly wage as the payroll basis for overtime hours. This study does not account forthesedifferencesintreatmentof overtime.
11. The premium rates may include more than loss experience and insurer overhead. In some states, assessments and taxes are included in the rates to fund state workers’ compensation agencies or special funds. For states in which some employer assessment liability exists outside workers’ compensation manual rates, assessments are factored into the rates for the purposes of this study, if possible.
9Asdiscussedabove,theclassificationsetusedinthisstudywasexpandedfrom50to54classesinordertoprovideclassesthatweremost commonly used nationally.
10Thisvaluewillchangeannuallywithmedicalpriceinflation.Originallythisvaluewassetat$1,500buthadrisento$1,800 by 2014.

13
Calendar Year 2014 ■ Oregon Workers’ Compensation Premium Rate Ranking
For example, the Oregon Workers’ Compensation premium assessment is billed separately to Oregon employers, and is collected by carriers on behalf of the Department of Consumer and Business Services. This assessment is accounted for in Oregon’s index rate,butitsWorkers’BenefitFund(cents-per-hourassessment) is not.
Assessments/taxes are also factored into the rates for the following states: Alaska, Arkansas, California, Connecticut, Georgia, Idaho, Indiana, Illinois, Kentucky, Louisiana, Maine, Massachusetts, Minnesota, Missouri, Montana, Nebraska, New Jersey, New York, Ohio, Pennsylvania, Rhode Island, Texas, Utah, Vermont, and West Virginia.
12. The data exclude self-insurers’ experience.
13. The rates in a state are influenced by the typesof employers and employees subject to the law, benefitlevels,statutesof limitation,waitingperiods,administration of the law, collective bargaining agreements, litigation activity, characteristics of the labor force, wage levels, medical fees, frequency of claims, loss control programs, and other factors.
14. States with state funds may operate in one of three ways. In North Dakota and Wyoming, workers’ compensation is handled exclusively through a monopoly state fund. Ohio and Washington allow workers’ compensation insurance to be provided either by the state fund or through self-insurance.
Competitive state-fund states allow employers to choose among private insurers, the state fund, or self-insurance. In some competitive state fund states (California, Colorado, Hawaii, Idaho, Mississippi, Missouri, Montana, New York, Oregon, Pennsylvania, Rhode Island, Texas, and Utah), the funds use the same rates or loss costs used by other insurers.
Kentucky, Louisiana, Maryland, Oklahoma, and South Carolina allow their state funds to set their own rates, separate from those used by the private insurers in the state. Louisiana and Oklahoma provided rates and market share information so that the private market and state fund rates could be weighted to derive overall manual rates. The South Carolina state fund is unique in that it only serves state government agencies.
15. Data used for calculating the index rate for California, Delaware, Indiana, Massachusetts, Michigan, Minnesota, New Jersey, New York, Pennsylvania, and Wisconsin were gathered from independent rating bureaus and similar contacts ratherthanstateregulatoryofficials.


15
Calendar Year 2014 ■ Oregon Workers’ Compensation Premium Rate Ranking
Appendices

16
Oregon Workers’ Compensation Premium Rate Ranking ■ Calendar Year 2014
Appendix 1. Occupational classes used for 2014 premium rate ranking
IndexClass code Scope of basic manual classifications
2008 - 2010Oregon payroll
2008 - 2010Oregon losses
1 7219 Trucking: NOC-All Employees & Drivers 1,462,687,561 93,030,8702 9079 Restaurant & Drivers 4,398,201,794 56,395,4353 2702 Logging: Nonmechanized Equip. Operations & Drivers 240,155,126 51,166,6324 8810 Clerical Office Employees NOC 35,794,077,091 49,611,1425 8380 Automobile Service or Repair Center & Drivers 1,646,509,894 45,020,2836 8824 Retirement Living Centers: Health Care Employees 1,144,962,307 36,167,2727 8833 Hospital: Professional Employees 3,378,727,495 30,792,4568 5645 Carpentry - Dwellings Not Exceeding Three Stories In Height 237,682,763 27,971,9959 7380 Drivers, Chauffeurs, Messengers NOC-Commercial 786,379,574 26,793,316
10 9015 Buildings - Operation by Owner or Lessee & Drivers 883,841,251 25,605,39711 8868 College: Professional Employees & Clerical 7,304,026,745 25,518,04012 8832 Physician & Clerical 6,737,289,705 23,261,01313 8017 Store: Retail NOC 2,199,088,458 22,906,35414 8742 Salespersons or Collectors-Outside 9,651,924,847 21,829,99715 8232 Lumberyard: All Other Employees 426,558,410 19,634,34416 5551 Roofing-All Kinds & Drivers 159,857,913 18,226,82517 8033 STORE: Meat, Grocery & Provision Combined-Retail NOC 904,954,351 17,791,78618 9052 Hotel: All Other Employees & Salespersons, Drivers 725,779,614 17,146,61319 9014 Chimney Cleaning - Residential & Drivers 461,599,225 16,170,40620 0005 Farm: Nursery Employees & Drivers 600,429,064 15,280,92721 0037 Farm: Field Crops & Drivers 391,290,131 14,337,12422 7720 Police Officers & Drivers 603,829,451 14,076,00423 5403 Carpentry NOC 331,693,099 14,037,92024 9403 Garbage, Ashes or Refuse Collection & Drivers 304,643,133 13,907,11125 9101 College: All Other Employees 430,841,712 13,779,38826 5190 Electrical Wiring-Within Buildings & Drivers 720,339,585 13,734,16727 8018 Store - Vegetable or Fruit - Wholesale 693,281,649 13,626,00428 5183 Plumbing NOC & Drivers 498,118,880 13,003,29829 7600 Telecommunications - Cable or Satellite - All Other Employees 405,755,279 12,256,26930 5474 Painting NOC & Shop Operations, Drivers 236,205,793 12,134,72331 3724 Machinery or Equipment Erection or Repair NOC & Drivers 311,044,818 11,171,83032 3632 Machine Shop NOC 411,348,503 10,610,52433 2802 Carpentry-Shop Only-& Drivers 300,624,053 10,424,46534 8835 Home, Public, and Traveling Healthcare--All Employees 333,952,339 10,350,45335 6217 Excavation & Drivers 319,337,616 10,334,41436 8006 Gasoline Station: Self-Serve & Convenience/Grocery-Retail 616,331,232 9,357,55937 2731 Planing or Molding Mill 223,401,748 9,019,04538 5506 Street or Road Construction: Paving or Repaving & Drivers 192,459,684 8,960,82239 0083 Farm: Cattle or Livestock Raising Noc & Drivers 61,241,320 8,715,93640 5213 Concrete Construction NOC 212,880,906 8,558,87741 2915 Veneer Products Mfg 231,039,695 8,545,79742 5445 Wallboard, Installation - Within Buildings & Drivers 112,450,862 8,257,30143 0106 Tree Pruning, Spraying, Repairing -- All Operations & Drivers 86,655,180 8,151,58244 0016 Farm - Orchard or Grove & Drivers 221,311,587 8,008,03545 5221 Concrete Construction NOC 195,296,620 7,996,06246 7403 Aviation: All Other Employees & Drivers 406,704,001 7,955,97147 8842 Mental Health Group Care Homes--All Employees & Drivers 392,580,819 7,558,37048 7382 Bus Co.: All Other Employees & Drivers 213,368,451 7,418,48849 7539 Electric Light or Power Co. Noc-All Employees & Drivers 406,658,124 7,412,87250 8046 Store: Automobile Parts & Accessories- NOC & Drivers 494,553,624 7,271,497
Note: To more closely approximate the typical state’s coding methodology, State special code 9079 (Restaurant NOC & Drivers) was split into four codes for the survey: 9058 (Hotel: Restaurant Employees), 9082 (Restaurant NOC), 9083 (Restaurant: Fast Food), and 9084 (Bar, Discotheque, Lounge, Night Club or Tavern).
State special code 7219 (Trucking: Local & Long haul - all employees & drivers) was split into two codes for the survey, 7228 (Trucking: Local hauling - all employees & drivers) and 7229 (Trucking: Long distance hauling - all employees & drivers).
Source: Information Technology & Research Section, Central Services Division, Oregon Department of Consumer and Business Services (2/2014)

17
Calendar Year 2014 ■ Oregon Workers’ Compensation Premium Rate Ranking
Appendix 2. 2013 assigned risk pool size, by state, for coverages in pools managed by NCCI
StateARP as a percent of
direct premiums written2013
Number of ARP risks Alabama 4.3% 1,618Alaska 15.3% 8,273Arizona 6.6% 3,648Arkansas 10.1% 6,405Connecticut 6.5% 12,355Delaware 16.0% 2,402District of Columbia 6.2% 1,240Georgia 5.5% 16,596Idaho 0.6% 596Illinois 5.3% 27,344Indiana NA 8,028Iowa 6.3% 4,546Kansas 10.7% 8,944Massachusetts 19.9% NAMichigan 6.8% NAMississippi NA 2,574Nevada 9.5% 4,417New Hampshire 10.3% 5,367New Jersey 12.0% 35,844New Mexico 5.6% 2,657North Carolina 5.3% 20,732Oregon 6.8% 8,794South Carolina 5.6% 10,293South Dakota 6.3% 1,609Vermont 11.1% 3,615Virginia 7.1% 14,346West Virginia 5.4% 2,149
Partial national average = 8.2% 8,576N/A=Not available
Source: Residual Market Management Summary 2013, NCCI, 2014.

18
Oregon Workers’ Compensation Premium Rate Ranking ■ Calendar Year 2014
Appendix 3. Voluntary premium level changes, 2010-2014
State2010
% change2011
% change2012
% change2013
% change2014
% change1Effective date
of latest changeAlabama (5.8) (12.4) (9.2) 4.0 3.3 3/1/14Alaska (10.3) (2.5) 2.7 (4.7) (2.6) 1/1/14Arizona (4.2) (2.8) 5.2 2.9 3.2 1/1/14Arkansas 1.9 (5.8) (4.1) (8.3) (1.4) 7/1/13California 0.0 0.0 0.4 7.6 7.6 1/1/14Colorado (9.7) 3.3 3.7 4.3 3.0 1/1/14Connecticut 2.5 5.8 4.6 6.1 3.2 1/1/14Delaware (2.5) 12.6 21.7 14.0 0.0 12/1/13District of Columbia (5.3) 6.2 0.4 1.9 0.0 11/1/13Florida (11.0) 7.8 8.9 5.6 0.7 1/1/14Georgia 0.0 (3.7) 3.0 (6.5) 2.3 3/1/14Hawaii (4.1) 0.0 3.6 4.2 6.2 1/1/14Idaho (2.6) 3.7 2.9 3.4 (0.9) 1/1/14Illinois 0.0 (7.3) 3.5 (4.7) (4.5) 1/1/14Indiana (1.7) 1.7 2.6 4.4 (7.7) 1/1/14Iowa 2.3 4.7 4.4 6.9 (2.0) 1/1/14Kansas (6.1) (2.5) (0.5) 1.4 0.9 1/1/14Kentucky (10.3) (7.5) (7.9) (9.0) 0.0 10/1/13Louisiana (4.3) 4.2 6.0 1.5 (5.1) 5/1/14Maine (7.0) 0.4 (7.0) 1.3 (7.7) 4/1/14Maryland 3.2 5.7 1.4 2.9 1.4 1/1/14Massachusetts (2.3) 0.0 0.0 0.0 (1.8) 4/1/14Michigan (3.1) (1.9) (7.4) (7.2) (8.3) 1/1/14Minnesota (2.4) (1.7) (2.7) (0.8) (2.0) 1/1/14Mississippi (9.2) (9.8) 10.0 3.1 3.8 3/1/14Missouri (1.9) (4.4) (3.0) 2.1 11.6 1/1/14Montana (6.4) (28.0) (6.2) (3.6) (3.6) 7/1/13Nebraska (3.2) (4.5) 4.9 (0.4) (4.8) 2/1/14Nevada 2 (7.6) (3.9) 1.0 (1.1) 3.2 3/1/14New Hampshire 0.4 (2.9) 6.7 (0.2) (6.5) 1/1/14New Jersey (2.6) 3.9 6.9 8.3 3.6 1/1/14New Mexico (4.5) 4.2 7.4 4.0 4.0 1/1/14New York 7.7 9.1 0.0 9.5 0.0 10/1/13North Carolina (9.6) 0.6 0.0 (1.4) 0.3 4/1/14Oklahoma 2.5 1.7 (1.7) (0.3) (14.6) 1/1/14Oregon (1.3) (1.8) 1.9 1.4 (7.6) 1/1/14Pennsylvania 0.7 0.9 (5.7) (4.0) (5.2) 4/1/14Rhode Island (0.9) 3.6 5.3 6.5 0.0 8/1/13South Carolina (9.8) (3.7) 3.0 0.2 0.0 9/1/13South Dakota 4.4 1.2 (0.2) (3.9) (8.3) 7/1/13Tennessee (0.1) 1.2 (4.7) 1.6 (12.9) 3/1/14Texas 0.0 0.0 (0.3) (3.8) 0.1 6/1/14Utah (0.2) 1.5 (1.6) (2.0) 0.0 12/1/13Vermont (4.1) (2.60) 4.1 3.40 1.2 4/1/14Virginia 3.0 (12.4) 10.5 (6.4) 4.1 4/1/14West Virginia (5.8) (7.6) (7.6) (7.2) 0.0 11/1/13Wisconsin 3.4 (0.01) (1.4) (1.73) 0.0 10/1/13NA=Not available
Note: All data are from the NCCI Annual Statistical Bulletin, 2014 Edition and Oregon rate filing history. Data does not include changes in residual markets. Data are not available for North Dakota, Ohio, Washington, and Wyoming.1 Preliminary Listing. May not reflect rate changes scheduled for mid- to late 2014.2 Nevada premium is based on the first $36,000 of reportable payroll per employee per employer per year.

19
Calendar Year 2014 ■ Oregon Workers’ Compensation Premium Rate Ranking
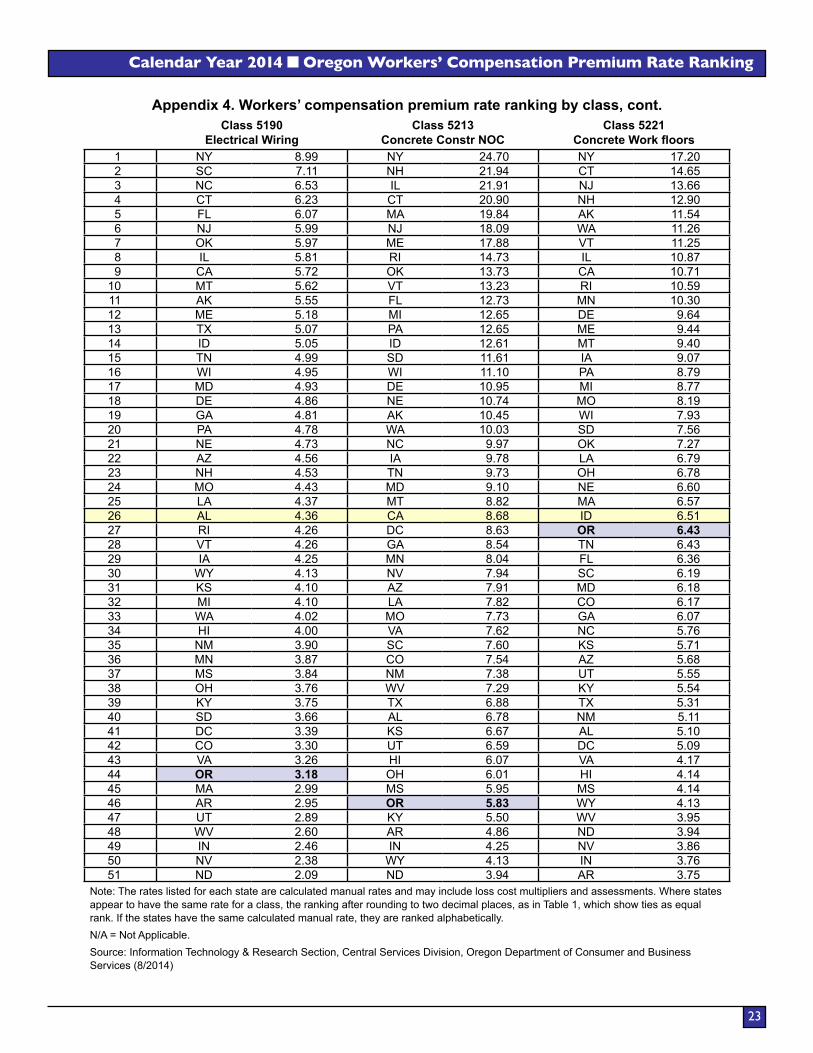
Appendix 4. Workers’ compensation premium rate ranking by classClass 5
Farm: NurseryClass 16
Farm: Orchard/GroveClass 37
Farm: Field Crops1 CT 7.93 NC 11.99 CA 11.49 2 DE 7.62 CA 11.97 NH 10.33 3 NJ 7.46 ID 11.77 OK 9.71 4 MN 7.30 FL 11.24 ME 9.40 5 CA 6.84 OK 10.65 LA 8.38 6 PA 6.63 VT 10.35 NY 8.09 7 WI 6.01 MT 9.22 AK 7.91 8 FL 5.85 WI 9.22 UT 7.86 9 ID 5.79 AZ 9.15 CO 6.85
10 VT 5.72 CT 9.05 DE 6.59 11 RI 5.66 ME 8.74 AZ 6.55 12 AK 5.51 RI 8.70 ID 6.53 13 WY 5.51 NM 8.53 MT 6.46 14 WA 5.50 MO 8.43 SC 6.45 15 IA 5.49 AL 8.27 CT 6.34 16 MT 5.39 MD 8.06 NE 6.34 17 MO 5.33 IA 8.03 NM 6.29 18 IL 5.28 LA 8.02 WA 6.26 19 NH 5.13 NH 8.00 SD 6.21 20 ME 4.96 AK 7.91 MN 6.20 21 OK 4.90 KS 7.79 FL 6.17 22 MI 4.81 IL 7.74 MO 6.10 23 NM 4.76 SD 7.67 TX 5.99 24 HI 4.30 TX 7.66 VT 5.84 25 SC 4.26 NY 7.12 PA 5.81 26 NE 4.19 TN 6.99 IA 5.62 27 NC 4.13 MN 6.85 WY 5.50 28 NV 4.11 MS 6.72 GA 5.43 29 CO 4.10 NE 6.35 MD 5.37 30 SD 4.03 UT 6.15 KS 5.23 31 GA 4.02 HI 6.14 RI 5.20 32 KS 3.91 NJ 6.07 TN 5.19 33 LA 3.84 GA 5.98 WV 5.16 34 OH 3.75 KY 5.88 MI 4.91 35 TX 3.62 SC 5.88 WI 4.90 36 AL 3.46 DC 5.78 IL 4.75 37 TN 3.34 CO 5.73 NC 4.75 38 NY 3.33 WY 5.51 AL 4.71 39 AZ 3.22 WV 5.39 OR 4.60 40 KY 3.16 DE 5.26 NV 4.49 41 MA 3.06 NV 5.21 VA 4.27 42 IN 2.83 WA 5.20 DC 3.94 43 DC 2.78 VA 5.04 MS 3.92 44 OR 2.75 OR 4.67 OH 3.90 45 WV 2.61 IN 4.43 KY 3.46 46 MS 2.59 PA 4.39 HI 3.37 47 MD 2.55 MI 4.33 IN 3.22 48 UT 2.47 MA 3.81 AR 3.00 49 AR 2.37 AR 3.80 NJ 2.89 50 VA 2.32 OH 3.72 MA 2.55 51 ND 1.90 ND 1.44 ND 1.44
Note: The rates listed for each state are calculated manual rates and may include loss cost multipliers and assessments. Where states appear to have the same rate for a class, the ranking after rounding to two decimal places, as in Table 1, which show ties as equal rank. If the states have the same calculated manual rate, they are ranked alphabetically.N/A = Not Applicable.Source: Information Technology & Research Section, Central Services Division, Oregon Department of Consumer and Business Services (8/2014)

20
Oregon Workers’ Compensation Premium Rate Ranking ■ Calendar Year 2014
Appendix 4. Workers’ compensation premium rate ranking by class, cont.Class 83
Farm: Cattle/LivestockClass 106
Tree PruningClass 2702
Logging or Lumbering1 CA 22.21 OH 50.97 TN 108.79 2 AK 16.25 NC 31.19 KY 80.02 3 AZ 15.98 CT 30.92 IL 74.83 4 OR 15.72 CA 30.69 NY 64.18 5 ID 13.95 DE 29.10 LA 55.96 6 WA 12.00 NH 27.16 AK 50.82 7 CT 11.99 MS 26.79 CT 50.38 8 MT 11.75 PA 26.33 WI 49.12 9 NM 10.71 SC 26.27 MO 45.80
10 CO 10.64 NV 25.98 OH 45.25 11 LA 10.63 LA 25.63 DE 43.50 12 NV 9.36 VT 24.92 WV 38.18 13 ME 9.03 GA 24.21 PA 38.08 14 IL 9.02 MD 23.70 VT 32.79 15 SD 9.01 NJ 23.41 GA 32.57 16 NE 8.99 AK 23.21 KS 32.35 17 IA 8.91 AZ 22.78 MS 32.27 18 NH 8.90 OK 21.53 CA 30.42 19 VT 8.90 IL 21.48 NJ 30.17 20 NJ 8.36 WV 20.55 AR 29.72 21 DE 8.34 SD 20.10 RI 29.30 22 MD 8.27 NY 19.82 HI 28.40 23 WY 8.14 TN 19.76 NM 27.30 24 NY 8.09 FL 19.09 IA 27.14 25 OK 7.97 ME 18.93 OR 26.58 26 RI 7.95 AL 17.75 MD 25.96 27 SC 7.83 NE 16.92 NH 25.85 28 GA 7.56 NM 16.90 NE 25.47 29 MO 7.41 MI 16.37 MT 25.01 30 FL 7.36 HI 15.98 AZ 24.14 31 OH 7.32 MA 15.90 WA 24.14 32 HI 7.30 OR 15.70 ID 23.57 33 AL 7.20 ID 15.24 SD 23.44 34 PA 7.19 MT 15.00 VA 23.33 35 TN 7.18 RI 14.88 NC 22.35 36 KY 6.56 WI 14.83 ME 21.36 37 UT 6.49 MO 14.21 UT 21.33 38 TX 6.42 AR 13.66 OK 20.26 39 KS 6.30 IA 13.34 DC 19.60 40 MN 6.20 MN 13.34 IN 17.74 41 MS 5.66 CO 12.59 SC 17.46 42 MA 5.65 KY 12.26 NV 17.30 43 DC 5.31 UT 12.16 TX 17.24 44 VA 4.94 VA 11.29 MA 16.82 45 WI 4.90 WA 10.34 MI 16.64 46 WV 4.82 KS 10.28 CO 16.63 47 NC 4.74 DC 10.17 MN 15.62 48 ND 3.99 IN 10.17 FL 14.47 49 IN 3.98 TX 8.87 AL 13.40 50 MI 3.87 WY 5.10 WY 9.82 51 AR 3.32 ND 3.81 ND 7.16
Note: The rates listed for each state are calculated manual rates and may include loss cost multipliers and assessments. Where states appear to have the same rate for a class, the ranking after rounding to two decimal places, as in Table 1, which show ties as equal rank. If the states have the same calculated manual rate, they are ranked alphabetically.N/A = Not Applicable.Source: Information Technology & Research Section, Central Services Division, Oregon Department of Consumer and Business Services (8/2014)

21
Calendar Year 2014 ■ Oregon Workers’ Compensation Premium Rate Ranking
Appendix 4. Workers’ compensation premium rate ranking by class, cont.Class 2731
Planing/Molding MillClass 2802
Carpentry-Shop OnlyClass 2915
Veneer Products Mfg1 DE 12.92 CA 15.55 DE 12.92 2 ID 11.08 DE 12.92 CA 10.63 3 AK 10.65 CT 12.53 WI 9.95 4 VT 10.55 OK 10.72 NJ 8.72 5 MT 9.87 NY 9.31 WA 7.83 6 WI 9.52 VT 8.87 WY 7.28 7 CT 9.25 NJ 8.72 CT 7.02 8 OK 8.87 IL 8.67 NY 7.01 9 NE 8.77 AK 8.59 AK 6.55
10 AZ 8.74 ID 8.55 PA 6.55 11 NJ 8.72 WA 8.49 RI 6.47 12 ME 8.68 LA 8.47 VT 6.07 13 CA 8.55 AL 8.27 IL 6.03 14 NY 8.42 KS 8.24 CO 5.39 15 WA 8.22 FL 7.91 MT 5.06 16 RI 7.43 NH 7.90 MO 5.01 17 IL 7.18 IA 7.48 KS 4.88 18 NH 7.13 RI 7.48 ME 4.84 19 MI 7.05 NM 7.46 IA 4.80 20 LA 6.60 MO 7.41 OR 4.80 21 PA 6.55 SD 7.30 NH 4.80 22 FL 6.14 ME 7.26 OK 4.72 23 NM 6.12 MT 7.15 HI 4.64 24 AL 6.03 SC 7.11 SD 4.63 25 OR 5.96 NE 6.63 NE 4.61 26 WY 5.82 MI 6.59 SC 4.58 27 HI 5.69 PA 6.55 NM 4.57 28 SD 5.69 MS 6.39 TN 4.55 29 SC 5.57 TX 6.29 TX 4.35 30 MD 5.42 TN 6.04 GA 4.34 31 MA 5.23 CO 5.93 LA 4.31 32 CO 5.13 AZ 5.74 MD 4.29 33 KS 5.07 WV 5.67 OH 4.06 34 NC 5.02 HI 5.65 ID 4.01 35 GA 4.84 UT 5.25 NC 3.77 36 TN 4.84 GA 5.21 AL 3.73 37 MN 4.68 NC 5.13 MN 3.66 38 OH 4.67 MA 5.03 VA 3.58 39 MO 4.63 MD 5.02 NV 3.36 40 TX 4.58 KY 4.82 AZ 3.35 41 MS 4.50 WI 4.78 ND 3.29 42 IA 4.41 OR 4.39 WV 3.26 43 NV 4.35 NV 4.28 MI 3.15 44 VA 4.16 AR 4.13 MS 3.13 45 AR 4.00 WY 4.13 KY 2.88 46 IN 3.98 DC 3.99 DC 2.84 47 UT 3.92 IN 3.50 FL 2.76 48 DC 3.62 MN 3.42 UT 2.59 49 ND 3.29 ND 3.29 IN 2.54 50 WV 3.14 VA 3.26 AR 1.86 51 KY 2.60 OH 3.05 MA N/A
Note: The rates listed for each state are calculated manual rates and may include loss cost multipliers and assessments. Where states appear to have the same rate for a class, the ranking after rounding to two decimal places, as in Table 1, which show ties as equal rank. If the states have the same calculated manual rate, they are ranked alphabetically.N/A = Not Applicable.Source: Information Technology & Research Section, Central Services Division, Oregon Department of Consumer and Business Services (8/2014)
22
Oregon Workers’ Compensation Premium Rate Ranking ■ Calendar Year 2014
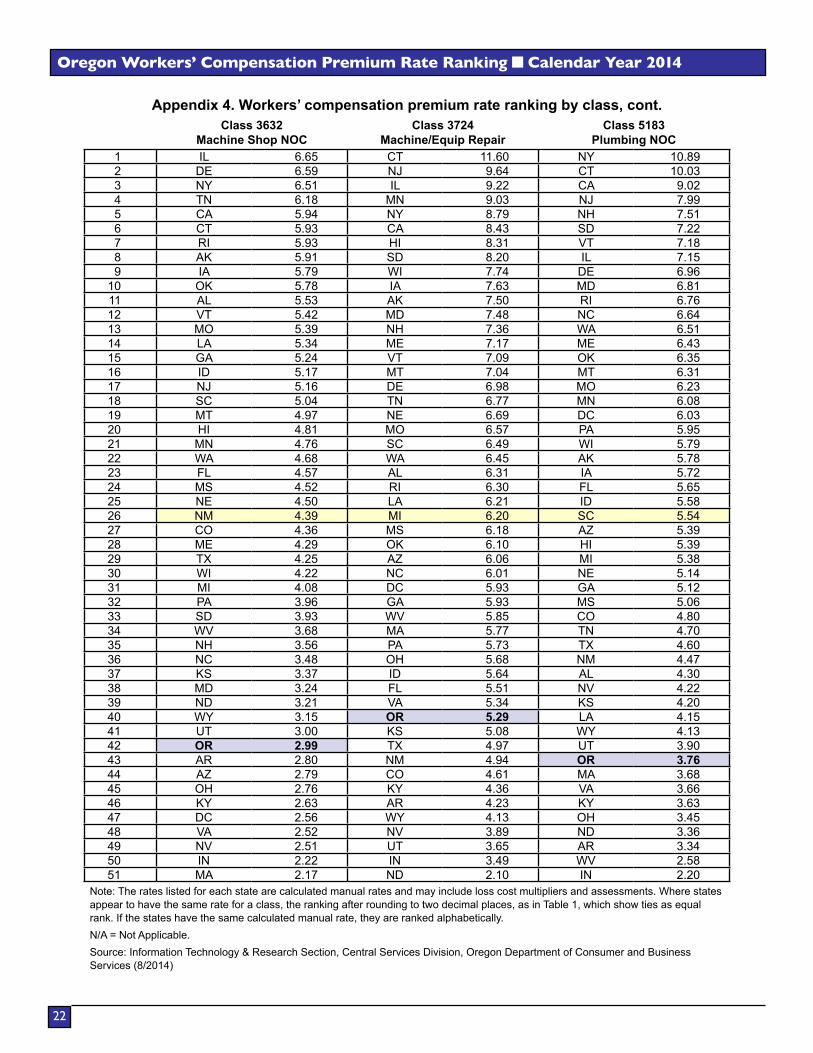
Appendix 4. Workers’ compensation premium rate ranking by class, cont.Class 3632
Machine Shop NOCClass 3724
Machine/Equip RepairClass 5183
Plumbing NOC1 IL 6.65 CT 11.60 NY 10.89 2 DE 6.59 NJ 9.64 CT 10.03 3 NY 6.51 IL 9.22 CA 9.02 4 TN 6.18 MN 9.03 NJ 7.99 5 CA 5.94 NY 8.79 NH 7.51 6 CT 5.93 CA 8.43 SD 7.22 7 RI 5.93 HI 8.31 VT 7.18 8 AK 5.91 SD 8.20 IL 7.15 9 IA 5.79 WI 7.74 DE 6.96
10 OK 5.78 IA 7.63 MD 6.81 11 AL 5.53 AK 7.50 RI 6.76 12 VT 5.42 MD 7.48 NC 6.64 13 MO 5.39 NH 7.36 WA 6.51 14 LA 5.34 ME 7.17 ME 6.43 15 GA 5.24 VT 7.09 OK 6.35 16 ID 5.17 MT 7.04 MT 6.31 17 NJ 5.16 DE 6.98 MO 6.23 18 SC 5.04 TN 6.77 MN 6.08 19 MT 4.97 NE 6.69 DC 6.03 20 HI 4.81 MO 6.57 PA 5.95 21 MN 4.76 SC 6.49 WI 5.79 22 WA 4.68 WA 6.45 AK 5.78 23 FL 4.57 AL 6.31 IA 5.72 24 MS 4.52 RI 6.30 FL 5.65 25 NE 4.50 LA 6.21 ID 5.58 26 NM 4.39 MI 6.20 SC 5.54 27 CO 4.36 MS 6.18 AZ 5.39 28 ME 4.29 OK 6.10 HI 5.39 29 TX 4.25 AZ 6.06 MI 5.38 30 WI 4.22 NC 6.01 NE 5.14 31 MI 4.08 DC 5.93 GA 5.12 32 PA 3.96 GA 5.93 MS 5.06 33 SD 3.93 WV 5.85 CO 4.80 34 WV 3.68 MA 5.77 TN 4.70 35 NH 3.56 PA 5.73 TX 4.60 36 NC 3.48 OH 5.68 NM 4.47 37 KS 3.37 ID 5.64 AL 4.30 38 MD 3.24 FL 5.51 NV 4.22 39 ND 3.21 VA 5.34 KS 4.20 40 WY 3.15 OR 5.29 LA 4.15 41 UT 3.00 KS 5.08 WY 4.13 42 OR 2.99 TX 4.97 UT 3.90 43 AR 2.80 NM 4.94 OR 3.76 44 AZ 2.79 CO 4.61 MA 3.68 45 OH 2.76 KY 4.36 VA 3.66 46 KY 2.63 AR 4.23 KY 3.63 47 DC 2.56 WY 4.13 OH 3.45 48 VA 2.52 NV 3.89 ND 3.36 49 NV 2.51 UT 3.65 AR 3.34 50 IN 2.22 IN 3.49 WV 2.58 51 MA 2.17 ND 2.10 IN 2.20
Note: The rates listed for each state are calculated manual rates and may include loss cost multipliers and assessments. Where states appear to have the same rate for a class, the ranking after rounding to two decimal places, as in Table 1, which show ties as equal rank. If the states have the same calculated manual rate, they are ranked alphabetically.N/A = Not Applicable.Source: Information Technology & Research Section, Central Services Division, Oregon Department of Consumer and Business Services (8/2014)
23
Calendar Year 2014 ■ Oregon Workers’ Compensation Premium Rate Ranking
Appendix 4. Workers’ compensation premium rate ranking by class, cont.Class 5190
Electrical WiringClass 5213
Concrete Constr NOCClass 5221
Concrete Work floors1 NY 8.99 NY 24.70 NY 17.20 2 SC 7.11 NH 21.94 CT 14.65 3 NC 6.53 IL 21.91 NJ 13.66 4 CT 6.23 CT 20.90 NH 12.90 5 FL 6.07 MA 19.84 AK 11.54 6 NJ 5.99 NJ 18.09 WA 11.26 7 OK 5.97 ME 17.88 VT 11.25 8 IL 5.81 RI 14.73 IL 10.87 9 CA 5.72 OK 13.73 CA 10.71
10 MT 5.62 VT 13.23 RI 10.59 11 AK 5.55 FL 12.73 MN 10.30 12 ME 5.18 MI 12.65 DE 9.64 13 TX 5.07 PA 12.65 ME 9.44 14 ID 5.05 ID 12.61 MT 9.40 15 TN 4.99 SD 11.61 IA 9.07 16 WI 4.95 WI 11.10 PA 8.79 17 MD 4.93 DE 10.95 MI 8.77 18 DE 4.86 NE 10.74 MO 8.19 19 GA 4.81 AK 10.45 WI 7.93 20 PA 4.78 WA 10.03 SD 7.56 21 NE 4.73 NC 9.97 OK 7.27 22 AZ 4.56 IA 9.78 LA 6.79 23 NH 4.53 TN 9.73 OH 6.78 24 MO 4.43 MD 9.10 NE 6.60 25 LA 4.37 MT 8.82 MA 6.57 26 AL 4.36 CA 8.68 ID 6.51 27 RI 4.26 DC 8.63 OR 6.43 28 VT 4.26 GA 8.54 TN 6.43 29 IA 4.25 MN 8.04 FL 6.36 30 WY 4.13 NV 7.94 SC 6.19 31 KS 4.10 AZ 7.91 MD 6.18 32 MI 4.10 LA 7.82 CO 6.17 33 WA 4.02 MO 7.73 GA 6.07 34 HI 4.00 VA 7.62 NC 5.76 35 NM 3.90 SC 7.60 KS 5.71 36 MN 3.87 CO 7.54 AZ 5.68 37 MS 3.84 NM 7.38 UT 5.55 38 OH 3.76 WV 7.29 KY 5.54 39 KY 3.75 TX 6.88 TX 5.31 40 SD 3.66 AL 6.78 NM 5.11 41 DC 3.39 KS 6.67 AL 5.10 42 CO 3.30 UT 6.59 DC 5.09 43 VA 3.26 HI 6.07 VA 4.17 44 OR 3.18 OH 6.01 HI 4.14 45 MA 2.99 MS 5.95 MS 4.14 46 AR 2.95 OR 5.83 WY 4.13 47 UT 2.89 KY 5.50 WV 3.95 48 WV 2.60 AR 4.86 ND 3.94 49 IN 2.46 IN 4.25 NV 3.86 50 NV 2.38 WY 4.13 IN 3.76 51 ND 2.09 ND 3.94 AR 3.75
Note: The rates listed for each state are calculated manual rates and may include loss cost multipliers and assessments. Where states appear to have the same rate for a class, the ranking after rounding to two decimal places, as in Table 1, which show ties as equal rank. If the states have the same calculated manual rate, they are ranked alphabetically.N/A = Not Applicable.Source: Information Technology & Research Section, Central Services Division, Oregon Department of Consumer and Business Services (8/2014)

24
Oregon Workers’ Compensation Premium Rate Ranking ■ Calendar Year 2014
Appendix 4. Workers’ compensation premium rate ranking by class, cont.Class 5403
Carpentry NOCClass 5445
Wallboard InstallationClass 5474
Painting NOC1 CT 25.08 ME 19.69 CT 18.12 2 MN 23.71 VT 15.75 NH 16.18 3 NJ 20.17 NH 15.29 DE 14.61 4 NY 17.77 WA 13.92 ME 13.55 5 ME 17.62 GA 13.71 NJ 13.50 6 NH 16.07 CT 12.89 NY 13.34 7 RI 15.87 NY 12.56 GA 13.23 8 IL 15.70 DE 11.03 MT 12.78 9 IA 15.22 NC 10.78 MN 12.64
10 MI 15.16 OR 10.43 AK 12.11 11 WI 15.13 IL 10.10 CA 11.89 12 WA 14.85 OK 9.84 IL 11.81 13 MT 14.84 SD 9.70 SC 11.43 14 SD 14.67 CA 9.69 WI 11.33 15 LA 14.66 WI 9.68 MI 11.22 16 ID 13.76 ID 9.53 PA 11.09 17 AZ 13.72 AL 9.52 FL 11.01 18 VT 13.40 NE 9.36 LA 10.14 19 CA 13.17 TN 9.32 MO 9.91 20 NE 12.66 IA 9.28 NM 9.90 21 AL 12.09 SC 9.23 ID 9.72 22 FL 11.92 PA 9.08 RI 9.70 23 NM 11.59 MT 8.99 AZ 9.66 24 GA 11.36 AK 8.72 OK 9.30 25 OK 11.06 LA 8.72 OH 9.14 26 AK 10.86 NJ 8.62 KY 9.11 27 DE 10.84 MI 8.55 NC 8.71 28 SC 10.77 MN 8.34 VT 8.54 29 TN 10.44 RI 8.19 WA 8.17 30 KY 10.27 MS 8.18 SD 8.09 31 MA 10.11 FL 7.98 AL 7.83 32 PA 10.10 MA 7.62 MD 7.74 33 MD 9.90 CO 7.21 IA 7.72 34 NC 9.76 MO 7.12 CO 7.71 35 HI 9.21 UT 7.07 NE 7.66 36 MO 9.14 MD 7.03 TN 7.49 37 NV 8.80 OH 6.64 KS 7.42 38 KS 8.66 ND 6.61 OR 6.93 39 TX 8.57 TX 6.47 MS 6.83 40 MS 8.27 AZ 6.46 VA 6.46 41 WV 7.12 NM 6.25 TX 6.34 42 OR 7.01 KY 6.04 UT 6.12 43 AR 6.74 KS 5.81 HI 5.75 44 UT 6.73 DC 5.71 NV 5.38 45 CO 6.68 AR 5.15 MA 5.36 46 ND 6.61 VA 4.55 WV 5.21 47 VA 6.43 WV 4.49 AR 5.19 48 IN 5.86 NV 4.35 IN 4.57 49 OH 5.83 HI 4.21 ND 4.31 50 DC 5.79 WY 4.13 WY 4.13 51 WY 4.13 IN 3.84 DC 4.08
Note: The rates listed for each state are calculated manual rates and may include loss cost multipliers and assessments. Where states appear to have the same rate for a class, the ranking after rounding to two decimal places, as in Table 1, which show ties as equal rank. If the states have the same calculated manual rate, they are ranked alphabetically.N/A = Not Applicable.Source: Information Technology & Research Section, Central Services Division, Oregon Department of Consumer and Business Services (8/2014)

25
Calendar Year 2014 ■ Oregon Workers’ Compensation Premium Rate Ranking
Appendix 4. Workers’ compensation premium rate ranking by class, cont.Class 5506
Street/Road PavingClass 5551
Roofing-All KindsClass 5645
Carpentry-Det Dwellings1 NY 24.01 CT 55.17 GA 27.48 2 CT 20.36 MN 51.20 CT 25.82 3 DE 16.53 NJ 42.75 SC 23.53 4 OK 14.39 MT 40.15 NH 21.36 5 SD 12.94 GA 37.23 TN 20.51 6 CA 12.51 SC 36.03 NJ 20.17 7 MT 12.40 MI 35.63 IL 19.88 8 RI 11.96 NH 35.08 NC 18.64 9 NJ 11.95 NY 32.42 NM 18.58
10 LA 11.75 DE 30.02 LA 17.36 11 NM 11.73 MD 28.30 AL 16.74 12 NE 11.33 IL 28.17 NY 16.67 13 NH 10.93 RI 27.66 AZ 16.51 14 AZ 10.92 CA 27.29 FL 16.26 15 IA 10.92 MO 27.21 AK 16.16 16 IL 10.81 ID 27.07 KY 15.85 17 MD 10.55 AL 26.91 WI 15.85 18 KY 9.97 TN 26.88 MI 15.31 19 MN 9.95 WA 26.50 MO 15.31 20 SC 9.92 VT 26.28 VT 15.27 21 PA 9.91 WI 26.10 MN 15.20 22 ME 9.71 LA 25.65 SD 15.04 23 GA 9.66 MA 25.29 OK 15.01 24 WV 9.45 PA 24.83 ID 14.87 25 FL 9.30 ME 24.82 OR 14.50 26 MI 9.17 SD 24.79 MS 14.11 27 MO 8.91 UT 23.77 MT 13.83 28 TX 8.48 NM 23.71 WV 13.74 29 NC 8.42 IA 23.40 DE 13.68 30 NV 8.41 NC 21.91 KS 13.45 31 TN 8.32 AZ 21.54 ME 13.35 32 VT 7.96 NE 20.68 UT 13.34 33 VA 7.92 AK 20.65 CA 13.17 34 MA 7.42 OK 19.86 WA 13.03 35 ID 7.34 MS 19.60 NE 12.85 36 WA 7.26 HI 19.40 PA 12.44 37 AL 7.23 OH 19.16 MD 12.38 38 HI 7.17 VA 18.81 IA 12.19 39 DC 7.08 KY 18.69 RI 10.28 40 OR 6.62 FL 18.56 VA 10.04 41 KS 6.42 CO 17.51 CO 9.86 42 AK 6.40 WV 17.26 AR 9.39 43 OH 6.30 KS 17.24 MA 9.13 44 MS 6.07 OR 15.44 OH 8.66 45 CO 5.82 TX 14.11 TX 8.57 46 AR 5.64 DC 13.82 HI 8.40 47 IN 5.54 NV 11.84 IN 7.85 48 WY 3.53 AR 11.76 NV 7.39 49 ND 2.84 IN 10.88 DC 6.85 50 WI 2.29 ND 10.20 ND 6.61 51 UT N/A WY 4.13 WY 6.13
Note: The rates listed for each state are calculated manual rates and may include loss cost multipliers and assessments. Where states appear to have the same rate for a class, the ranking after rounding to two decimal places, as in Table 1, which show ties as equal rank. If the states have the same calculated manual rate, they are ranked alphabetically.N/A = Not Applicable.Source: Information Technology & Research Section, Central Services Division, Oregon Department of Consumer and Business Services (8/2014)

26
Oregon Workers’ Compensation Premium Rate Ranking ■ Calendar Year 2014
Appendix 4. Workers’ compensation premium rate ranking by class, cont.Class 6217
Excavation NOCClass 7228
Trucking (Local)Class 7229
Trucking (Long Dist.)1 ME 13.43 NJ 18.30 CT 19.67 2 CT 12.21 NY 16.10 NJ 18.30 3 NY 11.96 LA 13.97 NY 16.10 4 NJ 11.43 CT 13.85 IL 15.75 5 VT 11.42 MI 13.47 CA 15.62 6 NH 11.00 IL 13.46 ME 15.26 7 WA 10.89 OH 13.24 NC 14.75 8 NE 10.24 VT 13.04 RI 14.13 9 MT 10.16 WA 12.76 LA 13.97
10 MI 9.96 AK 12.56 OK 13.93 11 NC 9.54 DE 12.15 MI 13.47 12 OK 9.36 CA 11.58 MO 12.87 13 TN 9.10 OK 11.30 VT 12.72 14 CA 9.08 PA 11.06 AK 12.56 15 IL 8.88 NC 11.04 WA 12.39 16 AK 8.79 IA 10.85 SC 12.28 17 SC 8.79 HI 10.31 DE 12.15 18 KY 8.73 SC 10.30 MD 11.84 19 IA 8.46 ID 10.24 MN 11.82 20 DE 8.44 TX 10.11 HI 11.57 21 WI 8.41 NM 10.05 IA 11.18 22 AL 8.08 WI 10.05 PA 11.06 23 MN 7.92 MO 9.94 NE 10.77 24 FL 7.78 RI 9.83 WI 10.67 25 RI 7.75 MD 9.61 SD 10.49 26 LA 7.74 MT 9.56 OH 10.31 27 ID 7.29 NE 9.44 AL 10.24 28 PA 7.19 NH 9.27 ID 10.24 29 SD 7.03 TN 9.26 TX 10.11 30 GA 6.96 MN 9.13 NM 9.95 31 DC 6.94 MA 8.99 GA 9.69 32 MD 6.94 FL 8.98 MT 9.56 33 TX 6.51 OR 8.94 UT 9.46 34 UT 6.43 ME 8.83 KY 9.37 35 MO 6.29 DC 8.40 TN 9.26 36 CO 6.23 GA 7.79 NH 9.09 37 AZ 6.12 SD 7.66 KS 9.01 38 MS 5.88 WV 7.51 MA 8.99 39 NV 5.79 AL 7.34 FL 8.98 40 WV 5.39 MS 7.29 OR 8.94 41 VA 5.36 KS 7.18 AZ 8.85 42 OR 5.19 AZ 6.98 VA 8.39 43 KS 5.13 VA 6.55 CO 8.09 44 NM 5.08 UT 6.23 AR 8.04 45 AR 5.00 NV 6.16 DC 7.41 46 OH 4.84 CO 6.06 NV 7.01 47 MA 4.58 WY 5.96 MS 7.00 48 HI 4.54 ND 5.70 IN 6.26 49 WY 4.13 IN 5.10 WY 5.96 50 IN 3.42 AR 4.80 ND 5.70 51 ND 2.88 KY 2.84 WV 5.57
Note: The rates listed for each state are calculated manual rates and may include loss cost multipliers and assessments. Where states appear to have the same rate for a class, the ranking after rounding to two decimal places, as in Table 1, which show ties as equal rank. If the states have the same calculated manual rate, they are ranked alphabetically.N/A = Not Applicable.Source: Information Technology & Research Section, Central Services Division, Oregon Department of Consumer and Business Services (8/2014)

27
Calendar Year 2014 ■ Oregon Workers’ Compensation Premium Rate Ranking
Appendix 4. Workers’ compensation premium rate ranking by class, cont.Class 7380
Chauffeurs NOCClass 7382
Bus Co.: All OtherClass 7403
Aviation: All Other1 NY 14.48 CA 13.20 CA 12.17 2 CT 14.09 DE 11.33 IL 11.65 3 NJ 13.83 OK 9.88 NJ 8.59 4 CA 13.20 PA 9.83 NY 8.20 5 IL 11.58 NY 9.54 VT 8.18 6 MN 9.58 NJ 9.49 PA 8.08 7 AK 9.34 TX 9.45 MN 7.89 8 NH 8.87 AK 9.25 ME 7.70 9 VT 8.74 OH 9.08 MO 7.70
10 OK 8.51 WY 8.83 NM 7.70 11 RI 8.19 SC 8.70 MD 7.63 12 NM 7.49 ID 7.90 RI 7.43 13 LA 7.33 MD 7.63 CT 7.41 14 OH 7.15 NC 7.62 WI 7.23 15 ME 7.13 CT 7.52 CO 7.19 16 MD 7.09 GA 7.25 TX 7.14 17 WI 6.98 VT 7.24 NH 7.13 18 TX 6.82 LA 7.12 AZ 6.44 19 MO 6.61 RI 6.90 IA 6.38 20 NE 6.59 NH 6.70 HI 6.35 21 IA 6.57 NM 6.61 NC 6.21 22 TN 6.52 MT 6.56 FL 6.06 23 WA 6.48 SD 6.53 SC 6.02 24 SC 6.44 NE 6.42 MT 5.95 25 FL 6.42 AL 6.38 LA 5.48 26 NC 6.36 WI 6.33 MA 5.14 27 HI 6.21 IL 6.05 AK 5.05 28 MA 6.20 HI 5.93 MI 5.01 29 MT 6.08 MO 5.85 UT 4.87 30 AL 6.07 ME 5.80 SD 4.82 31 MI 5.98 FL 5.68 TN 4.71 32 GA 5.86 IA 5.66 NV 4.69 33 KY 5.78 CO 5.63 OK 4.69 34 ID 5.68 DC 5.61 VA 4.52 35 CO 5.57 UT 5.42 DC 4.19 36 SD 5.29 WA 5.38 WA 4.13 37 DC 5.28 MN 5.08 NE 4.08 38 WY 5.10 TN 4.97 MS 3.78 39 KS 5.06 NV 4.83 OH 3.70 40 MS 4.71 KY 4.80 IN 3.66 41 UT 4.45 KS 4.79 GA 3.60 42 OR 4.28 OR 4.79 ID 3.37 43 WV 4.26 VA 4.72 WV 3.33 44 AR 4.00 MS 4.60 KS 3.22 45 VA 3.98 MA 4.44 WY 3.15 46 IN 3.66 WV 4.18 AR 3.13 47 ND 3.16 AZ 4.10 OR 2.98 48 AZ N/A IN 3.55 DE 2.87 49 DE N/A MI 3.19 AL 2.82 50 NV N/A ND 3.16 KY 2.26 51 PA N/A AR 2.78 ND 1.56
Note: The rates listed for each state are calculated manual rates and may include loss cost multipliers and assessments. Where states appear to have the same rate for a class, the ranking after rounding to two decimal places, as in Table 1, which show ties as equal rank. If the states have the same calculated manual rate, they are ranked alphabetically.N/A = Not Applicable.Source: Information Technology & Research Section, Central Services Division, Oregon Department of Consumer and Business Services (8/2014)

28
Oregon Workers’ Compensation Premium Rate Ranking ■ Calendar Year 2014
Appendix 4. Workers’ compensation premium rate ranking by class, cont.Class 7539
Elect. Light/Power CoClass 7600
Phone/Telegraph Emps.Class 7720
Police Officers1 MO 5.74 CT 16.52 DE 6.79 2 AK 5.30 CA 10.36 PA 6.50 3 IA 4.90 NJ 8.79 CA 6.07 4 ME 4.84 NY 8.20 OK 5.67 5 AL 4.56 IL 7.81 MT 5.42 6 NC 4.41 NC 7.23 VT 5.32 7 OK 4.37 LA 6.37 AL 5.07 8 VT 4.35 NM 5.94 SD 5.01 9 NH 3.88 TN 5.92 MO 4.88
10 SC 3.81 VT 5.62 NE 4.84 11 DE 3.79 AK 5.57 SC 4.69 12 TN 3.79 MN 5.49 LA 4.52 13 KS 3.69 PA 5.48 OH 4.44 14 CT 3.68 OH 5.39 IA 4.43 15 NE 3.66 MD 5.05 FL 4.42 16 NM 3.18 OK 4.99 ME 4.40 17 IL 3.12 SC 4.95 AK 4.37 18 CA 3.08 SD 4.95 NM 4.33 19 FL 3.06 RI 4.73 RI 4.33 20 OR 2.88 MO 4.69 ID 4.13 21 RI 2.85 DE 4.62 HI 4.12 22 MT 2.77 NH 4.61 WI 4.02 23 WA 2.76 FL 4.56 AZ 3.87 24 KY 2.70 AL 4.50 CO 3.86 25 LA 2.65 GA 4.35 CT 3.79 26 ID 2.63 AZ 4.19 NH 3.79 27 AZ 2.46 NE 4.18 NV 3.72 28 GA 2.44 MS 4.12 TX 3.68 29 NY 2.44 IA 4.09 IL 3.55 30 SD 2.27 WI 4.08 TN 3.43 31 WI 2.12 MI 4.07 MD 3.40 32 NJ 2.08 HI 4.02 NC 3.36 33 OH 1.94 UT 3.87 OR 3.30 34 VA 1.92 ID 3.86 UT 3.11 35 MS 1.90 MT 3.84 KS 3.08 36 HI 1.89 TX 3.81 NJ 3.06 37 WV 1.88 KY 3.80 WV 3.05 38 MN 1.79 OR 3.68 MI 3.01 39 TX 1.79 ME 3.62 MN 2.95 40 MI 1.77 DC 3.57 GA 2.78 41 DC 1.72 MA 3.51 IN 2.63 42 CO 1.70 KS 3.38 MS 2.53 43 IN 1.68 IN 3.03 WA 2.53 44 PA 1.66 VA 2.94 KY 2.42 45 MD 1.60 CO 2.88 DC 2.30 46 UT 1.44 WV 2.78 WY 2.12 47 MA 1.28 AR 2.43 AR 2.05 48 NV 1.23 NV 2.42 NY 1.94 49 AR 1.21 WA 1.61 MA 1.88 50 WY 1.08 WY 1.35 ND 1.88 51 ND 0.75 ND 0.43 VA 1.85
Note: The rates listed for each state are calculated manual rates and may include loss cost multipliers and assessments. Where states appear to have the same rate for a class, the ranking after rounding to two decimal places, as in Table 1, which show ties as equal rank. If the states have the same calculated manual rate, they are ranked alphabetically.N/A = Not Applicable.Source: Information Technology & Research Section, Central Services Division, Oregon Department of Consumer and Business Services (8/2014)

29
Calendar Year 2014 ■ Oregon Workers’ Compensation Premium Rate Ranking
Appendix 4. Workers’ compensation premium rate ranking by class, cont.Class 8006
Gasoline station Class 8017
Store: Retail NOCClass 8018
Store: Wholesale NOC1 CA 7.72 CA 5.37 CA 9.64 2 NJ 6.06 NJ 4.29 NJ 9.38 3 WY 5.15 DE 4.28 DC 8.32 4 DE 4.81 PA 3.61 NY 8.15 5 OK 4.74 OK 3.45 DE 8.11 6 CT 4.49 LA 3.33 HI 7.54 7 MT 4.44 CT 3.31 PA 6.86 8 NY 4.35 IL 3.25 VT 6.77 9 NH 4.26 NM 3.03 CT 6.47
10 NC 4.05 TX 2.97 AK 5.97 11 WI 3.99 NH 2.78 OK 5.86 12 SC 3.95 AK 2.73 MN 5.78 13 WA 3.88 RI 2.65 IL 5.70 14 VT 3.85 MS 2.46 NH 5.26 15 IA 3.84 NC 2.46 TX 4.89 16 KS 3.83 MN 2.42 LA 4.85 17 TX 3.82 VT 2.40 WA 4.31 18 LA 3.75 ME 2.31 ID 4.25 19 FL 3.73 ID 2.28 MD 4.14 20 IL 3.72 GA 2.27 ME 4.13 21 MO 3.63 AL 2.25 SC 4.10 22 NE 3.60 MO 2.25 OH 3.98 23 OH 3.59 MT 2.25 FL 3.97 24 NM 3.56 SC 2.25 GA 3.83 25 MN 3.44 CO 2.21 MT 3.77 26 ID 3.34 NE 2.19 MO 3.68 27 AK 3.31 NY 2.17 NM 3.66 28 HI 3.26 IA 2.16 AL 3.63 29 TN 3.23 HI 2.13 WY 3.58 30 MS 3.15 FL 2.11 NC 3.49 31 CO 3.13 MD 2.10 IA 3.46 32 PA 3.11 TN 2.04 MA 3.41 33 AL 3.10 KS 2.02 TN 3.40 34 AZ 2.94 OH 2.02 WI 3.39 35 NV 2.82 WI 2.01 KS 3.34 36 UT 2.78 WA 1.95 AZ 3.29 37 GA 2.74 SD 1.77 RI 3.29 38 RI 2.70 AZ 1.76 MI 3.23 39 MD 2.67 UT 1.69 MS 3.17 40 SD 2.56 WY 1.56 SD 3.16 41 ME 2.45 OR 1.52 CO 3.13 42 VA 2.45 KY 1.51 NE 2.91 43 KY 2.05 VA 1.51 OR 2.67 44 DC 1.96 NV 1.49 VA 2.58 45 OR 1.96 IN 1.38 UT 2.56 46 IN 1.92 MI 1.33 KY 2.51 47 MI 1.89 ND 1.26 NV 2.29 48 AR 1.81 WV 1.26 IN 2.25 49 WV 1.80 MA 1.25 AR 2.02 50 MA 1.65 DC 1.21 WV 1.99 51 ND 1.26 AR 1.11 ND 1.66
Note: The rates listed for each state are calculated manual rates and may include loss cost multipliers and assessments. Where states appear to have the same rate for a class, the ranking after rounding to two decimal places, as in Table 1, which show ties as equal rank. If the states have the same calculated manual rate, they are ranked alphabetically.N/A = Not Applicable.Source: Information Technology & Research Section, Central Services Division, Oregon Department of Consumer and Business Services (8/2014)

30
Oregon Workers’ Compensation Premium Rate Ranking ■ Calendar Year 2014
Appendix 4. Workers’ compensation premium rate ranking by class, cont.Class 8033
Store: Meat/Groc RetailClass 8046
Store: Auto PartsClass 8232
Lumberyard: Other Emp1 CA 11.82 NY 6.45 NJ 12.05 2 NJ 6.88 RI 6.37 CA 10.76 3 DE 5.73 CA 6.34 LA 9.84 4 NY 5.50 NJ 5.90 MO 9.69 5 MD 5.07 CT 5.44 OK 9.64 6 OK 5.04 VT 5.09 DE 8.91 7 RI 4.36 PA 4.99 VT 8.90 8 AK 4.31 IL 4.79 NY 8.88 9 MT 4.31 WI 4.61 IL 8.79
10 DC 4.27 LA 4.59 CT 8.68 11 CT 4.16 DE 4.58 AK 7.53 12 NM 4.14 AK 4.55 RI 7.48 13 TX 4.05 ID 4.40 HI 7.41 14 LA 3.97 OK 4.40 TN 7.40 15 WY 3.84 SC 4.28 IA 7.21 16 HI 3.75 NH 4.01 NH 7.06 17 IL 3.75 NC 3.91 PA 6.94 18 WA 3.55 GA 3.74 SC 6.85 19 ID 3.52 ME 3.73 WI 6.84 20 WI 3.28 FL 3.57 MI 6.71 21 SC 3.19 MD 3.49 MT 6.61 22 AL 3.14 AL 3.48 MS 6.42 23 CO 3.09 OH 3.45 KY 6.29 24 PA 3.04 MT 3.33 OH 6.28 25 NH 3.02 HI 3.31 WV 6.28 26 MO 3.01 NM 3.29 ME 6.27 27 AZ 2.97 IA 3.10 GA 6.01 28 OH 2.96 TN 3.03 TX 5.98 29 VT 2.95 MN 2.97 MN 5.90 30 ME 2.94 MO 2.97 ID 5.89 31 NE 2.81 SD 2.89 NC 5.87 32 GA 2.76 CO 2.85 DC 5.61 33 FL 2.75 MS 2.84 AL 5.60 34 NC 2.71 KS 2.80 NE 5.49 35 MS 2.68 TX 2.76 SD 5.30 36 TN 2.56 WY 2.74 FL 5.29 37 OR 2.53 NE 2.73 OR 5.27 38 MI 2.49 AZ 2.60 AZ 5.21 39 SD 2.48 MA 2.57 KS 5.14 40 MN 2.44 UT 2.52 UT 5.14 41 KY 2.42 KY 2.51 MD 4.84 42 UT 2.30 WA 2.47 MA 4.81 43 NV 2.29 NV 2.31 WA 4.72 44 KS 2.22 VA 2.30 NM 4.67 45 MA 2.06 WV 2.22 CO 4.61 46 AR 2.05 IN 2.13 NV 4.44 47 IN 2.01 MI 1.97 VA 4.24 48 IA 1.98 DC 1.91 AR 3.88 49 VA 1.93 OR 1.87 WY 3.82 50 WV 1.66 AR 1.56 IN 3.18 51 ND 1.26 ND 1.07 ND 1.84
Note: The rates listed for each state are calculated manual rates and may include loss cost multipliers and assessments. Where states appear to have the same rate for a class, the ranking after rounding to two decimal places, as in Table 1, which show ties as equal rank. If the states have the same calculated manual rate, they are ranked alphabetically.N/A = Not Applicable.Source: Information Technology & Research Section, Central Services Division, Oregon Department of Consumer and Business Services (8/2014)

31
Calendar Year 2014 ■ Oregon Workers’ Compensation Premium Rate Ranking
Appendix 4. Workers’ compensation premium rate ranking by class, cont.Class 8380
Auto Service/RepairClass 8742
Salespersons-OutsideClass 8810
Clerical Office Employees1 CA 8.23 WY 1.22 CA 0.63 2 NJ 7.70 AK 0.90 AK 0.59 3 AK 7.16 CA 0.79 OK 0.57 4 CT 6.84 DE 0.77 MT 0.55 5 AL 6.37 ME 0.72 ME 0.47 6 NY 6.35 AL 0.71 NM 0.46 7 VT 5.86 MS 0.71 VT 0.43 8 IL 5.47 SC 0.71 SD 0.40 9 NH 5.32 OK 0.69 DE 0.38
10 WA 5.31 MT 0.69 LA 0.35 11 MO 5.17 SD 0.69 MS 0.35 12 MT 5.03 NM 0.68 SC 0.35 13 ME 4.90 HI 0.67 NH 0.33 14 MI 4.52 LA 0.67 WY 0.32 15 WI 4.51 WI 0.67 AL 0.31 16 LA 4.49 MO 0.65 HI 0.31 17 HI 4.46 NJ 0.64 IA 0.31 18 IA 4.37 NY 0.64 RI 0.31 19 MN 4.27 NH 0.63 ID 0.30 20 SC 4.23 CT 0.61 NE 0.30 21 SD 4.22 IA 0.61 NY 0.30 22 ID 3.99 WV 0.61 TN 0.30 23 TN 3.89 PA 0.60 WV 0.30 24 MS 3.88 VT 0.60 NV 0.29 25 MD 3.86 NE 0.59 CT 0.28 26 GA 3.76 TN 0.59 MO 0.28 27 NE 3.74 ID 0.57 NJ 0.27 28 OH 3.68 MN 0.57 PA 0.27 29 FL 3.66 NC 0.53 WI 0.27 30 NC 3.59 FL 0.52 FL 0.26 31 WV 3.47 KY 0.50 KS 0.25 32 OR 3.40 AZ 0.47 AZ 0.24 33 NM 3.35 IL 0.47 MN 0.24 34 AZ 3.25 NV 0.47 NC 0.24 35 DE 3.24 KS 0.45 ND 0.24 36 ND 3.21 RI 0.45 TX 0.24 37 KS 3.20 MI 0.42 OH 0.23 38 DC 3.03 GA 0.40 CO 0.21 39 KY 2.97 UT 0.40 GA 0.21 40 CO 2.93 CO 0.38 IL 0.21 41 PA 2.92 MD 0.38 MI 0.20 42 VA 2.77 TX 0.38 IN 0.19 43 TX 2.76 IN 0.33 KY 0.19 44 WY 2.74 OH 0.32 OR 0.18 45 AR 2.72 WA 0.29 UT 0.18 46 MA 2.66 OR 0.28 MD 0.17 47 NV 2.60 VA 0.28 AR 0.16 48 IN 2.44 AR 0.27 WA 0.16 49 UT 2.31 ND 0.27 DC 0.14 50 OK 2.22 DC 0.16 VA 0.13 51 RI N/A MA 0.16 MA 0.10
Note: The rates listed for each state are calculated manual rates and may include loss cost multipliers and assessments. Where states appear to have the same rate for a class, the ranking after rounding to two decimal places, as in Table 1, which show ties as equal rank. If the states have the same calculated manual rate, they are ranked alphabetically.N/A = Not Applicable.Source: Information Technology & Research Section, Central Services Division, Oregon Department of Consumer and Business Services (8/2014)
32
Oregon Workers’ Compensation Premium Rate Ranking ■ Calendar Year 2014
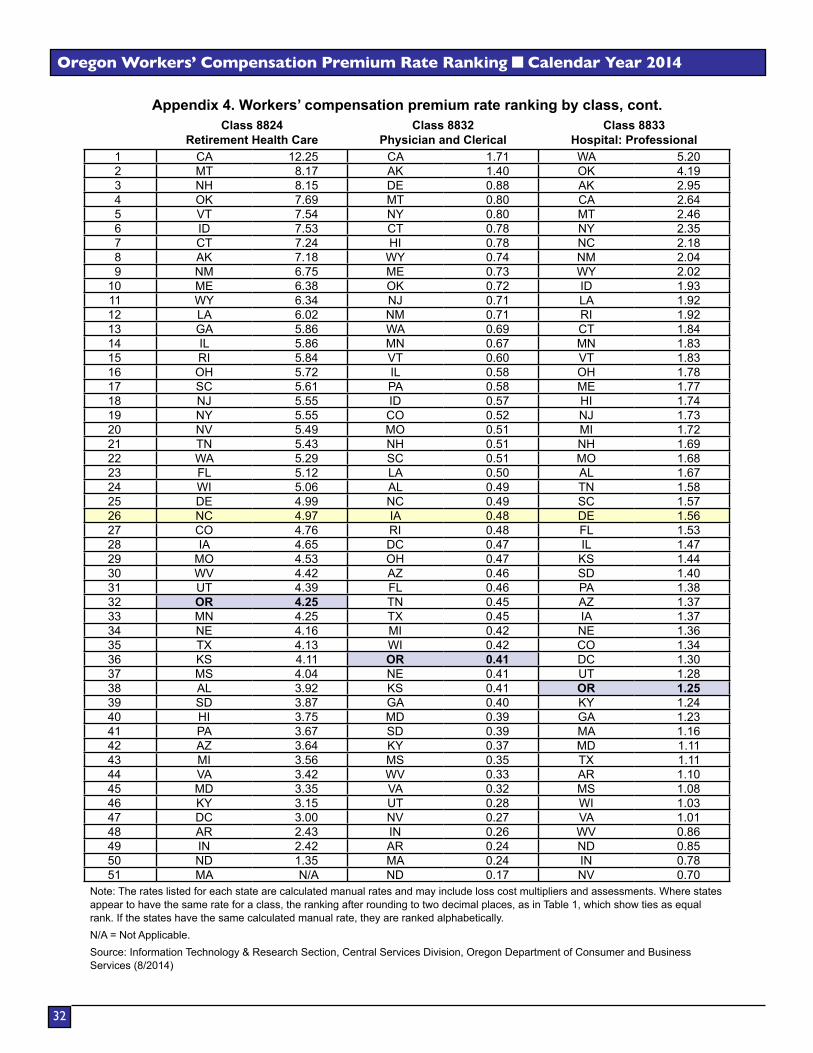
Appendix 4. Workers’ compensation premium rate ranking by class, cont.Class 8824
Retirement Health CareClass 8832
Physician and ClericalClass 8833
Hospital: Professional1 CA 12.25 CA 1.71 WA 5.20 2 MT 8.17 AK 1.40 OK 4.19 3 NH 8.15 DE 0.88 AK 2.95 4 OK 7.69 MT 0.80 CA 2.64 5 VT 7.54 NY 0.80 MT 2.46 6 ID 7.53 CT 0.78 NY 2.35 7 CT 7.24 HI 0.78 NC 2.18 8 AK 7.18 WY 0.74 NM 2.04 9 NM 6.75 ME 0.73 WY 2.02
10 ME 6.38 OK 0.72 ID 1.93 11 WY 6.34 NJ 0.71 LA 1.92 12 LA 6.02 NM 0.71 RI 1.92 13 GA 5.86 WA 0.69 CT 1.84 14 IL 5.86 MN 0.67 MN 1.83 15 RI 5.84 VT 0.60 VT 1.83 16 OH 5.72 IL 0.58 OH 1.78 17 SC 5.61 PA 0.58 ME 1.77 18 NJ 5.55 ID 0.57 HI 1.74 19 NY 5.55 CO 0.52 NJ 1.73 20 NV 5.49 MO 0.51 MI 1.72 21 TN 5.43 NH 0.51 NH 1.69 22 WA 5.29 SC 0.51 MO 1.68 23 FL 5.12 LA 0.50 AL 1.67 24 WI 5.06 AL 0.49 TN 1.58 25 DE 4.99 NC 0.49 SC 1.57 26 NC 4.97 IA 0.48 DE 1.56 27 CO 4.76 RI 0.48 FL 1.53 28 IA 4.65 DC 0.47 IL 1.47 29 MO 4.53 OH 0.47 KS 1.44 30 WV 4.42 AZ 0.46 SD 1.40 31 UT 4.39 FL 0.46 PA 1.38 32 OR 4.25 TN 0.45 AZ 1.37 33 MN 4.25 TX 0.45 IA 1.37 34 NE 4.16 MI 0.42 NE 1.36 35 TX 4.13 WI 0.42 CO 1.34 36 KS 4.11 OR 0.41 DC 1.30 37 MS 4.04 NE 0.41 UT 1.28 38 AL 3.92 KS 0.41 OR 1.25 39 SD 3.87 GA 0.40 KY 1.24 40 HI 3.75 MD 0.39 GA 1.23 41 PA 3.67 SD 0.39 MA 1.16 42 AZ 3.64 KY 0.37 MD 1.11 43 MI 3.56 MS 0.35 TX 1.11 44 VA 3.42 WV 0.33 AR 1.10 45 MD 3.35 VA 0.32 MS 1.08 46 KY 3.15 UT 0.28 WI 1.03 47 DC 3.00 NV 0.27 VA 1.01 48 AR 2.43 IN 0.26 WV 0.86 49 IN 2.42 AR 0.24 ND 0.85 50 ND 1.35 MA 0.24 IN 0.78 51 MA N/A ND 0.17 NV 0.70
Note: The rates listed for each state are calculated manual rates and may include loss cost multipliers and assessments. Where states appear to have the same rate for a class, the ranking after rounding to two decimal places, as in Table 1, which show ties as equal rank. If the states have the same calculated manual rate, they are ranked alphabetically.N/A = Not Applicable.Source: Information Technology & Research Section, Central Services Division, Oregon Department of Consumer and Business Services (8/2014)

33
Calendar Year 2014 ■ Oregon Workers’ Compensation Premium Rate Ranking
Appendix 4. Workers’ compensation premium rate ranking by class, cont.Class 8835
Home/Public HealthcareClass 8842
Mental Health HomesClass 8868
College: Profess/Clerical1 CA 9.29 CA 8.61 WY 3.36 2 MT 7.26 OK 6.33 NJ 1.85 3 NH 6.48 CT 5.68 CA 1.62 4 PA 5.93 NJ 5.55 AK 1.23 5 OK 5.83 WY 5.34 CT 0.99 6 NY 5.81 MT 5.33 PA 0.89 7 DE 5.50 WA 5.29 NY 0.86 8 ME 5.18 AK 5.04 MT 0.84 9 WA 5.09 CO 4.87 VT 0.84
10 ID 4.99 OH 4.54 OK 0.82 11 CT 4.63 NM 4.43 HI 0.80 12 OH 4.42 DE 4.30 TX 0.79 13 HI 4.33 LA 4.16 CO 0.78 14 AK 4.20 KY 4.12 DE 0.75 15 RI 4.09 NH 4.01 WA 0.73 16 SC 3.98 WI 3.90 MN 0.69 17 VT 3.93 ID 3.79 NM 0.68 18 IA 3.89 TN 3.70 SC 0.68 19 OR 3.85 IL 3.56 ID 0.67 20 LA 3.82 KS 3.53 MA 0.66 21 TN 3.70 ME 3.50 NH 0.66 22 MN 3.62 AL 3.34 LA 0.65 23 MI 3.61 PA 3.33 ME 0.64 24 GA 3.59 VT 3.31 NE 0.63 25 MO 3.52 HI 3.24 MO 0.61 26 NM 3.52 AZ 3.22 NC 0.61 27 NC 3.48 SC 3.20 FL 0.60 28 WI 3.48 SD 3.00 AL 0.58 29 AL 3.38 MN 2.99 SD 0.58 30 SD 3.21 NY 2.94 IA 0.56 31 CO 3.15 IA 2.91 AZ 0.55 32 WV 3.08 IN 2.86 IL 0.55 33 NJ 3.02 MD 2.80 OH 0.54 34 VA 2.97 NE 2.76 TN 0.52 35 NE 2.85 NC 2.75 WI 0.52 36 FL 2.74 MS 2.74 KS 0.51 37 IL 2.68 WV 2.72 MS 0.51 38 KS 2.67 GA 2.67 MI 0.50 39 IN 2.53 OR 2.65 GA 0.49 40 KY 2.50 RI 2.63 RI 0.49 41 AZ 2.31 TX 2.49 NV 0.47 42 MD 2.23 FL 1.99 OR 0.45 43 MS 2.21 DC 1.93 AR 0.38 44 MA 2.20 UT 1.90 ND 0.37 45 UT 2.16 MI 1.72 MD 0.36 46 AR 1.83 AR 1.53 WV 0.36 47 DC 1.66 ND 1.19 IN 0.33 48 NV 1.46 MA N/A UT 0.32 49 TX 1.11 MO N/A VA 0.32 50 ND 0.85 NV N/A DC 0.31 51 WY 0.74 VA N/A KY 0.27
Note: The rates listed for each state are calculated manual rates and may include loss cost multipliers and assessments. Where states appear to have the same rate for a class, the ranking after rounding to two decimal places, as in Table 1, which show ties as equal rank. If the states have the same calculated manual rate, they are ranked alphabetically.N/A = Not Applicable.Source: Information Technology & Research Section, Central Services Division, Oregon Department of Consumer and Business Services (8/2014)

34
Oregon Workers’ Compensation Premium Rate Ranking ■ Calendar Year 2014
Appendix 4. Workers’ compensation premium rate ranking by class, cont.Class 9014
Bldgs-Oper by ContractClass 9015
Bldgs-Oper by OwnerClass 9052
Hotel: Other Emp1 CA 15.54 CA 8.95 CA 11.66 2 MT 8.07 NJ 8.57 WA 6.24 3 WA 7.92 OK 8.27 NY 5.87 4 VT 7.69 CT 7.24 AK 5.86 5 NJ 7.24 AK 7.07 CT 5.54 6 NY 7.19 SD 6.21 NJ 5.40 7 DE 6.14 DE 6.14 NH 5.30 8 AK 6.10 OH 6.10 OK 5.29 9 MN 6.08 MN 6.08 DE 4.80
10 NH 6.02 RI 5.77 VT 4.72 11 OK 5.65 AL 5.66 ID 4.55 12 PA 5.58 PA 5.58 PA 4.51 13 IL 5.40 NE 5.49 WY 4.37 14 ID 5.23 NY 5.40 MT 4.36 15 CT 5.22 MO 5.17 RI 4.35 16 FL 5.21 FL 5.14 IL 4.14 17 WI 5.13 MT 5.13 OH 3.85 18 WY 5.10 HI 5.10 FL 3.83 19 ME 5.07 WI 5.06 IA 3.83 20 IA 5.04 NH 5.01 TX 3.58 21 MI 4.98 KS 4.98 AL 3.53 22 RI 4.98 MI 4.98 MN 3.46 23 NM 4.94 SC 4.83 ME 3.41 24 HI 4.87 LA 4.81 CO 3.39 25 OH 4.83 VT 4.78 LA 3.37 26 GA 4.65 IA 4.76 WI 3.37 27 AL 4.56 WA 4.75 SD 3.32 28 LA 4.50 UT 4.68 GA 3.25 29 AZ 4.40 CO 4.65 AZ 3.20 30 MO 4.39 ID 4.54 MO 3.18 31 TX 4.38 AZ 4.49 KS 3.17 32 NE 3.97 IL 4.36 MS 2.98 33 OR 3.96 MS 4.27 NM 2.98 34 SC 3.91 TX 4.18 SC 2.88 35 CO 3.87 ME 4.17 HI 2.8536 SD 3.82 KY 4.14 OR 2.85 37 UT 3.80 NC 4.14 MI 2.81 38 NC 3.77 NM 4.06 MD 2.73 39 TN 3.73 GA 3.88 NC 2.64 40 MS 3.63 WY 3.84 TN 2.56 41 KS 3.53 MD 3.78 NE 2.42 42 MD 3.46 TN 3.71 DC 2.25 43 NV 3.23 OR 3.60 NV 2.23 44 DC 2.69 IN 3.36 IN 2.22 45 MA 2.69 NV 3.26 KY 2.22 46 WV 2.64 MA 2.95 WV 2.19 47 KY 2.60 WV 2.94 UT 2.13 48 ND 2.52 VA 2.77 ND 1.85 49 IN 2.48 DC 2.58 VA 1.85 50 VA 2.39 ND 2.52 MA 1.62 51 AR 1.89 AR 2.35 AR 1.33
Note: The rates listed for each state are calculated manual rates and may include loss cost multipliers and assessments. Where states appear to have the same rate for a class, the ranking after rounding to two decimal places, as in Table 1, which show ties as equal rank. If the states have the same calculated manual rate, they are ranked alphabetically.N/A = Not Applicable.Source: Information Technology & Research Section, Central Services Division, Oregon Department of Consumer and Business Services (8/2014)

35
Calendar Year 2014 ■ Oregon Workers’ Compensation Premium Rate Ranking
Appendix 4. Workers’ compensation premium rate ranking by class, cont.Class 9058
Hotel: Restaurant Emp.Class 9082
Restaurant NOCClass 9083
Restaurant: Fast Food1 CA 5.75 CA 5.75 CA 5.75 2 DE 4.63 AK 4.71 NJ 3.95 3 OK 4.58 NJ 3.95 OK 3.56 4 AK 4.31 ID 3.49 DE 3.54 5 PA 4.12 OK 3.35 NY 3.31 6 NH 4.07 NY 3.02 AK 3.15 7 NJ 3.95 DE 2.94 CT 2.87 8 CT 3.62 RI 2.72 RI 2.82 9 MN 3.46 CT 2.70 FL 2.74
10 NE 3.34 IL 2.58 NH 2.65 11 NY 3.11 VT 2.58 MT 2.64 12 VT 2.85 FL 2.55 VT 2.59 13 LA 2.82 NH 2.55 LA 2.51 14 MT 2.80 PA 2.49 WY 2.47 15 OH 2.71 LA 2.47 GA 2.47 16 SC 2.69 WY 2.47 SC 2.42 17 MO 2.65 AL 2.38 IL 2.40 18 WA 2.65 SC 2.34 PA 2.35 19 RI 2.64 SD 2.32 WA 2.33 20 NM 2.58 WA 2.30 ID 2.28 21 FL 2.54 MO 2.27 MN 2.28 22 IL 2.49 MS 2.27 AL 2.18 23 IA 2.47 WI 2.23 HI 2.13 24 ID 2.47 MT 2.18 OH 2.11 25 WY 2.47 HI 2.17 MO 2.05 26 HI 2.44 GA 2.15 NM 2.02 27 ME 2.31 ME 2.15 CO 2.01 28 TX 2.20 NM 2.15 NE 2.01 29 SD 2.13 MN 2.14 ME 1.98 30 NC 2.11 NE 2.14 TX 1.98 31 WI 2.11 TN 2.00 IA 1.95 32 KS 2.09 TX 1.98 MD 1.95 33 AL 2.06 IA 1.95 KS 1.93 34 TN 2.03 CO 1.85 WI 1.92 35 WV 2.02 NC 1.85 NC 1.85 36 CO 1.95 AZ 1.83 SD 1.85 37 MS 1.87 OH 1.80 NV 1.78 38 GA 1.82 MI 1.71 TN 1.77 39 MI 1.71 MD 1.68 MI 1.71 40 AZ 1.69 KS 1.66 AZ 1.67 41 KY 1.67 OR 1.59 KY 1.60 42 MD 1.66 IN 1.56 OR 1.59 43 MA 1.62 KY 1.51 DC 1.58 44 VA 1.60 VA 1.50 WV 1.52 45 OR 1.59 DC 1.37 MS 1.50 46 AR 1.56 ND 1.32 IN 1.39 47 NV 1.54 UT 1.31 UT 1.38 48 DC 1.48 WV 1.20 VA 1.34 49 UT 1.35 MA 1.16 ND 1.32 50 IN 1.33 AR 1.10 MA 1.16 51 ND 1.32 NV 1.06 AR 0.94
Note: The rates listed for each state are calculated manual rates and may include loss cost multipliers and assessments. Where states appear to have the same rate for a class, the ranking after rounding to two decimal places, as in Table 1, which show ties as equal rank. If the states have the same calculated manual rate, they are ranked alphabetically.N/A = Not Applicable.Source: Information Technology & Research Section, Central Services Division, Oregon Department of Consumer and Business Services (8/2014)
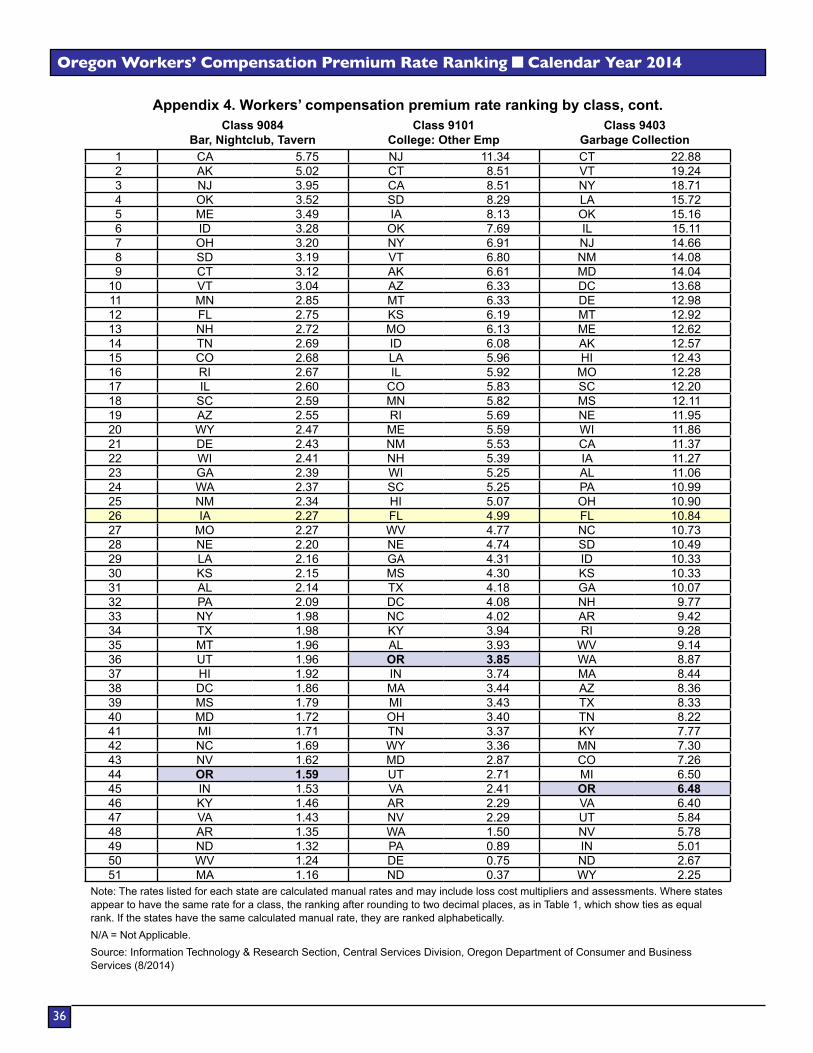
36
Oregon Workers’ Compensation Premium Rate Ranking ■ Calendar Year 2014
Appendix 4. Workers’ compensation premium rate ranking by class, cont.Class 9084
Bar, Nightclub, TavernClass 9101
College: Other EmpClass 9403
Garbage Collection1 CA 5.75 NJ 11.34 CT 22.88 2 AK 5.02 CT 8.51 VT 19.24 3 NJ 3.95 CA 8.51 NY 18.71 4 OK 3.52 SD 8.29 LA 15.72 5 ME 3.49 IA 8.13 OK 15.16 6 ID 3.28 OK 7.69 IL 15.11 7 OH 3.20 NY 6.91 NJ 14.66 8 SD 3.19 VT 6.80 NM 14.08 9 CT 3.12 AK 6.61 MD 14.04
10 VT 3.04 AZ 6.33 DC 13.68 11 MN 2.85 MT 6.33 DE 12.98 12 FL 2.75 KS 6.19 MT 12.92 13 NH 2.72 MO 6.13 ME 12.62 14 TN 2.69 ID 6.08 AK 12.57 15 CO 2.68 LA 5.96 HI 12.43 16 RI 2.67 IL 5.92 MO 12.28 17 IL 2.60 CO 5.83 SC 12.20 18 SC 2.59 MN 5.82 MS 12.11 19 AZ 2.55 RI 5.69 NE 11.95 20 WY 2.47 ME 5.59 WI 11.86 21 DE 2.43 NM 5.53 CA 11.37 22 WI 2.41 NH 5.39 IA 11.27 23 GA 2.39 WI 5.25 AL 11.06 24 WA 2.37 SC 5.25 PA 10.99 25 NM 2.34 HI 5.07 OH 10.90 26 IA 2.27 FL 4.99 FL 10.84 27 MO 2.27 WV 4.77 NC 10.73 28 NE 2.20 NE 4.74 SD 10.49 29 LA 2.16 GA 4.31 ID 10.33 30 KS 2.15 MS 4.30 KS 10.33 31 AL 2.14 TX 4.18 GA 10.07 32 PA 2.09 DC 4.08 NH 9.77 33 NY 1.98 NC 4.02 AR 9.42 34 TX 1.98 KY 3.94 RI 9.28 35 MT 1.96 AL 3.93 WV 9.14 36 UT 1.96 OR 3.85 WA 8.87 37 HI 1.92 IN 3.74 MA 8.44 38 DC 1.86 MA 3.44 AZ 8.36 39 MS 1.79 MI 3.43 TX 8.33 40 MD 1.72 OH 3.40 TN 8.22 41 MI 1.71 TN 3.37 KY 7.77 42 NC 1.69 WY 3.36 MN 7.30 43 NV 1.62 MD 2.87 CO 7.26 44 OR 1.59 UT 2.71 MI 6.50 45 IN 1.53 VA 2.41 OR 6.48 46 KY 1.46 AR 2.29 VA 6.40 47 VA 1.43 NV 2.29 UT 5.84 48 AR 1.35 WA 1.50 NV 5.78 49 ND 1.32 PA 0.89 IN 5.01 50 WV 1.24 DE 0.75 ND 2.67 51 MA 1.16 ND 0.37 WY 2.25
Note: The rates listed for each state are calculated manual rates and may include loss cost multipliers and assessments. Where states appear to have the same rate for a class, the ranking after rounding to two decimal places, as in Table 1, which show ties as equal rank. If the states have the same calculated manual rate, they are ranked alphabetically.N/A = Not Applicable.Source: Information Technology & Research Section, Central Services Division, Oregon Department of Consumer and Business Services (8/2014)
Central Services Division Information Technology and Research Section 350 Winter St. NE, Room 300 P.O. Box 14480 Salem, Oregon 97309-0405 503-378-8254
440-2083 (2/15/COM)